DISCLOSURE PRACTICES 2020DIVERSITY - 2020 REPORT
←
→
Page content transcription
If your browser does not render page correctly, please read the page content below

2020   Diversity
       Disclosure
       Practices
       Diversity and leadership at Canadian public companies

       By Andrew MacDougall, John Valley and Jennifer Jeffrey
DIVERSITY DISCLOSURE PRACTICES                                                                            Osler, Hoskin & Harcourt llp

Table of contents
Introduction                                                                                          3

Developments in diversity: A wider focus                                                              6

Our methodology                                                                                     14

2019 full-year results                                                                              19

Mid-year results for 2020: Women on boards                                                          23

Mid-year results for 2020: Women in executive officer positions                                     33

Diversity beyond gender: 2020 results for CBCA corporations                                         43

Who has achieved gender parity and how to increase diversity                                        49

Going above and beyond: Best company disclosure                                                     64

The 2020 Diversity Disclosure Practices report provides general information only and does not
constitute legal or other professional advice. Specific advice should be sought in connection with your
circumstances. For more information, please contact Osler’s Corporate Governance group.

                                                                                                                                    2
DIVERSITY DISCLOSURE PRACTICES                                                                                     Osler, Hoskin & Harcourt llp

Introduction
The diversity discussion blossomed this year, with continued, slow growth in the advancement
of women accompanied by an expanded focus into other facets of diversity. This year new
disclosure requirements under the Canada Business Corporations Act (CBCA) broadened the
range of corporations required to provide disclosure regarding women in leadership positions
and added new requirements for disclosure regarding visible minorities, Aboriginal peoples and
persons with disabilities.
Our sixth annual comprehensive report on diversity disclosure practices now covers disclosure
by TSX-listed companies and CBCA corporations subject to disclosure requirements. We
continue to provide detailed disclosure on TSX-listed companies to provide year-over-year
comparisons. However, we now include new chapters summarizing the results of our review of
CBCA company disclosure. We also highlight disclosed best practices to improve diversity and
inclusion and samples of excellence in disclosure.
Women now hold over 21.5% of board seats among TSX-listed companies disclosing the number of women
on their boards, an increase of almost 3% compared to 2019. The rate at which women are being appointed to
fill newly created or vacated board seats declined slightly to 35%, compared to 36.4% in 2019. As in past years,
Canada’s larger companies continue to lead the way as women hold 31.5% of board positions among the S&P/
TSX 60 companies and 28.3% of board positions among the 221 companies included in the S&P/TSX Composite
Index. All-male boards continue to wither away, representing only 18.5% of the TSX-listed companies.
We anticipate that certain of our 2020 full-year results, including the percentage of board seats held by
women, will be approximately 1% lower than our 2020 mid-year results as a significant number of issuers
which historically have had below average diversity results took advantage of permitted extensions of normal
deadlines to file their disclosure after our July 31, 2020 cut-off for our mid-year results.

                                                                                                                                             3
DIVERSITY DISCLOSURE PRACTICES                                                                                       Osler, Hoskin & Harcourt llp

The number of TSX-listed companies with written board diversity policies increased to 64.7% and approximately
97% of the time those policies included a specific focus on women on the board. This year we noticed a significant
increase in companies disclosing that their board policy also considers other diversity characteristics – the most
common of which was ethnicity/race, which was identified approximately 57.5% of the time.
However, we continue to see no progress being made at the executive officer level. The proportion of women
executive officers has remained largely unchanged since 2015, and under 10% of TSX-listed companies have
targets for women executive officers.
Our review of diversity disclosure by CBCA companies under the new CBCA requirements shows results
on the representation of women that are comparable to those reported for TSX-listed issuers under the new
CBCA requirements. However, there is a marked absence of directors from other diversity groups. Only 5.5%
of the 217 disclosing CBCA company directors are visible minorities. And among the 2,023 board positions of
the 270 CBCA companies that provided full or partial disclosure on their practices before July 31, 2020, there
were only 7 positions held by Aboriginal peoples and only 6 positions held by persons with disabilities.

Highlights

                                                              At S&P/TSX 60 companies, women
                                                              hold 31.5% of all board seats

    Women now hold 21.5% of
    all board seats among all
    TSX-listed companies disclosing                           At S&P/TSX Composite Index
    the number of women directors                             companies, women hold 28.3%
    on their boards.                                          of all board seats

                                                                                                                                               4
DIVERSITY DISCLOSURE PRACTICES                                                                           Osler, Hoskin & Harcourt llp

                                                                                   Number of CBCA public
                                                                                   company board positions held by
                                                             At 26 companies       Aboriginal peoples is 7
                                                             (4.4% of TSX-listed
                                                             companies) the
                                                             CEO is a woman

    64.7% of TSX-listed companies
    have written board diversity policies         Targets for women directors
                                                  have been adopted by 58.5% of
                                                  S&P/TSX 60 companies, but by
                                                  only 28.8% of TSX-listed         The percentage of CBCA public
                                                  companies                        company board seats held
                                                                                   by visible minorities is 5.5%

                            47.6% of TSX-listed
                            companies have                                         Few CBCA public companies
                            more than 1                                            have director targets beyond
                            women director                                         targets for women
                                                                                   Aboriginal peoples                      1
                                                  Number of CBCA                   Members of visible minorities           1
    5% of the time,                               public company                   Persons with disabilities               0
    the chair of a                                board positions held             Designated groups (including
    TSX-listed company                            by persons with                  women) collectively                     2
    is a woman                                    disabilities is 6

                                                                                                                                   5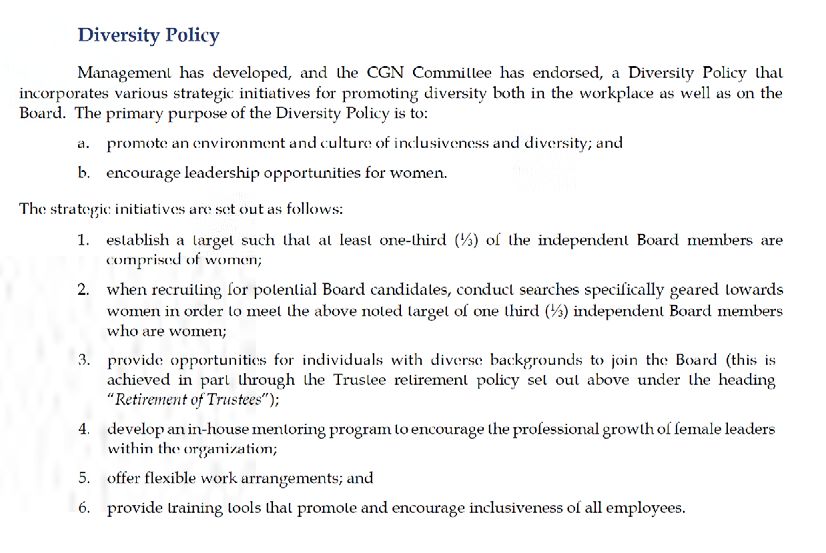
1
DIVERSITY DISCLOSURE PRACTICES                                                                                Osler, Hoskin & Harcourt llp

Developments in diversity:
A wider focus
Among the many profound changes ushered in by the COVID-19 pandemic has been a
renewed focus on social issues. Most of the world entered various stages of lockdown, dividing
humanity from one another to slow the inexorable advance of an especially virulent disease.
Yet the challenges of isolation and, on the flipside, the sense of purpose that enabled us to
take responsible collective action to protect the lives of those most vulnerable, also created an
opportunity for change. Ignited by public outrage over the killing of George Floyd by police, and
fueled by many examples of the mistreatment of minorities, there has been a strong drive to
address the impediments, both express and hidden, to the advancement of underrepresented
communities to leadership positions in organizations.

Advancement of women
      Canada
In January 2020, Statistics Canada released data on gender composition of corporate boards of all types in
Canada, including public companies, government business entities and private companies, based on data
from 2016 and 2017. For 2017, the data included 10,108 corporations that are required to file returns under
the Corporations Returns Act and the gender of directors was estimated using other Statistics Canada data
and probabilistic imputation. The report noted that overall 18.1% of board positions were held by women
in 2017, a slight increase from 17.8% in 2016. The report noted that government business entities had the
highest levels of representation of women, with women directors holding 35.2% of the board positions of
such entities in 2017. For public companies, 21.3% of the board seats were held by women, while for private
companies women held only 17.7%.

                                                                                                                                        6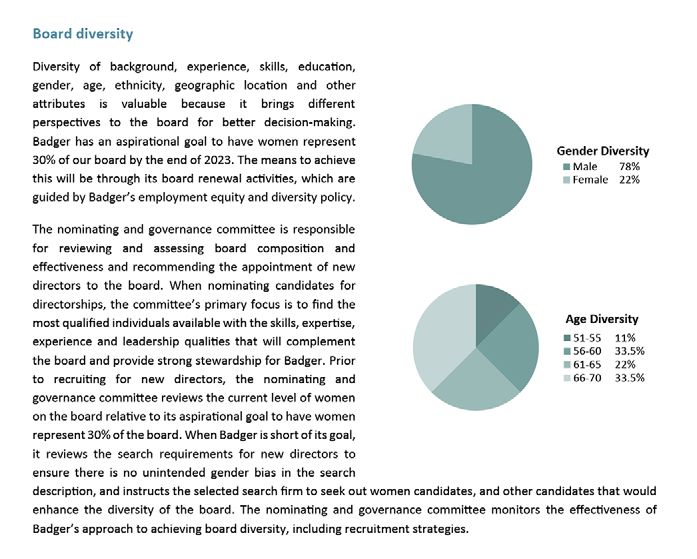
DIVERSITY DISCLOSURE PRACTICES                                                                                                 Osler, Hoskin & Harcourt llp

In March 2020, Catalyst Canada in collaboration with the 30% Club Canada released its first progress report
of Women in Leadership at S& P/ TSX Companies (2020). The study reviews the 234 S&P/TSX Composite Index
companies as at December 31, 2019, noting that women hold 27.6% of the board seats of such companies, but
comprise only 17.9% of the executive teams.
A few companies have disclosed ways they tie executive compensation to the achievement of diversity and
inclusion goals. For example,
• Bank of Nova Scotia – Short-term incentive performance for the CEO takes into consideration
  improvements in the depth and diversity of the bank’s leadership pool, particularly with regard to gender
  diversity, where the bank’s vice president and above leadership group is now comprised of 35% women
  globally (39% in Canada).
• BCE Inc. – The percentage of women in senior management is included as a key performance indicator
  and is linked to variable pay for the company’s executives.
• Stantec Inc. – The company included an inclusion and diversity measurement in its corporate scorecard
  used to assess short-term incentive compensation for its executive leadership team.
                                                                                                                    Canadian institutional investors
• The Toronto-Dominion Bank – The review of the CEO’s individual performance for assessing short-term
                                                                                                                    are starting to report on how they
  incentive compensation includes an assessment relative to diversity and inclusion representation goals
  aligned to the bank’s diversity and inclusion pillars.                                                            have exercised their voting rights
                                                                                                                    and engaged directly with
In our 2019 report, we highlighted the fact that institutional investors are updating their proxy voting
guidelines and exercising their voting rights to increase the pressure on public company boards to take action to   corporations in which they invest
increase the number of women in leadership roles. Some Canadian institutional investors are providing details       to improve gender diversity on the
on the impact of the proxy voting policies and engagement efforts to increase board diversity.                      boards of their investments.
• British Columbia Investment Management Corp. (BCI) – In its 2019 ESG Annual Report, the company
  disclosed its engagement efforts with Badger Daylighting Ltd. in collaboration with members of the 30%
  Club Canada, that resulted in an increase in the number of women directors on the board and the adoption
  of an aspirational target of 30% women directors by 2023.
• Canada Pension Plan Investment Board (CPPIB) – In its 2019 Report on Sustainable Investing, CPPIB
  stated that, as a result of its policy of voting against the chair of the nominating committee of its investee
  public companies if the board has no women directors (and there were no extenuating circumstances),
  it considered whether to vote against 687 directors at companies with no female directors in 2019 and
  ultimately voted against the election of 626 (90%) of them. In its 2020 Responsible Investing Report, CPPIB
  stated that it considered voting against the entire committee responsible for director nominations if the
  companies that it voted against in 2019 made insufficient progress on gender diversity, resulting in against
  votes at 10 Canadian public companies and 323 public companies globally.

                                                                                                                                                         7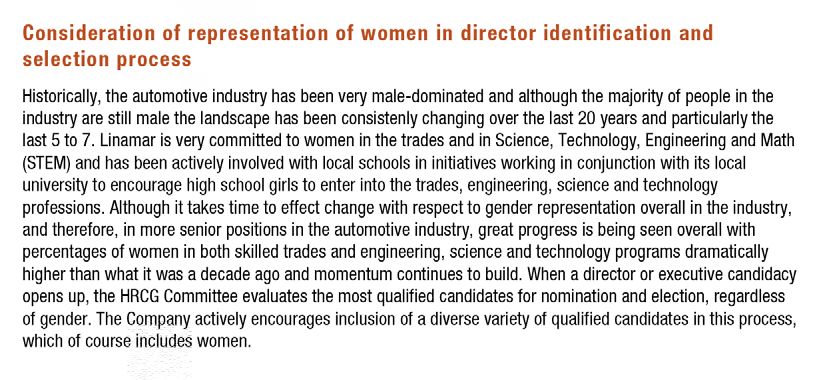
DIVERSITY DISCLOSURE PRACTICES                                                                                  Osler, Hoskin & Harcourt llp

• Ontario Teachers’ Pension Plan (OTTP) Board – In its 2019 Responsible Investing Report, the OTPP Board
  stated that it voted against the chair of the nomination committee at a technology company for having
  only one woman on the board in 2019. Further, it disclosed it would extend globally its policy to consider
  not supporting the chair of the governance and/or nomination committee or other members of the
  committee in situations where it concludes there is insufficient representation of women directors and the
  board does not adequately describe their approach to gender diversity.
• RBC Global Asset Management (RAM GAM) – In in its 2020 Corporate Governance and Responsible
  Investment semi-annual report, RBC GAM stated that it voted against the election of 18.6% of directors
  nominated to the board at U.S. companies. In 73% of those cases, the vote against was at least partly due
  to the board failing to meet its minimum 25% board gender diversity threshold.
In July 2020, the Ontario Capital Markets Modernization Taskforce (“CMM Taskforce”) released a consultation
report with 47 policy proposals, including a proposal to require TSX-listed companies to set targets and
annually provide data in relation to the representation of women, Black people, Indigenous people, and people
of colour, on boards and in executive officer positions. The CMM Taskforce also sought comment on the
appropriate target levels, including a suggestion of 40% women and 20% Black people, Indigenous people, and
people of colour. The CMM Taskforce also recommended that diversity – including racial diversity – be
similarly represented at the board and executive level of the Ontario Securities Commission.

      Internationally
The proportion of women directors continued to advance worldwide as several significant milestones were
achieved in other jurisdictions.
• In the U.K., women represent 33% of the FTSE 100 boards.
• In Australia, 31.3% of the director positions of the ASX 200 companies are held by women.
• In the U.S., Spencer Stuart’s 2019 Board Index reported that women represent 26% of S&P 500 company
  boards, with women filling almost 46% of the new seats available in the prior year. According to Equilar,
  the percentage of women on the boards of Russell 3000 companies increased to 22% by Q1 2020. In
  December 2019, Catalyst reported that at the Catalyst CEO Champions for Change companies, women held
  30.7% of board seats by 2018 (compared to 22.6% in 2013) and 25.1% of their executives were women.

                                                                                                                                          8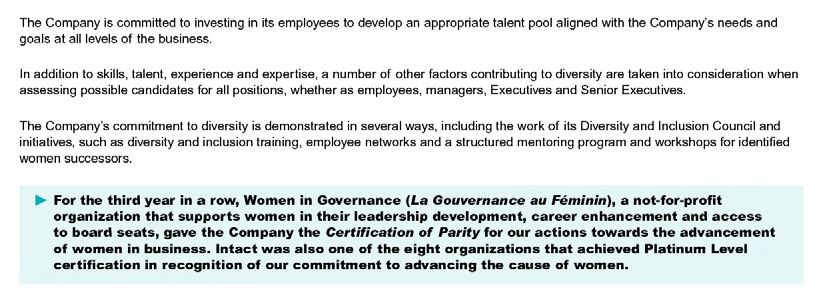
DIVERSITY DISCLOSURE PRACTICES                                                                                                      Osler, Hoskin & Harcourt llp

Under the State of California’s gender parity law for public company boards, companies were required to have at
least one women director by December 31, 2019. By 2021, boards with five directors must have two women, and
if the board has six or more directors, three of them must be women. At least two cases challenging the law have
been filed, although one was dismissed in April 2020.1 They have progressed slowly as a result of the pandemic
and compliance has fallen short. According to a March 24, 2020 report from California Secretary of State Alex
Padilla, only just over half (330) of the 625 companies subject to the law had filed their reports and of those that
had filed, 48 reported not being in compliance with the requirement to have at least one woman director.
New Jersey, Massachusetts, Hawaii, Michigan and Washington are considering legislation to introduce quotas
similar to the California model.
Other U.S. states have chosen instead to focus on a disclosure model.
• The State of New York requires domestic and foreign corporations authorized to do business in New York
  to report to the Department of State in the corporation’s filing statement the number of woman directors
  sitting on their board and the total number of directors.
• In Maryland, effective October 2019, tax-exempt domestic nonstock corporations with operating budgets
  over $5 million and domestic stock corporations with sales over $5 million with corporate headquarters                 Under the State of California’s
  in Maryland are required to report the number of female board members and the total number of board
  members, as part of their annual personal property tax filing in Maryland.
                                                                                                                         gender parity law for public
                                                                                                                         company boards, companies
• In Illinois, by January 2021, many public companies that are organized or have their principal executive
                                                                                                                         were required to have at least
  offices in Illinois will be required to provide disclosure related to a range of matters, including the
  qualifications, skills and experience the corporation considers in assessing board composition and                     one women director by
  executive officers. This disclosure will be included in the corporation’s annual report filed with state               December 31, 2019.
  regulators. The law also requires disclosure of the self-identified gender of each director, whether they
  self-identify as a minority person and a description of the policies and practices of the corporation for
  promoting diversity, equity and inclusion among directors and executive officers.
Two bills on diversity introduced in the U.S. Congress last year are still in progress. The first, Improving
Corporate Governance Through Diversity Act of 2019, would require public issuers to disclose to shareholders
annually, based on voluntary, self-identified data, the gender, race, ethnicity and veteran status of their directors,
director nominees and senior executive officers and whether the issuer has a policy, plan or strategy to promote
racial, ethnic and gender diversity. The second, Diversity in Corporate Leadership Act of 2019, would require the
Securities and Exchange Commission to establish rules requiring each issuer to disclose to their shareholders
the gender, racial and ethnic composition of the issuer’s board of directors and director nominees.

1 Meland v. Padilla, No. 2:19-cv-02288-JAM-AC (E.D. Ca. Apr. 20, 2020), although it is under appeal.

                                                                                                                                                              9
DIVERSITY DISCLOSURE PRACTICES                                                                                                    Osler, Hoskin & Harcourt llp

Some institutional investors are providing statistics in their annual stewardship reports regarding the actions
they have taken in furtherance of gender diversity. For example,
• State Street in its Stewardship Report 2018-19 stated that since March 2017, it identified 910 companies in
  the U.S. market that do not have a female board member. Although almost half of these companies added
  a female director, by 2019, for the remainder State Street voted against at least one director at 421 of these
  companies from March 2018 through February 2019.
• BlackRock also released its 2019 Investment Stewardship Annual Report, which states that during the 2019
  proxy season, the investor voted against 52 directors at Russell 1000 companies that had fewer than two
  women or no other diverse directors on their boards.
In October 2019, the New York City Comptroller announced the launch of Boardroom Accountability Project
3.0. An earlier initiative, National Boardroom Accountability Project 2.0, began in September 2017 and asked
151 U.S. companies to disclose their director skills matrix, including information regarding each director’s
gender, race and ethnicity as well as details regarding each director’s skills, experience and attributes. Boardroom   In January 2020, Goldman Sachs’
Accountability Project 3.0 plans to target 56 companies, requesting that each adopt a policy requiring
the consideration of both women and people of colour for every open board seat and for CEO appointments –
                                                                                                                       CEO announced that effective
similar to the “Rooney Rule” in the NFL, which requires teams to interview minority candidates for certain             July 1, 2020 in the U.S. and
positions. Shareholder proposals were subsequently submitted to 17 companies that the Comptroller’s Office             Europe, Goldman will take
had identified as lacking racial diversity in senior leadership roles, most of which were withdrawn prior to           companies public only if there is
voting when the company agreed to adopt a Rooney Rule approach to the selection of such candidates.
                                                                                                                       “at least one diverse board
In January 2020, Goldman Sachs’ CEO announced that effective July 1, 2020 in the U.S. and Europe,                      candidate, with a focus on
Goldman will take companies public only if there is “at least one diverse board candidate, with a focus on
                                                                                                                       women.” And starting in 2021, it
women.” Starting in 2021, it will raise this target to two diverse candidates.
                                                                                                                       will raise this target to two
The Workplace Gender Equality Agency of the Australian Government recently issued Gender Strategy
                                                                                                                       diverse candidates.
Toolkit: A direction for achieving gender equality in your organization. The toolkit provides guidance for those
organizations aiming to adopt best practices or become an Employer of Choice for Gender Equality. It aims
to assist organizations intending to make progress on gender equality by helping them assess their progress
and understand the steps needed to take to enhance their gender strategy and generate momentum and
sustainability. The toolkit also highlights leading best practices.

                                                                                                                                                           10
DIVERSITY DISCLOSURE PRACTICES Osler, Hoskin & Harcourt llp
Other diversity characteristics
This year is witness to an accelerated focus on the need to address diversity beyond gender. In past years, we
reported that the conversation regarding diversity was evolving beyond a focus solely on gender to include
other diversity characteristics. However, the conversation has changed dramatically in light of the new
diversity disclosure rules set out in the Canada Business Corporations Act (CBCA), and especially as a result
of worldwide public reaction to the death of George Floyd and the outpouring of support for the Black Lives
Matter movement.
Canada
In June 2020, the Canadian Council of Business Leaders Against Anti-Black Systemic Racism was established
to promote increased Black representation in corporate leadership positions. In July it launched the
BlackNorth Initiative with support from the Canadian Council for Aboriginal Business and the Canadian
Association of Urban Financial Professionals. The BlackNorth Initiative challenges senior Canadian business The BlackNorth Initiative
leaders to sign a CEO Pledge committing their companies to specific actions and targets designed to end anti- challenges senior Canadian
Black systemic racism and create opportunities for all of those in the underrepresented Black, Indigenous business leaders to sign a CEO
and people of colour communities, including a target of at least 3.5% of executive and board roles based in Pledge committing their
Canada being held by Black leaders by 2025. Over 300 organizations have already signed the pledge.
companies to specific actions and
As noted above, the July 2020 CMM Taskforce consultation report includes proposals to require TSX- targets designed to end anti-
listed companies to set targets and annually provide data in relation to the representation of Black people,
Indigenous people, and people of colour, on boards and in executive officer positions, suggested a target
Black systemic racism and create
of 20% Black people, Indigenous people, and people of colour and recommended that racial diversity be opportunities for all of those in
similarly represented at the board and executive level of the Ontario Securities Commission. the underrepresented Black,
Ryerson University’s Diversity Institute issued its Diversity Leads 2020 report in August 2020. Examining Indigenous and people of colour
data from Toronto, Montréal, Vancouver, Calgary, Halifax, Hamilton, London and Ottawa, the report communities...
reviewed 9,843 individuals on boards of directors across five sectors: municipal and provincial agencies,
boards and commissions; the corporate sector; the voluntary sector; the hospital sector; and the education
sector (consisting of both university and college leaders and elected board members who govern school
boards). The report found that racialized people represent 28.4% of the population of the cities studied,
but hold only 10.4% of the board positions in those five sectors. The report concludes that Black leaders are
mostly absent from Canadian boards, holding only 2% of board positions overall despite representing 5.6%
of the population in those cities.
11DIVERSITY DISCLOSURE PRACTICES Osler, Hoskin & Harcourt llp
Internationally
Demonstrations and on-line support for the Black community in the United States have prompted a wide
variety of reactions, including the launch of a few initiatives to accelerate change at senior management levels.
In July, a California law firm filed shareholder derivative lawsuits over diversity on behalf of shareholders
of Oracle, Facebook and Qualcomm. The lawsuits allege that the board of directors breached their fiduciary
duty by failing to diversify the board and failing to monitor compliance with anti-discrimination laws. The
lawsuits also allege that the directors breached their fiduciary duty by deceiving shareholders with false
assertions about the company’s commitment to diversity.
In August 2020, the Diverse Corporate Directors Coalition, comprised of the Latino Corporate Directors
Association, Ascend Pinnacle, Out Leadership Quorum and WomenCorporateDirectors Foundation, issued
a call to action to increase diversity in American corporate boardrooms. The call to action asks boards to
update governance policies to reflect a commitment to diversity, equity and inclusion and for this purpose
encourages adoption of an inclusive definition of diversity that encompasses gender, race, ethnic subgroups
(Latino, Pan-Asian and Pacific Islanders, Native Americans, Alaskan and Hawaiian Natives), LGBT+, disability
and veteran status. Companies are also encouraged to disclose data on the composition of the board
disaggregated by each group and ethnic subgroup. The Coalition also urges boards to work towards a board
equity goal of at least 50% of the directors coming from under-represented groups, and recommends specific
practices that can help boards reach that goal.
In September 2020, California approved legislation to require each public company whose principal
executive offices are located in the state to have a minimum of one director from an underrepresented
community by December 31, 2021 and, by December 31, 2022, to have at least two such directors if the
number of directors on the board is less than nine and at least three such directors if the number of directors
is nine and greater. The bill defines a director from an “underrepresented community” as “an individual who
self-identifies as Black, African American, Hispanic, Latino, Asian, Pacific Islander, Native American, Native
Hawaiian, or Alaska Native, or who self-identifies as gay, lesbian, bisexual, or transgender.”
In the U.K., the Hampton-Alexander Review, an independent, business-led initiative supported by the U.K.
government, provided its fourth annual report on diversity among the FTSE 350 companies in November
2019. The Hampton-Alexander Review had previously established targets of 33% representation of women on
the boards of the FTSE 350 companies and among certain groups of senior executive officers by the end of
2020. The representation of women on the boards of FTSE 100 companies has reached 32.4%, which is close
to achieving the 33% target ahead of the 2020 deadline. The representation of women on FTSE 250 boards
has increased to 29.6% in 2019, which represents a rise from 24.9% in 2018. In particular, 111 boards are at
33% or above, compared to 66 last year, and “One & Done” boards are markedly reduced. The report indicates
12DIVERSITY DISCLOSURE PRACTICES Osler, Hoskin & Harcourt llp
that there are now only two FTSE 350 boards made up solely of men and 42 that have only one woman on
their board. The Hampton-Alexander Review also reported that increases in the representation of women
among senior executive officer positions remains slow, with the representation of women on the Combined
Executive Committee and Direct Reports increasing in 2019 to 27.9% from 24.9% in 2018.
Institutional investors are considering the impact of the new expanded focus on diversity. For example,
Moody’s became the first credit rating agency to assess a company’s diversity plan when it reviewed Lloyds
Banking Group PLC’s new “Race Action” plan and reported that it views the strategy “credit positive” because
it “will improve staff diversity at all levels and reduce Lloyds’ exposure to social risk.”
The sudden increased focus on diversity in a broader sense is here to stay. The COVID-19 pandemic has
initiated a renewed interest in social issues more generally, which we expect will prompt further initiatives
– both legislated and voluntary – to enhance efforts to be inclusive of all groups in Canada and elsewhere in
the months to come.
132
DIVERSITY DISCLOSURE PRACTICES Osler, Hoskin & Harcourt llp
Our methodology
In response to amendments to the CBCA that were effective January 1, 2020, the content and methodology
for this year’s report have been updated.
As in the past, our report this year analyzes the disclosure respecting the representation of women on boards
and in executive officer positions required to be made by National Instrument 58-101 Disclosure of Corporate
Governance Practices (NI 58-101) (Diversity Disclosure Requirement). This Diversity Disclosure Requirement
applies to Canadian reporting companies other than TSX Venture Exchange companies, exchange-traded
funds, closed-end funds and structured notes.
The methodology employed in gathering and analyzing the data for this aspect of the report remains
substantially unchanged from prior years. However, the number of issuers included in our 2020 results to date
has been impacted by the COVID-19 pandemic. Some issuers decided to take advantage of permitted extensions
of normal annual meeting and filing deadlines to file their materials after our July 31, 2020 cut-off for this
report, resulting in an increase in the number of issuers expected to file later in 2020 to 112, compared to
56 issuers that filed after our July 31, 2019 cut-off last year. Each year we report results to date for the current
year and full-year results for the prior year and we find they are consistent. However, for 2020 we anticipate
that certain of our full-year results, including the percentage of total board seats held by women, will be
approximately 1% lower than our mid-year results as those companies which took advantage of the extension in
deadlines to file disclosure collectively had below average diversity results last year.
Since 2015, when we first began reporting on diversity disclosure practices in Canada, we have been
asked why our statistical information on diversity is limited to gender. The answer we have given is
simple – there has been no obligation for issuers to report with respect to other diversity characteristics.
This changed in 2020. Amendments to the CBCA – which became effective January 1, 2020 – now
require corporations governed by the CBCA with publicly-traded securities to provide diversity disclosure
regarding women on the board and senior management consistent with the requirements under Canadian
securities laws, as well as corresponding disclosure respecting Aboriginal persons, members of visible
14DIVERSITY DISCLOSURE PRACTICES Osler, Hoskin & Harcourt llp
minorities and persons with disabilities (CBCA Requirement). Although the number of CBCA corporations
subject to this new disclosure requirement is relatively limited, it provides our first view into how
corporate Canada is addressing diversity beyond gender.
Unlike the Diversity Disclosure Requirements, the CBCA Requirement extends beyond TSX-listed issuers to
include all “distributing corporations” governed by the CBCA, including venture issuers. This affords some
insight into how public issuers that are not listed on Canada’s senior exchange are faring on diversity.
Details on our methodology for gathering and analyzing the available data is described below.
Methodology and data set
Diversity Disclosure Requirement
The data presented in this report in response to the Diversity Disclosure Requirement was obtained by
surveying public disclosure documents filed on SEDAR by all TSX-listed companies that are subject to that
requirement.
• In reporting on disclosure for full-year 2019, we reviewed disclosure documents provided by 793 TSX-listed
issuers that are not investment funds as of July 31, 2019. Of those companies, 735 provided disclosure
wholly or partially in compliance with the Diversity Disclosure Requirement. We excluded 58 companies
from our analysis because they are prescribed foreign issuers, exempt from disclosure or wholly non-
compliant.
• For 2020, there were 767 TSX-listed issuers that are not investment funds as at July 31, 2020. Of those
companies, 594 had provided full or partial diversity disclosure by that date and 112 are expected to file
later in 2020. We excluded a further 61 companies from our analysis – 49 because they are prescribed
foreign issuers, newly listed or otherwise exempt from disclosure in 2020 and 12 that are wholly non-
compliant with the Diversity Disclosure Requirement.
{ The number of companies expected to file later in 2020 has increased from 56 last year to 112 this year.
This appears to be a result of issuers taking advantage of permitted extensions of normal annual
meeting and filing deadlines in 2020 as a result of the COVID-19 pandemic.
• For comparison purposes and to highlight year-over-year progress, we compared data for all companies
subject to the Diversity Disclosure Requirement in the January 1 to July 31 period of each of 2016, 2017,
2018, 2019 and 2020, respectively, rather than limit our results solely to companies that were subject to the
requirement in all four periods.
15DIVERSITY DISCLOSURE PRACTICES Osler, Hoskin & Harcourt llp
{ This approach provides a close approximation of the results for full-year 2018 and 2019, as more than
90% of the relevant companies filed their disclosure by July 31 of the applicable year, and our final
results approximate the results we have previously reported for the January 1 to July 31 comparison
period for those years.
{ Although there is potential for some variation as a result of changes in the composition of the relevant
lists from year to year, given the sample size and the objective of testing the disclosure practices of such
companies as a group, rather than on an individual basis, we do not typically regard this variation as
material to our results. However, for 2020 we anticipate that certain of our full-year results, including the
percentage of total board seats held by women, will be approximately 1% lower than our mid-year results
as those companies that took advantage the extension in deadlines to file disclosure collectively had below
average diversity results last year.
• In addition to our year-over-year comparison, we provide a selection of comparative data for companies
included in the S&P/TSX 60 Index to provide insight on practices of Canada’s largest companies. In the
report, we refer to such companies as the “S&P/TSX 60 companies.” For 2020, 53 S&P/TSX 60 companies
had filed their management information circular or annual information form (as applicable) on or prior to
July 31, 2020, with the remaining seven either expected to file after that date or otherwise exempt from the
Diversity Disclosure Requirement.
• This year we also include select data for the 221 companies included in the S&P/TSX Composite Index
as of July 31, 2020, which includes more of Canada’s largest issuers. This provides for more meaningful
comparisons of diversity practices of Canadian issuers with those in other jurisdictions, such as the U.K.
and Australia, where studies typically focus on the 200 or 300 largest issuers in the jurisdiction.
CBCA Requirement
The data presented in this report in response to the CBCA Requirement was obtained by surveying public
disclosure documents filed on SEDAR by “distributing corporations” governed by the CBCA, including
venture issuers, that are subject to that requirement. Generally speaking, a “distributing corporation” is a
corporation with publicly-traded securities.
• In the absence of a centralized database of such companies, they were identified based on the reported
jurisdiction of incorporation on SEDAR for issuers listed on a recognized Canadian stock exchange or
certain stock exchanges in the U.S., U.K. and Australia (i.e., TSX, TSX Venture Exchange, Canadian
Securities Exchange, NEO Exchange, New York Stock Exchange, NASDAQ, American Stock Exchange,
London Stock Exchange, AIM and Australian Stock Exchange).
• Based on these search results, for 2020, we identified 515 “distributing corporations” subject to the CBCA
Requirement as at July 31, 2020. Of those companies, 270 had provided full or partial diversity disclosure
16DIVERSITY DISCLOSURE PRACTICES Osler, Hoskin & Harcourt llp
by that date and 151 are expected to file later in 2020. We excluded a further 94 companies from our
analysis – 21 because they are newly listed or otherwise exempt from disclosure in 2020 and 73 for which
diversity disclosure was not available.
{ The high number of CBCA corporations for which diversity disclosure was not available is likely mostly a
result of non-compliance with the new CBCA Requirement, which is not surprising as the requirement came
into force for the first time in 2020 and a relatively lower level of compliance in the first year is to be expected.
{ The data for the companies subject to the CBCA Requirement includes 186 TSX-listed companies that are
also subject to the more general Diversity Disclosure Requirement. The results for these companies are also
reflected in our reporting on disclosure provided in accordance with the Diversity Disclosure Requirement.
{ A significant number of CBCA companies which provided disclosure regarding the representation of
women failed to provide disclosure regarding the other designated groups. There were 48 CBCA
companies which failed to provide any disclosure regarding visible minorities, Aboriginal peoples and/or
persons with disabilities and an additional 26 CBCA companies which disclosed that they had a written
board policy relating to some or all such designated groups but failed to provide disclosure respecting
the number of directors from such designated groups on the board.
Other matters
• For each data point provided in this report, the percentages are calculated as a percentage of the total
number of companies that provided disclosure on the disclosure item in question.
• Because neither the Diversity Disclosure Requirement nor the CBCA Requirement specifies, we accepted
disclosure that was provided in respect of either the current board or the proposed director nominees and,
in those cases where disclosure was provided for both, we based our analysis on the disclosure provided
in respect of the board being nominated for election at the shareholders’ meeting in question. A similar
approach was adopted with respect to disclosure relating to executive officers.
• Data gathered for our reporting on the number and percentage of women appointed to fill vacancies
or nominated to fill new positions on boards of directors was gathered by identifying the number of
directors being nominated for election for the first time at each company that provided full or partial
diversity disclosure and the number of those nominated directors who were women. The data regarding
the number of companies that have a woman as the chief executive officer, chair of the board of directors
and/or committee chairs is similarly reported based on those companies that provided full or partial
diversity disclosure in response to the Diversity Disclosure Requirement. We are reporting on these data
points for the first time this year for companies subject to the CBCA Requirement, for which the data has
been gathered in a similar manner based on those companies subject to the CBCA Requirement that have
provided full or partial diversity disclosure in response to that requirement.
17DIVERSITY DISCLOSURE PRACTICES Osler, Hoskin & Harcourt llp
The Diversity Disclosure Requirement CBCA Requirement
The Diversity Disclosure Requirement requires disclosure: The CBCA Requirement requires
substantially the same disclosure as
• Whether or not the issuer has adopted a written policy relating to the identification and
the Diversity Disclosure Requirement,
nomination of women directors. If the issuer has not adopted such a policy, it must disclose
but separately with respect to each
why it has not done so. If an issuer has adopted a policy, the issuer must disclose:
“designated group” – which it defines to
{ a short summary of its objectives and key provisions include, but not be limited to, designated
{ the measures taken to ensure that the policy has been effectively implemented groups as defined by the Employment
{ annual and cumulative progress by the issuer in achieving the objectives of the policy Equity Act (Canada).
{ whether, and if so how, the board or its nominating committee measures the effectiveness Accordingly, disclosure is required with
of the policy respect to
• Whether the issuer considers the level of representation of women on the board in identifying and (a) women
nominating candidates for election or re-election to the board. If so, the issuer must disclose how (b) Aboriginal peoples
and, if not, disclose the issuer’s reason for not doing so. (c) persons with disabilities
(d) members of visible minorities.
• Whether the issuer considers the level of representation of women in executive officer positions
when making such appointments. If so, the issuer must disclose how and, if not, disclose the Companies subject to the CBCA
issuer’s reason for not doing so. Requirement may also elect (but are
not required) to provide disclosure in
• Whether the issuer has adopted a target regarding the appointment of women to the board. If respect of additional “designated groups”
so, the issuer must disclose the target and the annual and cumulative progress of the issuer in identified in their information circulars.
achieving the target. If not, the issuer must disclose the reason for not doing so.
• Whether the issuer has adopted a target regarding women in executive officer positions of
the issuer. If so, the issuer must disclose the target and the annual and cumulative progress of
the issuer in achieving the target. If the issuer has not adopted a target, it must disclose why it
has not done so.
• The number and percentage of women on the issuer’s board of directors.
• The number and percentage of the issuer’s women executive officers, including all major
subsidiaries of the issuer.
183
DIVERSITY DISCLOSURE PRACTICES Osler, Hoskin & Harcourt llp
2019 full-year results
Women on boards in 2019
For the full year ended December 31, 2019, 710 companies disclosed the number of women on their
boards. For these 710 companies, we counted a total of approximately 5,427 board seats, of which
1,031 were held by women. Based on these results, women held 19.0% of the total board seats among
companies providing disclosure, representing an increase of 2.5% compared to full-year 2018. For the
corresponding S&P/TSX 60 companies, these figures were 648 and 193 for full-year 2019, representing
approximately 29.8% of the total board seats among the 60 members of the S&P/TSX 60 providing
disclosure. Although we reported last year that the 53 members of the S&P/TSX 60 companies that
had provided disclosure as at July 31, 2019 had exceeded the 30% level (30.2%), the seven members of
the index that reported later in the year resulted in a slight decrease in the full-year result.
FIGURE 1
2019 PROPORTION OF
BOARD SEATS HELD BY WOMEN
Total companies that disclosed: 710
Total board seats
held by women
19%
Remaining
board seats
81%
19DIVERSITY DISCLOSURE PRACTICES Osler, Hoskin & Harcourt llp
On a company-by-company basis, based on the data reported by these 710 companies, there was an FIGURE 2
average of 1.45 women on these boards, while the 699 companies that disclosed the percentage of 2019 PROPORTION OF
women on their boards had an average of approximately 17.4% of women directors, both representing WOMEN DIRECTORS
an increase from the corresponding full-year 2018 figures of 1.29 and 14.9%, respectively. Total companies that disclosed: 710
Of the 710 companies disclosing the number of women directors on their boards, 169 (24.2%) No women
More than
reported having no women on the board, a further and significant improvement from 31.6% in 2018. one woman 24%
A total of 261 companies (36.8%) had one woman director (representing a slight increase from the 39%
34.9% reporting for 2018), and 280 (39.4%) reported having more than one woman on their board (up
from 33.5% in 2018). At five companies (Cogeco Communications Inc., Diversified Royalty Corp., DREAM
Unlimited Corp., MCAN Mortgage Corporation, New Gold Inc., and Saputo Inc.) women held 50% or more of
the board seats. One woman
37%
Women executive officers in 2019
For full-year 2019, 659 companies disclosed information regarding the number of women executives employed
by them, and 638 disclosed the percentage of their executive officers that are women. Companies that disclosed
the number of women executives reported an average of 1.69 women executives and a total of 1,114 executive
officer positions held by women. Among those that disclosed the percentage of women executives, an average
of 16.8% of executive officer positions were held by women. These numbers are generally flat compared to our FIGURE 3
full-year 2019 results, with respect to both the average number of women holding executive officer positions 2019 PROPORTION OF
(flat compared to full-year 2018) and the average percentage of such positions held by women (up by 0.8% from WOMEN EXECUTIVE OFFICERS
16.0% for full-year 2018). Total companies that disclosed: 659
Of the 659 companies that disclosed the number of their women executive officers in full-year 2019, 227 More than
one woman No women
(35.6%) reported having zero women executive officers, 187 (28.4%) reported having one woman executive
officer, and 245 (37.2%) reported having more than one woman executive officer. This represents a slight 37% 35%
decrease in companies having zero women executive officers (down from 36.0% in 2018) and an increase in
companies having more than one woman executive officer (up over 2.5% from the 34.6% reported in 2018).
Despite the relatively low numbers of female executive officers, a significant proportion of companies reported
whether they take gender into account when identifying and appointing executive officers, with 533 of 713 (or One woman
74.8%) companies reporting in full-year 2019 indicating that they did so (up from 73.1% in 2018). 28%
20DIVERSITY DISCLOSURE PRACTICES Osler, Hoskin & Harcourt llp
Breakdown by industry for FIGURE 4
2019 INDUSTRY BREAKDOWN
FIGURE 5
2019 INDUSTRY BREAKDOWN
full-year 2019 OF NUMBERS AND PERCENTAGES OF NUMBERS AND PERCENTAGES
OF WOMEN DIRECTORS OF WOMEN EXECUTIVE OFFICERS
As demonstrated in Figures 4 and 5, the industries
Total companies Number of women directors Total companies Number of women executive officers
with the highest number and percentage of
that disclosed: Percentage of women directors that disclosed: Percentage of women executive officers
women directors in 2019 were Utilities & Pipelines, 710 (#) / 699 (%) 659 (#) / 638 (%)
Communication & Media, Clean Technology and
Utilities 3.1 Utilities 3.8
Consumer Products & Services, while Real Estate
& Pipelines 30% & Pipelines 23%
reported the highest average percentage of women
executive officers and Utilities and Pipelines reported Communication 2.6 Communication 2.5
the highest average number. Other strong performers & Media 27% & Media 21%
were Forest Products & Paper and Consumer Financial 2.1 Financial 2.5
Products & Services. Services 20% Services 21%
Consumer 1.9 Consumer 3.0
Products Products
& Services 22% & Services 21%
Clean 1.8 Clean 1.2
Technology 23% Technology 12%
Industrial 1.7 Industrial 2.0
Products Products
& Services 21% & Services 15%
Forest Products 1.5 Forest Products 3.3
& Paper 20% & Paper 22%
1.4 1.7
Real Estate Real Estate
19% 26%
1.3 1.3
Technology Technology
16% 14%
1.2 1.2
Life Sciences Life Sciences
17% 19%
1.0 1.0
Oil & Gas Oil & Gas
12% 13%
0.9 1.0
Mining Mining
13% 14%
0.9 1.1
Energy Services Energy Services
11% 8%
21DIVERSITY DISCLOSURE PRACTICES Osler, Hoskin & Harcourt llp
Diversity policies and targets for full year 2019
In 2019, companies remained far more willing to adopt board diversity policies than they were to adopt
targets for the proportion of women serving as directors or for the proportion of women executive officers.
Of the 733 companies that provided disclosure regarding the existence (or not) of a written board diversity
policy, 426 (58.1%) of those companies has a board diversity policy. As shown in Figure 6, this represents an
approximately 6.2% increase from 2018.
Of the 719 companies that provided board diversity target disclosure in 2019, 155 (21.6%) adopted a target
for women directors, an increase of approximately 4.0% from 2018. Only 45 companies (6.5% of the 691
companies reporting) adopted a target for women executive officers in 2019, essentially flat compared to the
6.6% disclosing that they had done so in 2018. These results are illustrated by Figures 7.1 and 7.2.
FIGURE 6 FIGURE 7.1 FIGURE 7.2
2019 BOARD DIVERSITY 2019 TARGET ADOPTION RATES – 2019 TARGET ADOPTION RATES –
POLICY ADOPTION RATES WOMEN DIRECTORS WOMEN EXECUTIVE OFFICERS
Total companies that disclosed: 733 Total companies that disclosed: 719 Total companies that disclosed: 691
Without
With
policies
targets
42% Without
With
7%
targets Without
targets
With 78% 22% targets
policies 93%
58%
Results for the full-year 2019 reflect continued slow progress for women gaining seats in the boardroom,
principally as a result of the addition of more women directors at issuers that already have at least one
female board member. The representation of women in executive officer positions, however, was essentially
unchanged compared to the prior full year.
224
DIVERSITY DISCLOSURE PRACTICES Osler, Hoskin & Harcourt llp
Mid-year results for 2020:
Women on boards
Number and percentage of women directors
As of July 31, 2020, 586 companies had disclosed the number of women directors on their boards, with a total of FIGURE 8
987 board positions at these companies reported as being held by women out of a total of 4,599 board seats. Based 2019 PROPORTION OF TOTAL
on these results, women held 21.5% of the total board seats among companies providing disclosure for 2020, an BOARD SEATS HELD BY WOMEN
increase of over 3.0% in the proportion of total TSX company board seats held by women. However, year-to-date (ALL COMPANIES)
results for 2020 are based on fewer reporting companies as a result of a significant number of issuers taking Total companies that disclosed: 588
advantage of permitted extensions of normal annual meeting and filing deadlines to delay filing their disclosure Total board seats
until later in 2020. We anticipate that certain of our results for full-year 2020, including the percentage of total held by women
board seats held by women, will be approximately 1% lower than our results mid-year as those companies which 22%
took advantage the extension in deadlines to file disclosure collectively had below average diversity results last year. Remaining
board
Corresponding results for the S&P/TSX 60 companies during this period were 187 and 593 board seats, respectively, seats
representing 31.5% of the total board seats among the 53 members of the S&P/TSX 60 providing disclosure. These 78%
figures reflect a small increase in the level of female representation on the boards of S&P/TSX 60 companies
(up by approximately 1.2%) from mid-year 2019. No S&P/TSX 60 companies took advantage of the extension in
the deadline for filing materials and, accordingly, comparability concerns do not arise for year-over-year results of
the S&P/TSX 60 companies. We also tracked the percentage of board seats held by women on the broader S&P/TSX
composite index – of the 1,893 board seats, 535 are held by women, representing 28.3% of the total. Unsurprisingly,
this group of companies has results that are stronger than the broader group of companies subject to the Diversity
Disclosure Requirement but not quite as strong as those of the S&P/TSX 60 group of companies.
23DIVERSITY DISCLOSURE PRACTICES Osler, Hoskin & Harcourt llp
For the 586 companies disclosing the number of women directors on their FIGURE 9.1 FIGURE 9.2
boards, there was an average of 1.68 board seats held by women, and for the AVERAGE NUMBER AVERAGE PERCENTAGE
579 companies disclosing the percentage of women on their boards, there OF WOMEN DIRECTORS OF WOMEN DIRECTORS
was an average of 19.8% of women directors on these boards. As reflected in All companies All companies
Figure 9.1, numbers reflect a further increase in the average number of women S&P/TSX 60 companies S&P/TSX 60 companies
on boards over time (1.29 in 2018 and 1.44 in 2019), and also reflect a further Total companies that disclosed: 2016: 693 Total companies that disclosed: 2016: –
increase in the average percentage of women on boards compared to prior 2017: 692 | 2018: 680 | 2019: 657 | 2020: 586 2017: 684 | 2018: 682 | 2019: 645 | 2020: 579
years (14.8% in 2018 and 17.2% in 2019). Total S&P/TSX 60 companies that disclosed: Total S&P/TSX 60 companies that disclosed:
2016: 58 | 2017: 54 | 2018: 55 | 2019: 53 | 2020: 53 2016: – | 2017: 56 | 2018: 56 | 2019: 53 | 2020: 53
The percentage of all-male boards continues to decline meaningfully, falling to
18.5% (107 companies reporting) in 2020, compared to 24.1% in 2019 and 31.3% 3.53 31%
3.31 3.34 29%
28%
in 2018. Over 81.5% of all companies reporting the number of women on their 2.96 26%
2.68 24%
board now have at least one female director.
20%
17%
1.68 15%
1.44 13% 13%
1.29
1.13
0.96
2016 2017 2018 2019 2020 2016 2017 2018 2019 2020
FIGURE 10
2019 PROPORTION OF WOMEN
DIRECTORS (ALL COMPANIES)
Total companies that disclosed: 586
No women
More than 18%
one woman
48%
One woman
34%
24DIVERSITY DISCLOSURE PRACTICES Osler, Hoskin & Harcourt llp
Building on last year’s significant gains, the FIGURE 11.1 FIGURE 11.2
percentage of boards with two or more women NUMBER OF WOMEN DIRECTORS PERCENTAGE OF WOMEN DIRECTORS
directors increased significantly again this year. (ALL COMPANIES) (ALL COMPANIES)
As highlighted in Figures 11.1 and 11.2, nearly 2016 2017 2018 2019 2020 2016 2017 2018 2019 2020
half (47.8%) of the 586 companies that reported Total companies that disclosed Total companies that disclosed
indicated that they now have more than one woman 2016: – | 2017: 684 | 2018: 680 | 2019: 657 | 2020: 586 2016: – | 2017: 684 | 2018: 682 | 2019: 645 | 2020: 579
on their board – an increase of approximately 9%
Percentage of companies Percentage of companies
compared to the same period last year where 38.7%
of reporting companies reported having more than 46% 46%
one woman on their board. 37% 0% 38%
No women
31% women 31%
directors
So far in 2020, based on the disclosure provided, 23% directors 25%
women comprise 50% or more of the board at nine 19% 19%
companies: Chemtrade Logistics Income Fund, 30% 21%
Choice Properties Real Estate Investment Trust, 35% 1–14% 24%
1 woman
DREAM Unlimited Corp., First Majestic Silver 35% women 24%
director
37% directors 22%
Corp., Laurentian Bank of Canada, Park Lawn
34% 21%
Corporation, Ritchie Bros. Auctioneers Incorporated,
Saputo Inc. and Westport Fuel Systems Inc. 14% 15%
DREAM and Saputo were on the list in 2019 and 14% 15–24% 18%
2 women
18% women 20%
2018; the rest are new additions. directors
directors
21% 21%
This year’s data demonstrate that Canada’s largest 24% 20%
companies continue to be leaders in gender 6% 14%
diversity, although in a number of areas the 8% 25–34% 15%
3 women
gaps are narrowing between the leaders and the directors 8% women 17%
9% directors 24%
broader group of companies subject to the Diversity
14% 27%
Disclosure Requirement. The trend for relatively
larger issuers to perform better in this regard is 2% 3%
consistent with broader trends internationally, 3% 35%+ 6%
4 women
4% women 8%
and it has remained constant in our data since the directors
directors
5% 9%
Diversity Disclosure Requirements was introduced.
6% 13%
3%
2%
5+ women
directors 3%
4%
4%
25DIVERSITY DISCLOSURE PRACTICES Osler, Hoskin & Harcourt llp
For the 53 S&P/TSX 60 companies that have FIGURE 12.1 FIGURE 12.2
disclosed the number of women directors on their NUMBER OF WOMEN DIRECTORS PERCENTAGE OF WOMEN DIRECTORS
board, there was an average of 3.53 board positions (S&P/TSX 60 COMPANIES) (S&P/TSX 60 COMPANIES)
per disclosing company and, of the 53 companies 2016 2017 2018 2019 2020 2016 2017 2018 2019 2020
reporting the percentage of women on their boards, Total companies that disclosed Total companies that disclosed
there was an average of 30.8% women directors, 2016: 58 | 2017: 54 | 2018: 55 | 2019: 53 | 2020: 53 2016: 58 | 2017: 54 | 2018: 55 | 2019: 53 | 2020: 53
up from 29.07% in 2019 and 27.71% in 2018. This is
Percentage of companies Percentage of companies
shown in Figure 9.2.
5% 5%
The vast majority (51 or 96.3%) of disclosing S&P/ 4% 4%
0%
TSX 60 companies reported having two or more No women
0% women 0%
directors
women board members. Of those 51 companies, 2% directors 2%
11 companies (21.6% of those disclosing) have five 0% 0%
board positions held by women and three 9% 14%
companies (5.9% of those disclosing) have six or 9% 1–14% 13%
1 woman
more board positions held by women. These data 9% women 13%
director
6% directors 8%
are described in Figures 12.1 and 12.2.
4% 4%
29% 20%
24% 15–24% 27%
2 women
22% women 20%
directors
28% directors 17%
21% 11%
29% 51%
28% 25–34% 38%
3 women
27% women 43%
directors
19% directors 40%
26% 51%
14% 9%
20% 35%+ 20%
4 women
18% women 25%
directors
19% directors 34%
23% 34%
14%
15%
5+ women
directors 24%
26%
26%
26You can also read