Refining livestock mortality indicators: a systematic review version 1; peer review: awaiting peer review
←
→
Page content transcription
If your browser does not render page correctly, please read the page content below
Gates Open Research                                                            Gates Open Research 2021, 5:75 Last updated: 19 APR 2021

SYSTEMATIC REVIEW

Refining livestock mortality indicators: a systematic review
[version 1; peer review: awaiting peer review]
Johanna T. Wong, Ciara Vance, Andrew Peters
Supporting Evidence-Based Interventions - Livestock, University of Edinburgh, Easter Bush, Midlothian, EH25 9RG, UK

v1   First published: 19 Apr 2021, 5:75                                         Open Peer Review
     https://doi.org/10.12688/gatesopenres.13228.1
     Latest published: 19 Apr 2021, 5:75
     https://doi.org/10.12688/gatesopenres.13228.1                              Reviewer Status AWAITING PEER REVIEW

                                                                                Any reports and responses or comments on the

Abstract                                                                        article can be found at the end of the article.
Background: Livestock mortality impacts farmer livelihoods and
household nutrition. Capturing trends in livestock mortality at
localised or national levels is essential to planning, monitoring and
evaluating interventions and programs aimed at decreasing mortality
rates. However, livestock mortality data is disparate, and indicators
used have not been standardised. This review aims to assess livestock
mortality indicator definitions reported in literature, and define the
ages where mortality has greatest impact.
Methods: A systematic review was conducted, limited to articles
focussed on mortality of cattle, sheep and goats. Peer-reviewed
articles in Web of Science until year 2020 were assessed for inclusion
of age-based definitions for mortality indicators and data on age
distribution of mortality. Indicator definitions for each species were
collated and similar terms and age groups most targeted were
compared. The cumulative distribution of age at mortality was
compared across studies graphically where possible; otherwise, age
patterns for mortality were collated.
Results: Most studies reported mortality risk rather than rate, and
there was little agreement between indicator definitions used in the
literature. The most common indicators reported were perinatal and
neonatal mortality in cattle, and for perinatal, neonatal and pre-
weaning mortality indicators for sheep and goats. Direct comparison
of age distribution of mortality was only possible for cattle, which
found that approximately 80% of all mortalities within the first 12
months had occurred by six months of age. A significant finding of the
study is the variation in age groups for which mortality is reported,
which impedes the comparison of mortality risk across studies,
particularly for sheep and goats.
Conclusions: This study demonstrates the importance and value of
standardising mortality risk indicators for general use, including a
young stock mortality risk indicator measuring mortality in the
highest risk period of birth to six months of age in cattle, sheep and
goats.

                                                                                                                           Page 1 of 27
Gates Open Research                                                                        Gates Open Research 2021, 5:75 Last updated: 19 APR 2021

Keywords
Livestock mortality, mortality rate, mortality risk, perinatal mortality,
neonatal mortality, young stock mortality.

                 This article is included in the AgriKnowledge
                 gateway.

 Corresponding author: Andrew Peters (andy.peters@ed.ac.uk)
 Author roles: Wong JT: Data Curation, Formal Analysis, Investigation, Methodology, Validation, Visualization, Writing – Original Draft
 Preparation, Writing – Review & Editing; Vance C: Conceptualization, Investigation, Project Administration, Supervision, Writing – Review
 & Editing; Peters A: Conceptualization, Formal Analysis, Funding Acquisition, Investigation, Resources, Supervision, Writing – Review &
 Editing
 Competing interests: No competing interests were disclosed.
 Grant information: This work was supported by the Bill and Melinda Gates Foundation [INV-009921].
 The funders had no role in study design, data collection and analysis, decision to publish, or preparation of the manuscript.
 Copyright: © 2021 Wong JT et al. This is an open access article distributed under the terms of the Creative Commons Attribution License,
 which permits unrestricted use, distribution, and reproduction in any medium, provided the original work is properly cited.
 How to cite this article: Wong JT, Vance C and Peters A. Refining livestock mortality indicators: a systematic review [version 1; peer
 review: awaiting peer review] Gates Open Research 2021, 5:75 https://doi.org/10.12688/gatesopenres.13228.1
 First published: 19 Apr 2021, 5:75 https://doi.org/10.12688/gatesopenres.13228.1

                                                                                                                                       Page 2 of 27
Gates Open Research 2021, 5:75 Last updated: 19 APR 2021
Introduction that the BMGF can use to monitor progress in their target areas
Approximately 1 billion poor people globally are dependent on of livestock health and productivity.
livestock for their livelihoods (Ashley et al., 1999; FAO, 2009;
Salmon et al., 2020). However, the benefits derived from This review seeks to clarify the definition of “livestock
livestock ownership, including income and household nutrition, mortality rate” in ruminants by first examining the rationale
are constrained by poor animal health and low productivity behind the use of mortality indicators, then exploring what
(Perry et al., 2002). The impact of livestock disease has definitions are currently used in the field, and in which age
been cited in many publications e. g. Perry et al. (2013), but groups mortality has the greatest impact. The results of this
the ability to monitor change is limited as the available data is review are then used to inform the selection of the best
contained in disparate publications and reports, usually from definition of mortality rate as an indicator to monitor development
individual countries, and there are few longitudinal studies in animal health.
of disease prevalence and impact. Donors to international
development projects are increasingly interested in being able Rationale behind use of mortality indicators
to monitor change in a country’s performance particularly in Use in human health. Mortality rates are used extensively in
response to investment. human health literature to monitor progress in human develop-
ment. However, mortality rates are usually qualified by factors
It has been recognised that there is a great disparity between the such as age, life stage, or cause. To illustrate this, Table 1 shows
contribution that livestock make to agricultural GDP in many the definitions of selected Sustainable Development Goal (SDG)
countries compared to relatively poor investment in devel- targets and indicators measuring mortality rates from SDG 3:
opment of the livestock sector (Perry et al., 2002). In recent “Ensure healthy lives and promote well-being for all at all ages”
years, the Bill and Melinda Gates Foundation (BMGF) have (UNSD, 2020a; UNSD, 2020b). The specificity of each mortality
been major investors in the low- and middle-income country indicator allows comparison across time and space. Changes in
(LMIC) livestock sector, and in particular, in animal health. trend can also be traced back to a relatively discrete number of
However, it has become clear that development in LMIC factors for each indicator, and therefore drive targeted research,
agro-economies is hampered by the lack of data which can be programs and interventions.
used to prioritise policy investment decisions. Indeed, Mr. Bill
Gates has himself stated “Great science is helping to turn Although only encompassing narrow age groups, neonatal,
livestock into a pathway out of poverty for hundreds of millions infant and under-five mortality rates are often used as barom-
of people…we have a lot of tools [such as] breeding, gene eters for overall population health (UNSD, 2020a; WHO, 2021).
editing, vaccines…the lack of data makes us pretty uncertain Reidpath & Allotey (2003) examined the ability of infant mor-
about the right way to go’’ (W. Gates, Edinburgh, 2018). This tality rate (IMR), defined as the number of deaths in children
constraint applies to national governments, non-governmental under 1 year of age per 1000 live births in the same year, to
organisations (NGOs) and other donors. represent whole population health compared to the more
comprehensive measure of disability-adjusted life expectancy
In response to this, the University of Edinburgh’s Supporting (DALE), which accounts for mortality as well as non-fatal
Evidence-Based Interventions (SEBI) program, which is morbidity. The analysis found a strong, linear correlation
funded by the BMGF, aims to improve livestock data between IMR and DALE, showing that IMR is a feasible
collection, curation and utilisation across the sector. This will and useful indicator of whole population health. Reidpath
enable the livestock community to make better investments & Allotey (2003) also discussed the difference in resources
and smallholder livestock keepers to make better-informed required to collect data for each indicator, highlighting that the
decisions, ultimately driving sustainable transformation of the simpler IMR was more feasible to monitor in resource-poor
livestock sector as a whole. Under the scope of this work, one countries.
of the key animal health indicators that SEBI will monitor on
behalf of the BMGF is “livestock mortality rate”, currently This is important considering the resources that are required
defined as the total cumulative number of livestock deaths over to collect a broad set of data to construct complex indicators,
the approximate average number of animals in the herd. The compared to the resource limitations often faced in LMICs.
BMGF has set a target for SEBI to investigate interventions
that can decrease livestock mortality by 10–15% over a Use in livestock health. Livestock fulfil multiple roles in
10-year period in their priority countries of Ethiopia, Nigeria various parts of the world; however, their primary roles are
and Tanzania. If such mortality reductions are achievable, generally for income generation, food, and employment (Herrero
this provides a significant opportunity to increase livestock et al., 2013; Salmon et al., 2020). This focus on production
productivity and in turn improve the livelihoods of smallholder marks a significant difference in perspective between human
farmers. To explore the feasibility of achieving this target, and animal health and means that indicators that measure
SEBI has been compiling evidence on current livestock progress in humans may not be directly transferrable to
mortality rates, causes, and possible interventions that may livestock. In addition, the mixture of public and private
be able to achieve a significant mortality rate reduction. In interests in livestock production complicates and often limits the
addition, SEBI also aims to better define a set of indicators availability of public resources for animal health. Practically,
Page 3 of 27Gates Open Research 2021, 5:75 Last updated: 19 APR 2021
Table 1. Selected SDG indicators from SDG 3 that measure human mortality rates (UNSD, 2020a; UNSD, 2020b).
Target Indicator Definition
The annual number of maternal deaths from any cause
related to or aggravated by pregnancy or its management
3.1: By 2030, reduce the global maternal
3.1.1: Maternal mortality (excluding accidental or incidental causes) during pregnancy
mortality ratio to less than 70 per 100,000
ratio and childbirth or within 42 days of termination of pregnancy,
live births.
irrespective of the duration and site of the pregnancy, per
100,000 live births, for a specified year.
The probability (expressed as a rate per 1,000 live births) of a
3.2.1: Under-five mortality child born in a specified year or period dying before reaching
rate the age of five if subject to current age-specific mortality
3.2: By 2030, end preventable deaths of rates.
newborns and children under 5 years of
age, with all countries aiming to reduce The probability that a child born in a specific year or period
neonatal mortality to at least as low as 12 will die during the first 28 completed days of life if subject to
per 1,000 live births and under-5 mortality current age-specific mortality rates, expressed per 1,000 live
to at least as low as 25 per 1,000 live 3.2.2: Neonatal mortality births.
births. rate
Neonatal deaths may be subdivided into early neonatal
deaths (first seven days of life), and late neonatal deaths
(after 7th day but before 28th completed day of life).
The percent of 30-year-old people who would die before
3.4: By 2030, reduce by one third 3.4.1: Mortality their 70th birthday from cardiovascular diseases, cancer,
premature mortality from non- rate attributed to diabetes, or chronic respiratory diseases, under the
communicable diseases through cardiovascular disease, assumption that the experienced mortality rate does not
prevention and treatment and promote cancer, diabetes, or change over time, excluding other causes of death such as
mental health and well-being. chronic respiratory disease accidents or HIV/AIDS. This indicator is calculated using the
life table method.
The mortality attributable to the joint effects of household
3.9.1: Mortality rate
and ambient air pollution and can be expressed as per
attributed to household
100,000 population for any given population group (e.g.
and ambient air pollution.
children under 5 years of age).
3.9: By 2030, substantially reduce the
3.9.2: Mortality rate The number of deaths from unsafe water, unsafe sanitation
number of deaths and illnesses from
attributed to unsafe water, and lack of hygiene in a year per 100,000 population.
hazardous chemicals and air, water and
unsafe sanitation and lack
soil pollution and contamination
of hygiene
3.9.3: Mortality rate The number of deaths from unintentional poisonings in a
attributed to unintentional year per 100,000 population.
poisoning
SDG = Sustainable Development Goals; UNSD = United Nations Statistics Division; HIV = human immunodeficiency virus; AIDS = acquired immune deficiency
syndrome.
this necessitates efficiency in resource allocation for data by livestock keepers may be comparatively greater for those
collection, analysis, and action. whose livestock fulfil several purposes, as is the case in many
LMICs.
In animal health, attempts to devise a system analogous to
disability-adjusted life years (DALYs) or DALEs for humans A suite of mortality indicators available for use in animals,
has not, as yet, gained general acceptance in the livestock as described by Thrusfield & Christley (2018), are presented
development community (Shaw et al., 2017). Therefore, at in Table 2. Issues with the current definitions are immediately
the present time, SEBI is attempting to define an indicator of evident: the authors do not define the age for which
livestock mortality that is a stable reflection of the animal health calf/lamb/kid or neonatal mortality rates apply, as “there is not
status of a country. a universal agreement on the age at which animals cease to be
neonates in veterinary medicine”. With this range of indicators
Livestock mortality has always been an important issue, as and a lack of consensus on age groupings, it is important
loss of stock represents a loss of wealth, livelihood, nutrition, to gain a better understanding of what the term “mortality
genetic material, and a waste of investment, whether finan- rate” actually means in a practical sense, particularly when
cial or through labour. The magnitude of lost value experienced referencing specific age groups. To this end, a literature search
Page 4 of 27Gates Open Research 2021, 5:75 Last updated: 19 APR 2021
Table 2. Mortality indicators used in veterinary epidemiology (Thrusfield & Christley, 2018).
Indicator Numerator Denominator
Cumulative mortality Number of individuals that die during a Number of individuals in the population at
particular period the beginning of that period
Mortality rate or mortality density Number of deaths due to a disease that occurs The sum, over all individuals, of the length
in a population during a particular period of of time at risk of dying
time
Death rate or crude mortality The total mortality rate for all diseases (rather The sum, over all individuals, of the length
ratea than just one) of time at risk of dying
Case fatality Number of deaths Number of diseased animals
Crude death rate (in 10 animals)
b
Number of deaths occurring Average population
Age-specific death rate (in 10b Number of deaths among animals in a specified Average number in the specified age
animals) age group group
Calf/lamb/kid mortality rate (in Number of deaths under a specified age Number of live births
10b animals)
Neonatal mortality rate (in 10b Number of deaths under a specified age Number of live births
animals)
Foetal death rate (in 10b animals) Number of foetal deaths Number of live births plus foetal deaths
Cause-specific death rate (in 10b Number of deaths from a specified cause Average population
animals)
In these mortality indicators commonly used in livestock, there is no consensus on age definitions for “calf”, “lamb”, “kid”, or “neonatal”. a The
distinction between mortality rate and death rate is not always clear when reported. b Usually a whole number between 2–6.
was performed with the aim to collate and review the terms (original research, secondary data analysis and reviews for
that are most frequently used within the livestock farmer, both mortality indicator definitions and age distribution of
professional and scientific research communities, and to review mortality, and method articles also for indicator definitions).
the age categories which have the highest incidence of mortality Data from published research reports related to the selected
with a view to refining the current definition of “livestock journal articles were included if they expanded on or clarified
mortality rate”. This review is reported in line with the Preferred definitions used in the article. For age distribution of mortality,
Reporting Items for Systematic Reviews and Meta-Analyses articles studying interventions were only included if baseline
(PRISMA) (Wong, 2021). data were reported, and only baseline data was considered for
inclusion. To ensure all nuances in indicator definitions were
Methods captured, articles were only included in the indicator definition
Eligibility criteria section if they were in English.
A preliminary search was performed in Google to collect
commonly used terminology from a mixture of academic and Exclusion criteria. For both studies, articles were excluded if
professional publications. This search showed that indicators their abstracts or full text papers were not available. For the
used to monitor mortality rates are often specific for age groups indicator definition section, studies were excluded if the defi-
(especially young animals), defined time periods (e.g., annual, nitions were based on events such as ear-tagging or weaning
a study duration), or specific diseases (i.e., case fatality rates). rather than age group. For age distribution of mortality, articles
Common terms encountered during this preliminary search that only reported on cause-specific mortality rates, or arti-
contributed to the development of a search strategy (outlined cles that presented experimental data in laboratory settings that
in Table 3) to retrieve articles reporting on mortality rates did not reflect realities in the field were excluded.
and age at mortality in cattle (both dairy and beef production
systems), sheep, and goats. An overview of the criteria used to identify literature relating
to the two purposes of this review is presented in in Table 4.
Inclusion criteria. Articles from all countries published
between 1900 and 2020 were considered for inclusion. A wide Search
date range was used due to the scoping nature of the indicator Literature searches were then performed in Web of Science
definition review, and to maximise the inclusion of data from (core databases) in June 2020. An initial search for “mortality”
LMICs. The search included peer-reviewed journal articles in combination with the full series of additional search terms
Page 5 of 27Gates Open Research 2021, 5:75 Last updated: 19 APR 2021
Table 3. Initial Web of Science search terms and results.
Search stem Additional search term Number of
results
Cattle OR bovine OR calf OR sheep OR ovine OR lamb OR 4305
Mortality rate AND
goat* or caprine OR kid
Livestock 17
Cattle OR bovine OR dairy OR beef OR calf OR calv* 287
Perinatal mortality AND
Sheep OR ovine OR lamb* 252
Goat* OR caprine OR kid OR kids 38
Livestock 50
Cattle OR bovine OR dairy OR beef OR calf OR calv* 667
Neonatal mortality AND
Sheep OR ovine OR lamb* 394
Goat* OR caprine OR kid OR kids 129
Livestock 83
(Pre-weaning OR preweaning OR pre Cattle OR bovine OR dairy OR beef OR calf OR calv* 1,490
wean* mortality) AND Sheep OR ovine OR lamb* 543
Goat* OR caprine OR kid OR kids 207
Livestock 15
Young stock mortality OR youngstock Cattle OR bovine OR dairy OR beef OR calf OR calv* 61
mortality AND Sheep OR ovine OR lamb* 18
Goat* OR caprine OR kid OR kids 8
Total 8564
The large number of results for cattle contrasts with the limited amount of literature available for goats.
Table 4. Study selection criteria.
Domain Criteria
Definition of mortality rate Age at mortality
Date range 1900–2020 1900–2020
Geographical Global Global
scope
Type Peer-reviewed journal article, including original research, Peer reviewed journal article, including original research,
secondary data analysis, method articles and reviews secondary data analysis and reviews.
Specific details Defined or reported on mortality rates for explicit age Reported incidence of all-cause mortality by age. Articles
groups, including those reporting on specific diseases. that reported mortality rates within study cohorts but did
Articles that defined mortality based on events, such as not aim specifically to monitor or explore mortality, or
ear-tagging or weaning, were excluded if the typical or articles citing published mortality rates as part of study
average age at these events were not reported. backgrounds were excluded.
Exclusions Abstract unavailable Abstract unavailable
Full text unavailable Full text unavailable
Cause-specific mortality rates
Data from laboratory-based settings that are unlikely to
be replicated in the field.
Language English only All languages as long as specific details on study design
and age at mortality were able to be translated using
Google Translate.
Page 6 of 27Gates Open Research 2021, 5:75 Last updated: 19 APR 2021
yielded too broad a range of results, many of which were not account for the largest proportion of articles, followed by
related to livestock production. The search strings were refined, sheep, with goats having very poor representation. Results of
and the specific search strings used are presented in Table 3. the literature search are presented in Figure 1. The database
A Google Scholar literature search for “livestock mortal- search in Web of Science yielded 382 potentially relevant arti-
ity rate” was also performed to ensure as many articles were cles based on title, while 40 articles were identified through
included, as well as inclusion of relevant articles found within Google Scholar and article reference lists. Duplicates (n=80)
reference lists. were removed, before 190 articles were excluded based on
their abstracts. Of the 152 full-text articles assessed for eligibil-
Study selection ity, 85 articles were included in the review. As some articles
For all terms, article titles were reviewed for relevance to both defined mortality rate based on age and reported on
livestock mortality rates. Article abstracts for relevant titles were age distribution of mortality, 52 articles were included in the
then reviewed by two authors (J. W. and A. P.) according to the study on mortality rate indicator definitions, while 53 articles
selection criteria (Table 4) and articles selected for full-text were included for the age distribution of mortality study.
review. Full-text articles were reviewed by J. W. and A. P.,
and disagreements on inclusion were resolved through dis- Defining “mortality rate”
cussion. Where multiple papers arose from the same research The literature search for “mortality rate” in cattle, sheep and
study, or where research groups used the same definition or pre- goats mostly yielded articles focussed on mortality in calves,
sented the same information across multiple papers, only the lambs and kids. Few articles defined specific age groups for
most detailed publication was included. older animals – general herd or flock mortality rates tended to
be reported instead. For all species and age groups, the literature
Data extraction was divided into those studies reporting a true mortality rate,
Data were extracted into a piloted form in Microsoft Excel and those reporting mortality risk.
version 2102. Data extracted included: author/s, citation, coun-
try of origin and income group, species and breed, produc- Mortality incidence rate versus mortality incidence risk. The
tion system characteristics, whether the aim/objectives of study Centres for Disease Control and Prevention (CDC) define mor-
directly related to livestock mortality, study type, recruitment tality rate as a “measure of the frequency of occurrence of death
procedure, sample size, time span covered, mortality indica- in a defined population during a specified interval” (CDC, 2012).
tor name, indicator enumerator, indicator denominator, whether For livestock, movement of animals in and out of the herd,
abortions, stillbirths or culling events were included, and age from mortality, sale, or slaughter, is common and makes quan-
distribution of mortality events recorded. tifying the “population” as a denominator in the ratio, more
complex than in static populations. The most accurate way
Data analysis to define a varying population is to calculate the number of
For the study of mortality indicator definitions, definitions animal-days-at-risk, thereby no longer counting animals as
were grouped by species and age range, and studied for pat- being at risk from the day they leave the population (Thrusfield
terns or common age ranges to produce a narrative summary. & Christley, 2018). Mortality incidence rate is often expressed
Given the scoping nature of this section of the review, studies per 100-animal-months or -years. However, crude mortal-
were not individually assessed for bias. ity rates, more correctly known as mortality risk, are often
used. These use estimates of the population, such as the number
For the study on age distribution of mortality, studies were of animals counted or average herd/flock sizes, as a denomi-
first grouped into age ranges studied. Where studies over- nator and are accepted proxies. Mortality risk is commonly
lapped in age range coverage, mortality risk by calendar month reported as “mortality rate” (Thrusfield & Christley, 2018).
(365.25 days/12) was calculated, and the cumulative mortal- Within the 52 included studies, 42 (81%) reported mortality risk,
ity risk by age in months graphed for each study along with the four reported mortality rate (8%), four studies reported both
average mortality risk and standard deviation across studies. (8%) and in two review articles, it was not always clear whether
These studies were assessed for bias using the Risk of Bias Tool the included articles reported risk or rate.
for Prevalence Studies (Hoy et al., 2012). Where studies did not
have commonalities in age range, the results were included in a Age ranges used to define mortality rate. For cattle, the litera-
narrative summary. These studies were not assessed for bias. ture search identified 30 articles that used 20 mortality indicators
All analysis was done in Excel version 2102. (Table 5). Geographically, the 30 articles spanned 18 coun-
tries, with two studies having a global coverage. Using World
This review was not registered in PROSPERO and did not Bank Group classifications (World Bank Data Team, 2019), nine
require ethical approval. were from high-income countries (HICs), and nine were from
LMICs.
Results
To give a general overview of the popularity of each term Perinatal and neonatal mortality indicators were the most
and the availability of literature for each species, the number commonly reported. For perinatal mortality, though there was
of returns for each search is included in Table 3. In terms variation between authors on definitions, most included still-
of species distribution of literature, it is evident that cattle births and measured mortality between birth and up to 24 or 48
Page 7 of 27Gates Open Research 2021, 5:75 Last updated: 19 APR 2021
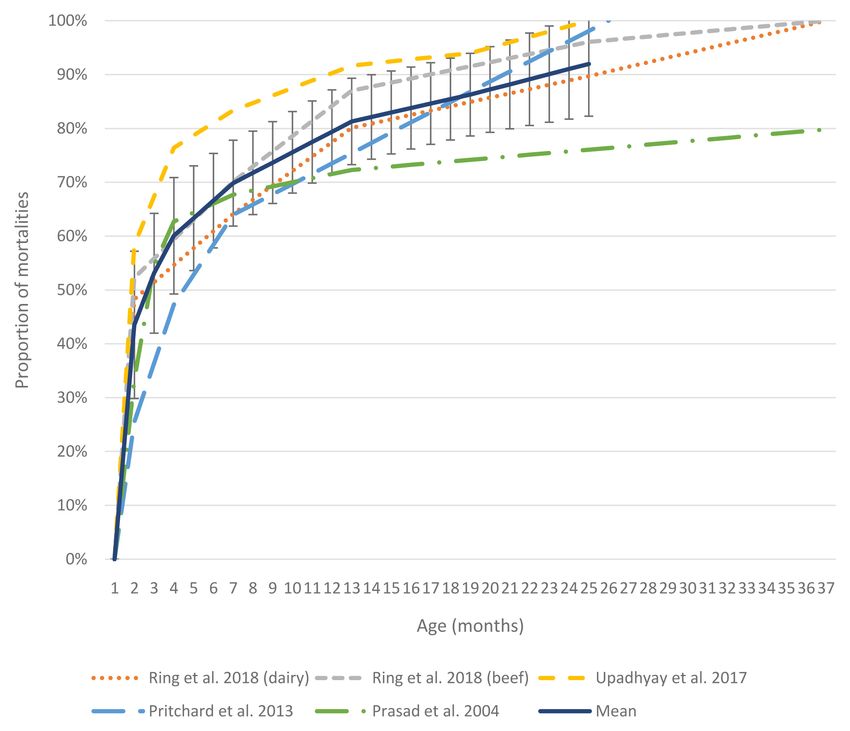
Figure 1. PRISMA flow chart for article screening and inclusion (adapted from Moher et al., 2009). Of the 8604 articles identified by
the literature search, 422 titles were assessed as relevant. Eighty duplicates were removed, before 190 articles were excluded based on their
abstract contents. Sixty-seven articles were excluded on assessing the full text, leaving 85 articles for inclusion into the study.
hours, while only a small number included abortions. There consensus for definitions of neonatal mortality, with most
was similar variation in definitions for neonatal mortality, authors including mortalities from birth to 28 or 39 days of age.
although from birth or 2–3 days through to one month of age Pre-weaning mortality was most reported to be between birth
was common. For older calves, there was a complete lack of to 90 days.
consensus as to what age range indicators included.
There was a dearth of articles reporting on mortality rates for
For sheep, 20 studies were identified, reporting on 16 indica- goats. Only 11 articles were identified, from eight LMICs. These
tors of mortality (Table 6). These articles originated from 10 articles reported on 17 indicators (Table 7). Perinatal, neonatal
countries, including two HICs and eight LMICs and one arti- and pre-weaning mortality rate definitions were reported by
cle having a global scope. Perinatal, neonatal and pre-weaning three authors each. Two of the three authors defined perina-
mortality rates were most commonly reported. The defini- tal mortality as death within the first 48 hours of birth, while
tion of perinatal mortality varied greatly between authors, two authors also defined perinatal mortality as that occurring
with indicators covering death between birth to 24 hours, 48 between 48 hours and one month of age. All three authors report-
hours, seven days, and 14 days. There was a greater level of ing on pre-weaning mortality defined this as mortality occurring
Page 8 of 27Table 5. Definitions for cattle mortality indicators reported in peer-reviewed literature.
Indicator Definition/Rationale Country Income System (if available) Reference
levela
Mortalities from birth to 12 hours The USA HIC Beef Wittum et al., 1994
Stillborn or death within 24 hours after birth Switzerland HIC Dairy and beef, mixture of systems Bleul, 2011
Calf born dead or dying within 24 hours of parturition/Number The UK HIC Dairy Brickell et al., 2009
of calves born
Calves born dead and those that died within 24 hours/Total Germany HIC Dairy Gundelach et al., 2009
number of calves born
Death within 24 hours of calving Ireland HIC Dairy Mee et al., 2008
Death of a full-term calf either during parturition or up to 48 Global - Dairy, mixed systems Cuttance & Laven 2019
Perinatal calf hours
mortality
Abortions, stillbirths and deaths to 48 hours/Total number of Slovenia HIC Dairy Voljc et al., 2019
calves born
Mortalities in first 48 hours post-partum/Number of calvings Switzerland HIC Extensive beef Busato et al., 1997
Death of live-born animals within 48 hours of life Ethiopia LMIC Mixed crop-livestock, pastoral/ Fentie et al., 2020
agropastoral, & market-oriented
urban/peri-urban dairy production
Mortalities from 0-48 hours Switzerland HIC Dairy Mock et al., 2020
Mortalities from 0–2 days of age/overall number of births, and France HIC Dairy Raboisson et al., 2013
Mortalities from 0–2 days of age /number of calf days.
Newborn calf Number of calves born dead or died between 0–6 days/Total Finland HIC Large-scale dairy farms with Seppa-Lassila et al., 2016
mortality number of calves born free-stall barns and either parlour
milking or automated milking
Page 9 of 27
Gates Open Research 2021, 5:75 Last updated: 19 APR 2021Indicator Definition/Rationale Country Income System (if available) Reference
levela
Abortions recorded after mid-gestation, stillbirths, and deaths The USA HIC Dairy Dhakal et al., 2013
within 48 hours
Mortalities from birth to 7 days of age The USA HIC Beef (Research centre) Azzam et al., 1993
Mortalities from birth to 28 days of age/Number of liveborn Bangladesh LMIC Intensive dairy (breeding station) Debnath et al., 1995
calves
Mortalities from birth to 28 days of age/ Number of live births Turkey LMIC Dairy Erdogan et al., 2009
monitored during the neonatal period of the calving season of
interest.
Mortalities from 0 to 28 days of age Global - Beef or dairy Uetake, 2013
Neonatal mortality Mortalities from 12 hours to 45 days of age The USA HIC Beef Wittum et al., 1994
Mortality between 1 – 30 days of age over total number of calves Denmark HIC Unspecified Fuerst-Waltl & Sorenson, 2010
in this age group.
Death of newborn animals between 48 hours and 1 month of Ethiopia LMIC Mixed crop-livestock, pastoral/ Fentie et al., 2020
age agropastoral, & market-oriented
urban/peri-urban dairy production
Mortalities from 2 days to 30 days of age/Total number of calves Slovenia HIC Dairy Voljc et al., 2019
born
Mortalities from 3 days to 1 month of age/overall number of France HIC Dairy Raboisson et al., 2013
births, and Mortalities from 3 days to 1 month of age/number of
calf months.
Postnatal calf Death of a calf from birth to 14 days inclusive/Calf-days-at-risk The HIC Dairy or beef Santman-Berends et al., 2019
mortality Netherlands
Early post-natal Mortality between 1–21 days of age/Total number of calves born Mexico LMIC Dairy Mellado et al., 2014
mortality alive
Mortality of calves up to weaning at 8 weeks of age/Total The UK HIC Intensive dairy production Mahendran et al., 2017
number of calves eligible for study
Pre-weaning calf
mortality Mortalities from 15 to 55 days of age/Total number of ear- The HIC Dairy or beef Santman-Berends et al., 2019
tagged calves, and Mortalities from 15 to 55 days of age/Calf- Netherlands
days-at-risk
Early pre-weaning Mortality of young stock between 1–3 months of age Ethiopia LMIC Mixed crop-livestock, pastoral/ Fentie et al., 2020
mortality agropastoral, & market-oriented
urban/peri-urban dairy production
Young calf Number of deaths in calves aged 21 to 90 days/Number of cow- Estonia HIC Dairy farms, systems not specified Reimus et al., 2020
mortality days in the farm unit belonging to the respective age group
Calf mortality Mortality in unweaned calves 1–5 months of ageb/Animal-days- Estonia HIC Mainly extensive beef production Motus et al., 2018
at-risk
Calf mortality Mortality of a bovine animal born alive and registered dead The UK HIC Not specified Ortiz-Pelaez et al., 2008
before 6 months of age/ The total number of calf-time (days) at
risk.
Page 10 of 27
Gates Open Research 2021, 5:75 Last updated: 19 APR 2021Indicator Definition/Rationale Country Income System (if available) Reference
levela
Rearing period Mortalities from one to six months of age/overall number of France HIC Dairy Raboisson et al., 2013
mortality births, and Mortalities from one to six months of age/number of
calf months.
Calf mortality Number of calves dying between 7 and 180 days/Number of live Finland HIC Large-scale dairy farms with Seppa-Lassila et al., 2016
calves at 7 days of age free-stall barns and either parlour
milking or automated milking
Calf mortality Mortality between 31 – 180 days of age over total number of Denmark HIC Not specified Fuerst-Waltl & Sorenson, 2010
calves in this age group.
Post-weaning Mortality between 8 weeks and 14 months of age/Total number The UK HIC Intensive dairy production Mahendran et al., 2017
mortality of eligible calves less calves that died pre-weaning
Weaned calf Mortalities from 56 days to one year of age/Calf-days-at-risk The HIC Dairy or beef Santman-Berends et al., 2019
mortality rate Netherlands
Young stock Mortalities from birth to weaning age (up to one year for cattle)/ Ethiopia LMIC Mixed crop-livestock, pastoral/ Fentie et al., 2016
mortality Number of live births within that particular study year agropastoral, & market-oriented
urban/peri-urban dairy production
Calf mortality/calf Number of mortalities in the first year of life in liveborn calves/ Kenya LMIC Smallholder dairy Gitau et al., 1994
mortality rate total number of calf-months in the study
Cumulative calf Number of calf mortalities from birth to one year Cote d’Ivoire LMIC Traditional systems Knopf et al., 2004
mortality
Young stock Number of deaths in stock less than one year of age/ Animal Tanzania LMIC Smallholder dairy cattle Swai et al., 2010
mortality days at risk.
Mortality risk was calculated from mortality rate
Calf mortality/calf Death within first year of life, not including abortions Mali LMIC Peri-urban traditional, modern and Wymann et al., 2006
mortality rate station management systems
Late pre-weaning Mortality of young stock between 3-12 months of age Ethiopia LMIC Mixed crop-livestock, pastoral/ Fentie et al., 2020
mortality agropastoral, & market-oriented
urban/peri-urban dairy production
Young animal Number of calves 18 months old or mated) cattle that died Afghanistan LMIC Village production systems Schreuder et al., 1996
mortality (including emergency slaughter) during a one-year observation
period/ number of adult animals present at the start of the year
Youngstock Mortalities in cattle older than 20 months of age/Animal-days- Estonia HIC Mainly extensive beef production Motus et al., 2018
mortality from 20 at-risk
months
Page 11 of 27
Gates Open Research 2021, 5:75 Last updated: 19 APR 2021
a
As classified by The World Bank Group: LMIC = low- and middle-income country; HIC = high-income country. b The authors based this definition on their observation that the first month of life is a high-risk period
for calf mortalityTable 6. Definitions for sheep mortality indicators reported in peer-reviewed literature.
Definition/Rationale Country Income System (if available) Reference
Indicator
levela
Total losses caused by abortions, stillbirths, and Jordan LMIC Extensively managed Aldomy et al., 2009
neonatal mortality (to 14 days of age) in one breeding
season/Sum of aborted, stillborn and lambs born alive
Mortalities within 24 hours of birth/Total number of The UK HIC Multiple Binns et al., 2002
lambs born
Stillbirths and lambs that died on their first day of life Germany HIC Conservation grazing and non- Voigt et al., 2019
seasonal production system
Perinatal mortality
Mortalities within 48 hours of birth Jordan LMIC Transhumant and sedentary systems Al-Khaza’leh et al., 2020
Death of live-born animals within 48 hours of life Ethiopia LMIC Mixed crop-livestock, pastoral/ Fentie et al., 2016
agropastoral, & market-oriented
urban/peri-urban dairy production
Death up to seven days of age Norway HIC Multiple Holmoy & Waage, 2015
Death within 15 days of birth/Total number of lambs India LMIC Semi-intensive and intensive systems Mandal et al., 2007
born on a research station
Early neonatal Liveborn lambs that died between 0-5 days of life, Norway HIC Multiple Holmoy & Waage, 2015
mortality including stillbirths/Total number of liveborn lambs
Mortalities between 0-5 days of age Norway HIC Multiple Holmoy et al., 2012
Death of lambs during the first week of life The UK HIC Multiple Gascoigne et al., 2017
Number of mortalities between birth and 14 days of Jordan LMIC Extensively managed flocks Aldomy et al., 2009
age/Total number of lambs born alive
The number of lambs dying during the first 28 days of N/A N/A N/A Fragkou et al., 2010
life/The total number of lambs born alive
Neonatal mortality Mortalities during the first four weeks of life Turkey LMIC Gokce et al., 2013
Mortalities during the first 28 days of life India LMIC Gowane et al., 2018
Mortalities from birth up to 30 days of age Ethiopia LMIC On-station highland sheep Bekele, et al., 1992
Mortalities between 48 hours and 1 month after birth Jordan LMIC Transhumant and sedentary systems Al-Khaza’leh et al., 2020
Deaths of newborn animals between 48 hours and 1 Ethiopia LMIC Mixed crop-livestock, pastoral/ Fentie et al., 2016
month of age agropastoral, & market-oriented
urban/peri-urban dairy production
Late neonatal Liveborn lambs that died between 6-14 days after Norway HIC Multiple Holmoy & Waage, 2015
mortality birth/Total number of lambs alive at day 6 postpartum
Page 12 of 27
Gates Open Research 2021, 5:75 Last updated: 19 APR 2021Definition/Rationale Country Income System (if available) Reference
Indicator
levela
Mortality from birth to 60 days of age/Number of Jordan LMIC Extensive and semi-extensive Abdelqader et al., 2017
lambs born alive production
Number of lambs born dead or alive but dying within Mexico LMIC Intensively reared lambs Mellado et al., 2016
60 days post-lambing
Number of deaths until 90 days of age/Total births Ethiopia LMIC Smallholder farms using tethered Deribe et al., 2014
Pre-weaning feeding or pastoralist systems
mortality rate
Death between 0-3 months of age/Total number of India LMIC Semi-intensive and intensive systems Mandal et al., 2007
lambs born on a research station
Number of lamb mortalities between 0 – 90 days of Egypt LMIC Barki sheep raised on a research Sallam, 2019
age/Total number of lambs born station
Mortality between 1-3 months of age Jordan LMIC Transhumant and sedentary systems Al-Khaza’leh et al., 2020
Deaths of young stock between 1-3 months of age Ethiopia LMIC Mixed crop-livestock, pastoral/ Fentie et al., 2016
Early pre-weaning
agropastoral, & market-oriented
mortality
urban/peri-urban dairy production
Overall crude Number of deaths/Average number of lambs from birth Jordan LMIC Transhumant and sedentary systems Al-Khaza’leh et al., 2020
mortality rate to weaning age (3 months) during a one-year period
Post-neonatal Mortalities in the first 5-12 weeks of life Turkey LMIC Gokce et al., 2013
mortality
Mean annual birth- Number of deaths of young stock from birth to Ethiopia LMIC Mixed crop-livestock, pastoral/ Fentie et al., 2016
to-weaning young weaning (up to 6 months for sheep) over one year/ agropastoral, & market-oriented
stock mortality Number of live births within a particular year urban/peri-urban dairy production
Death of young stock between 3-6 months of age Ethiopia LMIC Mixed crop-livestock, pastoral/ Fentie et al., 2016
Late pre-weaning
agropastoral, & market-oriented
mortality
urban/peri-urban dairy production
Post-weaning Death between 3-6 months of age/Total number of India LMIC Semi-intensive and intensive systems Mandal et al., 2007
mortality lambs born on a research station
Number of lambs that died aged 12 months or Afghanistan LMIC Not specified Bartels et al. (2017)
Young stock mortality younger in one calendar year/Total number of kids
born in the same calendar year
Number of sheep 12 months old or mated) sheep Afghanistan LMIC Village production systems Schreuder et al., 1996
Annual adult that died (including emergency slaughter) during a
mortality one-year observation period/ number of adult animals
present at the start of the year
a
As classified by The World Bank Group: LMIC = low- and middle-income country; HIC = high-income country
Page 13 of 27
Gates Open Research 2021, 5:75 Last updated: 19 APR 2021Table 7. Definitions for goat mortality indicators reported in peer-reviewed literature.
Indicator Definition/Rationale Country Income System (if available) Reference
levela
Early mortality Mortality during first 48 hours Israel HIC Semi-extensive Rattner et al., 1994
Mortalities within 48 hours of birth Jordan LMIC Transhumant and sedentary systems Al-Khaza’leh et al., 2020
Mixed crop-livestock, pastoral/ Fentie et al., 2020
Death of live-born animals within 48 hours of life Ethiopia LMIC agropastoral, & market-oriented urban/
peri-urban dairy production
Perinatal mortality
Total losses caused by abortions, stillbirths, and Aldomy et al., 2009
neonatal mortality (to 14 days of age) in one
Jordan LMIC Extensively managed
breeding season/Sum of aborted, stillborn and kids
born alive
Number of mortalities between birth and 14 days of Aldomy et al., 2009
Jordan LMIC Extensively managed flocks
age/Total number of kids born alive
Mortality between 48 hours to 1 month of age Jordan LMIC Transhumant and sedentary systems Al-Khaza’leh et al., 2020
Neonatal mortality
Mixed crop-livestock, pastoral/ Fentie et al., 2020
Deaths of newborn animals between 48 hours and
Ethiopia LMIC agropastoral, & market-oriented urban/
1 month of age
peri-urban dairy production
Pre-weaning mortality Mortality between 48 hours and 70 days Israel HIC Semi-extensive Rattner et al., 1994
El-Hassan El-Abid &
Abortion rate + pre-weaning (Indicator Definition/Rationale Country Income System (if available) Reference
levela
Mean annual birth-to- Number of deaths of young stock (up to 6 months Mixed crop-livestock, pastoral/ Fentie et al., 2020
weaning young stock for goats) in the study for one year/Number of live Ethiopia LMIC agropastoral, & market-oriented urban/
mortality births within that particular study year peri-urban dairy production
Post-weaning mortality Mortality between 70 – 180 days Israel HIC Semi-extensive Rattner et al., 1994
Mixed crop-livestock, pastoral/ Fentie et al., 2020
Late pre-weaning
Death of young stock between 3–6 months of age Ethiopia LMIC agropastoral, & market-oriented urban/
mortality
peri-urban dairy production
Number of kids that died aged 12 months or Bartels et al., (2017)
Young stock mortality younger in one calendar year/Total number of kids Afghanistan LMIC Not specified
born in the same calendar year
Number of goats 12 months old or mated) goats Schreuder et al., 1996
that died (including emergency slaughter) during
Annual adult mortality Afghanistan LMIC Village production systems
a one-year observation period/ number of adult
animals present at the start of the year
Mortality rate of Deaths in >18 month-old males/ Animal- Chikagwa-Malunga &
Malawi LMIC Crop/livestock smallholder farms
breeding males days*365*100 Banda, 2006
a
As classified by The World Bank Group: LMIC = low- and middle-income country; HIC = high-income country
All studies are from low- and -middle income countries practicing mainly traditional forms of production.
Page 15 of 27
Gates Open Research 2021, 5:75 Last updated: 19 APR 2021Gates Open Research 2021, 5:75 Last updated: 19 APR 2021 up to three months of age, although two authors measured culling rates in dairy calves and replacement heifers in China this from birth, while one author measured this from one to 60 months of age. Frequency of mortality was highest month of age. in the
Table 8. Characteristics of cattle studies included in age distribution of mortality graphing.
Reference Country Country income Breed Production system Study selection criteria Total number of
categorya characteristics animals in study
Achard & Chanono, 1997 Niger LMIC Azaouak Zebu Pasture-based breeding station Institution records 1,646
bounded by study dates
Bunter et al., 2014 Australia HIC Brahman and Tropical Composite Extensively managed beef stations Institution records 9,296
bounded by study dates
Debnath et al., 1990 Bangladesh LMIC Mostly Bos Indicus breeds Not specified Institution records 15,840
bounded by study dates
Debnath et al., 1995 Bangladesh LMIC Multiple, although Bos Indicus Intensive dairy breeding station Institution records 8,623
and Bos Taurus crossbreeds most bounded by study dates
common
Fuerst-Waltl & Fuerst, 2010 Austria HIC Holstein Not specified; likely a mix of Institution records 86,249
production systems as data from bounded by study dates
the Danish Cattle Database
Ganaba et al., 2002 Burkina Faso LMIC Zebu, Baoule and their crosses Transhumant and sedentary mixed Convenience sample 901
crop-livestock
Gulliksen et al., 2009 Norway HIC Multiple dairy breeds Not specified Institution records 289,038
bounded by study dates
Kudi et al., 1998 Nigeria LMIC Not specified Traditional agropastoral Convenience sample 277
Motus et al., 2018 Estonia HIC Mixed beef breeds Extensive pasture-based Institution records 21,075
bounded by study dates
Prasad et al., 2004 India LMIC Sahiwal Zebu and Tharparkar Zebu Organised dairy herd reared at a Institution records 1,115
and their crosses with Brown Swiss research institute bounded by study dates
and Holstein Friesians
Pritchard et al., 2013 The UK HIC Holstein-Friesian Not specified Institution records 112,163
bounded by study dates
Ring et al., 2018 Ireland HIC Multiple dairy breeds Not specified; likely a mix of Institution records 11,256,112
production systems as data from bounded by study dates
the Irish Cattle Breeding Federation
database
Ireland HIC Multiple beef breeds Not specified; likely a mix of Institution records 9,839,949
production systems as data from bounded by study dates
the Irish Cattle Breeding Federation
database
Svensson et al., 2006 Sweden HIC Multiple dairy breeds Intensive production Institution records 8,962
bounded by study dates
Upadhyay et al., 2017 India LMIC Sahiwal Intensive dairy production at Institution records 914
research institute bounded by study dates
Wymann et al., 2006 Mali LMIC Zebu, N’Dama, and crossbreeds with Per-urban traditional agro- Convenience sample 784
European breeds pastoralism, modern, and station-
managed systems
a
Page 17 of 27
Gates Open Research 2021, 5:75 Last updated: 19 APR 2021
As classified by The World Bank Group: LMIC = low- and middle-income country; HIC = high-income country.Gates Open Research 2021, 5:75 Last updated: 19 APR 2021
Figure 2. Cumulative mortality in cattle from birth to three years of age. Four included studies presented data on mortality
distribution by age past 12 months of age. The black line shows the mean cumulative mortality with standard deviation bars.
In smallholder mixed crop-livestock systems in Kenya, Thumbi Risk of bias of included studies. For the 15 studies that
et al. (2013) found three periods where risk of cattle mortal- published data sets showing age distribution of mortality in cat-
ity was higher: the neonatal period, immediately after birth; tle, risk of bias was assessed using a tool refined by Hoy et al.
between 150–190 days, when maternal antibody levels are (2012) (Table 10). All seven studies from HICs and five of
waning; and towards one year of age, when calves are weaned. the studies from LMICs utilised data from national registries,
Knopf et al. (2014) reported that all deaths occurred in the first or research/breeding institutes, therefore random participant
210 days, while Pannwitz (2015) recorded the highest mortal- selection and non-response bias was unable to be assessed. It is
ity rates in calves less than six months of age, then a decreased possible that research or breeding station data may not be a true
mortality rate between 6–24 months, and an uptick after representation of realities in the field. Although some herds were
2 years of age. managed as per the local normal, some stations had much more
intensive management than would be found in surrounding
In contrast to these findings, two authors, Debnath et al. areas. For the remaining three LMIC studies, these were
(1990) (Figure 3) and Gitau et al. (1994) reported that no conducted in the field using convenience sampling, based on
strong age patterns were seen in calf mortalities, while farms being in accessible locations, being the site of previous
Seppa-Lassila et al. (2016) found that mean mortality risk in studies, and willingness to participate by farmers. Convenience
large-scale Finnish dairy cattle was 5.2 ± 2.3% in calvesTable 9. Risk of bias of studies included in the age distribution of mortality study, using the Risk of bias tool (Hoy et al., 2012).
Study 1. Was the study’s 2. Was the 3. Was some 4. Was the 5. Were data 6. Was an 7. Was the study 8. Was the 9. Was the 10. Were the 11. Summary
target population a sampling frame form of random likelihood of collected acceptable case instrument same mode length of numerator(s) and item on the
close representative a true or close selection used non-response directly from definition used that measured of data the shortest denominator(s) overall risk of
of the national representation to sample the bias minimal? the subjects? in the study? the parameter collection prevalence for the parameter study bias^
population in relation of the target selection, or, of interest used for all period for the of interest
to relevant variables? population? was a census shown to have subjects? parameter appropriate?
undertaken? reliability and of interest
validity (if appropriate?
necessary)?
Achard & Chanono, 1997 Yes Yes N/A Yes Yes Yes Yes Yes Yes Yes Low
Bunter et al., 2014 Yes Yes N/A Yes Yes Yes Yes Yes Yes Yes Low
Debnath et al., 1990 Yes Yes N/A Yes Yes Yes Yes Yes Yes Yes Low
Debnath et al., 1995 Yes Yes N/A Yes Yes Yes Yes Yes Yes Yes Low
Fuerst-Waltl & Fuerst, Yes Yes N/A Yes Yes Yes Yes Yes Yes Yes Low
2010
Ganaba et al., 2002 Yes No No Yes Yes Yes Yes Yes Yes Yes Moderate
Gulliksen et al., 2009 Yes Yes N/A Yes Yes Yes Yes Yes Yes Yes Low
Kudi et al., 1998 Yes No No Yes Yes Yes Yes Yes Yes Yes Moderate
Motus et al., 2018 Yes Yes N/A Yes Yes Yes Yes Yes Yes Yes Low
Prasad et al., 2004 Yes Yes N/A Yes Yes Yes Yes Yes Yes Yes Low
Pritchard et al., 2013 Yes Yes N/A Yes Yes Yes Yes Yes Yes Yes Low
Ring et al., 2018 Yes Yes N/A Yes Yes Yes Yes Yes Yes Yes Low
Svensson et al., 2006 Yes Yes N/A Yes Yes Yes Yes Yes Yes Yes Low
Upadhyay et al., 2017 Yes Yes N/A Yes Yes Yes Yes Yes Yes Yes Low
Wymann et al., 2006 Yes No No Yes Yes Yes Yes Yes Yes Yes Moderate
Yes = low risk; No = high risk. ^ Low risk: Further research is very unlikely to change our confidence in the estimate. Moderate risk: Further research is likely to have an important impact on our confidence
in the estimate and may change the estimate. High risk: Further research is very likely to have an important impact on our confidence in the estimate and is likely to change the estimate.
Page 19 of 27
Gates Open Research 2021, 5:75 Last updated: 19 APR 2021Gates Open Research 2021, 5:75 Last updated: 19 APR 2021
Figure 3. Cumulative mortality in calves between 0 - 12 months of age. This graph shows includes 15 studies reporting mortality
distribution by age for at least the 12 months of age. The black line shows the mean cumulative mortality with standard deviation bars. On
average, 86% of mortalities in the first 12 months had already occurred by six months of age.
better management practices, or who have better access to was too great to allow direct comparisons. In sheep, two papers
veterinary advice or treatments. Overall, the risk of bias in noted that stillbirth and perinatal mortality rates were higher
studies originating from HICs was assessed to be low, and than at any age (Holmoy & Waage, 2015); Voigt et al., 2019),
moderate - though difficult to avoid due to constraints on how while other authors report the largest proportion of mortali-
research can be undertaken - in studies originating from LMICs. ties occurred within 24 hours of birth (Binns et al., 2002), or
Other types of bias, such as reporting bias, were not reported within first week (Gokce & Erdogan, 2009; Gokce et al., 2013;
by studies and could not be assessed. Khan et al., 2006). Holmoy et al. (2017) reported that 80% of
neonatal lamb mortalities occurred within the first two days
Mortality by age in small ruminants. For both sheep and goats, of life. Sallam (2019) found that average mortality risk for
the variation in the time periods covered by different studies Barki sheep reared at a research station in Egypt was 4.6% for
Page 20 of 27Table 10. Proportion of mortalities in calves under 15 months, by age group reported by respective authors.
Reference Days 0-2 2-7 7-14 14-28
Months 2 3 4 5 6 7 8 9 10 11 12 13 14 15
Achard & Chanono, 1997 36% (51) 51% (72) 4% (6) 8% (11)
Bunter et al., 2014 66% (589) 13% (116) 9% (80) 12% (107) 0%
Debnath et al., 1990 9.9% (48) 17.8% (86) 28.1% (136) 44.2% (214)
Debnath et al., 1995 24.2% (277) 9.8% (113) 8% (92) 15% (172) 12% (141) 7% (84) 5% (52) 3% (36) 3% (32) 3% (30) 3% (35) 3% (33) 2% (20) 1% (17) 1% (12)
Fuerst-Waltl & Fuerst,
54% (1596) 37% (1095) 9% (278)
2010a
Ganaba et al., 2002 21% (10) 26% (12) 19% (9) 11% (5) 11% (5) 6% (3) 4% (2) 0% (0) 0% (0) 0% (0) 0% (0) 2% (1) 0% (0)
Gulliksen et al., 2009 24% (2515) 18% (1937) 47% (4971) 12% (1243)
Kudi et al., 1998 34% (45) 24% (31) 8% (11) 5% (7) 5% (6) 5% (6) 4% (5) 4% (5) 2% (3) 5% (6) 2% (3) 2% (3)
Motus et al., 2018 2% (12) 15% (116) 21% (161) 16% (120) 15% (115) 7% (50) 5% (39) 3% (20) 2% (17) 3% (26) 4% (32) 2% (17) 2% (16) 1% (9) 2% (16)
Svensson et al., 2006 40% (154) 29% (113) 17% (65) 15% (57)
Wymann et al., 2006 23% (21) 9% (8) 24% (22) 25% (23) 20% (19)
The mortality risk is presented as a percentage (number of deaths over the number of animals recorded in this age group over the defined study period), with the number of mortalities included in brackets.
Cumulative mortality incidence may give a total of just under or just over 100% due to rounding. This table shows the variation between studies in age groups selected for study.
a
Deaths occurring between birth and 48 hours were considered as stillbirths by the authors and are not included in the study.
Page 21 of 27
Gates Open Research 2021, 5:75 Last updated: 19 APR 2021You can also read