ENERGY IN THE RESIDENTIAL SECTOR - 2018 Report - SEAI
←
→
Page content transcription
If your browser does not render page correctly, please read the page content below
ENERGY IN THE
RESIDENTIAL SECTOR
2018 Report


ENERGY IN THE RESIDENTIAL SECTOR       2018 Report

ENERGY IN THE
RESIDENTIAL SECTOR
2018 Report

April 2018

                                   1
ENERGY IN THE RESIDENTIAL SECTOR 2018 Report
Ireland’s Homes in the 21st Century
The residential sector accounts for a quarter of the energy used in Ireland, and is also responsible
for a quarter of the energy-related CO2 emissions. From 2006-2014 there were significant
reductions in the amount of emissions from homes, but since 2014 this trend has reversed and
carbon dioxide emissions have started to increase. Irish homes emit almost 60% more CO2 than
the average EU home.
Ireland’s growing population means the number of dwellings is increasing with
1.7 million households in 2016
2000 – 2016
25% 15% 39% 60%
increase in population increase in average floor increase in number increase in total floor area
area across all homes of occupied houses
2007
Car 2004
b on D 2006
ioxi 2003 2005
de E 11.7 MtCO2
mis
2002 sion
s
2008
18.5 MWh
per home
25%
Reduction
in CO2 from
2006 to 2014
Energy use in an average
Irish home 2016 Through a combination of:
Space heating 61% • Energy efficiency improvements
Water heating 19% • High energy prices
Lighting and appliances 17% • Reduced disposable incomes
Cooking 3%
2ENERGY IN THE RESIDENTIAL SECTOR 2018 Report
In 2016, Irish
Irish household final
energy usage 2016 households
Oil 37%
consumed
2.7 Million
tonnes of oil
equivalent
Electricity
Gas
Coal
25%
21%
7%
2.7 Mtoe of
energy
emitting
Peat 7%
Renewables 3%
In 2015, the average
9.7
MtCO2
Irish home used
7% more 7%
energy and costing households
than the average EU home
€3.4 billion
It also emitted
58% more CO2
due to greater use of high-carbon
fuels including oil, coal and peat
6.7%
2009
Increase
2010 2011
in CO2 from
2014 to 2016
Potential reasons include a fall in oil
prices combined with an increase
in disposable incomes leading to
higher energy consumption.
375,000
Homes
2013
2012
2015
received government 2014
2016
9.1 MtCO2
grants for energy 9.7 MtCO2
efficiency measures
between 2000 and 2016.
3ENERGY IN THE RESIDENTIAL SECTOR 2018 Report
Sustainable Energy Authority of Ireland
SEAI is Ireland’s national energy authority investing in, and delivering, appropriate, effective and sustainable solutions to
help Ireland’s transition to a clean energy future. We work with Government, homeowners, businesses and communities
to achieve this, through expertise, funding, educational programmes, policy advice, research and the development of
new technologies. SEAI is part-financed by Ireland’s EU Structural Funds Programme co-funded by the Irish Government
and the European Union.
Energy Policy Statistical Support Unit (EPSSU)
SEAI has a lead role in developing and maintaining comprehensive national and sectoral statistics for energy production,
transformation and end-use. This data is a vital input in meeting international reporting obligations, for advising
policymakers and informing investment decisions. Based in Cork, EPSSU is SEAI’s specialist statistics team. Its core
functions are to:
•• Collect, process and publish energy statistics to support policy analysis and development in line with national needs
and international obligations;
•• Conduct statistical and economic analyses of energy services sectors and sustainable energy options;
•• Contribute to the development and promulgation of appropriate sustainability indicators.
Acknowledgements
SEAI gratefully acknowledges the cooperation of all the organisations, agencies, energy suppliers and distributors that
provided data and responded to questionnaires throughout the year.
© Sustainable Energy Authority of Ireland
Reproduction of the contents is permissible provided the source is acknowledged.
4ENERGY IN THE RESIDENTIAL SECTOR 2018 Report
Table of Contents
1 Residential Sector Energy Demand and Related Carbon Emissions 8
1.1 Energy 8
1.2 Carbon Dioxide Emissions 12
1.2.1 Non Emissions Trading Scheme Carbon Emissions 13
1.3 Residential Sector Energy by End-Use 14
2 Underlying Factors Influencing Residential Energy Demand 16
2.1 Demographics 16
2.2 The Housing Stock 17
2.2.1 Number of Dwellings 17
2.2.2 New Dwelling Completions 18
2.2.3 Occupier Status 19
2.2.4 Type of Dwelling 20
2.2.5 Estimated Floor Area 22
2.2.6 Building Regulations and Period of Construction 24
2.2.7 Energy Efficiency Retrofit Programmes 25
2.2.8 Fuels Used for Space Heating 26
2.2.9 Building Energy Rating (BER) Assessments 29
2.3 Energy Prices 33
2.3.1 Household Electricity and Gas Prices 33
2.3.2 Household Oil Prices 34
2.3.3 SEAI Domestic Fuel Price Comparison 34
2.4 Residential Expenditure on Energy 35
2.4.1 Energy Poverty 37
2.5 Weather Effects 39
2.5.1 Degree Days Over Heating Season Versus Over Full Year 39
2.6 Electric Appliances 41
2.6.1 Appliance Ownership 41
2.6.2 Appliance Efficiency 42
3 Energy Efficiency and Carbon Intensity 44
3.1 Energy Intensity 44
3.2 Energy Efficiency Indicators 47
3.3 Carbon Intensity 49
3.3.1 Carbon Dioxide Emissions per Unit of Energy 49
3.3.2 Carbon Dioxide Emissions per Dwelling 51
4 International Comparison 52
5 Areas for improvement in data collection 56
Sources 57
Glossary of Abbreviations 59
Energy Units 59
Appendix 1: Residential Sector Final Energy Use 60
Appendix 2: Policy Context 61
Appendix 3: Model of Residential Energy End-Use 63
Appendix 4: Production of Residential Energy Use Statistics 65
Appendix 5: Building Energy Ratings 67
5ENERGY IN THE RESIDENTIAL SECTOR 2018 Report
Table of Figures
Figure 1: Residential sector energy balance, 2016 8
Figure 2: Residential sector final energy demand, 1990 to 2016 9
Figure 3: Residential sector final energy demand (weather-corrected) split by fuel type, 1990 to 2016 11
Figure 4: Residential energy-related CO2 emissions and CO2 intensity, 1990 to 2016 12
Figure 5: Energy-related non-ETS CO2 emissions split by sector, and for the residential sector split by fuel type, 2016 13
Figure 6: Residential energy by fuel type, split by end-use, 2016 14
Figure 7: Residential energy by end-use, split by fuel type, 2016 15
Figure 8: Private households in permanent housing units, 1991 to 2016 17
Figure 9: New dwellings completed by type, 1994 to 2016 18
Figure 10: Private households in permanent housing units by ownership of dwelling, 1991 to 2016 19
Figure 11: Distribution of population by tenure status in the EU, 2015 20
Figure 12: Private households in permanent housing units by type of accommodation and urban or rural areas 21
Figure 13: Distribution of population by dwelling type in EU member states, 2015 22
Figure 14: Average floor areas of new dwellings granted planning permission, 2001 to 2016 23
Figure 15: Index of average floor area, total floor area and number of occupied dwellings, 2002 to 2016 24
Figure 16: Private households in permanent housing units by period of construction, 2016 25
Figure 17: Central heating by fuel type 26
Figure 18: Changes in the numbers of households between the 2011 and 2016 census split by central heating system fuel type,
for the counties with the largest reported increase in peat central heating. 27
Figure 19: Changes in the numbers of households between the 2011 and 2016 census split by central heating system fuel type,
for the counties with the largest reported decrease oil central heating. 28
Figure 20: Private households in permanent housing units by central heating fuel type and urban or rural area. 28
Figure 21: Private households in permanent housing units by central heating fuel type and by type of dwelling 29
Figure 22: Distribution of BERs in the BER database and for the national housing stock, 2016 29
Figure 23: Distribution of BERs in the BER database by period of construction 30
Figure 24: Distribution of BERs for all grant aided dwellings in the BER database 31
Figure 25: Distribution of BERs in the BER database split by building regulations 31
Figure 26: Dwellings in the BER database split by main space heating fuel and building regulation 32
Figure 27: Household gas prices, 2008 to 2016 33
Figure 28: Household electricity prices, 2008 to 2016 33
Figure 29: Household heating oil prices, 2000 to 2016 34
Figure 30: SEAI domestic fuel price comparison, 2000 to 2016 34
Figure 31: Personal expenditure on energy and on goods and services, 2000 to 2016 35
Figure 32: Average spend on energy per permanently occupied dwelling, 2000 to 2016 36
Figure 33: Weekly expenditure on energy as a proportion of disposable income, Household Budget Survey years 36
Figure 34: Energy-related deprivation indicators in the annual Survey on Income and Living Conditions, 2006 to 2015 38
Figure 35: Deviation from average heating degree-days and resulting weather adjustment, 1990 to 2016 39
Figure 36: Percentage ownership of electrical appliances, Household Budget Survey years 41
Figure 37: Percentage ownership of electrical appliances by income decile, 2015 Household Budget Survey 42
Figure 38: Average energy consumption of new appliances sold in a selection of EU Countries, 2004 to 2015 43
Figure 39: Number of dwellings, total floor area and residential final energy demand, indexed to 2000, 2000 to 2016 44
Figure 40: Energy consumption per dwelling, 2000 to 2016 45
Figure 41: Energy efficiency improvement in households, 2000 to 2015 47
Figure 42: Decomposition of household energy use in Ireland, 2000 to 2015 48
Figure 43: Carbon dioxide emissions per unit of energy used in the residential sector, 2000 to 2016 49
Figure 44: CO2 emissions per unit of useful heat energy delivered at high and low conversion efficiencies 50
Figure 45: Energy-related carbon emissions per dwelling, weather-corrected, 2000 to 2016 51
Figure 46: Energy usage per dwelling weather-corrected, 2000 to 2016 52
Figure 47: Average floor area per dwelling for EU member states, 2000 and 2014 53
Figure 48: Residential energy use per square metre, weather-corrected, for Ireland and the EU28, 2000 to 2015 53
Figure 49: Residential CO2 emissions per dwelling, weather-corrected, Ireland and the EU28, 2000 to 2015 54
Figure 50: Residential final energy fuel mix, 2015 54
Figure 51: CO2 emissions per kWh of grid electricity for EU member states, 2000 and 2014 55
6ENERGY IN THE RESIDENTIAL SECTOR 2018 Report
Table of Tables
Table 1: Final energy consumption by sector 10
Table 2: Residential sector final energy consumption, weather-corrected, by fuel type 11
Table 3: Residential sector final energy consumption, by fuel type 11
Table 4: Energy-related CO2 emissions by sector 12
Table 5: Energy-related CO2 emissions in the residential sector 13
Table 6: Residential final energy by fuel type and end-use, 2016 14
Table 7: Rep. of Ireland population and average number of persons per household, census years 1991 to 2016 16
Table 8: Private households in permanent housing units, 1991 to 2016 17
Table 9: Occupancy status of dwellings, 2011 and 2016 18
Table 10: Private households in permanent housing units by ownership of dwelling, census years 1991 to 2016 20
Table 11: Private households in permanent housing units by type of accommodation and period of construction 21
Table 12: Private households in permanent housing units by type of accommodation and rural or urban areas 21
Table 13: Number and average floor area of residential units granted planning permission 23
Table 14: Average floor area per dwelling and total floor area of dwelling stock 24
Table 15: Private households in permanent housing units by period of construction 25
Table 16: Central heating by fuel type 26
Table 17: Changes in central heating by fuel type between 2011 and 2016 Census 27
Table 18: Percentage ownership of electrical appliances, Household Budget Survey years 41
Table 19: Residential energy consumption and CO2 emissions per dwelling 45
Table 20: Residential energy consumption and CO2 emissions per square metre 46
Table 21: CO2 emissions per unit of useful heat energy delivered at high and low conversion efficiencies 50
Table 22: Residential energy consumption and CO2 emissions per dwelling 51
7ENERGY IN THE RESIDENTIAL SECTOR 2018 Report
1 Residential Sector Energy Demand and Related
Carbon Emissions
This section presents statistics on energy use in the residential sector, showing trends in energy demand and
associated carbon emissions. Through monitoring these trends, it is possible to track the contribution of the sector to
carbon reduction and renewable energy targets. We also present, for the first time, an estimate of the breakdown of
Ireland’s residential energy by end-use; such as space heating, water heating and cooking. Splitting energy use data
into end-uses provides more detailed insights into how we use energy in our homes.
1.1 Energy
Figure 1 shows Ireland’s residential sector energy balance for 2016 as an energy flow diagram. Fuel inputs, which are on
the left, totalled 3,560 ktoe (kilotonnes of oil equivalent) and include the fuels1 used to generate the electricity consumed
by the sector. This is referred to as the primary energy use. The energy transformation losses, which were mostly from
electricity generation, amounted to 808 ktoe, which was 23% of residential primary energy use. Final energy consumption2
is illustrated on the right hand side of the graph, and was 2,704 ktoe in 2016. This represents 23% of Ireland’s total final
energy use.
Figure 1: Residential sector energy balance, 2016
Renewables 314 ktoe
Oil 1,041 ktoe
Briquetting Refining loss Gas transmission loss
11 ktoe 11 ktoe 14 ktoe Electricity transmission loss
78 ktoe
Electricity transformation
loss 693 ktoe
Consumption of Residential
Natural Gas
Primary Energy
1,295 ktoe
3,560 ktoe
Oil 1,005
ktoe
Residential Total
Final Consumption
2,704 ktoe Electricity
677 ktoe
Coal 518 ktoe
Natural G
as 563 kt
oe
Peat 369 ktoe Peat & Br
iquettes
Coal 179 179 ktoe
Electricity imports 23 ktoe ktoe
Renewab
les 83 ktoe
Note: Some statistical and rounding differences may exist between inputs and outputs.
Source: SEAI
Figure 2 shows the trend for residential sector final energy consumption between 1990 and 2016. Variations in weather
from year to year, in particular temperature variations, affect energy demand, particularly for space heating. It is possible
to correct for the effect of annual weather variations using the method of degree-days, which is explained further in
Section 2.5. Figure 2 shows the trend in residential final energy after weather-correction has been applied. Accounting for
weather variations, residential energy demand decreased every year between 2007 and 2012, but grew in 2013, 2015 and
2016. Between 2014 and 2016, overall residential sector final energy consumption increased by 6.5% (3.2% per annum)
when adjusted for weather effects.
1 The total of each individual fuel used for electricity generation and oil refining is apportioned to each end-use sector according to the final consumption
of electricity and oil by that sector.
2 Final Energy is essentially Primary Energy less the quantities of energy required to transform and distribute primary sources, such as crude oil into forms
suitable for use by consumers e.g. refined oils and electricity.
8ENERGY IN THE RESIDENTIAL SECTOR 2018 Report
Plausible reasons for the overall decrease in residential energy use between 2007 and 2014 include a combination of:
•• Improved thermal efficiency of new dwellings and existing dwellings that were upgraded.
•• Reduced household incomes and expenditure, due to the economic downturn
•• High energy prices
•• Fuel switching from traded energy such as oil and gas to un-traded energy, such as wood and sod peat, which are not
well accounted for in the national statistics
Plausible reasons for the increase in residential energy use in 2015 and 2016 include:
•• Increasing household incomes and expenditure
•• Reduced energy price, particularly of oil
•• Fuel switching from un-traded wood and peat to oil and gas
Section 2 of this report provides insights into these underlying drivers. More data and research is required to fully
understand the reasons for the recent increase in household energy use, and to allow better predictions of future trends.
Figure 2: Residential sector final energy demand, 1990 to 2016
3,400
3,200
3,000
Final Energy (ktoe)
2,800
2,600
2,400
2,200
2,000
Residential Final Energy Demand Weather Corrected Residential Final Energy Demand
Source: SEAI
Table 1 shows data on final energy consumption for each sector of the economy in 1990, 2005 and 2016. In 1990 the
residential sector was the largest energy-using sector but was surpassed by the transport sector in 1992. From 1992 to
2016, the residential sector had the second largest final energy demand after the transport sector, and in 2016 it accounted
for 23% of final energy demand. Apart from the agriculture sector, which is small in energy terms, the residential sector
experienced the smallest growth between 1990 and 2016.
Between 2014 and 2016, overall residential sector final energy consumption
increased by 6.5% when adjusted for weather.
9ENERGY IN THE RESIDENTIAL SECTOR 2018 Report
Table 1: Final energy consumption by sector
Average annual growth
Quantity (ktoe) Shares % Growth %
rates %
1990 2005 2016 1990 2005 2016 ‘90 – ‘16 ‘05 - ‘16 ‘90 – ‘05 ‘05 – ‘16 2016
Transport 2,019 5,082 4,947 28% 40% 42% 145% -3% 6.3% -0.2% 3.4%
Residential 2,258 2,940 2,704 31% 23% 23% 20% -8% 1.8% -0.8% 1.2%
Industry 1,720 2,633 2,445 24% 21% 21% 42% -7% 2.9% -0.7% 1.6%
Services 972 1,569 1,357 13% 12% 12% 40% -14% 3.2% -1.3% 7.8%
Agriculture 280 383 226 4% 3% 2% -19% -41% 2.1% -4.7% 2.7%
Total 7,249 12,607 11,680 61% -7% 3.8% -0.7% 3.0%
Source: SEAI
The residential sector had the second largest final energy demand in 2016,
after the transport sector.
Figure 3 and Table 2 show residential final energy use split by fuel type and corrected for weather for the period 1990 to
2016. Weather-correction is only applied to the portion of each fuel that is estimated to be used for heating. Table 3 shows
residential final energy use without weather-correction for reference.
Between 1990 and 2000, there was a clear switch away from solid fuels such as coal and peat, which would traditionally
have been burned in open fires, towards oil and gas, typically used in central heating systems. In the latter part of the
period from 2005 to 2016, the fuel shares became more stable, with a gradual increase in the shares of electricity and gas
and a continuing, though gradual, decline in coal and peat use.
Between 1990 and 2005, the use of wood logs declined, along with the decline of coal and peat use for open fires. In the
period 2005 to 2016, renewables grew significantly, primarily due to increasing use of wood pellets.
Looking at the period 2007 to 2014, overall weather-corrected residential energy use declined by 18% or 556 ktoe. The
majority of the reduction was from oil, which fell by 28% or 334 ktoe, followed by gas, which fell by 17% or 106 ktoe.
Between 2014 and 2016, overall weather-corrected residential energy use increased by 6.5% or 162 ktoe. The majority of
the increase was from oil use, which increased 146 ktoe, or 17%. In comparison gas increased by 26.7 ktoe or 5.1%. One
potential reason for the higher fluctuation in oil use, relative to gas, may be the greater increase in oil price, relative to gas,
in the period 2010 to 2015. Another factor may be that the majority of oil-fired dwellings are located in rural areas where
there may be greater opportunity for fuel switching to solid fuels. Data from the 2016 census, discussed further in Section
2.2.8, suggests that there was some shift from oil to solid fuel heating systems between the 2011 and 2016 census.
There is a high degree of uncertainty on the amounts of untraded fuels, for example wood and sod peat used in the
residential sector, as there are currently no reliable sources of data for these fuels. However, it is estimated that untraded
wood and sod peat combined accounted for just 1.2% of residential total final energy consumption in 2016. Appendix 4
provides more information on how statistics on residential energy use are produced.
It is also notable that total electricity consumption peaked in 2008 and has reduced slightly to 2016, having more than
doubled between 1990 and 2008. There is some evidence of a levelling off in the growth of large household appliances
and an increase in appliance efficiency, as discussed in 2.6. Other contributing factors could be increased electricity
prices, a reduction in electricity used for space and water heating due to greater thermal efficiency or fuel switching.
Improved data on electricity use in households and on appliance ownership and use, specific to Ireland, would add to our
understanding of this trend.
Household electricity consumption more than doubled between 1990 and
2008, but reduced between 2008 and 2016
10ENERGY IN THE RESIDENTIAL SECTOR 2018 Report
Figure 3: Residential sector final energy demand (weather-corrected) split by fuel type, 1990 to 2016
1,400
1,200
1,000
Final Energy (ktoe)
800
600
400
200
0
Coal Peat Oil Natural Gas Renewables Electricity
Source: SEAI
Table 2: Residential sector final energy consumption, weather-corrected, by fuel type
Residential Final
Average annual growth
Energy Quantity (ktoe) Shares % Growth %
rates %
(Weather-Corrected)
1990 2005 2016 1990 2005 2016 ‘90 – ‘16 ‘05 - ‘16 ‘90 – ‘05 ‘05 – ‘16 2016
Coal 664 252 176 29% 9% 7% -73% -30% -6.3% -3.2% -9.3%
Peat 769 280 194 34% 10% 7% -75% -31% -6.5% -3.3% 2.6%
Oil 413 1,173 991 18% 40% 37% 140% -15% 7.2% -1.5% 9.9%
Natural Gas 124 622 555 6% 21% 21% 346% -11% 11.3% -1.0% 6.0%
Direct Fossil Fuels
1,971 2,326 1,917 87% 79% 71% -3% -18% 1.1% -1.7% 6.0%
Use (Total)
Renewables 47 23 82 2% 1% 3% 73% 252% -4.6% 12.1% 13.8%
Electricity 359 648 676 16% 22% 25% N/A 4% 4.0% 0.4% 0.6%
Total 2,378 2,998 2,675 105% 102% 99% 13% -11% 1.6% -1.0% 4.8%
Source: SEAI
Table 3: Residential sector final energy consumption, by fuel type
Residential Final Average annual growth
Quantity (ktoe) Shares % Growth %
Energy rates %
1990 2005 2016 1990 2005 2016 ‘90 – ‘16 ‘05 - ‘16 ‘90 – ‘05 ‘05 – ‘16 2016
Coal 626 246 179 28% 8% 7% -71% -27% -6.0% -2.9% -13.3%
Peat 725 273 197 32% 9% 7% -73% -28% -6.3% -2.9% -1.9%
Oil 389 1,145 1,005 17% 39% 37% 158% -12% 7.5% -1.2% 5.1%
Natural Gas 117 607 563 5% 21% 21% 380% -7% 11.6% -0.7% 1.4%
Direct Fossil Fuels Use 1,857 2,271 1,944 82% 77% 72% 5% -14% 1.3% -1.4% 1.4%
Renewables 45 23 83 2% 1% 3% 86% 266% -4.4% 12.5% 8.8%
Electricity 356 646 677 16% 22% 25% 90% 5% 4.0% 0.4% -0.1%
Total 2,258 2,940 2,704 20% -8% 1.8% -0.8% 1.2%
Source: SEAI
11ENERGY IN THE RESIDENTIAL SECTOR 2018 Report
1.2 Carbon Dioxide Emissions
Table 4 shows data on energy-related CO2 emissions for each sector of the Irish economy in 1990, 2005 and 2016. From
1990 to 1999, the residential sector was the largest source of energy-related CO2 emissions in Ireland. From 2001 to 2016,
the residential sector was the second largest source of energy-related CO2 emissions after the transport sector. In 2016,
transport accounted for 37% of national energy-related CO2 emissions, with residential accounting for 25%.
Table 4: Energy-related CO2 emissions by sector
Average annual growth
Quantity (ktoe) Shares % Growth %
rates %
1990 2005 2016 1990 2005 2016 ‘90 – ‘16 ‘05 - ‘16 ‘90 – ‘05 ‘05 – ‘16 2016
Transport 6,043 15,293 14,620 20% 33% 37% 142% -4% 6.4% -0.4% 3.9%
Residential 10,764 11,843 9,690 35% 25% 25% -10% -18% 0.6% -1.8% 1.6%
Industry 7,899 10,519 8,765 26% 22% 22% 11% -17% 1.9% -1.6% 4.2%
Services 4,730 7,764 5,189 15% 17% 13% 10% -33% 3.4% -3.6% 7.4%
Agriculture 1,133 1,414 817 4% 3% 2% -28% -42% 1.5% -4.9% 3.5%
Total 30,569 46,834 39,081 28% -17% 2.9% -1.6% 3.8%
Source: SEAI
The CO2 emissions resulting from energy use in the residential sector are shown in Figure 4 and Table 5. Data is shown for
total CO2 emissions (ktCO2), weather-corrected total CO2 emissions (ktCO2), and the carbon intensity of all residential fuel
use (gCO2/kWh). Weather-corrected CO2 emissions decreased between 2006 and 2014, and returned to growth in 2015 and
2016, in line with the trend in energy consumption in this period. The carbon intensity of residential energy, (i.e. the CO2
emissions per unit of energy used), has decreased steadily since 1990. In the early part of the period, this was due mostly
to switching from coal and peat to oil and gas, and in the latter part was due mostly to the improved carbon intensity
of electricity. Between 2005 and 2016, electricity use in households increased by 5% but the associated CO2 emissions
decreased by 20%.
Figure 4: Residential energy-related CO2 emissions and CO2 intensity, 1990 to 2016
12,500 430.0
12,000 410.0
Carbon intensity gCO₂/kWh
Carbon dioxide emissions (ktCO₂)
11,500 390.0
11,000 370.0
10,500 350.0
10,000 330.0
9,500 310.0
9,000 290.0
8,500 270.0
8,000 250.0
1990
1991
1992
1993
1994
1995
1996
1997
1998
1999
2000
2001
2002
2003
2004
2005
2006
2007
2008
2009
2010
2011
2012
2013
2014
2015
2016
Residential CO₂ Emissions Residential CO₂ Emissions Weather Corrected Residential CO2/kWh
Source: SEAI
Between 2005 and 2016, electricity use in households increased by 5%, but
the associated CO2 emissions decreased by 20%
12ENERGY IN THE RESIDENTIAL SECTOR 2018 Report
Table 5: Energy-related CO2 emissions in the residential sector
Residential CO₂ Average Annual Growth
Quantity (ktCO₂) Share Growth
Emissions rates
1990 2005 2016 1990 2005 2016 1990-16 2005-16 1990-05 2005-16 2016
Coal 2,483 989 721 23% 8% 7% -71% -27% -6.0% -2.8% -13.2%
Peat 3,123 1,170 842 29% 10% 9% -73% -28% -6.3% -2.9% -1.8%
Oil 1,175 3,467 3,008 11% 29% 31% 156% -13% 7.5% -1.3% 5.1%
Natural Gas 270 1,443 1,317 3% 12% 14% 388% -9% 11.8% -0.8% -0.5%
Direct Fossil Fuels 7,052 7,069 5,889 66% 60% 61% -16% -17% 0.0% -1.6% 0.3%
Electricity 3,713 4,773 3,801 34% 40% 39% 2% -20% 1.7% -2.0% 3.7%
Total 10,764 11,843 9,690 -10% -18% 0.6% -1.8% 1.6%
Total Weather
11,227 12,033 9,602 -14% -20% 0.5% -2.0% 4.7%
Corrected
Source: SEAI
1.2.1 Non Emissions Trading Scheme Carbon Emissions
The EU 2020 Climate and Energy Package3 set a target for the EU as a whole to achieve 20% greenhouse gas (GHG) emissions
reduction by 2020. The GHG emissions reductions targets are split across two categories. The first category covers large
scale carbon emitters in industry, electricity generation and aviation. These bodies are dealt with at EU level under the EU
Emission Trading System (ETS). The second category covers all GHG emissions not covered by the ETS, known as the non-
ETS sector. This includes the majority of GHG emissions in the residential, transport and agricultural sectors. Achieving
GHG emissions reductions in the non-ETS sector is the responsibility of national governments. The Effort Sharing Decision
(2009/406/EC)4 set a mandatory target for Ireland to reduce non-ETS emissions by 20% below 2005 levels by 2020.
Figure 5 shows Ireland’s energy-related Non-ETS sector CO2 emissions split by sector, and also presents residential energy-
related non-ETS CO2 emissions split by fuel type. In the residential sector, CO2 emissions resulting from use of electricity
generated by large public power stations are covered by the ETS sector5and so are not included in this chart. Oil-based
central heating systems are responsible for over half of all residential energy-related non-ETS CO2 emissions. Coal and peat
use combined accounted for 27%, more than natural gas at 23%.
Residential energy-related non-ETS CO2 emissions reduced by 17% between 2005 and 2016. The reduction in oil use over
the period was the largest factor behind this reduction, followed by the reduction in peat and coal use.
Figure 5: Energy-related non-ETS CO2 emissions split by sector, and for the residential sector split by fuel type,
2016
Peat
14%
Residential
28%
Coal
12%
Total 2016 Energy Total 2016 Residential
Related Non-ETS CO₂ Sector Energy Related
Emissions Non-ETS CO₂ Emissions
20.8 MtCO₂ 5.9 MtCO₂
Industry
2%
Services
9% Oil
Transport
51%
58%
Agriculture Natural Gas
3% 23%
Source: SEAI
3 See https://ec.europa.eu/clima/policies/strategies/2020_en
4 See https://ec.europa.eu/clima/policies/effort_en#tab-0-0
5 Similarly, if waste heat from large power plants or industrial facilities was to be used in district heating schemes, then this would also be counted under
the ETS scheme.
13ENERGY IN THE RESIDENTIAL SECTOR 2018 Report
1.3 Residential Sector Energy by End-Use
This section presents new estimates of household energy use split by end-use, i.e. the share of energy used for space
heating, water heating, cooking, lighting and electric appliances. This data breakdown gives greater insight into how
energy is used in the home. This can help inform policy and behaviour change to maximise energy efficiency, and minimise
fossil fuel use and CO2 emissions.
It is not simple to estimate household energy split by end-use using standard energy use data; for example, it is not simple
to estimate from an electricity meter reading what share of electricity is used for appliances versus water heating. To
overcome this difficulty there are a number of possible approaches, for example household surveys, modelling or in-situ
measurement.
It was decided that modelling was the most appropriate option for Ireland, in the first phase, based on data and resource
requirements. This led to the development of the Irish Residential Energy End-Use Model (IREEUM), which is described in
more detail in Appendix 3. In practice a combination of methods is required to effectively produce an accurate assessment.
Incorporating robust data gathered through household surveys or in-situ measurement would improve accuracy. It is
envisaged that the initial model can be built upon and improved over time through including the results of some or all of
the other methods of data collection.
Figure 6 and Table 6 show residential sector final energy consumption for 2016, split by fuel type and end-use. The relative
share of each end-use for each fuel type is shown on the right hand side of Figure 6. This is the key output from the
modelling exercise. These shares are then applied to data from the National Energy Balance for residential fuel use to give
residential final energy by fuel type and end-use, as shown on the left hand side. It is estimated that in 2016:
•• space heating accounted for 61% of residential final energy, or approximately 1,652 ktoe;
•• space and water heating together accounted for 80% household energy use;
•• space heating accounted for the majority of all fuel types, except electricity;
•• lighting and appliances accounted for 68% of electricity use, with space and water heating accounting for 22%.
Figure 6: Residential energy by fuel type, split by end-use, 2016
1,200 100%
90%
1,000
80%
Share of residential final energy
70%
800
Final Energy (ktoe)
60%
600 50%
40%
400
30%
200 20%
10%
0 0%
Electricity Gas Solid Fuels Oil Renewables Electricity Gas Solid Fuels Oil Renewables Total
Space heating Water heating Cooking Lighting and appliances Other end uses
Source: SEAI
Table 6: Residential final energy by fuel type and end-use, 2016
Lighting and
Total Space heating Water heating Cooking Other end-uses
appliances
ktoe % ktoe % ktoe % ktoe % ktoe % ktoe
Electricity 677 10% 67 12% 79 7% 47 68% 459 4% 25
Gas 563 72% 405 26% 145 2% 13 0% 0 0% 0
Solid Fuels 381 91% 347 9% 34 0% 0 0% 0 0% 0
Oil 1,000 78% 780 22% 219 0% 1 0% 0 0% 0
Renewables 83 64% 53 36% 30 0% 0 0% 0 0% 0
Total 2,704 61% 1,652 19% 507 2% 61 17% 459 1% 25
Source: SEAI
14ENERGY IN THE RESIDENTIAL SECTOR 2018 Report
Space heating accounts for 61% of residential final energy
Figure 7 shows final energy by end-use, split by fuel type. It is estimated that in 2016:
•• Oil accounted for 47% of energy used for space heating, gas 25% and solid fuels 21%.
•• Oil accounted for 43% of energy used for water heating, gas 29% and electricity 16%.
Figure 7: Residential energy by end-use, split by fuel type, 2016
1,800 100%
1,600 90%
80%
1,400
Share of residential final energy
70%
1,200
Final energy (ktoe)
60%
1,000
50%
800
40%
600
30%
400 20%
200 10%
0 0%
Space Water Cooking Lighting Other end Total Space Water Cooking Lighting Other end
heating heating and uses heating heating and uses
appliances appliances
Electricity Gas Solid Fuels Oil Renewables
Source: SEAI
Oil accounts for 47% of energy used for space heating
15ENERGY IN THE RESIDENTIAL SECTOR 2018 Report
2 Underlying Factors Influencing Residential Energy
Demand
This section examines the underlying drivers of residential sector energy usage and CO2 emissions to provide a deeper
understanding of the observed trends. Factors such as the housing stock, energy prices and weather are analysed
based on data produced by SEAI, the Central Statistics Office, Eurostat, the IEA, and the Department of Housing.
2.1 Demographics
Population is one of the main determinants of the numbers of dwellings. Table 7 shows the population of the Republic of
Ireland in census years between 1991 and 2016. The population increased by 3.8% between 2011 and 2016, by 12% in the
10 years from 2006 to 2016 and by 31% in the 20 years from 1996 to 2016.
Table 7: Rep. of Ireland population and average number of persons per household, census years 1991 to 2016
1991 1996 2002 2006 2011 2016
Population 3,525,719 3,626,087 3,917,203 4,239,848 4,588,252 4,761,865
Persons per household 3.5 3.3 3.1 2.8 2.7 2.7
Source: CSO
The total number of dwellings also depends on the average number of persons per household. Historically, the number of
persons per household in Ireland has been declining, but is still high by international standards. Table 7 shows the average
number of persons per household for census years from 1991 to 2016. The 2016 census results show that occupancy
marginally increased between 2011 and 2016, breaking the historical trend. This can be attributed in part to the housing
supply crisis that became increasingly pronounced throughout 2015 and 2016, originating with the collapse of the house
building industry following the 2008 financial crisis.
Household size in Ireland, at 2.7 persons per household, remains very high by European standards, and is second only
in the EU28 to Croatia. This compares to 2.4 persons per household in the UK in 2015. The EU countries with the lowest
persons per household were Sweden on 1.9, and Germany and Denmark both on 2.06. The trend for reducing average
household size together with increasing population have resulted in a large increase in the number of occupied dwellings.
This trend is likely to continue, given projected population growth and a likely further decrease in household size.
Ireland had 2.7 persons per dwelling in 2016, the second highest in the EU
Another factor affecting the demand for energy in the residential sector is the proportion of a typical day that a dwelling
is occupied and heated. Dwellings which are empty for extended periods during the day typically require less energy for
heating and lighting than those which are occupied, and heated, throughout the day. This is less true for highly efficient
dwellings that retain heat throughout the day.
There is no direct data on the portion of the day that dwellings are heated, however a number of variables can be used to
guide estimates. The portion of the day where a dwelling is heated tends to be lower where all residents are in employment
or full time education outside the home and higher where residents are not in employment.
The rate of female participation in the workforce is one influencing factor. Over the past two decades there has been a
significant increase in the number of women working. In 1997 the employment rate for women of working age was 42%,
by 2011 this had increased to 53% and remained 53% at the end of 20167. The number of households headed by retirees
is another factor, as these households are more likely to be occupied and heated through out the day. In 1996 there were
259,003 households headed by people over 65 years of age. By 2016 this has increased to 395,5228. As the population ages
the number of households headed by persons aged 65 and older will continue to increase.
6 Eurostat Household composition statistics; http://ec.europa.eu/eurostat/statistics-explained/index.php/Household_composition_statistics
7 CSO Quarterly National Household Survey; Available from www.cso.ie
8 CSO Census data; Private Households in Permanent Housing Units by Age Group of Reference Person. Available from www.cso.ie
16ENERGY IN THE RESIDENTIAL SECTOR 2018 Report
2.2 The Housing Stock
The physical characteristics of the housing stock strongly influence the sector’s energy demand, for example the number
and type of dwellings, floor areas, fuels used, thermal efficiency, etc. In this section, we present some of the data available
on these factors.
2.2.1 Number of Dwellings
The number of dwellings is tracked by the CSO in the national census. A time series is available back to 1926, recording
the number of “permanent private dwellings”, also referred to as “permanent private households”. This has historically
been used as the best indicator of the actual number of occupied dwellings in the country. It does not include temporary
dwellings, holiday homes that are only occupied for part of the year and non-private households, defined as groups of
persons situated in boarding houses, hotels, prisons or ships, etc9.
The number of occupied dwellings increased by 33% between 2002 and
2016
The number of dwellings in Ireland remained below 700,000 from the 1920s through to the 1960s, but it grew significantly
in the 1970s, and exceeded 1 million for the first time in the 1991 census. Figure 8 and Table 8 show the number of private
households in permanent housing units in census years between 1991 and 2016. Table 8 also shows the annual average
growth rates between census years. The annual growth rate of 3.4% observed between 2002 and 2006 was the highest
ever recorded, while the growth rate of just 0.6% recorded between 2011 and 2016 was the lowest since the 1960’s. Overall,
the number of occupied dwellings increased by 66% between 1991 and 2016 and by 33% between 2002 and 2016.
Figure 8: Private households in permanent housing units, 1991 to 2016
2
1.8
1.6
1.4
Millions of dwellings
1.2
1
0.8
0.6
0.4
0.2
0
1991 1996 2002 2006 2011 2016
Normally Occupied Permanent Dwellings Private Permanent Households
Source: CSO
Table 8: Private households in permanent housing units, 1991 to 2016
1991 1996 2002 2006 2011 2016
Private Households in Permanent
1,019,723 1,114,974 1,279,617 1,462,296 1,649,408 1,697,665
Housing Units
Annual average growth rate
1.8% 2.3% 3.4% 2.4% 0.6%
between censuses
Source: CSO
The 2011 and 2016 census provided a more detailed breakdown of the occupancy status of dwellings, shown in Table
9. The indicator “Occupied by usual residents of the household” corresponds to “permanent private households” from
previous census years. This breakdown also includes the category of “Unoccupied — residents temporarily absent”, i.e.
the dwelling is normally occupied but the residents were temporarily absent from the dwelling on the night of the census.
9 More details can be found in volume 6 (Housing) of the Census. Available from www.cso.ie
17ENERGY IN THE RESIDENTIAL SECTOR 2018 Report
A more accurate estimate of the number of dwellings that are normally occupied in the census year may be to sum the
dwellings “Occupied by usual resident(s) of the household”, “Occupied by visitors only” and “Unoccupied — residents
temporarily absent”. In this report we label these as “Normally occupied permanent dwellings”. For 2016 the number of
these was 1,758,185, up by 52,791 since 2011.
For the calculations and indicators presented in this report, we have continued to use the number of dwellings “Occupied
by usual residents of the household” on the night of the census, as the total number of occupied dwellings for 2011 and
2016. This is to allow comparison between years before and after 2011, for example to compare energy use per dwelling in
2005 to that in 2016, which would otherwise not be possible.
It is important to note that if an indicator such as energy per dwelling was calculated based on the higher figure of
“Normally Occupied Permanent Dwellings”, then this would give a lower estimate of energy consumption per dwelling.
This would likely be more accurate than the estimate based on dwellings “Occupied by usual resident(s) of the household”,
but would not be comparable to pre-2011 data. This approach may be revised in future years as a longer time series
becomes available for “Normally occupied permanent dwellings”.
Table 9: Occupancy status of dwellings, 2011 and 2016
2011 2016
Total housing stock (B+C+D+E+F+G ) 1,994,845 2,003,645
Occupied by usual resident(s) of the household (B) 1,649,408 1,697,665
Occupied by visitors only (C) 10,703 9,788
Unoccupied — residents temporarily absent (D) 45,283 50,732
Unoccupied — vacant house (E) 168,427 140,120
Unoccupied — vacant flat (F) 61,629 43,192
Unoccupied — vacant holiday home (G) 59,395 62,148
*Normally occupied permanent dwellings (B+C+D) 1,705,394 1,758,185
Source: CSO & SEAI
2.2.2 New Dwelling Completions
The Department of Housing, Planning Community and Local Government publishes data on housing completions. This is
based on data on residential connections to the electricity network. This data is supplied by the ESB. It is used as a proxy
for house completions as it is considered the best available indicator that a house was completed and was ready for
habitation. This data set is available dating back to 1970s, providing a valuable time series. Figure 9 shows ESB connections
for the period 1994 to 2016. Note that the methodology for categorising dwellings changed in 200510.
Figure 9: New dwellings completed by type, 1994 to 2016
100,000
90,000
80,000
70,000
Number of dwellings
60,000
50,000
40,000
30,000
20,000
10,000
0
1994 1995 1996 1997 1998 1999 2000 2001 2002 2003 2004 2005 2006 2007 2008 2009 2010 2011 2012 2013 2014 2015 2016
Bungalow House Detached House Semi-D House Terraced
Flat / Apartment Individual House Scheme House Apartments
Source: Department of Housing, Planning, Community and Local Government
10 New dwellings completed since 2005 are classified as follows: ”Individual House” is where connection is provided to a separate detached house. “Scheme
House” is where connection is provided to two or more houses. “Apartments” is where all customer metering for the block is centrally located.
18ENERGY IN THE RESIDENTIAL SECTOR 2018 Report
The most obvious feature is the sharp reduction in activity post 2006. It is also significant that the share of individual
detached houses went from 25% in 2006 to 62% in 2011, due the relatively greater fall in construction of scheme11 houses
and apartments.
Recently, concerns have been raised over the use of the ESB new connections data-set as a proxy for new dwelling
completions. This is because the ESB new connections data-set also includes dwellings that were disconnected from the
electricity grid for a period of at least two years, and subsequently re-connected. Such dwellings would be incorrectly
counted as “new dwellings”. This may have been significant in the period 2011 - 2016 when construction activity was at
low levels and there were large numbers of vacant dwellings. The Department of Housing has committed to continue
to engage with ESB Networks to explore the scope for further refinement of the data and to collaborate with the CSO to
develop further insights into the housing stock and flows of housing units.
2.2.3 Occupier Status
Research has shown that owner-occupiers have a greater incentive to invest in energy saving measures than either the
landlords or tenants of rented accommodation12. This is because in rented accommodation, the landlord typically pays for
the work, but the benefit, in the form of improved comfort and lower heating bills, is typically received by the tenant. This
reduces the motivation for the landlord to invest in energy efficiency measures, and is widely recognised as a significant
barrier to increasing the energy efficiency of rented residential housing.
Over a quarter of all households in Ireland in 2016 were rented either
privately or through a local authority (>450,000 dwellings).
Table 10 illustrates the ownership profile of households in census years between 2002 and 201613. Owner-occupied
dwellings include those that are owned outright or are mortgaged. The share of households in owner-occupied dwellings
decreased over the period, to 68% in 2016, although the absolute number increased. The number of households in private
rented accommodation increased most dramatically between 2006 and 2011; more than doubling in absolute numbers.
Between 2011 and 2016, the number of households in private rented accommodation increased only marginally, and
decreased as a share of all households from 19% in 2011 to 18% in 2016. Nevertheless over a quarter of all occupied
dwellings in Ireland in 2016 were rented, either privately or through a local authority, amounting to over 450,000 dwellings.
Figure 10: Private households in permanent housing units by ownership of dwelling, 1991 to 2016
1,800,000
1,600,000
1,400,000
Number of households
1,200,000
1,000,000
800,000
600,000
400,000
200,000
0
1991 2002 2006 2011 2016
Owned Outright Mortgaged Private Rented Local Authority rented Other Not Stated
Source: CSO
11 “Scheme Houses” are where houses are part of a multi-house development where connection is provided to two or more houses.
12 IEA, 2007. Mind the Gap – Quantifying Principal-Agent Problems in Energy Efficiency. Available from www.iea.org
13 Other includes those occupying the accommodation rent-free and renting in the voluntary sector.
19ENERGY IN THE RESIDENTIAL SECTOR 2018 Report
Table 10: Private households in permanent housing units by ownership of dwelling, census years 1991 to 2016
1991 2002 2006 2011 2016
All households 1,019,723 1,279,617 1,462,296 1,649,408 1,697,665
Owned Outright 387,278 461,166 498,432 566,776 611,877
Mortgaged 421,107 484,774 569,966 583,148 535,675
Private Rented 98,929 141,459 145,317 305,377 309,728
Local Authority rented 81,424 132,989 129,056 129,033 143,178
Other 21,589 21,560 72,181 40,378 44,205
Not Stated 9,396 37,669 47,344 24,696 53,002
% Owner Occupied 79% 74% 73% 70% 68%
% Private Rented 10% 11% 10% 19% 18%
% Local Authority Rented 8% 10% 9% 8% 8%
Source: CSO
Historically, Ireland has had high levels of home ownership compared to other European countries. In 2007, Ireland had
the second highest level of owner-occupiers of the EU15 countries, behind only Spain. The decreasing share of households
in owner-occupied dwellings in recent years has seen Ireland move towards the EU average. In 2015, Ireland had the 7th
lowest rate of home ownership in the EU28 according to Eurostat estimates, as shown in Figure 11. Note that there are
higher ownership rates in eastern Europe14.
Figure 11: Distribution of population by tenure status in the EU, 2015
100%
90%
80%
Share of population
70%
60%
50%
40%
30%
20%
10%
0%
Owner, no outstanding mortgage or housing loan Owner, with mortgage or loan
Tenant, rent at market price Tenant, rent at reduced price or free
Source: Eurostat
2.2.4 Type of Dwelling
In addition to the number of households, the type of dwellings also affects household energy consumption. All else
being equal, apartments typically have the lowest heat loss as a result of their lower proportion of exposed surface area
and generally smaller size. Detached houses generally have greatest heat loss because they have a larger proportion of
exposed surface area. Data on dwelling type is available from the 2016 census and is presented in Table 11. This shows
the number of occupied dwellings in 2016, split by dwelling type and by period in which the dwelling was constructed.
In 2016, 42% of all dwellings in Ireland were detached houses while 12% were apartments. The share of apartments in
the cohort of dwellings built after 2001 is significantly higher than in the period before, but remains low by European
standards.
In 2016, 42% of all dwellings in Ireland were detached houses
14 Eurostat, 2017, available from http://ec.europa.eu/eurostat/statistics-explained/index.php/Housing_statistics
20ENERGY IN THE RESIDENTIAL SECTOR 2018 Report
Table 11: Private households in permanent housing units by type of accommodation and period of construction
Number of Households Share of households
Pre 1981 to 2001 to 2011 to All Pre 1981 to 2001 to 2011 to
All years
1981 2001 2010 2016 years 1981 2001 2010 2016
All households 1,697,665 706,489 411,855 431,763 33,436
Detached 715,133 303,318 197,946 175,223 18,050 42% 43% 48% 41% 54%
Semi- detached 471,948 194,168 129,959 115,869 5,900 28% 27% 32% 27% 18%
Terraced 284,569 167,727 42,718 51,682 3,127 17% 24% 10% 12% 9%
Apartment 200,879 35,255 38,987 86,768 6,082 12% 5% 9% 20% 18%
Other 25,136 6,021 2,245 2,221 277 1% 1% 1% 1% 1%
Source: CSO
Figure 12 and Table 12 show the data from the 2016 census on dwelling types in urban and rural areas. Whether a dwelling
is located in an urban or rural area can have an impact on the type of fuel and heating system that is available to a
householder or that they are likely to choose. For example with urban dwellings, it may be possible to connect to the gas
network or to consider a district heating network, but for rural dwellings, heat pumps or biomass boilers are more likely
alternatives. In 2016, 64% of all households were in urban areas. 83% of dwellings in rural areas were detached houses
compared to 19% in urban areas.
Figure 12: Private households in permanent housing units by type of accommodation and urban or rural areas
1,200,000 100%
90%
1,000,000
80%
70%
Number of dwellings
800,000
Share of dwellings
60%
600,000 50%
40%
400,000
30%
20%
200,000
10%
0 0%
Urban areas Rural areas Urban areas Rural areas
Detached Semi detached Terraced Apartment Other Not stated
Source: CSO
Table 12: Private households in permanent housing units by type of accommodation and rural or urban areas
Number of Households Share by Dwelling Type
State Urban Rural State Urban Rural
All households 1,697,665 1,080,837 616,828
Detached 715,133 203,346 511,787 42% 19% 83%
Semi- detached 471,948 406,798 65,150 28% 38% 11%
Terraced 284,569 260,319 24,250 17% 24% 4%
Apartment 200,879 192,127 8,752 12% 18% 1%
Other 3,266 3,021 245 0% 0% 0%
Not Stated 21,870 15,226 6,644 1% 1% 1%
Source: CSO
21ENERGY IN THE RESIDENTIAL SECTOR 2018 Report
Data is also available from Eurostat showing the proportion of the population in each EU member state living in different
dwelling types in 201515 and this is presented in Figure 13. Ireland had the lowest proportion of people living in apartments
of any EU member state at 7%. The next nearest member state was the UK at 15%, while in Spain, 66% of the population
lives in apartments. The average across the whole EU28 was 33%.
Figure 13: Distribution of population by dwelling type in EU member states, 2015
100%
90%
80%
70%
Share of population
60%
50%
40%
30%
20%
10%
0%
Flat Detached house Semi-detached house Others
Source: Eurostat
In Ireland, in 2015, 7% of people lived in apartments, the lowest share in the
EU; the EU average was 33%.
2.2.5 Estimated Floor Area
The CSO publish data on the average floor area of houses and flats that are granted planning permission. This trend is
shown in Figure 14 for the period 2001 to 2016 and data for selected years is shown in Table 13. Average floor areas of new
houses granted planning permission grew from 130 square metres in 1990 to 149 square metres in 2005; (2005 was the
year in which the largest ever number of houses were granted planning permission).
Figure 14 also shows that there is a significant difference between average floor areas of one-off detached houses and
multi-development houses. In 2016 the average floor area of a new one-off house granted planning permission was 241
square metres, compared to 135 square metres for a multi-development house, and 90 square metres for an apartment.
The average floor area of new one-off houses increased from 186 square metres in 2001, the first year in which data is
available, to 253 square metres in 2009, an increase of 36%. Between 2009 and 2016, the average floor area of new one-off
dwellings declined by 5% while that of multi-development houses increased by 2%.
The average floor area of all new houses granted permission grew sharply between 2005 and 2012, particularly after
2009, but this was primarily due to the sharper reduction in the number of multi-development houses granted planning
permission, compared to one-off houses, following the severe contraction in the house building sector post 2009. This
lead to the weighted average of all houses moving more towards that of the average one-off house. As the number of
multi-development houses granted planning increased after 2012, this trend was reversed and the average floor area of
all houses decreased between 2012 and 2016.
15 Eurostat; From EU Statistics on Income and Living Conditions (EU-SILC); See http://ec.europa.eu/eurostat/statistics-explained/index.php/Housing_
statistics
22ENERGY IN THE RESIDENTIAL SECTOR 2018 Report
Table 13: Number and average floor area of residential units granted planning permission
Number and average floor area of units granted planning permission
1990 2001 2005 2010 2012 2014 2016
All Houses granted planning permission 19,804 60,729 75,650 11,604 5,389 6,626 12,481
Average floor area per house 130 149 149 190 206 190 171
One off houses granted planning permission 19,792 20,868 5,582 3,250 3,096 4,230
Average floor area per one off house 186 214 250 248 245 241
Multi-development houses granted planning
40,937 54,782 6,022 2,139 3,530 8,251
permission
Average floor area per multi-development
131 125 135 142 143 135
house
Apartments granted planning permission 2,270 17,780 23,702 6,874 861 785 3,894
Average floor area per apartment 64 78 78 92 92 88 90
Source: CSO and SEAI
Figure 14: Average floor areas of new dwellings granted planning permission, 2001 to 2016
250
200
square metres floor area
150
100
50
2001 2002 2003 2004 2005 2006 2007 2008 2009 2010 2011 2012 2013 2014 2015 2016
All houses One off houses Multi-development houses Apartments
Source: CSO and SEAI
The above data on floor area only refers to planning permissions granted for new dwellings. It is useful to have an estimate
of the average and total floor area for all occupied dwellings, for example, to calculate energy intensities. SEAI have
produced an updated methodology16 for estimating total stock floor area. This is based on data from the BER database,
CSO data on the average floor area of new planning permissions, the number of occupied dwellings, and an estimate of
the rate of obsolescence17.
Table 14 shows both the estimated average dwelling floor area and the estimated total floor area of all occupied dwellings
for selected years between 1990 and 2016. Average floor area per dwelling has increased steadily over the period as larger
dwellings are added to the stock. In 2016, the average dwelling was 21% larger than in 1990, and 15% larger than in 2000.
Figure 15 shows the trend for average floor area per dwelling, number of dwellings and total floor area of the housing
stock as an index relative to 2000. The estimated total floor area of all occupied dwellings increased by 60% between 2000
and 2016, and 103% between 1990 and 2016. This was primarily driven by the increasing number of dwellings; up by 39%
between 2000 and 2016, together with the increase in average floor area per dwelling.
Between 2000 and 2016, the total floor area of all homes increased by 60%
16 SEAI previously estimated total stock floor area based on an estimate of the overall floor area in 1980, together with CSO data on the average floor area of
new planning permissions, the number of occupied dwellings, and an estimate of the rate of obsolescence. The results of this earlier analysis were shown
in earlier editions of this report.
17 The rate of obsolescence is a significant factor but is not well understood for Ireland . The ESRI has previously made estimates of the obsolescence rate,
based on CSO data on the number of dwellings in each age cohort and on the number of house completions.
23ENERGY IN THE RESIDENTIAL SECTOR 2018 Report
Table 14: Average floor area per dwelling and total floor area of dwelling stock
% Growth
1990 2000 2005 2010 2015 2016
2000-2016
Estimated average dwelling floor area
99 103 109 116 119 119 15%
(square metres)
Estimated total floor area of occupied
100 127 156 187 200 202 60%
dwellings (million square metres)
Source: SEAI
Figure 15: Index of average floor area, total floor area and number of occupied dwellings, 2002 to 2016
170
160
150
Index, 1990 = 100
140
130
120
110
100
90
2000 2001 2002 2003 2004 2005 2006 2007 2008 2009 2010 2011 2012 2013 2014 2015 2016
Average Floor Area Total Floor Area Number of occupied dwellings
Source: SEAI
2.2.6 Building Regulations and Period of Construction
The first thermal insulation requirements for residential dwellings in Ireland formally came into effect in 1979, and these
regulations have been reviewed and improved many times since. The requirements are set out in the Technical Guidance
Documents to Part L of the Building Regulations, governing the conservation of fuel and energy, commonly abbreviated
as TGDL. There has been a significant improvement in the energy efficiency requirements, in particular since 2008.
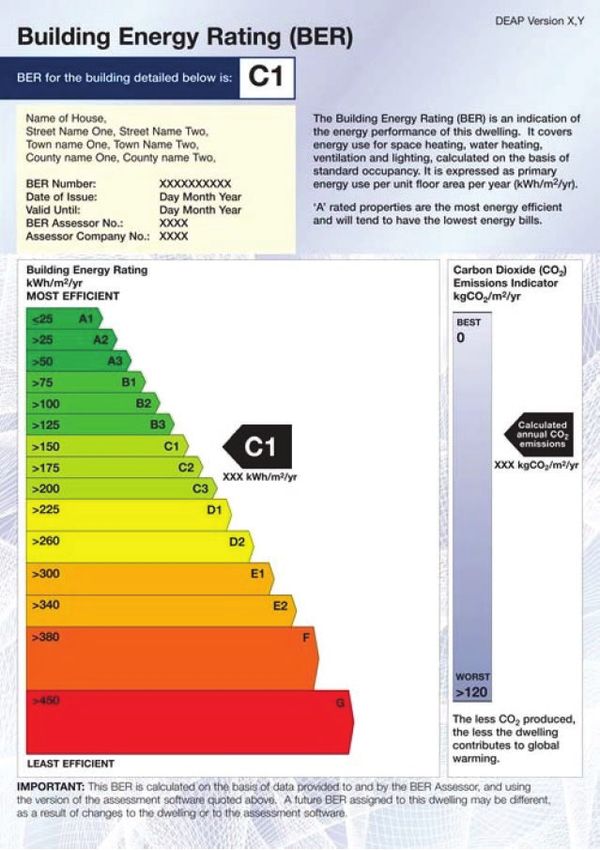
The 2008 regulations introduced the concept of the Energy Performance Coefficient (EPC). The EPC is the ratio between
the energy performance of a dwelling, calculated using the Dwelling Energy Assessment Procedure (DEAP), and that of
an equivalent reference dwelling complying with the 2005 regulations. The regulations set a Maximum Permitted EPC
(MPEPC). In 2008, this was set to 0.6; to meet the regulations, a dwelling would need to achieve 40% efficiency savings
compared to the reference dwelling. The 2011 regulations reduced the MPEPC to 0.4; to meet the regulations a dwelling
would need to achieve 60% efficiency savings compared to the reference dwelling.
It is estimated that the cumulative improvements to the building regulations since 1979 mean that a dwelling built to the
2011 regulations would require 90% less energy than the equivalent dwelling built in 1978 to deliver the same internal
temperature, hot water usage, and lighting, throughout the year. In practice, older inefficient dwellings are likely to be
impractical or uneconomical to heat to comfortable temperatures for much of the year.
It is a requirement of the recast Energy Performance in Buildings Directive that all new dwellings will be Nearly Zero
Energy Buildings (NZEBs) by 31 December 2020. The 2017 revision to the TGDL states that to be considered an NZEB, a
dwelling will have to achieve an MPEPC of 0.3.
Given the significant improvement to the building regulations over time, the age profile of the housing stock is an indicator
of efficiency. Table 15 shows the age profile of the housing stock from the 2016, 2011 and 2006 CSO censuses, while
Figure 16 illustrates the change between 2006 and 2016. The share of the housing stock built before 1981 corresponds
approximately to the period before the introduction of insulation requirements for new dwellings. The number of
occupied dwellings built before 1981 fell from 729,762 in 2006 to 706,489 in 2016; the number of dwellings in the “Not
Stated” category increased by 44,912 in the same period, which may account for some of the difference. In 2016, 25% of
the stock was constructed between 2001 and 2010, but only 2% was constructed between 2011 and 2016.
24You can also read