Hydrologic Assessment of the Soap Creek Watershed - October 2014 - Iowa Flood Center | IIHR-Hydroscience & Engineering
←
→
Page content transcription
If your browser does not render page correctly, please read the page content below

Hydrologic Assessment of the
   Soap Creek Watershed
                 October 2014

   Iowa Flood Center | IIHR—Hydroscience & Engineering
                  The University of Iowa
         C. Maxwell Stanley Hydraulics Laboratory
                  Iowa City, Iowa 52242

                                           Hydroscience & Engineering
Hydrologic Assessment of the
  Soap Creek Watershed
                  October 2014

              IIHR Technical Report No. 491

                        Prepared by:
   Iowa Flood Center | IIHR—Hydroscience & Engineering
                  The University of Iowa
         C. Maxwell Stanley Hydraulics Laboratory
                  Iowa City, Iowa 52242
ii | Soap Creek Watershed Hydrologic Assessment

Acknowledgements
The Iowa Flood Center and IIHR—Hydroscience & Engineering would like to thank the
following individuals and agencies for providing relevant data and engaging in discussions that
contributed to this assessment:
Davis County Soil and Water Conservation District
Iowa Department of Natural Resources
Natural Resources Conservation Service
Soap Creek Watershed Board

                                                    Soap Creek Watershed Hydrologic Assessment | iii
Table of Contents
Introduction ........................................................................................................... 1
1.      Iowa’s Flood Hydrology ....................................................................................2
     a. Hydrology in Iowa and the Iowa Watersheds Project Study Areas .......................................... 3
        i. Statewide Precipitation ........................................................................................................... 3
        ii. The Water Cycle in Iowa ........................................................................................................ 4
        iii. Monthly Water Cycle ............................................................................................................ 5
        iv. Flood Climatology ................................................................................................................. 7
     b. Hydrological Alterations in Iowa and the Iowa Watersheds Project Study Areas .................. 8
        i. Hydrological Alterations from Agricultural-Related Land Use Changes .............................. 9
        ii. Hydrological Alterations Induced by Climate Change ........................................................ 11
        iii. Hydrological Alterations Induced by Urban Development ................................................ 11
        iv. Detecting Streamflow Changes in Iowa’s Rivers ................................................................. 11
     c. Summary of Iowa’s Flood Hydrology .......................................................................................13
2.      Conditions in the Soap Creek Watershed ........................................................ 14
     a. Hydrology ................................................................................................................................. 14
     b. Geology and Soils ..................................................................................................................... 16
     c. Topography ............................................................................................................................... 18
     d. Land use ................................................................................................................................... 20
     e. Instrumentation/ data records ................................................................................................ 21
     f. Floods of Record ....................................................................................................................... 22
3.      Soap Creek Hydrologic Model Development ................................................... 23
     a. Model Development ................................................................................................................. 24
        i. Incorporated Structures ........................................................................................................ 25
        ii. Development of Model Inputs ............................................................................................. 26
     b. Calibration and Validation ...................................................................................................... 34
4.      Analysis of Scenarios/Model Results ..............................................................36
     a. Effects of Existing Ponds ......................................................................................................... 36
     b. Area of high runoff potential ................................................................................................... 47
     c. Mitigating the Effects of High Runoff with Increased Infiltration ......................................... 48
     i. Hypothetical Increased Infiltration within the Watershed: Land Use Change ...................... 49
     ii. Hypothetical Increased Infiltration within the Watershed: Improving Soil Quality ............ 53

iv | Soap Creek Watershed Hydrologic Assessment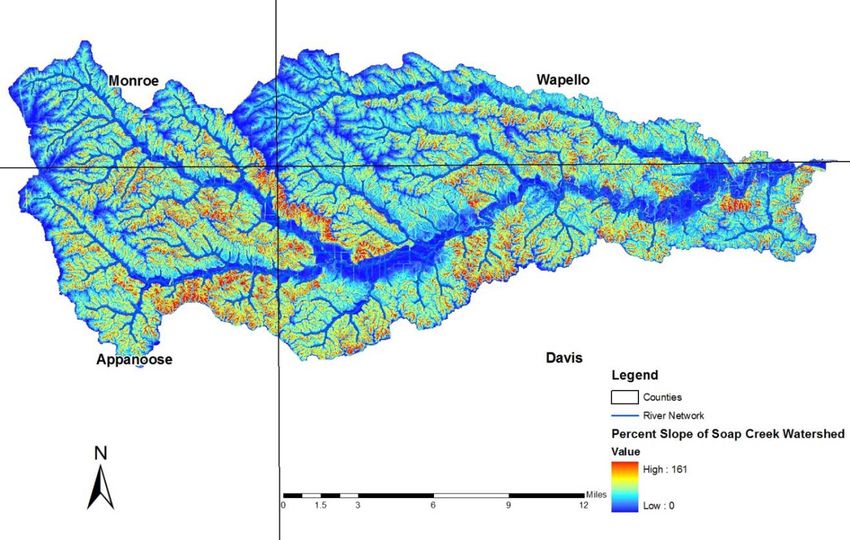
5.        Summary and Conclusions ............................................................................. 59
     a.         Soap Creek Water Cycle and Watershed Conditions .......................................................... 59
     b.         Soap Creek Watershed Hydrologic Model ........................................................................... 59
     c.         Watershed Scenarios for the Soap Creek Watershed .......................................................... 60
          i.       Effects of Existing Ponds .................................................................................................. 62
          ii.      Increased Infiltration in the Watershed: Land Use Change ........................................... 62
          iii. Increased Infiltration in the Watershed: Improving Soil Quality................................... 62
     d.         Concluding Remarks ............................................................................................................ 63
Appendix A – Maps ..............................................................................................A-1
Appendix B – Incorporated Structures ................................................................B-1
Appendix C – Soap Creek and Fox River Comparison .......................................... C-1
Appendix D – Calibration and Validation Hydrographs ...................................... D-1
Appendix E – References ..................................................................................... E-1

                                                                                    Soap Creek Watershed Hydrologic Assessment | v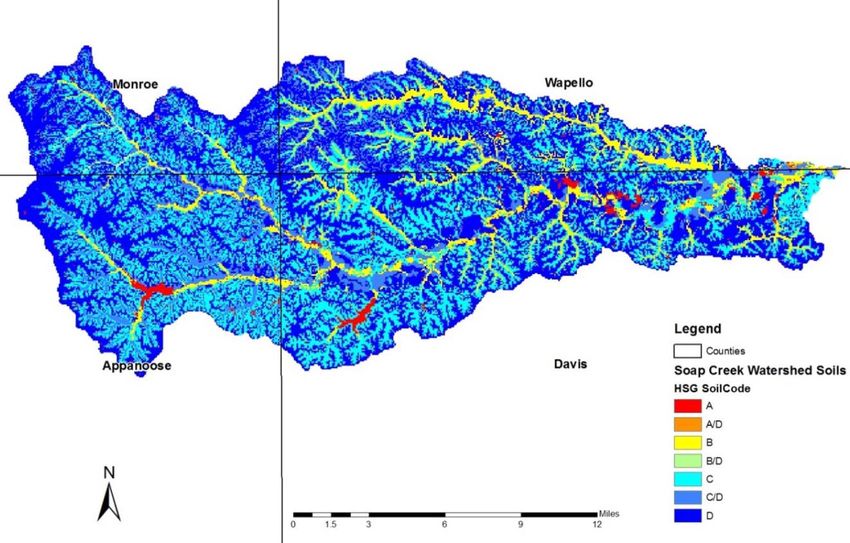
List of Figures
Figure 1.1. Iowa Watersheds Project study areas. ............................................................................ 2
Figure 1.2. Average annual precipitation for Iowa.. ......................................................................... 3
Figure 1.3. Iowa water cycle for four watersheds. ............................................................................ 5
Figure 1.4. Monthly water cycle for four Iowa watersheds. ............................................................. 6
Figure 1.5. Annual maximum peak discharges and the calendar day of occurrence for four Iowa
  watersheds.. .................................................................................................................................... 7
Figure 1.6. Flood occurrence frequency by month for four Iowa watersheds. ................................ 8
Figure 1.7. Time series of mean daily discharge for the period of record. ..................................... 12
Figure 2.1. Soap Creek Watershed (HUC10 071000907)............................................................... 15
Figure 2.2. Land form regions of Iowa and the location of the Soap Creek Watershed. .............. 16
Figure 2.3. Soil Distribution of the Soap Creek Watershed.. ......................................................... 18
Figure 2.4. Topography of the Soap Creek Watershed.. ................................................................. 19
Figure 2.5. Slopes in the Soap Creek Watershed. ........................................................................... 19
Figure 2.6. Land use composition in the Soap Creek Watershed. .................................................20
Figure 2.7. Hydrologic and meteorologic instrumentation in and around the Soap Creek
  Watershed.. ................................................................................................................................... 21
Figure 3.1. Hydrologic processes that occur in a watershed. ......................................................... 23
Figure 3.2. Subbasin delineation in the Soap Creek Watershed HMS hydrologic model. ............ 25
Figure 3.3. Construction progression of the 132 ponds in the Soap Creek Watershed. ................ 26
Figure 3.4. Demonstration of the gridded Stage IV radar rainfall product used in the Soap Creek
  Watershed HMS model. ............................................................................................................... 27
Figure 3.5. Accouting for antecedent moisture conditions in the Fox River Watershed HMS
  model. Precipitation gage records were used to quantify the soil wetness prior to historical
  event and corresponding precent change in Curve Number was applied to each subbasin Curve
  Number to reflect conditions. ...................................................................................................... 31
Figure 3.6. Subbasin runoff hydrograph conceptual model. ......................................................... 32
Figure 4.1. Schematic of a pond constructed to provide flood storage. ......................................... 36
Figure 4.2. Four index locations used for comparing watershed improvement scenarios to
  current conditions. ....................................................................................................................... 38
Figure 4.3. Peak flow reduction for percentage of the area that is upstream of the ponds at
  different index points for 25-year 24-hour design storm (5.28 inches). ....................................40
Figure 4.4. Comparison of hydrographs with 132 ponds and without ponds for the 25-year 24-
  hour design storm (5.28 inches). ................................................................................................. 41
Figure 4.5. Peak discharge reductions for the model with ponds built before 2013. .................... 42

vi | Soap Creek Watershed Hydrologic Assessment
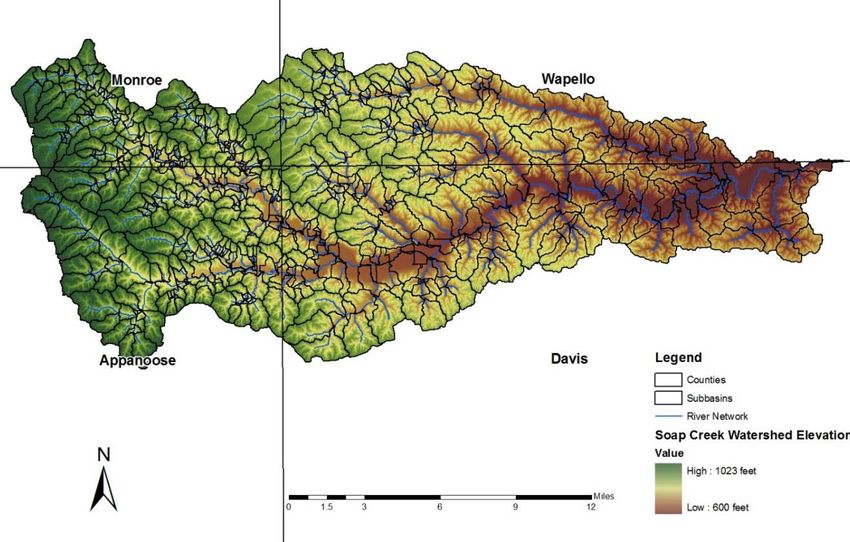
Figure 4.6. Peak Storage for the ponds built before 2013 (132 total) for the 10-year 24-hour
  design storm (4.30 inches). .......................................................................................................... 43
Figure 4.7. Percentage of storage each pond used for the 10-year 24-hour design storm (4.30
  inches). .......................................................................................................................................... 43
Figure 4.8. Peak Storage for the ponds built before 2013 (132 total) for the 25-year 24-hour
  design storm (5.28 inches). .......................................................................................................... 44
Figure 4.9. Percentage of storage each pond used for the 25-year 24-hour design storm (5.28
  inches) ........................................................................................................................................... 44
Figure 4.10. Peak Storage for the ponds built before 2013 (132 total) for the 50-year 24-hour
  design storm (6.08 inches). .......................................................................................................... 45
Figure 4.11. Percentage of storage each pond used for the 50-year 24-hour design storm (6.1
  inches). .......................................................................................................................................... 45
Figure 4.12. Peak Storage for the ponds built before 2013 (132 total) for the 100-year 24-hour
  design storm (6.96 inches). .......................................................................................................... 46
Figure 4.13. Percentage of storage each pond used for the 100-year 24-hour design storm (6.96
  inches). .......................................................................................................................................... 46
Figure 4.14. Runoff Potential Analysis Displayed by Subbasin Boundaries for the 25-year 24
  hour storm (5.28 inches). ............................................................................................................. 47
Figure 4.15. Runoff Potential Analysis Aggregated to HUC12 Boundaries for the 25-year 24 hour
  storm (5.28 inches). ......................................................................................................................48
Figure 4.16. Hydrograph comparison at several locations for the increased infiltration scenario
  resulting from hypothetical land use changes (conversion of row crop agriculture to native
  prairie). Results shown are for the 50-year 24 hour storm (6.08 inches of rain). ..................... 50
Figure 4.17. Percent reductions in peak flow for the increased infiltration scenario due to land
  use changes (conversion of row crop agriculture to native prairie). Peak flow reductions at four
  index points progressing from upstream (left) to downstream (right) are shown for four
  different 24 design storms............................................................................................................ 51
Figure 4.18. Hydrograph comparison at several locations for the increased infiltration scenario
  resulting from hypothetical land use changes (conversion of row crop agriculture to native
  prairie). Results shown are for the 50-year 24 hour storm (6.08 inches of rain). ..................... 52
Figure 4.19. Percent reduction in peak flow for increased infiltration scenario due to land use
  changes (adjust other parameters estimated by CNs). Peak flow reduction at four index
  locations progressing from upstream (left) to downstream (right) are shown for four different
  24 hour design storms. ................................................................................................................. 53
Figure 4.20. Hydrograph comparison at several locations for the increased infiltration scenario
  due to soil improvements (changes in runoff potential only). Improved soil quality was
  represented by converting all Hydrologic Group D (includes A/D, B/D and C/D) to C. Results
  shown are for the 50-year 24 hour storm (6.08 inches of rain). ................................................ 55
Figure 4.21. Percent reductions in peak flow for the increased infiltration scenario due to soil
  improvements (changes in runoff potential only). Improved soil quality was represented by

                                                                                   Soap Creek Watershed Hydrologic Assessment | vii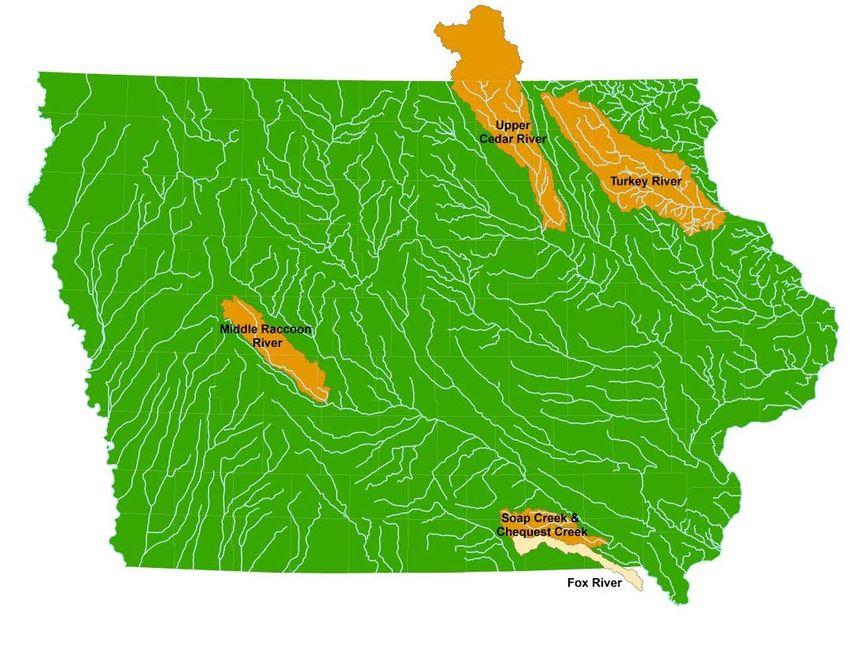
converting all Hydrologic Group D (also includes A/D, B/D and C/D) to C. Peak flow
  reductions at four locations progressing from upstream (left) to downstream (right) are shown
  for four different 24 hour design storms (6.08 inches). ............................................................. 56
Figure 4.22. Hydrograph comparison at several locations for the increased infiltration scenario
  due to soil improvements (changes in runoff potential and travel times with soil quality
  improvements). Improved soil quality was represented by converting all Hydrologic Group D
  (includes A/D, B/D and C/D) to C. Results shown are for the 50-year 24 hour storm (6.08
  inches of rain). .............................................................................................................................. 57
Figure 4.23. Percent reductions in peak flow for the increased infiltration scenario due to soil
  improvements (changes in runoff potential and travel times with soil quality improvements).
  Improved soil quality was represented by converting all Hydrologic Group D (including A/D,
  B/D and C/D) to C. Peak flow reductions at four locations progressing from upstream (left) to
  downstream (right) are shown for four different 24 hour design storms (6.08 inches). .......... 58
Figure 5.1. Comparison of the relative impact of the flood mitigation scenarios for reducing peak
  discharge at the outlet of the Soap Creek .................................................................................... 61
Figure A.1. Soils…..…………………………………………………………………………………………………………A-2
Figure A.2. Watershed slope…………………………………………………………………………………………A-3
Figure A.1. Land Cover…………………………………………………………………………………………………..A-4
Figure A.4. Current Structure locations in the Soap Creek Watershed……………….……………..A-5
Figure A.2. High Runoff Potential by Subbasin with Aerial Imagery………………………….……….A-6
Figure A.6. High Runoff Potential by Subbasin…………………………………………………………………A-7
Figure D. 1. Observed and simulated hydrographs at Bloomfield. Run for the June 2008
  rainfall event with post calibration parameters. ……………………………………………………….…D-1
Figure D. 2. Observed and simulated hydrographs at Bloomfield. Run for the July 2009
  rainfall event with post calibration parameters. ................................................................... D-2
Figure D. 3. Observed and simulated hydrographs at Bloomfield. Run for the August 2009
  rainfall event with post calibration parameters. ................................................................... D-3
Figure D. 4. Observed and simulated hydrographs at Bloomfield. Run for the May 2013
  rainfall event with post calibration parameters. ................................................................... D-4
Figure D. 5. Observed and simulated hydrographs at Bloomfield. Validation for the April
  2010 rainfall event, run with post calibration parameters. ................................................. D-5
Figure D.6. Observed and simulated hydrographs at Bloomfield; validation for the April
  2013 rainfall event, run with post calibration parameters. ................................................. D-6

viii | Soap Creek Watershed Hydrologic Assessment
List of Tables
Table 1.1. Iowa water cycle for four watersheds. The table shows the breakdown of the average
 annual precipitation (100% of the water in each watershed). ...................................................... 4
Table 1.2. Agricultural-related alterations and hydrologic impacts. ............................................. 10
Table 2.1. Summary of soil properties and characteristics generally true of Hydrologic Soil
 Groups A-D. ...................................................................................................................................17
Table 2.2. Hydrologic Soil Group distribution (by percent area) in the Soap Creek Watershed.. 18
Table 2.3. Stage/Discharge and Precipitation Gages in and around the Soap Creek Watershed. 21
Table 3.1. Rainfall depths used for hypothetical scenario analysis. The 24 hour duration point
 rainfall estimates for the 2, 5, 10, 25, 50, and 100 year recurrence intervals were reduced by an
 areal reduction factor of 0.92. ......................................................................................................28
Table 3.2. Curve Numbers Assigned to Each Land Use/Soil Type Combination. Area-weighted
 averaging was used to calculate a single Curve Number value for each subbasin. Curve
 Numbers range from 34-100 with higher values reflecting greater runoff potential. ............... 29
Table 4.1. Stage-Storage-Discharge table for Project 26-32. ......................................................... 37
Table 4.2. Upstream area for Index Point 1 and peak flow reduction for the 25-year 24-hour
 storm (5.28 inches in 24 hours). .................................................................................................. 38
Table 4.3. Upstream area for Index Point 2 and peak flow reduction for the 25-year 24-hour
 storm (5.28 inches in 24 hours). .................................................................................................. 39
Table 4.4. Upstream area for Index Point 3 and peak flow reduction for the 25-year 24-hour
 storm (5.28 inches in 24 hours). .................................................................................................. 39
Table 4.5. Upstream area for the Soap Creek Outlet and peak flow reduction for the 25 year 24-
 hour storm (5.28 inches in 24 hours). ......................................................................................... 39
Table B. 1. Structural data of 132 constructed ponds in Soap Creek………………….………………….B-1
Table C. 1. Soil type comparison between the Soap Creek and Fox River Watersheds…………….C-1
Table C. 2. Land use comparison between the Soap Creek and Fox River Watersheds. .............C-1
Table C. 3. Watershed slope comparison between the Soap Creek and Fox River Watersheds. .C-1

                                                                                 Soap Creek Watershed Hydrologic Assessment | ix
Introduction
Heavy rains and subsequent flooding during the summer of 2008 brought economic, social, and
environmental impacts to many individuals and communities in watersheds across the state of
Iowa. In the response and recovery aftermath, a handful of Watershed Management Authorities
–bodies consisting of representatives from municipalities, counties, and soil and water
conservations districts – were formed locally to tackle local challenges with a unified watershed
approach.
This assessment is part of the Iowa Watersheds Project, a project being undertaken in four
watersheds across Iowa by the Iowa Flood Center located at IIHR—Hydroscience & Engineering
on the University of Iowa campus, and is meant to provide local leaders, landowners and
watershed residents in the Soap Creek Watershed an understanding of the hydrology –
movement of water – within the watershed.
The assessment begins by outlining trends and hydrologic conditions across Iowa, characterizes
the conditions within the Soap and Creek Watershed and compares local conditions to those in
three other watersheds – the Middle Raccoon River, the Upper Cedar River and the Turkey
River.
A hydrologic model of the Soap Creek Watershed, using HEC-HMS, was used to help
understand the effect existing flood mitigation structures have on flood hydrology in the Soap
Creek Watershed, to identify areas in the watershed with high runoff potential, and to run
simulations to investigate the potential impact of additional flood mitigation strategies. Focus
for the scenario development was placed on understanding the impacts of increased infiltration
in the watershed.
The focused hydrologic assessment provides watershed residents and local leaders an additional
source of information and should be used in tandem with additional reports and watershed
plans working to enhance the social, economic, and environmental sustainability and resiliency
of the Soap Creek Watershed.
Soap Creek Watershed Hydrologic Assessment | 11. Iowa’s Flood Hydrology This chapter illustrates facts about Iowa’s water cycle and flood hydrology across the state. Historical records for precipitation and streamflow are examined to describe how much precipitation falls, how that water moves through the landscape, when storms typically produce river flooding, and how Iowa’s hydrology has changed over the past decades and century. As the context for this discussion, we examine the water cycle of the Soap and Chequest Creek Watersheds, as well as that for the three other Iowa watersheds participating in the Iowa Watersheds Project (see Figure 1.1). Figure 1.1. Iowa Watersheds Project study areas. Soap and Chequest Creeks in the southern part of the state are located in the Southern Iowa Drift Plain landform region. Both of these creeks are ungauged, so historical records of streamflow are unavailable. However, the adjoining Fox River watershed, located directly south of Soap and Chequest Creek, has a long streamflow record (USGS 05495000 Fox River at Wayland, drainage area of 400 mi2); we will use the flow records at the adjoining Fox River as an indicator of the runoff characteristics in this portion of the state. The Turkey River (USGS 05412500 Turkey River at Garber) drains 1,545 square miles (mi2), and includes portions of the Iowan Surface and karst topography of the Paleozoic Plateau. The Upper Cedar (USGS 05458500 Cedar River at Janesville) begins in Minnesota, and drains 1,661 mi2 — mostly from the Iowan Surface landform. The Middle Raccoon River drains 375 mi2 (USGS 05483450 Middle Raccoon River near Bayard), and is located in the west-central part of the state. The 2 | Soap Creek Watershed Hydrologic Assessment
upper part of the Middle Raccoon is located in flat terrain of the Des Moines Lobe, while the
lower part is located within the Southern Iowa Drift Plain.

a. Hydrology in Iowa and the Iowa Watersheds Project Study Areas
i. Statewide Precipitation
Iowa’s climate is marked by a smooth transition of annual precipitation from the southeast to
the northwest (see Figure 1.2). The average annual precipitation reaches 40 inches in the
southeast corner, and drops to 26 inches in the northwest corner. Of the four Iowa Watersheds
Project study areas, Soap/Chequest along the southern border has the largest annual
precipitation (38.8 inches), followed by the Turkey River (36.3 inches) and the Upper Cedar
River (35.1 inches) in the northeast portion of the state, and then the Middle Raccoon (35.0
inches) in the western half of the state.

                                       Upper Cedar
                                          River

                                                                                   Turkey
                                                                                   River

                              Middle Raccoon
                                                        Soap/Chequest
                                   River
                                                           Creeks

Figure 1.2. Average annual precipitation for Iowa. Precipitation estimates are based on the 30-year
annual average (1981-2010) for precipitation gauge sites. Interpolation between gauge sites to an
800 m grid was done by the PRISM (parameter-elevation relationships on independent slopes
model) method. (Data source: http://www.prism.oregonstate.edu/).

                                                       Soap Creek Watershed Hydrologic Assessment | 3
ii. The Water Cycle in Iowa
Of the precipitation that falls across the state, most of it evaporates into the atmosphere — either
directly from lakes and streams, or by transpiration from crops and vegetation. What does not
evaporate drains into streams and rivers (see Table 1.1).
Table 1.1. Iowa water cycle for four watersheds. The table shows the breakdown of the average
annual precipitation (100% of the water in each watershed).
Precipitation (%) Evaporation (%) Surface Flow (%) Baseflow (%)
Fox 1 100 69.2 19.2 11.6
Middle Raccoon 100 73.5 8.9 17.5
Upper Cedar 100 68.5 9.8 21.7
Turkey 100 69.4 9.0 21.6
Evaporation
In Iowa, the majority of water leaves by evaporation; for the four Iowa watershed study areas,
evaporation accounts for about 68% of precipitation in the Upper Cedar, and 69% in the Fox
and Turkey Rivers. As one moves westward in the state, a larger fraction evaporates; for the
Middle Raccoon, evaporation accounts for almost 74% of the precipitation.
Surface Flow
The precipitation that drains into streams and rivers can take two different paths. During rainy
periods, some water quickly drains across the land surface, and causes streams and rivers to rise
in the hours and days following the storm. This portion of the flow is often called “surface flow”,
even though some of the water may soak into the ground and discharge later (e.g., a tile drainage
system).
Baseflow
The rest of the water that drains into streams and rivers takes a longer, slower path; first it
infiltrates into the ground, percolates down to the groundwater, and then slowly moves towards
a stream. The groundwater eventually reaches the stream, maintaining flows in a river even
during extended dry periods. This portion of the flow is often called “baseflow”.
A watershed’s geology helps determine the partitioning of precipitation runoff into surface flow
and baseflow. The Turkey River has the largest ratio of baseflow to surface flow (2.4): about 22%
of precipitation leaves as baseflow, and 9% leaves as surface flow. Most likely, the karst
limestone geology in portions of the watershed (with its enhanced surface drainage) contributes
to a higher baseflow ratio. The ratio of baseflow to surface flow is slightly lower in the Upper
Cedar (2.2), with its 22% baseflow and 10% surface flow, and the Middle Raccoon (2.0), with its
17% baseflow and 9% surface flow. For the Fox River, the partitioning is reversed; more water
leaves as surface flow (19%) than as baseflow (12%), so its baseflow ratio is less than one (0.6).
1 Both Soap and Chequest Creek Watersheds are ungauged, so historical records of streamflow are
unavailable. However, the adjoining Fox River Watershed, located directly south of Soap and Chequest
Creek, has a long streamflow record (USGS 05495000 Fox River at Wayland, drainage area of 400 mi2);
we will use the flow records at the adjoining Fox River as an indicator of the hydrology in this portion of
the state.
4 | Soap Creek Watershed Hydrologic AssessmentThis region consists of loess ridges and glacial till side slopes; steep slopes move water quickly to
the valley, and those locations with flatter slopes typically contain high clay contents (42 to 48%
in the subsoil) that limit infiltration in the ground. Figure 1.3 illustrates the water cycle
components for the four Iowa watersheds, and clearly illustrates that the Fox is a more surface
flow dominated river.
Figure 1.3. Iowa water cycle for four watersheds. The chart shows the partitioning of the average
annual precipitation depth (in inches) into evaporation, surface flow, and baseflow components. 2
iii. Monthly Water Cycle
Across the state, Iowa watersheds exhibit a similar cycle of average monthly precipitation and
streamflow (see Figure 1.4). Precipitation is at its lowest in winter months; still, the precipitation
is often in the form of snow, and can accumulate within the watershed until it melts (especially
in the northernmost watersheds). Spring is marked by an increase in precipitation, the melting
of any accumulated winter snow, and low evaporation before the growing season begins; these
factors combine to produce high springtime streamflows.
Northern watersheds tend to see their peak average monthly streamflow in early spring (March
or April), as snow accumulation and melt is more pronounced; southern watersheds tend to see
their peak in late spring or summer (May and June). As crops and vegetation evaporate more
and more water as we enter the summer months, moisture in the soil is depleted and the average
monthly streamflow decreases (even though average monthly rainfall amounts are relatively
high).
2 The average annual precipitation estimates are based on the 30-year averages for the state (see Figure
1.2). Flow records were obtained for USGS streamgages for the same 30-year period (1981-2010); a
continuous baseflow separation filter was used to estimate the surface flow and baseflow components.
Evaporation was estimated by water budget analysis.
Soap Creek Watershed Hydrologic Assessment | 5Figure 1.4. Monthly water cycle for four Iowa watersheds. The plots show the average monthly precipitation (in inches) and the average monthly streamflow (in inches). The average monthly estimates for precipitation and streamflow are based on the same 30-year period (1981-2010). 6 | Soap Creek Watershed Hydrologic Assessment
iv. Flood Climatology
The largest flows observed in Iowa’s rivers follow a slightly different seasonal pattern. Figure 1.5
shows the annual maximum peak discharges (or the largest stream flow observed each year) and
the calendar day of occurrence.

Figure 1.5. Annual maximum peak discharges and the calendar day of occurrence for four Iowa
watersheds. The plots show all annual maximums for the period of record at four USGS streamgage
sites: (a) Cedar River at Janesville, (b) Turkey River at Garber, (c) Middle Raccoon at Bayard, and
(d) Fox River at Wayland. The mean annual flood for each site is shown by the horizontal line.

For the northernmost watersheds (Cedar and Turkey) annual maximums often occur in March
or April. These maximums may be associated with snow melt, rain on snow events, or heavy
spring rains when soils are often near saturation. Still, the largest annual maximums all
occurred in the summer season, when the heaviest rainstorms occur.

In contrast, the majority of all annual maximums occur in summer for the Middle Raccoon. For
the Fox River, annual maximums are more evenly distributed throughout the year; as noted
earlier, this river is surface flow dominated, and whenever heavy rainfall occurs during the year,
large river flow can occur. Like the northernmost basins, both the Middle Raccoon and the Fox
River see their largest annual maximums in the summer.

In addition to the annual maximums, Figure 1.5 also shows the mean annual flood for each river
(the average of the annual maximums). For most rivers, the mean annual flood serves as a good
approximate threshold for flooding. As can be seen, there are many years when the annual
maximum peak discharge is not large enough to produce a flood. Figure 1.6 shows an estimate of

                                                        Soap Creek Watershed Hydrologic Assessment | 7
the occurrence frequency for flood events (annual maximums that exceed the mean annual flood). Figure 1.6. Flood occurrence frequency by month for four Iowa watersheds. The plots show the percent of peak annual discharges for a given month that exceed the mean annual flood at four USGS streamgage sites: (a) Cedar River at Janesville, (b) Turkey River at Garber, (c) Middle Raccoon at Bayard, and (d) Fox River at Wayland. For the northernmost watersheds (Cedar and Turkey) the peak of flood occurrences is March. Both have a smaller secondary peak in summer. For the Middle Raccoon, nearly all the flood flows have occurred in late spring to early summer (May to July). Floods have occurred in all months except December and January in the Fox River watershed, although the peak flood occurrence is also in the late spring to early summer. b. Hydrological Alterations in Iowa and the Iowa Watersheds Project Study Areas Although the hydrologic conditions presented for the Iowa Watersheds Project study areas illustrate the historical water cycle, the watersheds themselves are not static; historical changes have occurred that have altered the water cycle. In this section, we discuss the hydrological alterations of Iowa’s watersheds, and look for evidence of these alterations in long-term streamflow records. 8 | Soap Creek Watershed Hydrologic Assessment
i. Hydrological Alterations from Agricultural-Related Land Use Changes
The Midwest, with its low-relief poorly-drained landscape, is one of the most intensively
managed areas in the world (Pimentel, 2012). With European-descendent settlement, most of
the land was transformed from low-runoff prairie and forest to higher-runoff farmland. Within
Iowa, the land cover changes in the first decades of settlement occurred at an astonishing rate
(Wehmeyer et al., 2011). Using land cover information obtained from well-documented studies
in 1859, 1875, and 2001, Wehmeyer et al. (2011) estimated that the increase in runoff potential
in the first thirty years of settlement represents the majority of predicted change in the 1832 to
2001 study period.

Still, other transformations associated with an agricultural landscape have also impacted runoff
potential (see Table 1.2). For example, the introduction of conservation practices in the second
half of the 20th century tend to reduce runoff, as suggested by a recent study of an Iowa
watershed (Papanicolaou). The Conservation Reserve Program (CRP) originally began in 1950s.
Many programs were established in the 1970s to remove lands from agricultural production and
establish native or alternative permanent vegetative cover; in an effort to reduce erosion and
gulley formation, practices such as terraces, conservation tillages, and contour cropping were
also encouraged. The Farm Bill of 1985 was the first act that officially established the CRP as we
know it today, followed by expanded activities through the Bills of 1990, 1996, 2002, and 2008.
The timeline of agriculture-driven land use changes and its impacts on local hydrology are
summarized in Table 1.2.

                                                       Soap Creek Watershed Hydrologic Assessment | 9
Table 1.2. Agricultural-related alterations and hydrologic impacts.
Timeline Land use status, change & interventions Hydrologic effect(s) Source
1830s - Prior Native vegetation (tallgrass prairies and Baseflow dominated Petersen (2010)
broad-leaved flowering plants) dominate flows; slow response
the landscape to precipitation events
1830-1980 Continuous increase of agricultural Elimination of water Jones & Schilling
production by replacement of perennial storage on the land; (2011); Knox
native vegetation with row crops acceleration of the (2001)
1940:ii. Hydrological Alterations Induced by Climate Change
Over periods ranging from decades to millions of years, Iowa has seen significant changes to its
climate. Studies show that since the 1970s, Iowa and the Midwest have seen increases in annual
and seasonal precipitation totals, and changes in the frequency of intense rain events and the
seasonality of timing of precipitation (Takle, 2010). Large increases in runoff and flood
magnitudes in the north central U.S. (including Iowa) have prompted scientific inquiries to
unequivocally attribute these changes to driving factors (Ryberg et al., 2012). Although recent
agricultural land use changes, such as the transition from perennial vegetation to seasonal
crops, is an important driver (Schilling et al, 2008; Zhang and Schilling, 2006), other
investigations show that climate-related drivers may be an equal or more significant contributor
to recent hydrologic trends (Ryberg et al., 2012; Frans et al., 2013).
iii. Hydrological Alterations Induced by Urban Development
Although Iowa remains an agriculural state, a growing portion of its population resides in urban
areas. The transition from agricultural to urban land uses has a profound impact on local
hydrology, increasing the amount of runoff, the speed at which water moves through the
landscape, and the magnitude of flood peaks. The factors that contribute to these increases
(Meierdiercks et al., 2010) are the increase in the percentage of impervious areas within the
drainage catchment and its location (Mejia et al., 2010), and the more efficient drainage of the
landscape associated with the constructed drainage system — the surface, pipe, and roadway
channels that add to the natural stream drainage system. Although traditional stormwater
management practices aim to reduce increased flood peaks, urban areas have long periods of
high flows that can erode its stream channels and degrade aquatic habitat.
iv. Detecting Streamflow Changes in Iowa’s Rivers
Hydrologic alterations in Iowa watersheds were tested through the analysis of changes in the
long-term flow at the stream-gaging sites. The identification of statistically significant shifts in
the flow time series was made using the approach developed by Villarini et al. (2011). Figure 1.7
shows the results of the analysis for mean daily discharge for the four Iowa watersheds. Note the
streamgage record for the Middle Raccoon River at Bayard does not begin until 1980, so analysis
results are shown for the downstream streamgage for the Raccoon River at Van Meter, where
the record spans 96 years.
Soap Creek Watershed Hydrologic Assessment | 11Figure 1.7. Time series of mean daily discharge for the period of record. An analysis was carried out to detect changes in the statistical characteristics of mean daily discharge; the vertical dashed lines indicate the location of any identified change point. All four watersheds have statistically significant changes in mean daily discharge, occurring between 1968 and 1978. Streamflow since the 1970s is slightly higher than before, and its year- to-year variability has increased noticeably. The trends seen in the Iowa Watersheds Project study areas are common among many Iowa watersheds. Similar outcomes are observed for a measure of low flows (the 5% daily discharge for the year); all the detected changes occur within the narrow period between 1968 and 1972. Changes in a measure of high flows (the maximum daily discharge for the year) are not as clear. No statistically significant changes were detected for two watersheds (Cedar and Turkey); for the Raccoon, changes were detected in 1943, and in 1978 for the Fox River. Still, the general tendencies observed for mean and low flows — increased flow amounts and greater variability in the last 40 years — are also observed for high flows, even if the changes are not statistically significant. Overall, the evidence suggests that Iowa (and elsewhere in the Midwest) has experienced long- term changes in the nature of streamflow (around 1970). The reasons for these changes is still the subject of intense on-going research (e.g., Mora et al., 2013; Frans et al, 2013; Shawn et al., 2013; Yiping et al., 2013). Still, Iowans have all seen the impacts of increased and more highly variable flows; the widespread flooding in 1993 and 2008 mark two visible examples. 12 | Soap Creek Watershed Hydrologic Assessment
c. Summary of Iowa’s Flood Hydrology
The hydrologic assessment begins by looking at the historical conditions within Iowa
watersheds, and moves on to predicting their flooding characteristics. Ultimately, for
watersheds to prevent flooding, large- and small-scale mitigation projects directed towards
damage reduction will be proposed and implemented. In many instances, projects aim to change
the hydrologic response of the watershed, e.g., by storing water temporarily in ponds, enhancing
infiltration and reducing runoff, etc. Such changes have (and are designed to have) significant
local water cycle effects; cumulatively, the effects of many projects throughout the watershed
can also have impacts further downstream. Still, it is important to recognize that all Iowa
watersheds are undergoing alterations — changes in land use, conservation practices, increases
in urban development, and changes in weather with a changing climate. Therefore, a watershed-
focused strategy, which considers local interventions and their impacts on the basin as a whole,
within the historical context of a changing water cycle, is needed for sound water resources
planning.

                                                     Soap Creek Watershed Hydrologic Assessment | 13
2. Conditions in the Soap Creek Watershed This chapter provides an overview of the current Soap Creek Watershed conditions including hydrology, geology, topography, landuse, hydrologic/meteorologic instrumentation, as well as a summary of previous floods of record. Detailed maps of related material can be found in Appendix A. a. Hydrology The Soap Creek Watershed as defined by the boundary of ten-digit Hydrologic Unit Code (HUC10) 0710000907 has a drainage area of approximately 258 square miles. It is located in Southeast Iowa and is a sub-watershed within the Lower Des Moines River eight-digit Hydrologic Unit Code (HUC8 0710009). The Soap Creek Watershed falls within a portion of Appanoose, Davis, Monroe, and Wapello Counties. Soap Creek flows from west to east, with two headwater branches, North and South Soap Creek. These two branches come together in Davis County and flow continues eastward. Little Soap Creek traverses southern Wapello County and enters Soap Creek northeast of Floris, Iowa. Soap Creek then continues to its outlet, discharging into the Des Moines River approximately 12 miles southeast of Ottumwa. Flow conditions are classified as intermittent on the lower 18 miles of Little Soap Creek (United States Department of Agriculture, 1988). Intermittent streams generally have flow occurring only during the wet season (50 percent of the time or less) (Mays, 2010). South Soap Creek is below Lake Sundown, and the lower end of the larger tributaries. Flow conditions in other channels are classified as ephemeral (United States Department of Agriculture, 1988). Ephemeral streams generally have flow occurring during and for short periods after storms. These streams are typical of climates without very well-defined streams (Mays, 2010). Two large recreational lakes are located in the watershed: Lake Sundown, a 470 acres private lake situated on South Soap Creek, and Lake Wapello, a 287 acres state-owned lake suited on Pee Dee Creek. Average annual precipitation for this region of Southeast Iowa is roughly 39 inches (PRISM, 1981-2010), with about 80% of the annual precipitation falling as rain during the months of April - September. During this period, thunderstorms capable of producing torrential rains are possible with the peak frequency of such storms occurring in June. 14 | Soap Creek Watershed Hydrologic Assessment
Figure 2.1. The Soap Creek Watershed (HUC10 071000907) drains approximately 258 mi 2.

                                                   Soap Creek Watershed Hydrologic Assessment | 15
b. Geology and Soils The entire Soap Creek Watershed is located within the Southern Iowa Drift Plain (see Figure 2.2). This region is dominated by glacial deposits left by ice sheets that extended south into Missouri over 500,000 years ago. The deposits were carved by deepening episodes of stream erosion so that only a horizon line of hill summits marks the once-continuous glacial plain. Numerous rills, creeks, and rivers branch out across the landscape shaping the old glacial deposits into steeply rolling hills and valleys. A mantle of loess drapes the uplands and upper hill slopes (Iowa Geological &Water Survey, The Iowa Department of Natural Resources, 2014). Figure 2.2. Land form regions of Iowa and the location of the Soap Creek Watershed. Soils are classified into four Hydrologic Soil Groups (HSG) by the Natural Resources Conservation Service (NRCS) based on the soil’s runoff potential. The four HSG’s are A, B, C, and D, where A-type soils have the lowest runoff potential and D-type have the highest. In addition, there are dual code soil classes A/D, B/D, and C/D that are assigned to certain wet soils. The first letter applies to the drained condition and the second applies to the undrained condition. In the case of these soil groups, even though the soil properties may be favorable to allow infiltration (water passing from the surface into the ground), a shallow groundwater table (within 24 inches of the surface) typically prevents much from doing so. For example, a B/D soil will have the runoff potential of a B-type soil if the shallow water table were to be drained away, but the higher runoff potential of a D-type soil if it is not. Table 2.1 summarizes some of the properties generally true for each HSG A-D. This table is meant to provide a general description 16 | Soap Creek Watershed Hydrologic Assessment
of each HSG and is not all inclusive. Complete descriptions of the Hydrologic Soil Groups can be
found in USDA-NRCS National Engineering Handbook, Part 630 – Hydrology, Chapter 7.

Table 2.1. Summary of soil properties and characteristics generally true of Hydrologic Soil Groups
A-D.
                                                                                          Minimum
                                                                                      Infiltration Rate1
   Hydrologic Soil   Runoff Potential      Soil Texture           Composition           (inches/hour)
                                                                  < 10% clay
         A                 Low             Sand, gravel                                     > 5.67
                                                               > 90% sand/gravel
                                           Loamy sand,           10 – 20% clay
         B           Moderately low                                                       1.42 – 5.67
                                           sandy loam            50 – 90% sand

                                         Loam containing         20 – 40% clay
         C           Moderately high                                                      0.14 – 1.42
                                          silt and/or clay        < 50% sand

                                                                   > 40% clay
         D                High                 Clay                                         < 0.14
                                                                     < 50%
1 For
    HSG A-C, infiltration rates based on a minimum depth to any water impermeable layer and the
ground water tabe of 20 and 24 inches, respectively.

                                                          Soap Creek Watershed Hydrologic Assessment | 17
The soil distribution of the Soap Creek Watershed per digital soils data (SSURGO) available
from the USDA-NRCS Web Soil Survey (WSS) is shown in Figure 2.3.
Figure 2.3. Soil Distribution of the Soap Creek Watershed. Hydrologic Soil Group reflects the
degree of runoff potential a particular soil has, with Type A(Red) representing the lowest runoff
potential and Type D (Dark Blue) representing the highest runoff potential. The dominant soil type
in the basin is HSG D (48%).
The primary soil types are C, C/D and D (32.7%, 10.0% and 48.1%, respectively). These soils do
not allow much water to infiltrate into the ground, resulting in the majority of areas considered
high runoff potential. Table 2.2 shows the approximate percentages by area of each soil type for
the Soap Creek Watershed.
Table 2.2. Hydrologic Soil Group distribution (by percent area) in the Soap Creek Watershed.
Soil Type (HSG) Runoff Potential Approximate Area (%)
A Lower ~0
A/D ~0
B 8.9
B/D 0.3
C 32.7
C/D 10.0
D Higher 48.1
c. Topography
The topography is characterized by irregular narrow ridges with steep slopes and narrow gullied
valleys. Elevation ranges from 1,023 feet to 600 feet at the outlet (see Figure 2.4). Land slopes
18 | Soap Creek Watershed Hydrologic Assessmentare between 0-161% (A flat surface is 0%, a 45 degree surface is 100 percent, and as the surface
becomes more vertical, the percent rise becomes increasingly larger.) (see Figure 2.5).
Figure 2.4. Topography of the Soap Creek Watershed. Elevations range from 1,023 feet to 600 feet.
Figure 2.5. Slope of the Soap Creek Watershed, ranges from 0 to 161%.
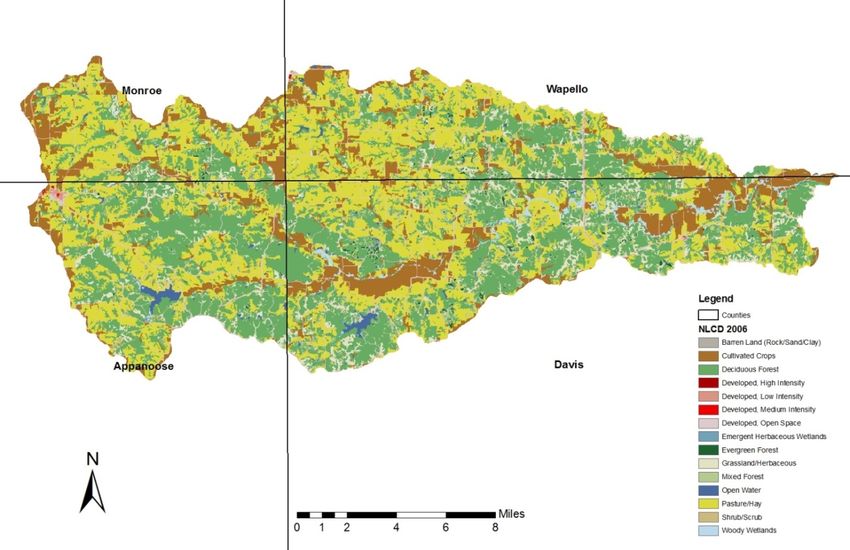
Soap Creek Watershed Hydrologic Assessment | 19d. Land use The Soap Creek Watershed is comprised of approximately 35% pasture/hay and 35% deciduous forest, evenly distributed within the watershed (see Figure 2.6). Other major land use includes cultivated crops, grassland, and developed open space consisting of 14%, 5% and 3%. There are also several small cities in the watershed: Moravia, Blakesburg, Unionville, Udell and Floris. Approximately 90% of the land within the watershed is privately owned. Figure 2.6. Land use composition in the Soap Creek Watershed. 20 | Soap Creek Watershed Hydrologic Assessment
e. Instrumentation/ data records
Soap Creek Watershed is gaged with only four Iowa Flood Center (IFC) stream-stage sensors.
The IFC sensors provides a water level measurement every 15 minutes. In addition, there are
four United States Geological Survey (USGS) operated stage/discharge gages and three National
Oceanic and Atmosphere Administration (NOAA) 15 minute/hourly precipitation gages near the
watershed. Figure 2.7 and Table 2.3 detail the period of record and location of the hydrologic
and meteorologic instrumentation.

Figure 2.7. Hydrologic and meteorologic instrumentation in and around the Soap Creek Watershed.

Table 2.3. Stage/Discharge and Precipitation Gages in and around the Soap Creek Watershed.
   Gage Type                             Location                              Period of Record
   IFC Stream Stage Sensor - LTLSOAP01   Floris, IA                            2012 - present
   IFC Stream Stage Sensor - SOAPCR01    Floris, IA                            2012 - present
   IFC Stream Stage Sensor - SOAPCR02    Drakesville, IA                       2012 - present
   IFC Stream Stage Sensor - SOAPCR03    Unionville, IA                        2012 - present
   USGS Stage/Discharge - 05494300       Fox River at Bloomfield, IA           1906 - present
   USGS Stage/Discharge - 06904010       Chariton River near Moulton, IA       1979 - present
   USGS Stage/Discharge - 06903900       Chariton River near Rathbun,IA        1963 - 1969
   USGS Stage/Discharge - 05489500       Des Moines River at Ottumwa, IA       1917 – present
   NOAA 15 Min/Hourly Precipitation      Ottumwa Industrial Airport, IA        1948 – 2013
   NOAA-partnered Daily Precipitation    Bloomfield, IA                        1906 – present
   NOAA 15 Minute/Hourly Precipitation   Centerville, IA                       1948 – 2013

                                                      Soap Creek Watershed Hydrologic Assessment | 21
f. Floods of Record Flooding from Soap Creek and its tributaries occurs nearly every year and more often in some reaches (United States Department of Agriculture, 1988). In 1986, Soap Creek flooded seven times, with major flooding occurring on April 30; rainfall of 2.5 to 4.0 inches over the upper end of the watershed caused the flooding (United States Department of Agriculture, 1988). Since there is no streamgage present within the Soap Creek Watershed, a historical record of flood peak discharges does not exist. However, since the installation of the four IFC stream stage senors in 2012, high water depths have been recorded three times: March 10, 2013; April 18, 2013 and May 29, 2013. 22 | Soap Creek Watershed Hydrologic Assessment
3. Soap Creek Hydrologic Model Development
This chapter summarizes the development of the hydrologic model used in the Phase I
Hydrologic Assessment for the Soap Creek Watershed. The modeling was performed using the
United States Army Corps of Engineers’ (USACE) Hydrologic Engineering Center’s Hydrologic
Modeling System (HEC-HMS), Version 3.5.

The Hydrologic Modeling System (HMS) is designed to simulate the precipitation-runoff
processes of a watershed. It is designed to be applicable in a wide range of geographic areas and
for watersheds ranging in size from very small (a few acres) to very large (the size of the Soap
Creek Watershed or larger). Figure 3.1 reviews the water cycle and major hydrologic processes
that occur in a watershed.

Figure 3.1. Hydrologic processes that occur in a watershed. Phase I modeling only considered the
precipitation, infiltration, and overland components of the water cycle.

HMS is a mathematical, lumped parameter, uncoupled, surface water model. Each of these
items will be briefly discussed, as each descriptor plays a role in the models’ input demands,
assumptions required, and final applicability for using the model’s results. The fact that HMS is
a mathematical model implies the different hydrologic processes (shown in Figure 3.1 above) are
represented by mathematical expressions that were developed to best describe observations or
controlled experiments. HMS is a lumped parameter model, meaning physical characteristics of
the watershed, such as land use and soil type, are “lumped” together and averaged to produce a
single representative value for a given land area. Once these averaged values are established
within HMS, the value remains constant throughout the simulation, instead of varying over

                                                     Soap Creek Watershed Hydrologic Assessment | 23
time. HMS is an uncoupled model, meaning the different hydrologic processes are solved independent of one another rather than jointly. In reality, surface and subsurface processes are dependent on one another and their governing equations should be solved simultaneously (Scharffenberg and Fleming, 2010). Finally, HMS is a surface water model, meaning it works best for simulating (large) storm events or wet antecedent conditions where direct runoff and overland flow is expected to dominate the partitioning of rainfall. The two major components of the hydrologic modeling within HMS are the basin model and the meteorological model. The basin model defines the hydrologic connectivity of the watershed, defines how rainfall is converted to runoff, and how water is routed from one location to another. The meteorological model stores precipitation data that defines when, where and how much it rains over the watershed. a. Model Development In this project, two hydrologic models have been developed: one is for the Soap Creek Watershed, and another for the Fox River Watershed. Some HEC-HMS model parameters are best estimated by a trial-and-error “calibration” process, where the parameters are changed and the performance of the model is compared to observations. The Soap Creek Watershed has no USGS streamgages, so model parameters cannot be calibrated directly. In contrast, the Fox Creek Watershed has a historical record, and model parameters can be estimated by calibration. In this situation, calibration model parameters (for the Fox River) can be transposed for use in the model of the ungauged watershed (Soap Creek). Section3.b will explain more about this indirect calibration method and why the Fox River was selected. Since the hydrologic model for both the Soap Creek Watershed and Fox River Watershed were developed using the same method, we only provide the details of developing the Soap Creek Watershed model. The Soap Creek Watershed is approximately 258 squares miles. For modeling purposes, the entire watershed was divided into 642 smaller drainages areas, called subbasins in HMS; the average subbasin area is 0.39 square miles (250 acres), and the largest subbasin area is 3.9 square miles (2,500 acres). Figure 3.2 shows the subbasin delineation for use in the Soap Creek Watershed. 24 | Soap Creek Watershed Hydrologic Assessment
You can also read