Evaluation of Standard Right-of-Way Fence Post
←
→
Page content transcription
If your browser does not render page correctly, please read the page content below
FHWA NJ 2000-07

Evaluation of Standard Right-of-Way Fence Post
        Anchors Versus Drive Anchors
                            FINAL REPORT
                             February 2001

                                 Submitted
                                    by
                          Mr. Patrick Szary
               Research Engineer and Associate Director

        Mr. Judson Wible                          Dr. Ali Maher
   Graduate Research Assistant               Professor and Chairman

                Dept. of Civil & Environmental Engineering
        Center for Advanced Infrastructure & Transportation (CAIT)
                      Rutgers, The State University
                       Piscataway, NJ 08854-8014

                   NJDOT Research Project Manager
                          Mr. Raj Chawla

                            In cooperation with

                                New Jersey
                       Department of Transportation
                   Division of Research and Technology
                                   and
                    U.S. Department of Transportation
                      Federal Highway Administration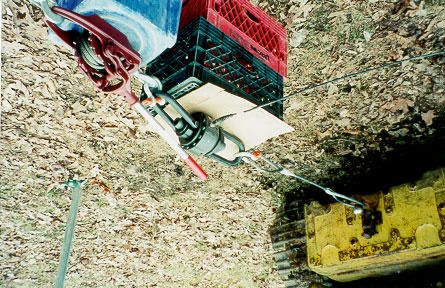
Disclaimer Statement
     "The contents of this report reflect the views of the
   author(s) who is (are) responsible for the facts and the
  accuracy of the data presented herein. The contents do
  not necessarily reflect the official views or policies of the
  New Jersey Department of Transportation or the Federal
  Highway Administration. This report does not constitute
          a standard, specification, or regulation."

  The contents of this report reflect the views of the authors,
   who are responsible for the facts and the accuracy of the
information presented herein. This document is disseminated
 under the sponsorship of the Department of Transportation,
 University Transportation Centers Program, in the interest of
  information exchange. The U.S. Government assumes no
            liability for the contents or use thereof.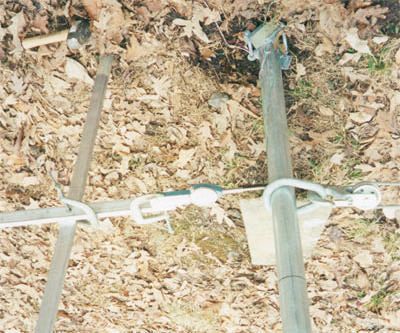
TECHNICAL REPORT STANDARD TITLE
 1. Report No.                                                  2. Government Accession No.                                    3.     Recipient’s Catalog No.

FHWA 2000-07
 4.   T i t l e an d S u b t i t l e                                                                                           5.     Report Date
Evaluation of Standard Right-of-Way Fence Post Anchors Versus                                                                   February 2001
Drive Anchors                                                                                                                  6. P e r f o r m in g O r g a n i z a t i o n C o d e
                                                                                                                                CAIT/Rutgers
 7.   Author(s)                                                                                                                 8. Performing Organization Report
                         Mr. Patrick Szary, Mr. Judson Wible, and                                                               No.
                         Dr. Ali Maher                                                                                          FHWA 2000-07
 9. Performing Organization Name and                                                                                           10. Work Unit No.
 Address
 New Jersey Department of Transportation
 CN 600                                                                                                                         11.     Contract or Grant No.

 Trenton, NJ 08625
                                                                                                                               13.     Type of Report and Period Covered
 12. Sponsoring Agency Name and
 Address
                                                                                                                                Final Report
Federal Highway Administration                                                                                                  6/27/1997 - 3/31/1999
U.S. Department of Transportation
                                                                                                                               14.     Sponsoring Agency Code
Washington, D.C.
15.     Supplementary Notes

16. A b s t r a c t
Right-of-way fence installation has not received a great deal of attention in literature during
past years, because traditionally common construction practice used concrete for the
fencing footings.1 In hard to access areas like wetlands, steep roadway cuts, and wooded
terrain commonly associated with locations that need right-of-way fencing, alternative
simple system footings are sometimes used. Recent roadside field installations have
demonstrated a potential for satisfactory performance of the simple systems. The main
objective of this research is to compare the viability of these simple systems to concrete
foundations. Field testing was conducted to evaluate the deflection performance of the
posts installed in “concrete” versus “drive anchors.” A static load was applied to each post
system at two feet above grade. Also, an FEM analysis was conducted to simulate actual
site testing conditions. Based on this research, the drive anchors and the concrete
systems both performed within tolerable limits established in this study. It was also
determined that in areas where only manual means of installation could be used there was
a significant cost savings in favor of the drive anchors. In summary, the results indicate that
the drive anchor and the concrete systems can be used interchangeably.

17. K e y W o r d s                                                                          18. D i s t r i b u t i o n S t a t e m e n t

 right of way, drive anchor, concrete, footing,
 fence post, fencing,

19. S e c u r i t y C l a s s i f ( o f t h i s r e p o r t )     20. S e c u r i t y C l a s s i f . ( o f t h i s                     21. No of                22. P r i c e

Unclassified                                                     Unclassified                                                           64
Form DOT F 1700.7 (8-69)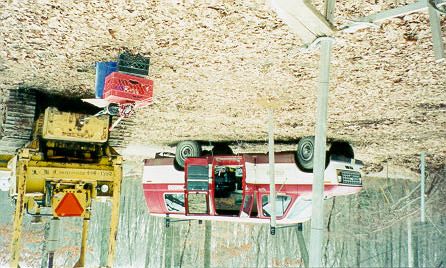
Acknowledgements

The authors wish to express their appreciation to the New Jersey Department of
Transportation for the allotment of funds making this research possible. Special thanks are
extended to Mr. Raj Chawla and Mr. Frank Palise of the NJDOT for their support and
extending the opportunity to participate in such a significant and extensive research program.
The authors would also like to thank Dr. Gary R. Consolazio and Jae H. Chung of the Univ. of
Florida, Dept. of Civil Engineering for their efforts on the Finite Element Modeling and
Analysis of Fence Post Anchorage Systems portion of this report.

                                              ii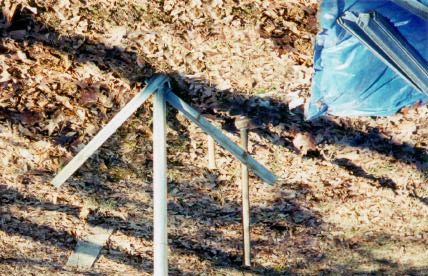
TABLE OF CONTENTS
                                                                                                                        Page
Abstract................................................................................................................................... 1
Introduction.............................................................................................................................. 1
   Mechanisms of Failure ........................................................................................................ 3
   Comparison......................................................................................................................... 3
   NJDOT Approved Fence Contractors................................................................................. 5
   Post Type ............................................................................................................................ 7
      End, Corner, and Pull Posts............................................................................................ 7
      Line Posts........................................................................................................................ 7
   Breaking Loads of Fence Fabric ......................................................................................... 8
Experiment .............................................................................................................................. 9
   Background for Pullouts ...................................................................................................... 9
   Finite Element Modeling ...................................................................................................... 9
   Site Selection..................................................................................................................... 10
   Installation of Fence Posts ................................................................................................ 12
   Post Pull-out Set-up .......................................................................................................... 15
   Testing............................................................................................................................... 17
Data and Analysis ................................................................................................................. 18
   Field Testing Results......................................................................................................... 18
   Analysis of 2.5 inch diameter posts .................................................................................. 19
   Analysis of 3 inch diameter posts ..................................................................................... 21
   Yielding verification in concrete footing ............................................................................. 24
   Material and Labor Costs .................................................................................................. 24
FEM Verification of Results................................................................................................... 27
Conclusions .......................................................................................................................... 29
Appendix 1 Finite Element Modeling and Analysis of Post Anchorage Systems ................. 31
   Introduction ........................................................................................................................ 31
   Analysis Software Chosen ................................................................................................ 32
   Constitutive Models for Materials....................................................................................... 33
   Analysis Models................................................................................................................. 36
      Dimensions of the Steel Post........................................................................................ 36
      Model I : Concrete Footing System .............................................................................. 36
      Model II : Steel anchor System...................................................................................... 39
   Results .............................................................................................................................. 43
   Conclusion......................................................................................................................... 47
Appendix 2 Department of Transportation Specifications .................................................... 48
   Pennsylvania Department of Transportation Research.................................................... 48
   Description of PENNDOT Testing .................................................................................... 48
   Explanation and Summation of PennDOT Testing Results ............................................. 49
   Conclusions and Recommendations of PENNDOT......................................................... 49
   Other Department of Transportation Specifications ......................................................... 50
Appendix 3 Raw Data for Post Pull-outs............................................................................... 55

                                                                      iii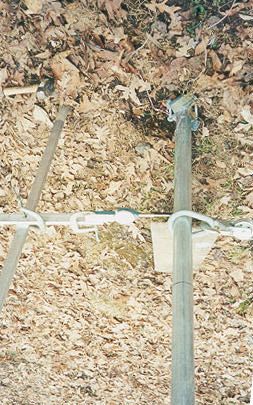
LIST OF FIGURES
Figure 1 Diagram of an anchor shoe with two sets (four “L” angle-shaped beams) of
     anchor blades....................................................................................................................2
Figure 2 A typical section of two types of fence post systems.................................................3
Figure 3 Satisfaction of NJDOT approved fence contractors with drive anchors....................6
Figure 4 NJDOT approved fence contractors preferred use of drive anchors or
     concrete.6 ..........................................................................................................................6
Figure 5 Diagram showing different positions and alignments of a fence post
     installation..........................................................................................................................7
Figure 6 Soil gradation analysis for site location.....................................................................11
Figure 7 First hole dug on-site for a 2.5 inch line post set in a concrete footing....................12
Figure 8 A diagram of the hole locations, indicating size of post, anchor mechanism,
     and identification number. ...............................................................................................13
Figure 9 Photograph of driven 2.5 inch line post with one set of anchor blades
     positioned for installation.................................................................................................14
Figure 10 Photograph of driven 2.5 inch line post with one of the anchor blades driven
     via a sledgehammer into position....................................................................................14
Figure 11 Photograph of fully installed 2.5 inch line post and anchor blades ready to
     be tested..........................................................................................................................15
Figure 12 The testing apparatus consisting of a ratchet mechanism, load cell, and
     bulldozer are shown. .......................................................................................................15
Figure 13 The data acquisition unit. The monitor shows the graphical representation
     of the ratchet loading. ......................................................................................................16
Figure 14 The deflectometer was attached to a stationary pole that was driven in the
     ground nearby so the deflection could be measured at the pull height...........................17
Figure 15 The pull-out system is shown just after beginning a pull-out test...........................17
Figure 16 This figure shows a before and after picture of the ratchet and load cell.
     The before picture, on the left, shows the devices lying on the crates ready for
     testing, the after picture shows the system in tension....................................................18
Figure 17 Testing results Anchor Post #2 of a 2.5 inch diameter line post installed
     with drive anchors. Shows deformation of the soil resulting in post inclination..............20
Figure 18 The Deflection versus loading of the 2.5 inch diameter fence posts.....................21
Figure 19 Testing results of Anchor Post #6 a 3 inch diameter post installed with drive
     anchors. Shows deformation of soil resulting in post inclination. ...................................21
Figure 20 Testing results of Anchor Post #5 a 3 inch diameter post installed with
     concrete. Shows the formation of a plastic hinge in the post.........................................22
Figure 21 Deflection versus loading of the 3 inch diameter posts, a comparison
     between a concrete footing and anchor posts................................................................23
Figure 22 The deflection versus loading comparison of 3 inch versus 2.5 inch
     diameter concrete posts. ................................................................................................24
Figure 23 Material cost breakdown for fence post installations..............................................26
Figure 24 Total net material cost for fence post installations.................................................26
Figure 25 Comparison of projected FEM deflections to the actual experimental
     deflections for a 2.5 inch post. ........................................................................................28
Figure 26 Comparison of projected FEM deflections to the actual experimental
     deflections for a 3 inch post. ...........................................................................................28
Figure 27 Post Systems .........................................................................................................31
Figure 28 Physical Dimensions of Concrete Footing System................................................37

                                                                    iv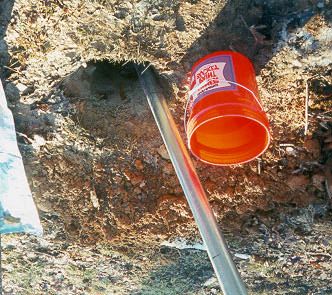
Figure 29 Concrete Footing FEA Model..................................................................................38
Figure 30 Concrete Footing FEA Model Details......................................................................39
Figure 31 Physical Dimensions of Steel anchor Footing System ..........................................40
Figure 32 Overall Steel Anchor FEA Model.............................................................................41
Figure 33 Central Core of Soil Immediately Adjacent to Steel Anchors .................................41
Figure 34 Details of Soil Slices and Soil Wedges Near the Steel Angle Anchors..................42
Figure 35 Deformed Shape and Plastic Strains for Footing System (Expanding Zone
     of Plastic Strains in Steel Post Indicates Formation of a Plastic Hinge) ........................44
Figure 36 Deformed Shape and Plastic Strains for Anchor System (Expanding Zone
     of Plastic Strains in Steel Post Indicates Formation of a Plastic Hinge) ........................45
Figure 37 Load-Displacement Curves for the two Post Systems Analyzed.........................46

                                                           v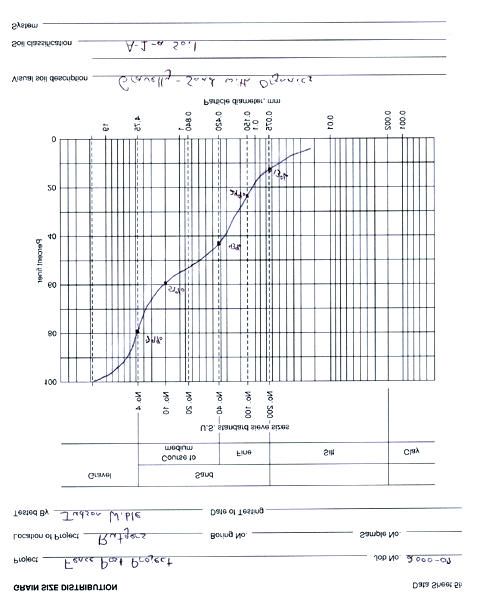
LIST OF TABLES
Table 1 Drive Anchors versus Concrete Footings , 3.............................................................. 4
Table 2 Summary of NJDOT approved contractors 6 ............................................................ 5
Table 3 ASTM post recommendations................................................................................... 8
Table 4 Fence fabric breaking loads....................................................................................... 9
Table 5 Breakdown of material costs for fence post installations........................................ 25
Table 6 Soil model parameters............................................................................................. 34
Table 7 Parameters for the LS-DYNA3D concrete model.................................................... 35
Table 8 Post dimension parameters..................................................................................... 36
Table 9 Model computational size......................................................................................... 40
Table 10 Results of PENNDOT testing. ............................................................................... 48
Table 11 Minimum section modulus about major and minor axis........................................ 53
Table 12 Minimum section modulus about major axis.. ....................................................... 53
Table 13 Results from 2.5 inch diameter post pull-outs ....................................................... 55
Table 14 Results from 3 inch diameter post pull-outs.......................................................... 55

                                                              vi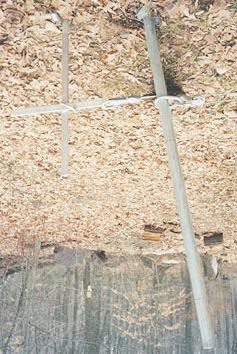
ABSTRACT
Right-of-way fence installation has not received a great deal of attention in literature during
past years, because traditionally common construction practice used concrete for the
fencing footings.1 In hard to access areas like wetlands, steep roadway cuts, and wooded
terrain commonly associated with locations that need right-of-way fencing, alternative simple
system footings are sometimes used. Recent roadside field installations have
demonstrated a potential for satisfactory performance of the simple systems. The main
objective of this research is to compare the viability of these simple systems to concrete
foundations.

Field testing was conducted to evaluate the deflection performance of the posts installed in
“concrete” versus “drive anchors.” A static load was applied to each post system at two feet
above grade. Also, an FEM analysis was conducted to simulate actual site testing
conditions.

Based on this research, the drive anchors and the concrete systems both performed within
tolerable limits established in this study. It was also determined that in areas where only
manual means of installation could be used there was a significant cost savings in favor of
the drive anchors. In summary, the results indicate that the drive anchor and the concrete
systems can be used interchangeably.

INTRODUCTION
The failure of a right-of-way fence post is both dangerous and unsightly. Public safety
concerns that are posed by a failed post and fabric present the need for quick and
inexpensive replacement. Current remedial procedures require considerable labor time and
maintenance funds to remove and replace the damaged posts. This study will determine
whether fence post installation crews should continue with current installation procedures or,
based on economic, time, and performance factors, change to the anchor post method.

A concrete fence footing system is comprised of a uniform hole with a post set in a vertical
position, and then backfilled with concrete. Depending on the materials used, the initial
curing time can take up to several days. Fence fabric cannot be stretched, thus burdening
the fence post, until the concrete has set. The necessary time delay, to allow the concrete to
reach sufficient strength to withstand loading, accounts for part of the disruption and difficulty
in working with concrete footing systems. Replacement is another dilemma with the
concrete system. Replacement procedures require removing the fence post by either
cutting the post at its base or by removing the post and footing, digging a new hole usually
right next to the old hole, and then re-setting the new post in concrete. Since these
installations are along the right-of-way, workspace is limited, and in addition, the new post
must be set very close to the previous one that is being removed. This procedure is both
time and labor intensive.

An anchor footing system is comprised of a fence post driven into the ground and an
accompanying anchor system. The anchor blades, which are part of the anchor system,

                                                1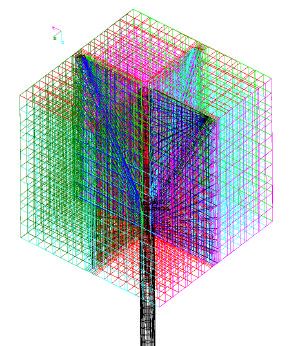
are “L” angle-shaped beams roughly 30 inches long and about 1.5 inches wide with a
thickness of 0.25 inches. The anchor blades are secured to the post by a shoe. The shoe is
a dual-screw clamp with slotted openings on its sides, as shown in Figure 1. During
installation, the shoe is placed around the post and the screws are tightened on both sides of
the shoe, thus clamping it securely in place. In a typical installation the shoe is positioned
such that when the anchor blades are driven they will be completely below the ground
surface. After the shoe is secured the anchor blades are inserted and aligned in the slots.
The blades are then driven into the soil at a downward 45-degree angle through the slots in
the shoe, as shown in Figure 2, thus creating a rigid connection between the anchors blades
and the post.

Figure 1 Diagram of an anchor shoe with two sets (four “L” angle-shaped beams) of anchor
                                        blades.2

                                              2
Concrete Footing Anchor System
Figure 2 A typical section of two types of fence post systems.
Mechanisms of Failure
Failure in right-of-way fencing is typically the result of vandalism, high winds, a fallen tree,
frost heaving the footings upwards, an impact with a vehicle, or several other factors. There
are two main types of failure that can occur as a result of loading; post failure and foundation
failure.
Post failure is when the steel post yields and/or permanently bends or twists. Yielding
generates a plastic hinge at the base of the post. This occurs when there is a strain
concentration resulting from a large enough generated moment to bend the post.
Foundation failure covers various types of failures within a fence post system below the
ground. For a concrete foundation, this could be failure within the material properties of the
concrete; excessive lateral compression of the concrete such that failure occurs; or,
theoretically, the post and foundation being removed from the ground. There are several
cases of foundation failure for the anchor foundation as well; bending of the blades,
separation of the blade from the shoe, and the post slipping upward and out of the shoe are
a few potential mechanisms. Another more likely failure is compression of the soil
substructure allowing free body rotation of the post about the shoe, thus leading to excessive
post inclination.
Comparison
A direct comparison of the yielding of the two fence post systems will generate an improved
understanding of the failure mechanisms, and a better overall comparison of the two post
foundations.
As a force acts at a given height upon the post embedded in concrete, the post pushes
against the concrete footing to resists the force. The force is then transferred and
distributed through the concrete to the soil. This allows numerous points of stress where the
system could possibly fail. For the post attached to an anchor post system, the force is
3exerted on the post and is transferred to the shoes, blades, and soil. However, not only does
the post push on shoes and anchors, but also pushes directly against the soil. Hence, the
post is acting as part of the anchor subsystem. It is the subsystems movement and
resistance to the loading that is studied in this report.
The following is a drive anchor description as per Anchor Fence, Inc.:
The “Drive Anchor” grip upon the sub-soil can be compared to a 39” root grip
of a tree. Any pressure on the post must move the equivalent of 30” of solid
earth before uprooting and a force necessary to do this will bend or snap off
the post before the footing gives.
Unlike concrete set posts, “Drive Anchors” set posts are unaffected by frost,
thaws, etc., and the fence line stays permanently in initial alignment.
Moreover, a fence set with “Drive Anchors” can be readily removed and
relocated if protective requirements change. 3
In Table 1 there is a general comparison of the characteristics of the drive anchors and the
concrete footings. Several items have been identified as claims by either previous studies or
manufactures literature. The results of this study have not disproved any of the claims.
Table 1 Drive Anchors versus Concrete Footings 4, 3
DRIVE ANCHORS CONCRETE
Temporary can be removed and reused * Permanent installation
Easier to install in hard to reach places ** Elaborate foundation makes it more difficult to
install
Does not require any vehicles for installation Requires a cement truck near the ROW or bags
of cement and wheelbarrows
Little if any soil is removed Requires disposal of soil
Not affected by frost ** Damaged by frost
Not affected by loose soil ** Weakened by loose soil
Can be installed in wetlands Difficult to install in wetlands
Anchor material costs are more expensive *** Concrete material costs are inexpensive ***
More posts can be installed per day Fewer posts can be installed per day
Fence fabric can be immediately installed Requires concrete cure time (few days) before
fence fabric can be installed
* N.J. Turnpike Study
** Claimed by Anchor Fence Inc.
*** See Table 5 for material cost breakdown
4NJDOT Approved Fence Contractors
The literature search included contacting all fourteen of the NJDOT approved fencing
contractors. Table 2 summarizes the opinions of the contractors. Figure 3 and Figure 4
provide a visual depiction of the results/satisfaction with the drive anchors and the
contractor’s preference for either concrete or drive anchors.
Several of the NJDOT approved fence contractors that were contacted to discuss
installation procedures stated that the amount of time needed for installing anchor fence
posts and concrete fence posts was about the same. Both methods were estimated at
roughly 100 posts per day. The basis for the fence post estimate is the basic manual
installation of the anchor post using a post driver and sledgehammers. The basis for the
concrete estimate is using a mechanical hole driller and a cement concrete truck.5
However, our results indicated that by utilizing only manual methods of installation the drive
anchor systems could be installed two times faster than the concrete (one hour versus 30
minutes). Plus the anchor system is ready immediately for the fence fabric to be stretched
whereas the concrete requires setting time. Even though the contractors estimate is based
on mechanical assistance this approximation is believable. The anchor posts are many
times installed in areas where mechanical assistance cannot be used due to accessibility
limitation like wetlands, steep roadway cuts, and wooded terrain. Hence, given the advantage
of using a mechanical hole digger for posts in concrete versus manual installation of anchor
posts, the number of posts installed per day should be approximately the same. However, if
both systems are installed using like methods, the anchor system appears to be significantly
faster.
Table 2 Summary of NJDOT approved contractors 6
Company Have Used Drv. Anchors Never Used Favor
Satisfied Dissatisfied Drv. Ancr. Concrete Drv. Ancr. Other
1 X X
2 X Larger jobs Smaller jobs
3 X X
4 X X
5 X X
6 X X
7 No Longer In Business
8 ** X
9 X X
10 X X
11 X X
12 X X
13 X X ***
14 X X
* Uses Company #4 to install fencing
** Uses drive anchors only in wetlands
*** Indifferent towards drive anchors
5Satisfaction of NJDOT Approved Fence Contractors
with Drive Anchors
Never Used
Disatisfied 15%
31%
Satisfied
Disatisfied
Never Used
Satisfied
54%
Figure 3 Satisfaction of NJDOT approved fence contractors with drive anchors.6
NJDOT Approved Fence Contractors Preferred Use
of Drive Anchors or Concrete
No
Preference
23% Drive Anchors
Concrete
No Preference
Drive
Concrete
Anchors
46%
31%
Figure 4 NJDOT approved fence contractors preferred use of drive anchors or concrete.6
6Post Type
Right-of-way fence posts are the vertical members of the fence. Several different fence post
arrangements are shown in Figure 5. Each configuration is detailed with a description in the
following section.
Figure 5 Diagram showing different positions and alignments of a fence post installation.7
End, Corner, and Pull Posts
End, corner, and pull posts (all of which will be referred to as “End Posts” for the remainder
of the report) must be strong enough to endure the strain of the fabric which is stretched
between them. It was mentioned in a PennDOT report that in common construction practice
a pull force of 925 lbs. is applied to the fence fabric during installation. When the fabric is
stretched, sufficient tension must be applied to remove all slack from the chain-link.
Therefore the minimum bending strength required for these posts is either the maximum
environmental load or the tension applied while stretching the fabric.1
End Post: Used where the fence fabric terminates
Corner Post: Used where the direction of the fence changes
Pull Post: Used to brace fence fabric along a lengthy stretch, or used to achieve a
change in grade along the fence line
Line Posts
Line posts attach to the fabric by means of clips and fasteners. However the line posts do
not experience the same tension from the fabric as the end, corner, and pull posts. Since
line posts do not experience the large tension while stretching the fabric the minimum
bending strength must be the maximum environmental load.
Line Post: Used every 10 ft as an intermediate post
Post Installation
Several schedule 40 (steel) posts were purchased for the experiment that satisfied the
ASTM recommendations shown in Table 3.9 All of them had the same length of 8’ 8”, the 8’
78” height was based on a 6 foot height requirement, and 32 inch buried under the ground for
the footing.8
Table 3 ASTM post recommendations.9
PIPE (schedule 40) (steel) PIPE (cold rolled or welded pipe) (steel)
Min. yield strength not applicable Min. yield strength 50,000 psi
Line post: Line post:
Outside Diameter 2.375 in Outside Diameter 2.375 in
Thickness 0.154 in Thickness 0.130 in
Weight 3.65 lb/ft Weight 3.12 lb/ft
End Corner and Pull Posts: End Corner and Pull Posts:
Outside Diameter 2.875 in Outside Diameter 2.875 in
Thickness 0.203 in Thickness 0.160 in
Weight 5.97 lb/ft Weight 4.64 lb/ft
The posts selected for the tests were schedule 40 steel posts as indicated above in Table 3.
As per industry standard for the remainder of this report the 2.375 and the 2.875 inch
diameter posts will be referred to as 2.5 and 3 inch diameter posts respectively. The yield
strength of the posts is 25,800 lb/in2 for both and the section modulus is 0.5606 in3 for the
2.5 inch post and 1.064 in3 for the 3 inch post.5,8
For the concrete anchor systems, the concrete used was a rapid-set type C concrete.
Appendix 2 gives the guidelines for fence post installation for the NJDOT as well as several
surrounding states. The NJDOT specifications require that the concrete must set for 72
hours before applying a load to the post. The posts were allowed to set for 168 hours or
seven days, more than double the minimum time specified, before they were loaded.10
Breaking Loads of Fence Fabric
The breaking load of the fence fabric or mesh is a useful piece of information for the post
design. The breaking load of the mesh points toward a minimum required load for the end
posts. In Table 4 for a typical strand of Type II Number 9 mesh the breaking load is 1290
pounds, however this is not the net breaking load of the mesh system itself. In the PennDOT
research study it was found that a load, applied to a stretcher bar inserted into the fence
fabric, pulled perpendicular to the height of 5 feet of fence fabric stretched between two
posts caused the fabric to fail at loads between 2,400 and 2,700 pounds.1 According to their
results the foundations did not fail and can be considered rigid, therefore this system can be
analyzed using statics. Also, assuming that the load transfer from the mesh to the post is
uniform, this produces the worst case scenario in which the loading can be considered
homogeneously distributed over the height of the post. By assuming the load to be equally
distributed this produces the most conservative estimate. In reality the post will bend or tilt,
thus reducing the loading at the top of the post and in turn decreasing the moment at the
base of the post. Using the maximum load of 2,700 pounds the distributed load on the post is
[ Distributed Load = Direct Load / ( Length x 2 ) ] calculated to be 270 lbs/ft on each post.
(Please note that in the previous calculation the division by two, is the result of the load being
applied to a stretcher bar inserted into the mesh between two rigid posts.) This equates to a
8moment about the base of each post [ Moment = (Distributed Load x Length2 ) / 2 ] equal to
3,375 ft-lbs. Hence any loading, which causes a moment in excess of 3,375 ft-lbs at the
base of the post, will cause the mesh to fail.
Table 4 Fence fabric breaking loads.11
BREAKING LOADS
Nominal Type I and II Type III Type IV
Diameter of
Coated Wire
Bonded Extruded
Size Coated in. lb lb lb lb
Wire Gage
6 0.192 2170 1560 1800 1290
9 0.148 1290 930 1200 850
11 0.12 850 610 800 515
NOTE: The shaded boxes are the No. 9 fabric used in NJDOT fence installations
EXPERIMENT
The experimental portion of the research consisted of two parts. The first part was a finite
element modeling analysis of the post systems. This data would be used to design the
experiment and give projected experimental field results. The second portion consisted of
actual field-testing. Since the loading was going to be in the thousands of pounds range and
it was going to be conducted in a field environment where it is sometimes difficult to maintain
controlled conditions it was crucial that the testing system be well-built and safe. With the
results in hand from the analytical portion, a testing apparatus was specified to withstand the
projected loads to be exerted in the field. Once the experimental field results were obtained,
they were then compared back to the original analytical model.
Background for Pullouts
The procedure was roughly based on the original PennDOT fence post testing that occurred
in the 1970’s, and is provided as background information in Appendix 2. The procedure for
the PennDOT test applied a loading at the top of the pole. Their testing concluded that the
footings did not fail before the material failure of the post. However, their height of pull or
moment arm was at 4’6” from the ground surface. The report has indicated that conclusive
research is required, based on the lack of failure of the footings.1
In this research study, a loading was applied to the post at 24 inches above the ground, the
bumper height of an average car. Of course a car would provide a dynamic loading to the
fence post; however, the concern of this study is on the comparison between the failure of
the concrete footing posts and the anchor footing posts in a static test.
Finite Element Modeling
A finite element model (FEM) was generated to compare the two fence post systems in a
mathematical method. The results generated from the modeling are discussed later in this
9report in Appendix 1. The posts that were modeled were based on the ASTM post
recommendations set forth in Table 3.8,9 The modeling demonstrated the use of constant
soil parameters as well as uniformity of the concrete. The results and differences will be
discussed within the data and analysis section as a comparison to the results from the field
research.
Site Selection
Site selection became a problematical issue for this project. There were several dilemmas.
One was the need for a dead load to anchor the loading mechanism. There was concern
over using dump trucks and rubber tire backhoes because of the potential for rolling. If the
vehicle rolled the load would be inconsistent making the results from test to test
incompatible. A track bulldozer was selected for its shear weight as well as its ability to
remain motionless. At one point, it was expected to conduct the testing on an actual field
installation along Route 55 in Cumberland County, NJ. However, this offered its own
tribulations. If the testing was conducted on Route 55 it would require traffic closures which
are rather costly and bothersome to motorists. Also someone would have had to repair the
fence after testing occurred, another cost that would have to be incurred. On top of that the
actual testing would have taken several days of set-up as well as to carry out and complete,
thus making the roadside work rather cumbersome.12 The final problem was getting a
bulldozer onsite, as the NJDOT does not maintain bulldozers as part of its normal
maintenance fleet. This was enough incentive to select a non-roadside site, sufficiently
withdrawn from the road to avoid lane closure, but available enough to move the machinery
into place and provide an adequate spacing between the posts. Selection of the site also
required avoiding of shallow underground utilities. Thus the complications involved with site
selection provided a strenuous effort to overcome these obstacles. A secondary site was
selected near the construction of the Metro-Mall Complex in Newark, NJ. Being an active
construction site, they maintained a number of large earth moving machines, including
several bulldozers. We made arrangements with the property owners, however we were
unable to mobilize before the harsh winter months, after which time the site was no longer
available to be used for our testing. Another site was selected after that in Bayonne, NJ this
site also had a bulldozer on-site for maintenance reasons. Unfortunately, when we went to
install the posts it was discovered that below the top six (6) inches of soil there was several
feet of roofing shingles used as fill. This site was also abandoned due to the lack of natural
soil material. Finally we contacted a construction contractor who owns a bulldozer and
requested permission to install the posts in their maintenance yard. We were granted
permission and immediately installed the posts. Soil samples were obtained from the site
prior to installation. A soil gradation can be seen in Figure 6, which shows the material to be
a natural gap-graded gravelly-sand. The material was acceptable and the site was free of
underground utilities. The site was also sufficiently large to allow for adequate spacing
between the posts.
10Figure 6 Soil gradation analysis for site location.
11Installation of Fence Posts
The selected area was cleared of debris, rocks, and other obstructions. All of the necessary
materials and tools were set up on a large tarp including the concrete, posts, anchors,
shovels, tape measures, and all other necessary materials.
The initial site set up was planned on paper. In accordance with typical installation
procedures, the spacing of the posts needed to be at least ten feet apart. The area of the
site was large enough to satisfy these requirements. Therefore it was decided to minimize
potential interaction effects between post tests, and space them out at least ten feet apart.
Figure 7 First hole dug on-site for a 2.5 inch line post set in a concrete footing.
The hole shown in Figure 7 took approximately 50 minutes to dig by hand. The digging
began for this hole (Concrete Post #1) in the rear right location of the site. See Figure 8 for
the location of each individual installation. Since there were only two posts being set in
concrete, the concrete was mixed by hand. Mixing was performed in a mix barrel, and three
cylinders were prepared to verify compressive strength. This hole shown in Figure 7 was
used for the 2.5 inch diameter line post. After completion of the pouring, a plastic covering
was placed around the post, over the cement and secured in place. The plastic covering
was used to secure the moisture within the concrete to prevent the mixture from drying out
before it cured. This was done in accordance with specifications shown in Appendix 2.
12Figure 8 A diagram of the hole locations, indicating size of post, anchor mechanism, and
identification number.
The second post set in concrete (Concrete Post #5) was completed, with the correct width
and depth, in one hour. This hole was used to install a three inch diameter end post. The
concrete was mixed and placed in the same fashion as the previous concrete installation. As
with the other post the concrete was covered with plastic when it was finished.
The total installation time of a line post set with a drive anchor (Anchor Post #2) was roughly
25 minutes. The total manual installation time of an end post set with a drive anchor (Anchor
Post #3) was roughly 35 minutes. A hand held post driver, a heavy round pipe with an end
cap and side handles, was used to drive the post straight down into the soil. This took
approximately 15 minutes. Then the anchor shoe and blades were positioned as shown in
Figure 9. The blades were driven by hand with a sledgehammer as shown in Figure 10.
These each took an additional 5 minutes to drive. The final line post installation ready to be
tested is shown in Figure 11.
13Figure 9 Photograph of driven 2.5 inch line post with one set of anchor blades positioned for
installation.
Figure 10 Photograph of driven 2.5 inch line post with one of the anchor blades driven via a
sledgehammer into position.
14Figure 11 Photograph of fully installed 2.5 inch line post and anchor blades ready to be
tested.
Post Pull-out Set-up
If the testing had been done in a laboratory environment, a piston load cell combination would
have been used. However, the goal of the project was to conduct field tests to simulate
actual right-of-way conditions. A track bulldozer was selected as a dead load for the pull-out
system for it weight as well as its ability to remain stationary. Dump trucks and rubber tire
backhoes could not be used because if they rolled even slightly the load would be
inconsistent making the results from individual pull-outs incompatible.
Figure 12 The testing apparatus consisting of a ratchet mechanism, load cell, and bulldozer
are shown.
15The overall pull-out testing apparatus is shown in Figure 12. Attached to the bulldozer was a
wire rope capable of withstanding five thousand pounds. A shackle capable of withstanding
six thousand pounds attached the wire rope to a specially constructed lifting ring. Two lifting
rings were purchased each capable of withstanding ten thousand pounds. The lifting rings
were manufactured to screw connect into the ten thousand pound load cell, but still allow
rotation to avoid any torque in the testing system. The opposite side of the load cell
consisted of another swivel hook and shackle connecting to a ratchet. The four thousand
pound ratchet or “come-along” was used to apply the loading to the fence posts. The load
cell monitored the ratchet loading and recorded the information on a data acquisition unit. It
also provided a real-time graphical display of the loading, as shown in Figure 13. 13
Figure 13 The data acquisition unit. The monitor shows the graphical representation of the
ratchet loading.
Manual readings of the deflection were measured by a dial gauge deflectometer. Ideally, the
unit would have been located 24 inches above the ground surface, exactly where the pear
ring was pulling on the post thus matching the FEM analysis. However, the actual
placement of the deflection measuring equipment was at 21 inches above the ground
surface, to avoid damage. It was determined that even when excessive horizontal
deflections occur, the effect of 3 inches vertical was negligible. The placement of the
deflectometer was consistent for all of the posts such that the displacement data could be
compared, the deflectometer is shown in Figure 14.
16Figure 14 The deflectometer was attached to a stationary pole that was driven in the ground
nearby so the deflection could be measured at the pull height.
Figure 15 The pull-out system is shown just after beginning a pull-out test.
In Figure 15 the entire testing apparatus is shown, ready to begin a pull-out test. The load cell
and ratchet connect the bulldozer to the fence post to be tested. The van in the background
contains the data acquisition system and monitoring equipment. In the front portion of the
photo the deflectometer can be seen in the zero position. Also in the background of the
image, on either side of the front of the van, can be seen two posts that are ready to be
tested.
Testing
Both the load cell and the ratchet were placed on crates so that their load wouldn’t initially be
a factor in the calibration of the load cell and deflectometer. A picture of the two devices on
the crates is shown in Figure 16. The load cell and the deflectometer were zeroed. The data
acquisition unit was started, to measure the load being applied to the pole. The ratchet was
17used to incrementally load the post system, and manual measurements of the dial gage
readings were taken every two ratchet pulls. This deflection measurement was recorded
along with the load value at that point. The deflection measurements were manually
recorded while the data acquisition unit was taking load measurements automatically.
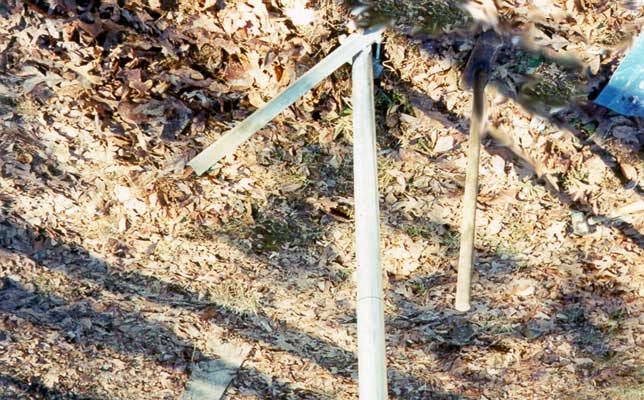
Figure 16 This figure shows a before and after picture of the ratchet and load cell. The
before picture, on the left, shows the devices lying on the crates ready for testing, the after
picture shows the system in tension.
DATA AND ANALYSIS
Field Testing Results
Fence Post #1
A concrete line post with a 2.5 inch diameter was installed. The loading was applied to a
maximum force of 937 lbs. at which point there was a deflection of 4.6 inches. This failure
caused a strain concentration in the post, causing it to permanently bend, which is
representative of the development of a plastic hinge.
Fence Post #2
An anchor line post with a 2.5 inch diameter was installed. The direction of loading was
parallel to the line of the single set of anchor blades. Thus, simulating loading directly on the
line post or mesh. The loading was applied to a maximum force of 1123 lbs. at which point
there was 4.7 inches of deformation. The post itself experienced little or no bending. There
was some minor upheaval of the soil around the base of the post. The movement of the post
was due to the deformation of the soil.
Fence Post #3
An anchor end post with a 3 inch diameter was installed. The loading was applied at a 45
degree angle to either line of the four anchor blades. Thus, simulating a scenario of an end
post that is loaded at an angle, caddy corner to the anchors. The post withheld a maximum
force of 1873 lbs. at which point there was 5.5 inches of deformation. The post itself
experienced little or no bending. There was no upheaval of the soil around the base of the
post. The movement of the post was due to the deformation of the soil below the grade.
Fence Post #4
18An anchor line post with a 2.5 inch diameter was installed. The direction of loading was
perpendicular to the line of the single set of anchor blades. Thus, simulating loading directly
on an incorrectly installed line post. During our literature review it was found that on occasion
a contractor did not understand the correct orientation of line post anchors and installed the
blades parallel to the mesh. The post withheld 1170 lbs of force at a deflection of 4.6 inches.
The failure with this post loading was due to upheaval of the soil and partial removal of the
anchor post from the ground. The post itself experienced little or no bending. There was no
upheaval of the soil around the base of the post. The movement of the post was due to the
deformation of the soil below the grade.
Fence Post #5
A concrete end fence post with a 3 inch diameter was installed. The loading was applied to a
maximum force of 2700 lbs of force. At the point of maximum loading, the post experienced
a deflection of 5.9 inches. The failure of the system was due to the creation of a plastic hinge
at the base of the steel post and the subsequent bending of the post without failure in the
concrete. There was no movement of the soil around the base of the footing. The movement
of the post was due to the deformation of the post itself.
Fence Post #6
An anchor end post with a 3 inch diameter was installed. The loading was applied in line with
one of the two sets of anchor blades. The post withheld a maximum force of 1790 lbs of
force, at the point the deflection was at 5.6 inches. Thus simulating loading directly on an
end post or mesh. The post itself experienced little or no bending. There was no upheaval of
the soil around the base of the post. The movement of the post was due to the deformation
of the soil below the grade.
Fence Post #7
An anchor end post with a 3 inch diameter was installed. The loading was applied at a 45
degree angle to either line of the four anchor blades. Thus, simulating a scenario of an end
post that is loaded at an angle, caddy corner to the anchors. This test was done to duplicate
the testing on Fence Post 3 to verify the test results. The post withheld a maximum force of
1678 lbs. at which point there was 5.4 inches of deformation. The post itself experienced
little or no bending. There was no upheaval of the soil around the base of the post. The
movement of the post was due to the deformation of the soil below the grade.
The data obtained from the field pull-out testing is provided in Appendix 3.
Analysis of 2.5 inch diameter posts
In Figure 17 photographs of field-testing of a line post installed with drive anchors is shown. It
can be seen that there is little to no bending of the post itself but the soil has deformed to
allow the post to tilt. In Figure 18, a comparison is made between the deflection and the
loading of the 2.5 inch diameter fence posts. The graph shows strong similarities between
the post systems. None of the 2.5 inch diameter post pull-outs exceeded 1,200 lbs. of force.
However, the graph shows that the Anchor Post #4 was marginally stronger than the other
two installations. For a graphical representation of what the Anchor Post #4 test set-up
looked like, refer to Figure 8. The concrete footing was slightly weaker than the other two
19systems. The data presented in Figure 18 shows that all of the posts experienced roughly
the same deflection versus the loading. This signifies that none of the 2.5 inch diameter
fence post installations are clearly superior, based on these field testing results. These
results indicate that for line posts, a concrete post is not a better choice than an anchor post.
Henceforth, these systems can be considered roughly equivalent, based on these specific
testing conditions.
Figure 17 Testing results Anchor Post #2 of a 2.5 inch diameter line post installed with drive
anchors. Shows deformation of the soil resulting in post inclination.
Deflection Versus Loading of
2.5 inch Diameter Fence Posts
1400
1200
Loading (lbs.)
1000
Concrete Post #1
800
Anchor Post #2
600
Anchor Post #4
400
200 20
0
0 1 2 3 4 5
Deflection (in.)Figure 18 The Deflection versus loading of the 2.5 inch diameter fence posts.
Analysis of 3 inch diameter posts
In Figure 19 a photograph of a test of a 3 inch diameter post installed with drive anchors is
shown. It can be seen that there is little to no bending of the post itself, but the soil has
deformed to allow the post to tilt. In Figure 20 a photograph of a test of a 3 inch diameter post
installed in concrete is shown. It can be clearly seen that the post has bent indicative of the
formation of a plastic hinge. Figure 21 shows the deflection versus the loading graph of the 3
inch diameter fence posts. The graph shows that the concrete post obtained a significantly
higher loading with less deflection. All of the other anchor fence posts performed similarly
obtaining roughly the same deflection under the loading applied. Thus, indicating that
regardless of installation orientation of the anchors their overall performance is hardly
affected. The graph of the deflection of the concrete appears to be reminiscent to a typical
yield strength curve of steel. This was not surprising considering from visual observations
the post developed a plastic hinge at its base and began to bend. The concrete was
undamaged, however the post deformed as the loading was increased. The anchor posts
experienced compression of the soil substructure, thus allowing rotation of the post about
the anchor shoe. The posts did not deform, but there was excessive post leaning. This
signifies that of the 3 inch diameter fence post installations the concrete footing is clearly
stronger based on these field testing results.
Figure 19 Testing results of Anchor Post #6 a 3 inch diameter post installed with drive
anchors. Shows deformation of soil resulting in post inclination.
21Figure 20 Testing results of Anchor Post #5 a 3 inch diameter post installed with concrete.
Shows the formation of a plastic hinge in the post.
22Deflection Versus Loading of 3 inch Diameter Fence
Posts
3000
2500
Loading (lbs.)
Anchor Post #3
2000
Concrete Post #5
1500
Anchor Post #6
1000
Anchor Post #7
500
0
0 1 2 3 4 5 6
Delection (in.)
Figure 21 Deflection versus loading of the 3 inch diameter posts, a comparison between a
concrete footing and anchor posts.
During installation, pull loads when stretching fabric are rarely over 1,000 pounds. These pull
loads are applied directly to a stretcher bar, which therefore distributes the load over the
height of the end posts. The 1,000 pound direct load distributed over a 6 foot height,
produced a distributed load [ Distributed Load = Direct Load / ( Height ) ] of 166.6 lbs/ft.
Conservatively this equates to the same moment [ Moment = (Distributed Load x Length2 ) /
2 ] (3000 ft-lbs) of a direct 1,500 pound load at 2 feet from the surface. Loading at 2 feet
above the surface is what was done in the field tests, the results can be seen in Figure 21.
Each of the posts withstood the force, albeit with varying degrees of deflection.
Even though both systems were able to withstand the loading, this does not make the
systems equivalent. In fact, the systems are not equivalent. However, they may both be
sufficient to be used, therefore we established a failure criterion. Developed earlier in this
report, from the analysis of the PennDOT research study it was found that loading, which
causes a moment in excess of 3,375 ft-lbs, will cause the mesh to fail.1 Therefore based on
our test at 2 feet above ground level the direct load [ Direct Load = Moment / Height ] of 1,688
pounds is needed to produce mesh failure. It is reasonable that the posts must at least be
able to sustain this level of loading to be sufficient in field applications. Thus, they must
withstand at least 1,688 pounds without excessive deflections. The 1,688 pound loading is
our failure criterion for sufficient performance in field applications. From Figure 21 we can
see that all the posts reached this loading level. Consequently for these site conditions and
testing setup, even though the concrete installation is stronger than the anchor system, they
both performed within tolerable limits established in this study. It is possible that under
different conditions, such as impact loading, the systems may react completely dissimilar,
however this was not part of the study.
An interesting comparison is evident in the graph between the concrete post footings. Figure
22 shows similarities in the loading versus deflection data of the 3 inch and 2.5 inch posts in
concrete footings. Both posts experienced permanent deformation in the field tests, and
both tests experienced a point where their material curves level out significantly. This is the
23approximate yield point of the steel posts. In both cases the lateral loading on the posts in
concrete formed a plastic hinge, the strain concentrated in the post at the interface between
the post and the concrete. All the deformations of the system are a result of the properties
of the steel and not the concrete. There is little, if any, soil deformation and the concrete
remained undamaged.
Deflection Versus Loading of
3 inch and. 2.5inch Diameter Fence Posts in
Concrete Footings
3000
Loading (lbs.)
2500
2000
2.5" Diameter Post
1500
3" Diameter Post
1000
500
0
0 2 4 6
Deflection (in.)
Figure 22 The deflection versus loading comparison of 3 inch versus 2.5 inch diameter
concrete posts.
Yielding verification in concrete footing
In the concrete footings, steel yielding apparently occurred based on visual observations
during the field tests. To verify that yielding did indeed occur, the bending strength must be
calculated. The 2.5 inch post had a yield strength of 25,800 psi and a section modulus of
0.5606 in3.5,14 Thus the bending moment (yield strength times section modulus) is equal to
1,200 ft-lbs. Therefore, calculating out the corresponding equivalent direct load at 2 feet
above grade is 600 pounds. The 3 inch post had a yield strength of 25,800 lb/in2 and a
section modulus of 1.064 in3. Hence, the bending moment (yield strength times section
modulus) is equal to 2,290 ft-lbs. Therefore, calculating out the corresponding equivalent
direct load at 2 feet above grade is 1,145 pounds. Cross-referencing the 600 pounds for the
2.5 inch and 1,145 pounds for the 3 inch posts in concrete to Figure 22 it is clear that the
posts did indeed exceed their yield strength. A similar analysis cannot be conducted on the
anchor posts because the posts tilted about the shoe, producing plastic strains in the
surrounding soil. By distributing the stress throughout the foundation, the anchor posts
prevented yield failure of the steel.
Material and Labor Costs
The economic savings can be analyzed with the costs of materials and labor for each of the
installation processes. Regardless of the installation process, the cost of the posts remains
the equal. For a steel post that is 2.5 inches in diameter and 104 inch long schedule 40
galvanized the cost is $26.26 each. For a steel post that is 3 inches in diameter and 104
inches long schedule 40 galvanized the cost is $41.21 each.
24You can also read