From Microspikes to Stress Fibers: Actin Remodeling in Breast Acini Drives Myosin II-Mediated Basement Membrane Invasion
←
→
Page content transcription
If your browser does not render page correctly, please read the page content below
cells
Article
From Microspikes to Stress Fibers: Actin Remodeling in Breast
Acini Drives Myosin II-Mediated Basement Membrane Invasion
Julian Eschenbruch                , Georg Dreissen, Ronald Springer, Jens Konrad, Rudolf Merkel                         , Bernd Hoffmann
and Erik Noetzel *

                                            Institute of Biological Information Processing 2 (IBI-2): Mechanobiology, Forschungszentrum Jülich,
                                            52428 Jülich, Germany; j.eschenbruch@fz-juelich.de (J.E.); g.dreissen@fz-juelich.de (G.D.);
                                            r.springer@fz-juelich.de (R.S.); j.konrad@fz-juelich.de (J.K.); r.merkel@fz-juelich.de (R.M.);
                                            b.hoffmann@fz-juelich.de (B.H.)
                                            * Correspondence: e.noetzel-reiss@fz-juelich.de

                                            Abstract: The cellular mechanisms of basement membrane (BM) invasion remain poorly understood.
                                            We investigated the invasion-promoting mechanisms of actin cytoskeleton reorganization in BM-
                                            covered MCF10A breast acini. High-resolution confocal microscopy has characterized actin cell
                                            protrusion formation and function in response to tumor-resembling ECM stiffness and soluble
                                            EGF stimulation. Traction force microscopy quantified the mechanical BM stresses that invasion-
                                            triggered acini exerted on the BM–ECM interface. We demonstrate that acini use non-proteolytic
                                            actin microspikes as functional precursors of elongated protrusions to initiate BM penetration and
                                  ECM probing. Further, these microspikes mechanically widened the collagen IV pores to anchor

                                            within the BM scaffold via force-transmitting focal adhesions. Pre-invasive basal cells located at
Citation: Eschenbruch, J.; Dreissen,
                                            the BM–ECM interface exhibited predominantly cortical actin networks and actin microspikes. In
G.; Springer, R.; Konrad, J.; Merkel, R.;
                                            response to pro-invasive conditions, these microspikes accumulated and converted subsequently into
Hoffmann, B.; Noetzel, E. From
Microspikes to Stress Fibers: Actin
                                            highly contractile stress fibers. The phenotypical switch to stress fiber cells matched spatiotemporally
Remodeling in Breast Acini Drives           with emerging high BM stresses that were driven by actomyosin II contractility. The activation
Myosin II-Mediated Basement                 of proteolytic invadopodia with MT1-MMP occurred at later BM invasion stages and only in cells
Membrane Invasion. Cells 2021, 10,          already disseminating into the ECM. Our study demonstrates that BM pore-widening filopodia
1979. https://doi.org/10.3390/              bridge mechanical ECM probing function and contractility-driven BM weakening. Finally, these
cells10081979                               EMT-related cytoskeletal adaptations are critical mechanisms inducing the invasive transition of
                                            benign breast acini.
Academic Editors: Rudolf E. Leube
and Alexander E. Kalyuzhny                  Keywords: filopodia; invadopodia; focal adhesion; basement membrane disruption; breast cancer
                                            invasion; actomyosin; cell force; mechanical probing; epithelial mechanobiology
Received: 30 June 2021
Accepted: 27 July 2021
Published: 4 August 2021

                                            1. Introduction
Publisher’s Note: MDPI stays neutral
with regard to jurisdictional claims in
                                                  Cell migration through basement membranes (BM) is a crucial step in cancer pro-
published maps and institutional affil-     gression and invasion [1]. Invasive cells degrade the dense sheet-like collagen scaffold
iations.                                    of the BM by matrix-metalloproteases (MMP). In addition, cellular forces drive local BM
                                            disruption [2,3]. Matured BM scaffolds act as physical barriers capable of sustaining physi-
                                            ological mechanical loads in homeostatic microenvironments [4,5]. In cancer progression,
                                            the tumorous extracellular matrix (ECM), characterized by oncogenic EGFR signaling and
Copyright: © 2021 by the authors.
                                            increased local stiffness, induces cell-force generation, finally fueling BM disruption [6].
Licensee MDPI, Basel, Switzerland.
                                            Invasive cells undergo epithelial to mesenchymal transitions (EMT) programs with a
This article is an open access article
                                            fundamental reorganization of actin cytoskeletal structures. EMT cells form excessive
distributed under the terms and             sensory projections, spike-like filopodia, and actin-rich invadopodia. Moreover, enhanced
conditions of the Creative Commons          cell contractility by actin stress fiber formation facilitates cell spreading and migration
Attribution (CC BY) license (https://       through a confining ECM [7]. EMT and pro-invasive protrusive activity are, among other
creativecommons.org/licenses/by/            things, induced by transforming growth factor-β (TGFβ) and epidermal growth factor
4.0/).                                      (EGF) signaling pathways [8,9]. Actin-rich cell protrusions (CP) play a crucial role in cell

Cells 2021, 10, 1979. https://doi.org/10.3390/cells10081979                                                        https://www.mdpi.com/journal/cells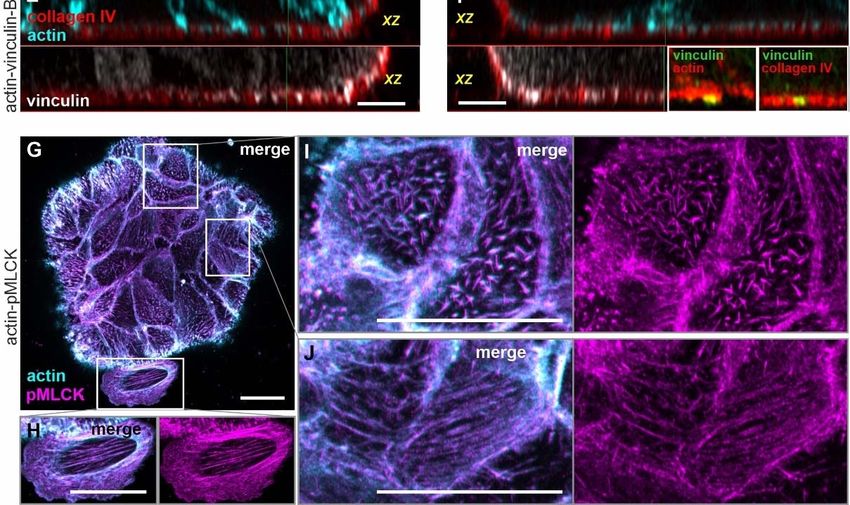
Cells 2021, 10, 1979                                                                                           2 of 22

                       migration and ECM mechanosensing. Their mechanical and sensing activity depends
                       on ECM anchorage via stable matrix focal adhesions (FA) [10]. Force-transmitting FAs
                       connect the cell cytoskeleton with the ECM via myosin II-coupled actin stress fibers (SF).
                       The presence of myosin II is essential for actin filament contraction [11].
                             CPs are classified as lamellopodia, pseudopodia, podosomes, filopodia or filopodia-
                       like protrusions, and invadopodia. This categorization is based on shape, the presence
                       and distribution of actin scaffolding proteins, proteolytic enzymes, and cell type [12,13].
                       Invadopodia formation has been found in vivo and human cancer cell lines [14,15]. Al-
                       beitstrongly associated with invasive cells, invadopodia are heterogeneous in form and
                       function. They often contain membrane-tethered proteases such as MT1-MMP (MMP14)
                       and actin-bundling factors such as Tks5 and cortactin [16–18]. They also exert mechanical
                       forces on the surrounding ECM, facilitating local matrix degradation and cell migration [19].
                       Additionally, invadopodia formation is induced by increased intracellular tension, matrix
                       rigidity, contractile cell forces, and growth factor signaling [20,21]. Moreover, invasive
                       cancer cells form force-transmitting filopodia or filopodia-like protrusions [12]. Enhanced
                       density of filopodia-like actin spikes correlates with high invasiveness of ovarian cancer
                       cells [22]. Studies on the mechanistic aspects of actin protrusion function in cancer invasion
                       and exist for single cells migrating in 3D matrices [12,23–25]. In contrast, it is not yet un-
                       derstood how actin reorganization contributes to the invasion of epithelial cells through
                       BM barriers. Herein, the direct cellular interaction with the BM scaffold and the underlying
                       ECM remains elusive.
                             Therefore, we aimed at an understanding of the mechanisms of cellular mechanosens-
                       ing across BM barriers and how these promote invasion. We focused on the functional
                       interplay of actin CPs and actomyosin contractility as the initiating step of BM disruption.
                       Our work characterized BM- and ECM-sensing actin CP in benign breast cell acini. We
                       assessed such acini with a non-transformed genetic background to resemble invasive BM
                       disruption mechanisms activated by changing ECM cues. We used tumor-like EGF and
                       stiffness conditions to interlink CP regulation with invasive cell transition. In non-invasive
                       acini, actin CPs originated from the cortical actin network in the lateral basal cell layer
                       and interacted with the BM. In invasion-triggered acini, two cell populations were dis-
                       covered at the BM–ECM interface. Their actin cytoskeletons were dominated either by
                       mechanosensing microspikes (MS) or by contractile stress fibers (SF). Actin MS were remi-
                       niscent of the laterally formed CPs that lack invasion-related MT1-MMP. By combining
                       high-resolution confocal microscopy and traction force microscopy (TFM), we mapped the
                       MS to the SF transition process in response to tumor ECM conditions. Cells with initially
                       high coverage of ECM-directed MS progressively reinforced their cytoskeleton by forming
                       contractile SFs. Furthermore, we functionally link these SF-rich cells with hot spots of high
                       actomyosin-generated force. Finally, our work suggests a functional link between actin
                       cytoskeleton reorganization and SF-derived mechanical forces that weakens the BM at
                       potential sites of cell invasion.

                       2. Materials and Methods
                       2.1. Cell Maintenance
                            MCF10A cells were purchased from ATCC (Manassas, VA, USA) and maintained in
                       culture dishes under standard culture conditions (37 ◦ C, 5% CO2 ) in DMEM/F12 growth
                       medium (ThermoFisher Scientific, Waltham, MA, USA) containing 5% horse serum (Ther-
                       moFisher Scientific), 0.5 µg/mL hydrocortisone, 100 ng/mL cholera toxin, 20 ng/mL EGF,
                       10 µg/mL insulin (all Sigma Aldrich, St. Louis, MO, USA), 100 U/mL penicillin, and
                       100 µg/mL streptomycin (ThermoFisher Scientific). For MCF10A 3D morphogenesis, a
                       DMEM/F12 assay medium was applied (see below). In addition, an MCF10A cell vari-
                       ant was transduced with RFP-LifeAct (IBIDI, Munich, Germany) to visualize the actin
                       cytoskeleton in live-cell imaging experiments.
Cells 2021, 10, 1979                                                                                          3 of 22

                       2.2. MCF10A Morphogenesis and Isolation from EHS Matrix
                            Single MCF10A cells were seeded on top of the growth-factor-reduced EHS substrate
                       (Geltrex, ThermoFisher Scientific) to generate ld-BM (day 11) and hd-BM (day 21). Seeded
                       cells were cultivated from day one to day nine in assay medium with 5 ng/mL EGF
                       and from day 9 to day 21 in assay medium without EGF [4]. For further analyses, acini
                       were isolated from EHS matrix and washed with ice-cold PBS and incubated in 2 mL
                       ice-cold cell recovery solution (CRS) (BD Biosciences, San Jose, CA, USA) for 30 min (4 ◦ C)
                       to depolymerize the EHS matrix, as previously described [5]. Next, acini were washed
                       with fresh EGF-free assay medium and individually picked under a stereo microscope
                       for seeding onto 35 mm cell culture dishes, either with microscopic glass bottoms or
                       elastomeric substrates. Acini adhered to Geltrex-coated substrates for 15 min (37 ◦ C, 5%
                       CO2 ) and were subsequently covered with 2 mL fresh EGF-free assay medium or growth
                       medium (20 ng/mL EGF). The time point of cell seeding was defined as assay start.

                       2.3. Preparation and EHS-Protein Coating of Elastomeric Substrates
                            Acini were seeded on an 80-µm-thick layer of cross-linked PDMS silicone rubber
                       substrates (Sylgard 184, Dow Corning, Midland, MI, USA) with an elasticity of 12 kPa
                       (mixing ratio of base oil and cross-linker oil 50:1 per weight). The layer thickness of 70 µm
                       was set by spin coating on 100 µm thin cover slips (Cover Slip, Ø22 mm, #0, Menzel-Gläser,
                       Braunschweig, Germany). Silicone-coated cover slips were glued to the bottom of 3.5 cm
                       Petri dishes to cover predrilled 1.8 cm holes [26]. Young’s modulus and Poisson’s ratio of
                       elastomer samples were determined, as described previously [27]. Before cell and acini
                       seeding, elastomeric substrates and glass substrates (Cover Slip, 24 × 24 mm, HP, Menzel-
                       Gläser, Braunschweig, Germany) were functionalized for cell adhesion with 600 µL of
                       non-gelling protein solution of Geltrex (20 µg/mL) in ice-cold PBS for 18 h at 4 ◦ C.

                       2.4. Biochemical Treatments
                            Acini were transferred onto glass and elastomeric substrates and incubated 15 min
                       after seeding either with EGF-free assay medium or with growth medium containing
                       20 ng/mL EGF [4] for defined periods of 1, 8, or 24 h. For inhibition of cellular myosin
                       activity, blebbistatin was added directly after seeding and kept on cells for the entire
                       experiment. Cells were treated with 25 µM blebbistatin (B0560 Sigma-Aldrich) and solved
                       in dimethyl sulfoxide (DMSO) (final DMSO concentration = 0.3%).

                       2.5. Immunofluorescence (IF) Staining
                             Acini were fixed for 20 min with 3.7% paraformaldehyde in cytoskeleton-buffer (CB:
                       5 mM EGTA, 5 mM glucose, 10 mM MES, 5 mM MgCl2 , 150 mM NaCl, 1 g/L streptomycin;
                       all Sigma Aldrich), washed for 5 min with 20 mM glycine-CB (Sigma-Aldrich), and perme-
                       abilized with 1% Triton-X 100-CB (Sigma-Aldrich) at RT. Non-specific antibody binding
                       was blocked with 5% skim milk powder (Sigma Aldrich) and 1% AffiniPure F(ab’)2 frag-
                       ment goat anti-mouse IgG, 115-006-006, Jackson ImmunoResearch, West Grove, PA, USA)
                       in CB for 2 h at RT. Acini were incubated overnight at 4 ◦ C with the primary antibodies
                       (anti-type IV collagen ab6586, Abcam, Cambridge, 624 England, UK; anti-cortactin (p80/85)
                       clone 4F11, Merck, Darmstadt, Germany; anti-MMP14 (MT1-MMP) MAB12762 Abnova,
                       Taipei City, Taiwan; anti-pMLCK 3671 Cell Signaling, Danvers, MA, USA; anti-talin clone
                       8d4, T3287 Sigma-Aldrich; anti-TKS5 (fish M-300) sc-30122 Santa Cruz Biotechnology,
                       Dallas, TX, USA; anti-vinculin clone hVin-1, V9131 Sigma-Aldrich) diluted in 1% skim
                       milk powder in CB (for pMLCK: blocking solution containing 1.5% bovine serum albu-
                       min (Merck) and antibodies diluted in 1.5% BSA + 0.1% Tween (Sigma Aldrich P9416).
                       Secondary antibodies conjugated with fluorescent dyes (ThermoFisher Scientific) were
                       diluted in 1% skim milk powder in CB and applied for 45 min (RT, darkness). Phalloidin
                       labeling either with Atto488 or Atto633 (ThermoFisher Scientific) was applied together with
                       secondary antibodies. Nuclei were counterstained with DRAQ5 (Cell Signaling 4084) and
                       diluted in 1:1000 in CB or DAPI (NucBlue R37606, ThermoFisher) for 10 min (RT). Washing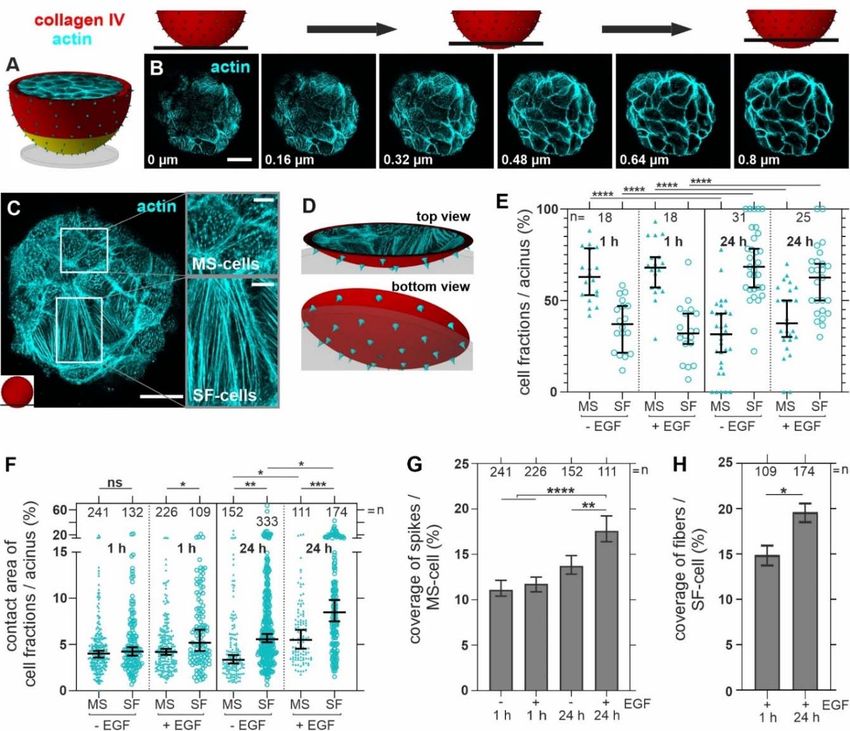
Cells 2021, 10, 1979                                                                                           4 of 22

                       steps were performed with CB. Monolayered MCF10A cells were treated according to the
                       same protocol with the following modifications. The fixation period was 10 min and cell
                       membranes were permeabilized by 0.5% Triton-X 100-CB.

                       2.6. Confocal Microscopy
                             Live-cell imaging for TFM analysis was performed at 37 ◦ C and 5% CO2 (cell incubator
                       XL, Zeiss, Germany) with an inverse confocal laser scanning microscope (LSM880 with
                       Airyscan detector) that used a 63× LD C-Apochromat water immersion objective (NA
                       1.15, Zeiss, Germany). Immunofluorescent-labeled fixed cells were analyzed with the same
                       setup. A 40× LD C-Apochromat water immersion objective (NA 1.1, Zeiss) and a 63 Plan-
                       Apochromat oil immersion objective (NA 1.4, Zeiss, Germany) were used. Images were
                       taken and processed with Airy scan processing and maximum intensity projection (MIP)
                       using the ZEN 2.3 black software (Zeiss, Germany). Live-cell imaging for acinar movement
                       detection was carried out at 37 ◦ C and 5% CO2 (cell incubator XL, Zeiss, Germany) using
                       an inverted microscope (Axiovert 200, Zeiss, Germany), equipped with an AxioCam MRm
                       camera (Zeiss, Germany) and an EC Plan-Neofluar 40× oil immersion objective (PH3,
                       NA 1.30, Zeiss, Germany). Images were taken using the ZEN 2.3 blue edition software
                       (Zeiss, Germany).

                       2.7. Actin Structure Analysis and Quantification
                             For CP analyses, acini were fixed, stained, and imaged with confocal microscopy,
                       as described above. For lateral microspike quantification, several thin confocal image
                       stacks (z-stacks) were taken, starting at 10 µm height above the cover slip and ending at
                       the equatorial plane (defined as the cross-section with the largest diameter) of the acinus.
                       The thickness of each z-stack was 1 µm, consisting of 5 images (optical section thickness:
                       247 nm). Individual z-stacks were merged as maximum intensity projections (MIP). In
                       the MIP, the BM signal appeared as a red circle. The height interval between MIP images
                       was 5 µm. For CP counting, MIP images were used. A single MS was defined as an actin
                       structure that localized within the given BM scaffold (collagen type IV) and spanned at
                       least the thickness of the collagen IV signal. The numbers of actin MS in each BM circle
                       were divided by the respective BM perimeter (in µm). The BM perimeter was calculated
                       from the measured BM radii. For actin structure analyses at the acinus–ECM interface,
                       image stacks were taken and merged via MIP. The image stacks contained 7 to 15 images
                       with an optical section thickness of 160 nm. MS and SF structures were detected. Therefore,
                       the image was band-pass filtered; BP_img = G(I, 0.5) − G(I, 7) with BP_img as the resulting
                       band-pass filtered image, I the maximum intensity projection, and G(I, X) the Gaussian
                       filtered image of I with a filter kernel width of X pixel (pixel size 0.035 µm). The band-pass
                       filtered image was then again smoothed by a Gaussian filter with a width of 1 pixel. Then,
                       the histogram-based method of Otsu [28] was used to determine a threshold to create a
                       binary mask for MS and SF. For each manually drawn cell border mask, the number and
                       size (contact area) of the cells with MS and SF, as well as the MS coverage within cells,
                       were calculated.

                       2.8. Traction Force Microscopy
                            Tangential substrate deformations caused by traction forces were visualized by track-
                       ing fluorescent beads. Beads (F8807 FluoSpheres, ThermoFischer Scientfic) were immobi-
                       lized on the top of elastomeric substrates, as described elsewhere [29]. Maps of cell-induced
                       traction stresses were calculated by regularized least-square fitting to the mechanical re-
                       sponse of an elastic layer of 80 µm thickness on rigid substrates [30]. From these maps,
                       strain energy (in femtojoule, fJ) was calculated as a scalar measure of overall mechanical
                       activity. These calculations were based on previous work [30–32]. The required algorithms
                       were implemented in MatLab (R2015a, The MathWorks Inc., and Natick, MA USA). Acini
                       were analyzed for at least 18 h. All displacements (strains) and forces (stresses) were with
                       reference to the first image of the series (t = 0). Therefore, we determined changes of strain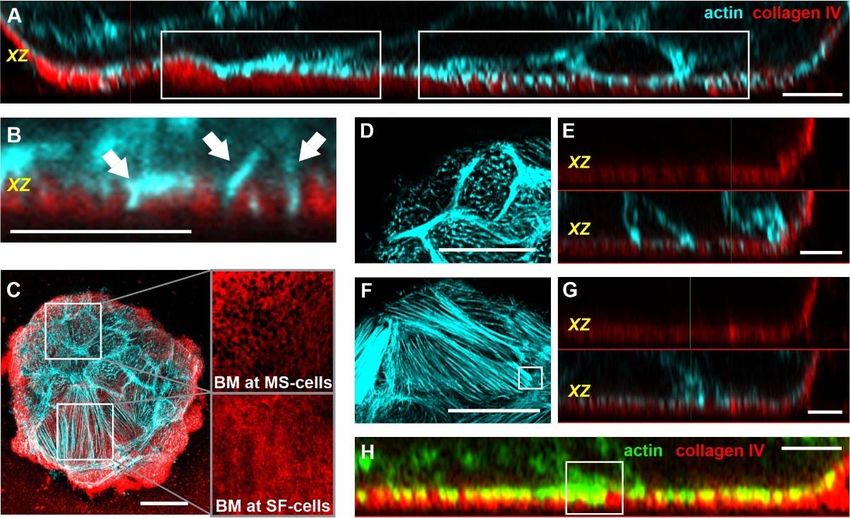
Cells 2021, 10, 1979                                                                                          5 of 22

                       energy with respect to that reference state. For spatio-temporal correlation of strain energy
                       and actin SF pattern, a detection threshold was applied (≥25% of the maximum detected
                       stress in nN/µm2 ) to segment hot spots. Manually drawn stress fiber masks were overlaid
                       with hot spot segmentation for correlation.

                       2.9. Statistical Analyses
                             All measured values were plotted. For statistical data analyses mean values of each
                       measured acinus were used instead, as indicated in the Figure legends. For data analysis
                       of strain energy for each acinus per condition (n = 4), 60 values (in total 240 values of
                       strain energy) were randomly selected using the bootstrap method (resampling) without
                       replacement (1000 repetitions). For all analyses, the two-tailed nonparametric Mann–
                       Whitney U-test with a 95% confidence interval was performed using GraphPad Prism
                       version 8.4.2 (GraphPad Software, La Jolla, CA USA). p-values were defined as follows:
                       n.s.: p ≥ 0.05; *: p < 0.05; **: p < 0.01; ***: p < 0.001; ****: p < 0.0001).

                       3. Results
                       3.1. Tumor-like EGF and Substrate Stiffness Induce BM-Piercing Microspikes
                             To examine the formation of actin-based cell protrusions (CP) and their function for
                       BM invasion, we used MCF10A-derived breast cell acini with an endogenously formed BM
                       scaffold. This cell model has been widely used to study normal breast gland morphogene-
                       sis [33] and the invasion-promoting role of immature BM mechanics [6]. We adopted acini
                       with either a low-developed BM (ld-BM, 11 days old) or a highly-developed BM (hd-BM,
                       22 days old) from the latter work. These cell models were used to investigate the interaction
                       of mechanosensing CPs with differentially matured BM barriers. Of note, the mechanical
                       strength of the BM barrier increases significantly during acinar maturation [4,5].
                             Figure 1A shows that even the basal cell layer of hd-BM acini formed actin-rich,
                       BM-piercing CPs at physiological ECM conditions. To recapitulate CP formation in pro-
                       invasive conditions, we stimulated the acinar cells with soluble EGF. A sample transfer
                       onto cover slips was mandatory to capture the dynamic process of CP formation and
                       retraction with high microscopic resolution. Besides, such stiff substrate stimulation was
                       purposely used in this work to trigger the invasive transition of benign breast acini, as
                       previously described [6].
                             In experiments on ld-BM acini, we observed numerous actin-rich CPs. These acini
                       showed pores in the collagen type IV network of the BM (Figure 1B), frequently penetrated
                       by thin finger-shaped actin structures (Figure 1B). These condensed actin assemblies
                       (lengths mainly < 2 µm) were precursors of more elongated CPs reaching deeper into
                       the extracellular space. We defined these short CPs as microspikes (MS). Actin MS were
                       heterogeneously distributed over the entire acinar surface (Figure 1C).
                             Moreover, local hot spots of high MS density (Figure 1D) and single MS with extended
                       lengths of approx. five µm were evident (Figure 1E). The life-cycle of a single observed MS
                       spanned several minutes (Figure 1F and Supplementary Movie S1). Two additional movies
                       provide the complete visualization of this highly dynamic actin reorganization in several
                       MS (Supplementary Movies S2 and S3).
                             Next, we aimed to quantify the MS formation frequency depending on BM maturation,
                       EGF stimulation, and adhesion time on a stiff substrate. The MS signals were detected over
                       a defined area of the acinar surface. The MS number per BM perimeter was calculated
                       (Figure 2A—yellow area). This approach revealed a significantly increased MS formation
                       due to temporally extended EGF stimulation (Figure 2B). In detail, after one hour, no
                       differences were detectable between EGF-treated and untreated hd-BM samples. Only
                       ld-BM acini were affected by such brief EGF stimulation. The fold change (FC) of MS
                       formation was 1.8. The EGF effect was pronounced upon prolonged stimulation. After 24 h,
                       EGF significantly induced MS formation in ld- and hd-BM acini, whereas the untreated
                       counterparts remained at the basal level that was measured after one hour (FC = 5.3).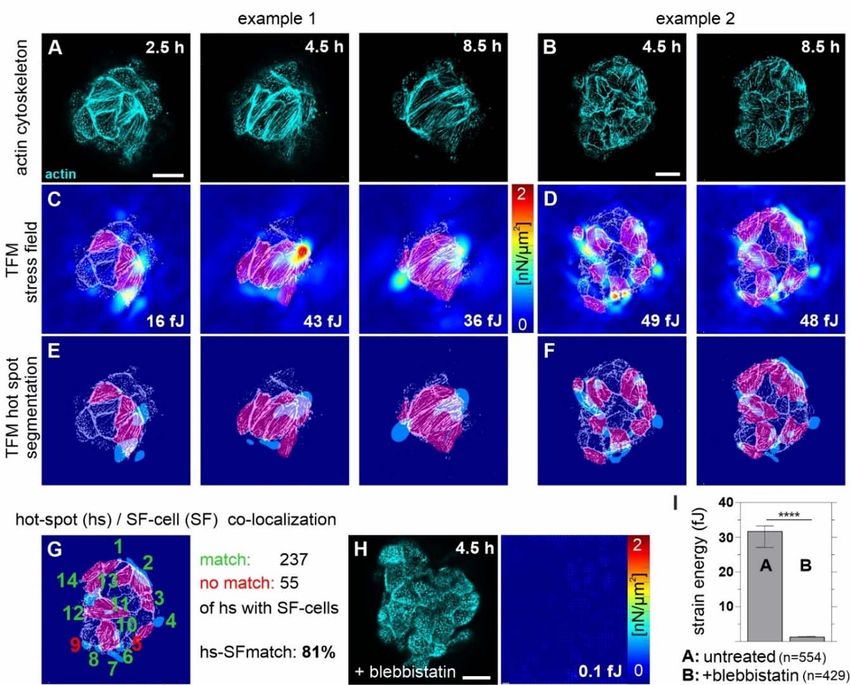
Cells 2021, 10, 1979 6 of 22
Cells 2021, 10, x FOR PEER REVIEW 6 of 22
Figure1.
Figure 1. Breast
Breast acini
acini form
form dynamic
dynamic BM-breaching
BM-breachingMS. MS. The
The spatial
spatial localization
localizationofof the
the analyzed
analyzed confocal
confocalimage
imageis is indicated
indicated
as a black horizontal bar within the schematically shown red acinus (A,C,F). (A–E): MCF10A acini were
as a black horizontal bar within the schematically shown red acinus (A,C,F). (A–E): MCF10A acini were fixed and IF-stained. fixed and IF-
stained. Confocal images of breast acini treated with pro-invasive cues (24 h EGF treatment, glass). In all micrographs,
Confocal images of breast acini treated with pro-invasive cues (24 h EGF treatment, glass). In all micrographs, collagen IV
collagen IV signal is shown in red and actin in cyan. (A) Overview of an EHS matrix-embedded hd-BM acinus with BM
signal is shown in red and actin in cyan. (A) Overview of an EHS matrix-embedded hd-BM acinus with BM piercing CPs.
piercing CPs. (B) Magnification of an intact BM scaffold highlights the collagen IV network pores (white arrows)
(B) Magnification
interleaved of an
by short intact
actin MS.BM(C)scaffold highlights
Heterogeneous the collagen
arrangement IV distribution
and network pores (white arrows)
of laterally elongatedinterleaved
MS breachingby short
the
actin MS. (C) Heterogeneous arrangement and distribution of laterally elongated MS breaching the BM
BM barrier. (D) A local hot spot of high MS density and (E) the formation of parallel MS bundles. (F) Image series barrier. (D) A local
of a
hot spotMCF10A/RFP-LifeAct
living of high MS density and (E) the
acinus formation of parallel
(EGF-treated). MS series
The image bundles. (F) Image
depicts series ofofaMS
the lifetime living MCF10A/RFP-LifeAct
formation (white arrows)
(min:sec).
acinus For complete
(EGF-treated). The image
imageseries,
seriessee Supplementary
depicts the lifetimeMovie
of MSS1. Scale bars:
formation (A,C)
(white = 20 μm;
arrows) (B,D–F)For
(min:sec). = 5complete
μm. image
series, see Supplementary Movie S1. Scale bars: (A,C) = 20 µm; (B,D–F) = 5 µm.
In experiments on ld-BM acini, we observed numerous actin-rich CPs. These acini
showedBeyond thein
pores strong
the effect
collagen of EGF
typeonIV
ld-acini
network(0.17ofprotrusion/µm
the BM (Figure corresponding to a
1B), frequently
median of 45byMS
penetrated perfinger-shaped
thin BM perimeteractin at 24 h), substrate
structures stiffness
(Figure 1B).played
Thesea condensed
role; even inactin
the
absence of EGF
assemblies stimulation,
(lengths mainlysince
< 2 immature
μm) wereld-BM acini exhibited
precursors of more raising CP numbers
elongated with
CPs reaching
increasing
deeper intoadhesion time (FC space.
the extracellular = 4.9) (Figure 2B). Together,
We defined these short these
CPsresults indicate that
as microspikes soluble
(MS). Actin
EGF fueled MS formation in pre-invasive breast acini. In addition,
MS were heterogeneously distributed over the entire acinar surface (Figure 1C). acini with mechanically
matured and thicker
Moreover, localBM hotappeared
spots ofunaffected
high MS by stiff adhesion
density (Figure substrates compared
1D) and single MS with
with
EGF-lacking ld-BM acini (Figure 2B).
extended lengths of approx. five μm were evident (Figure 1E). The life-cycle of a single
We next
observed MSinvestigated
spanned severalthe protrusion formation
minutes (Figure 1F atandtheSupplementary
late stage of invasive
Movietransition
S1). Two
in acini thatmovies
additional alreadyprovide
underwent the local BM disruption
complete visualizationand cell transmigration.
of this Figureactin
highly dynamic 2C
illustrates the general invasion process after seeding
reorganization in several MS (Supplementary Movies S2 and S3). non-invasive breast acini on stiff
substrates
Next, and
we the start of
aimed to EGF stimulation.
quantify the MSAfter this switch
formation of ECM depending
frequency conditions, the
on BMBM
got eventually disrupted at the acinus-ECM contact area (Figure 2C,
maturation, EGF stimulation, and adhesion time on a stiff substrate. The MS signals wereblack box) and cells
collectively
detected over transmigrated
a defined area from theacinar
of the acinarsurface.
body intoThethe MSmicroenvironment (Figure 2D).
number per BM perimeter was
The leading edges of these outgrowing cells contained a high density of elongated filopodia-
calculated (Figure 2A—yellow area). This approach revealed a significantly increased MS
like protrusions—a characteristic of cells migrating on planar substrates (Figure 2E and
formation due to temporally extended EGF stimulation (Figure 2B). In detail, after one
Supplementary Movie S4). Surprisingly, the basal cell layer of acini that underwent local
hour, no differences were detectable between EGF-treated and untreated hd-BM samples.
BM disruption formed fewer lateral CPs than cells of the non-invasive fractions (Figure 2F).
Only ld-BM acini were affected by such brief EGF stimulation. The fold change (FC) of
This unexpectedly low number was irrespective of EGF treatment and BM state (mean
MS formation was 1.8. The EGF effect was pronounced upon prolonged stimulation. After
FC = 2.7) (Figure 2F).
24 h, EGF significantly induced MS formation in ld- and hd-BM acini, whereas the
untreated counterparts remained at the basal level that was measured after one hour (FC
= 5.3).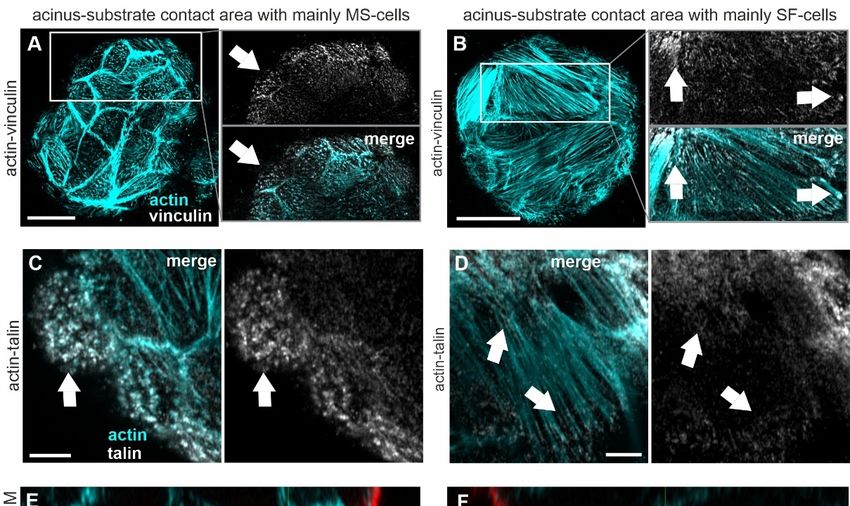
Cells 2021, 10, 1979 7 of 22
Cells 2021, 10, x FOR PEER REVIEW 7 of 22
Figure 2.
Figure 2. MS
MS formation
formation isis fueled
fueled byby tumor-like
tumor-like stiffness
stiffness and
and oncogenic
oncogenic EGF.
EGF.For Foranalyses,
analyses, MCF10A
MCF10A acini acini were
were fixed
fixed and
and
IF-stained. (A) The schematic illustrates the acinar area analyzed for MS quantification (yellow area: start at 10 μm above
IF-stained. (A) The schematic illustrates the acinar area analyzed for MS quantification (yellow area: start at 10 µm above
the glass up to the equatorial plane, defined as the cross-section with the largest diameter). MS were counted for several
the glass up to the equatorial plane, defined as the cross-section with the largest diameter). MS were counted for several
confocal image planes in this area (see material and methods for a detailed description). (B) Scatter plot summarizes MS
confocal
numbersimage planes in this
in non-invasive aciniarea (see material
depending on theandBMmethods
state andfor a detailed
oncogenic description).
EGF treatment over(B) Scatter plot summarizes
time. Counts MS
of protrusions
numbers in non-invasive
(x) were divided acini depending
by individual BM perimeterson the(inBM
μm)state andanalyzed
of each oncogenicconfocal
EGF treatment
image. Forover time. Counts
a summary of protrusions
of observed acinar
(x) were
radii fordivided by individual
BM perimeter BM perimeters
calculation, (in µm) ofFigure
see Supplementary each analyzed
S1. (C) Theconfocal image. workflow
experimental For a summaryof theof observed
designed acinar
invasion
assayfor
radii illustrates the invasive
BM perimeter transition
calculation, of benign acini
see Supplementary transferred
Figure S1. (C) on
Theaexperimental
stiff substrateworkflow
and conditional EGF stimulation
of the designed invasion
(blackillustrates
assay box: area the
of invasion
invasive at the cell–BM–substrate
transition of benign aciniinterface)
transferred(D)onAarepresentative
stiff substrate image shows local
and conditional EGF BMstimulation
disruption
(white box) and invasive cell transmigration (white arrow indicates the direction of cell migration)
(black box: area of invasion at the cell–BM–substrate interface) (D) A representative image shows local BM disruption in an EGF-treated
acinus.box)
(white (E) and
Collectively outgrowing
invasive cell cell clusters
transmigration (white showed frequent
arrow indicates thefilopodial
direction CP at migration)
of cell the migration in anfront. For additional
EGF-treated acinus.
images, see Supplementary Movie S4. (F) Scatter plot compares the lateral MS formation in invasive and non-invasive
(E) Collectively outgrowing cell clusters showed frequent filopodial CP at the migration front. For additional images, see
acini fractions depending on pro-invasive cues (24 h on glass). Sample size n: number of analyzed images of at least three
Supplementary Movie S4. (F) Scatter plot compares the lateral MS formation in invasive and non-invasive acini fractions
independent experiments. Scatter plots: bars: median with 95% confidence interval. For statistical tests mean values per
depending
acinus wereonused:
pro-invasive
Mann–Whitneycues (24U-test
h on glass). Sample
with: **** = p < size n: number
0.0001, *** = p < of analyzed
0.001, * = p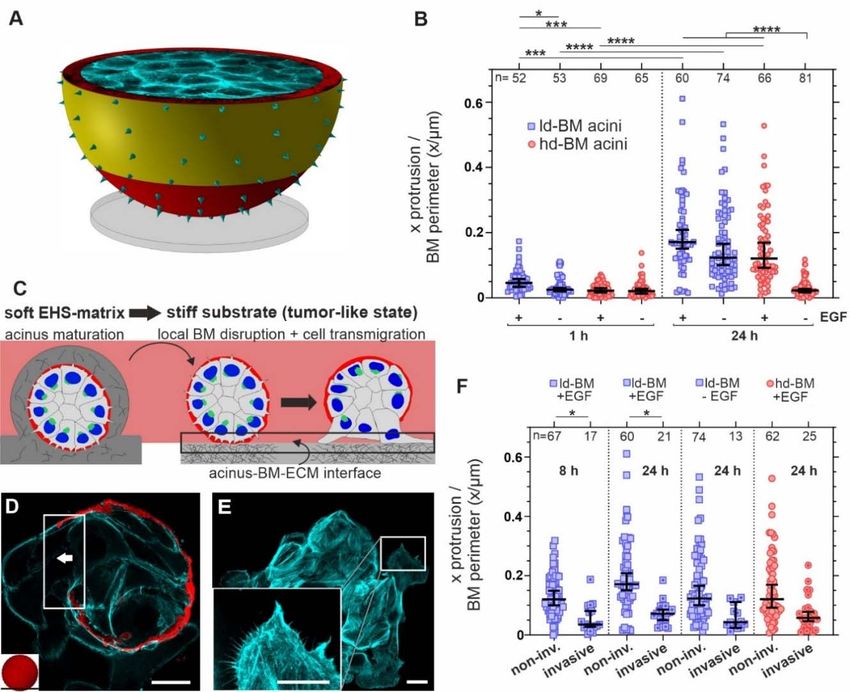
by proteolytic BM-weakening under most invasive conditions, i.e., ld-BM acini,
stimulation, and stiff substrate. The co-localization of three representative invadop
marker proteins, namely Tks5, cortactin, and the membrane-bound MT1-MMP
Cells 2021, 10, 1979 analyzed. It turned out that all three markers accumulated within the8 of actin
22 corte
invasion-triggered breast acini with intact BMs (Figures 3A,B and S2A). Despite the si
in the basal actin cortex, only a few MS showed an actin co-localization with t
invadopodia markers
ers (Figure 3C–E, (Figure
white arrows).3C–E, white arrows).
The majority The by
of CPs formed majority of CPs
acinar cells formed
lacked, for by a
cells lacked,
instance, thefor instance,
proteolytic the proteolytic
enzyme MT1-MMP. Toenzyme
this end,MT1-MMP. Toimage
a representative this end,
showsathat
represent
co-localization
image shows that of MT1-MMP with actin
co-localization MS was occasional
of MT1-MMP with (Figure
actin MS3F).was occasional (Figure
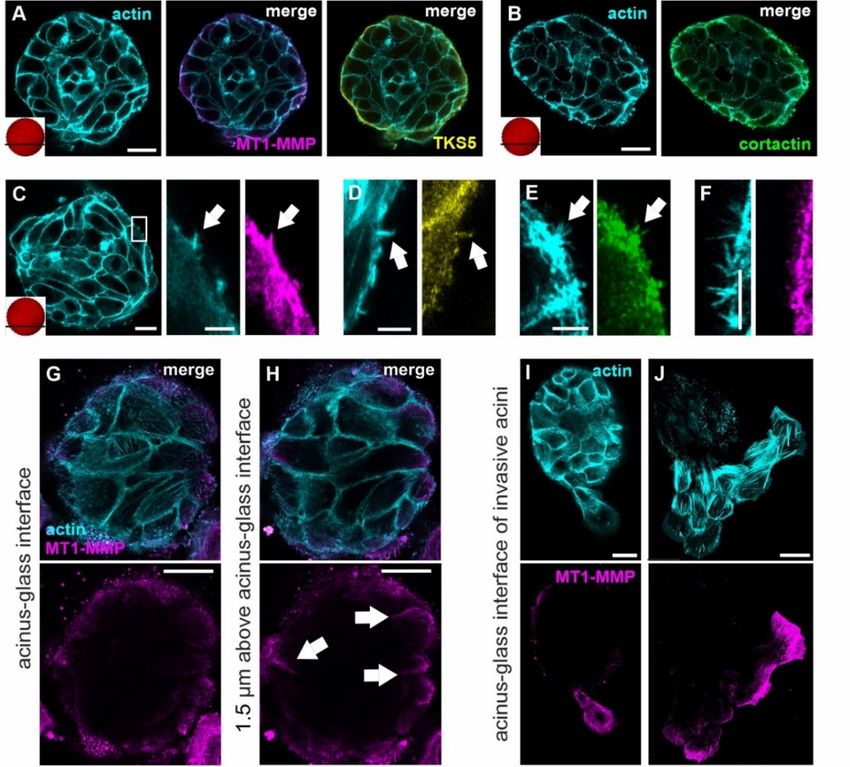
Figure 3.Figure
Subcellular localization
3. Subcellular of invadopodia
localization of invadopodiamarkers inacinar
markers in acinarandand invasive
invasive cells.cells.
MCF10AMCF10A acinifixed
acini were were
andfixed and IF-
stained. IF-stained.
(A–F): Confocal
(A–F): Confocal images of pre-invasive breast acini with intact BM treated with pro-invasive cues (ld-BM,(ld-BM, 24 h
images of pre-invasive breast acini with intact BM treated with pro-invasive cues
24 h EGF treatment, glass). (A,B): The actin cortex (cyan) of the basal cell layer of pre-invasive acini co-localizes with the
invadopodia marker proteins MT1-MMP (magenta), Tks5 (yellow), and cortactin (green) (for single MT1-MMP, TKS5, and
cortactin signal see Supplementary Figure S2A. (C–E): Visualization of the actin cytoskeleton with small single actin-based
lateral MS, co-localized with MT1-MMP (C), Tks5 (D) and cortactin (E). (F) Area of high MS density without co-localization
of MT1-MMP and actin MS. (G,H) MT1-MMP protein localization at cortical actin structures in cells at the BM–substrate
interface (cf. A) (white arrows). (I,J): Micrographs showing MT1-MMP at the migration front of invasive cells after
BM breakdown. Antibody control staining is provided in Supplementary Figure S2D. Scale bars: (A–C,G–J) = 20 µm,
magnifications in (C–F) = 5 µm.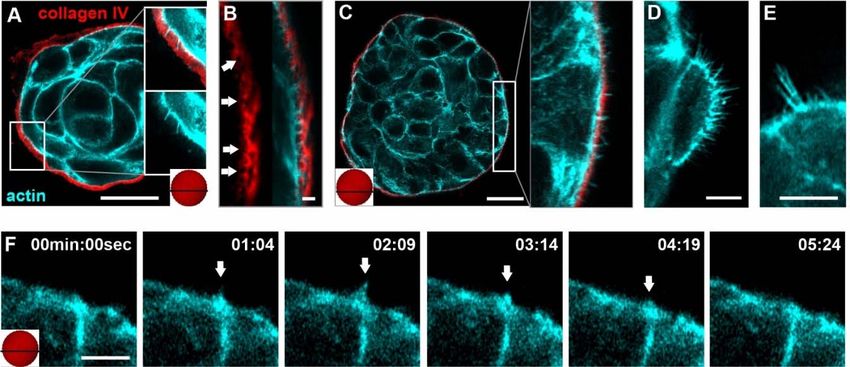
Cells 2021, 10, 1979                                                                                             9 of 22

                             A closer look at the basal cell layer, approximate to the underlying substrate, revealed
                       MT1-MMP protein accumulation at the actin cortex (Figure 3G,H, white arrows) similar to
                       that found at the outer rim of the entire basal cell layer (cf. Figure 3A). Striking evidence
                       for the involvement of MT1-MMP was observed at the later stages of BM invasion. Here,
                       MT1-MMP accumulated strongly in the leading cell that firstly transmigrated through the
                       disrupted BM (Figure 3I). Further increased localization of MT1-MMP at the leading edges
                       of the collectively invading cell cluster was detected (Figure 3J). ECM-spreading cells also
                       formed abundant and elongated CP that stained positive for all IP markers (Supplementary
                       Figure S2B,C).
                             Together, these results demonstrated that non-invasive breast acini feature a basal
                       level of MT1-MMP. However, in pre-invasive stages, BM-breaching MS mostly did not
                       contain the BM-degrading MT1-MMP. In contrast, at late stages of invasion, invadopodia
                       formation with abundant MMP expression occurred in spreading cells that transmigrated
                       into the ECM. Interestingly, we found fibrous and dot- or spike-shaped actin structures in
                       cells that directly contacted the BM–ECM interface (Figure 3G). These structures clearly
                       differed from the cortical actin cytoskeleton of basal cells that were localized elsewhere
                       within the acinar body (Figure 3A).

                       3.3. Breast Acini Switch Cytoskeletal Organization at Sites of Potential BM-Invasion
                             To investigate cytoskeletal remodeling in invasion-triggered breast acini, we carefully
                       analyzed the cell–BM–ECM contact zone of pre-invasive acini before local BM-disruption
                       occurred (Figure 4A, yellow area). Figure 4B shows the characteristics of actin cytoskeleton
                       networks formed by the first BM-covered basal cell layer at the contact plane to the
                       underlying substrate. Based on the predominant actin structures, we defined two cell
                       phenotypes (Figure 4C). Firstly, microspike (MS) cells exhibited a high density of actin dots
                       and spikes that often appeared towards the underlying substrate plane. Secondly, stress
                       fiber (SF) cells were covered by ventral actin fibers orientated parallel to the substrate plane
                       (illustrated in Figure 4D).
                             Interestingly, the inter-acinar proportion of MS and SF cells significantly changed
                       with prolonged incubation on stiff substrates and EGF stimulation. In detail, directly after
                       seeding (1 h), MS cells dominated the basal cell layer (Figure 4E). However, after 24 h, the
                       opposite held true, as the SF cell fraction was significantly increased and dominated over
                       MS cells. This switch from MS to SF was related to the stiff substrate and further unaffected
                       by additional EGF treatment (Figure 4E).
                             Further, the total number of substrate contacting cells per acinus was reduced over
                       time by 18% (mean cell number of cells in contact at 1 h = 20 and 24 h = 14 cells of in total 36
                       (1 h) and 56 (24 h) analyzed acini). At the same time, the contact area of individual SF cells
                       increased significantly compared to MS cells (Figure 4F). The rapid spreading of SF cells
                       after one hour was dependent on EGF treatment (Figure 4F). Besides the overall decrease in
                       MS cells after 24 h, a significant increase in microspike coverage in the remaining fraction
                       was evident. EGF also gradually enhanced the stress fiber coverage in the SF cell fraction
                       (Figure 4G,H).
                             Together, these results indicate a switch from MS to SF cells in tumorous ECM condi-
                       tions. Furthermore, this fundamental cytoskeleton reorganization at the basal cell cortex,
                       i.e., an increase in the number of SF cells and the contact area, was reinforced by pro-
                       invasive EGF and preceded the temporally increased formation of actin microspikes.
Cells 2021, 10, x FOR PEER REVIEW 10 of 22
Cells 2021, 10, 1979 10 of 22
cortex, i.e., an increase in the number of SF cells and the contact area, was reinforced by
pro-invasive EGF and preceded the temporally increased formation of actin microspikes.
Figure 4. Tumor-like substrate stiffness and EGF trigger actin remodeling at the acinus-BM–ECM interface. Ld-BM acini
Figure 4. Tumor-like substrate stiffness and EGF trigger actin remodeling at the acinus-BM–ECM interface. Ld-BM acini
were treated with tumor-like conditions (+/− EGF for 1 and 24 h on stiff substrate) and subsequently fixed and IF-stained
were treated with tumor-like conditions (+/− EGF for 1 and 24 h on stiff substrate) and subsequently fixed and IF-stained
for analyses. (A) The schematic illustrates the analysis area at the cell–ECM interface (yellow). (B) Confocal image series
for analyses.
shows (A)acinar
the basal The schematic
cell layerillustrates the analysis
(1 h on glass, −EGF). (C)area
A at the cell–ECMimage
representative interface
shows (yellow). (B)networks
the actin Confocalin image
MS and series
SF
shows the basal acinar cell layer (1 h on glass, − EGF). (C) A representative image shows the actin networks
cells (1 h on glass, +EGF). (D) The schematic illustrates the observed spatial orientation of actin dots, spikes and fibers. (E) in MS and SF
cells (1 h on
A scatter glass,
plot for+EGF).
MS and (D)SF The schematic
cell formation illustrates the observed
at cell-ECM contact spatial orientation
area (basal of actin
cell layer dots,
of an spikesasand
acinus fibers.in(E)
shown A
(C))
depending
scatter plot on
for substrate
MS and SF stiffness and duration
cell formation of EGF
at cell-ECM stimulation.
contact Cell cell
area (basal fractions
layer of(%)anwere
acinus calculated
as shownbyindividing the MS
(C)) depending
andsubstrate
on SF cell numbers
stiffnessbyandthe total cellofnumber
duration at the contact
EGF stimulation. Cellplane of individual
fractions acini. (F) Abyscatter
(%) were calculated plotthe
dividing forMSthe and
sizeSFof cell
MS
and SF cells at the contact area depending on the duration of contact to a stiff substrate and
numbers by the total cell number at the contact plane of individual acini. (F) A scatter plot for the size of MS and SF cells EGF stimulation (n = all
analyzed single cells/cell fractions of the observed acini in (E)). The contact area (%) of cell
at the contact area depending on the duration of contact to a stiff substrate and EGF stimulation (n = all analyzed singlefractions was calculated by
dividing the cell area (pixel) of MS and SF cells by the total contact area of individual acini (pixel). (G,H) The graphs show
cells/cell fractions of the observed acini in (E)). The contact area (%) of cell fractions was calculated by dividing the cell area
microspike coverage in MS cells (G) and stress fiber coverage in SF cells (H) depending on tumor-like ECM. n = total
(pixel) of MS and SF cells by the total contact area of individual acini (pixel). (G,H) The graphs show microspike coverage
number of analyzed acini (E) or cells (F–H). Scatter plots and bar charts (E–H): bars: median with 95% confidence interval.
in
ForMS cells (G)tests
statistical andmean
stressvalues
fiber coverage
per acinusin were
SF cells (H)Mann–Whitney
used: depending on tumor-like
U-test with: n.s.: n
ECM. p ≥= 0.05;
total ∗:
number
p < 0.05;of∗∗:
analyzed
p < 0.01;acini
∗∗∗:
(E)
p < or cells∗∗∗∗:
0.001; (F–H).p(Figure 5C, lower box).
To further evaluate the dynamics of actin–BM interactions, we used pro-invasive
EGF to trigger the cytoskeletal switch. In line with our previous results (cf. Figure 4E),
after a short one-hour treatment, mostly MS cells with a high actin spike coverage were
Cells 2021, 10, 1979 present (Figure 5D,E). Interestingly these MS cells showed frequent occurrences of BM
11 of 22
pore penetration (Figure 5E). On the other hand, after 24 h of EGF treatment, the frequency
of BM traversing actin spikes was reduced in SF cells (Figure 5F,G). As described above,
most of the ventral actin structures in SF cells arranged on top of the BM (Figure 5H).
actinInmicrospikes
SF cells, BM that reached the
penetration underlying
occurred glass
at the endssubstrate were
of ventral frequent
stress fibers (Figure 5B,
( cf. white
arrowheads). A closer investigation of the BM’s collagen IV meshwork showed
boxes in Figure 5F,H). Together, our results imply that cells in breast acini penetrate the that basal
cellsby
BM with high MS formed
frequently density located onto porous
actin spikes and by BM areasstress
ventral (Figure 5C,tips.
fiber upper box).
The In contrast,
frequencies of
SF-rich cells adhered to a less porous regions of the collagen IV meshwork
these protrusive modes switch during the cytoskeletal remodeling process at the cell–BM– (Figure 5C,
lowerinterface.
ECM box).
Figure 5.
Figure 5. The
The actin
actin cytoskeleton
cytoskeletonintercalates
intercalateswith
withthe
theBMBM scaffold.
scaffold. Pre-invasive
Pre-invasive MCF10A
MCF10A acini
acini were
were fixed
fixed andand IF-stained.
IF-stained. (A)
(A) The orthogonal projection of the basal cell layer that is in direct contact with the underlying substrate (not visible)
The orthogonal projection of the basal cell layer that is in direct contact with the underlying substrate (not visible) highlights
highlights the connections between actin (cyan) and the BM (collagen IV, red). Left box: F-actin located on top of collagen
the connections between actin (cyan) and the BM (collagen IV, red). Left box: F-actin located on top of collagen IV network.
IV network. Right box: F-actin penetrating the collagen IV network. (B) The micrograph shows BM traversing microspikes
Right
(whitebox: F-actin
arrows) penetrating
in an MS cell ofthe an collagen IV network.
EGF triggered ld-BM (B) The(7micrograph
acinus h on glass).shows BM traversing
(C) Overview image microspikes (white
of the acinus–BM–
arrows)
substrateininterface
an MS cell of an
shows EGF triggered
different ld-BM
BM porosity acinusMS
beneath (7 hcells
on glass).
(upper (C)
box)Overview image
and SF cells of the
(lower box)acinus–BM–substrate
(ld-BM, 1 h on glass,
interface
–EGF) (sameshows different
sample BM porosity
analyzed beneath
as in Figure 4C) MS
(D) cells
Acinus(upper
withbox) and SF
MS cells cells (lower
(ld-BM, box) (ld-BM,
1 h on glass, –EGF). 1(E)h on
Theglass, –EGF)
orthogonal
projection
(same of MS
sample cells shows
analyzed actin-rich
as in Figure microspikes
4C) (D) penetrating
Acinus with MS cells the BM collagen
(ld-BM, IV scaffold.
1 h on glass, (F)The
–EGF). (E) Acinus with SFprojection
orthogonal cells (ld-
BM,
of MS24cells
h onshows
glass, actin-rich
+EGF). (G)microspikes
The orthogonal projection
penetrating the of
BM SFcollagen
cells shows actin stress
IV scaffold. fibers ends
(F) Acinus withatSFthe top(ld-BM,
cells of the collagen
24 h on
IV network without detectable penetration. (H) The orthogonal projection of an SF cell highlights a BM-penetrating
glass, +EGF). (G) The orthogonal projection of SF cells shows actin stress fibers ends at the top of the collagen IV network stress
fiber-tip (cf. box in (F)). Scale bars: (C,D,F) = 20 μm, others = 5 μm.
without detectable penetration. (H) The orthogonal projection of an SF cell highlights a BM-penetrating stress fiber-tip (cf.
box in (F)). Scale bars: (C,D,F) = 20 µm, others = 5 µm.
To further evaluate the dynamics of actin–BM interactions, we used pro-invasive
EGF to trigger the cytoskeletal switch. In line with our previous results (cf. Figure 4E),
after a short one-hour treatment, mostly MS cells with a high actin spike coverage were
present (Figure 5D,E). Interestingly these MS cells showed frequent occurrences of BM pore
penetration (Figure 5E). On the other hand, after 24 h of EGF treatment, the frequency of
BM traversing actin spikes was reduced in SF cells (Figure 5F,G). As described above, most
of the ventral actin structures in SF cells arranged on top of the BM (Figure 5H).
In SF cells, BM penetration occurred at the ends of ventral stress fibers ( cf. white
boxes in Figure 5F,H). Together, our results imply that cells in breast acini penetrate the
BM by frequently formed actin spikes and by ventral stress fiber tips. The frequencies of
these protrusive modes switch during the cytoskeletal remodeling process at the cell–BM–
ECM interface.Cells
Cells 2021,
2021, 10,
10, x1979
FOR PEER REVIEW 1212of
of 22
22
3.5. Acinar Cells Adhere to the BM and the ECM by Force-Transmitting FAs
3.5. Acinar Cells Adhere to the BM and the ECM by Force-Transmitting FAs
MS and SF cells form actin microspikes and stress fibers that co-localize with the BM
MS and SF cells form actin microspikes and stress fibers that co-localize with the BM
scaffold. We tested how acinar cells were coupled to the underlying BM and ECM. We
scaffold. We tested how acinar cells were coupled to the underlying BM and ECM. We
found that MS and SF cells formed FAs. The mechanosensory FA proteins vinculin and
found that MS and SF cells formed FAs. The mechanosensory FA proteins vinculin and
talin
talin were frequentlyassociated
were frequently associatedwith
with microspikes
microspikes in the
in the cellcell cortex
cortex ofcells
of MS MS (Figure
cells (Figure
6A,C,
6A,C, white arrows) and with stress fiber tips in SF cells (Figure 6B,D,
white arrows) and with stress fiber tips in SF cells (Figure 6B,D, white arrows). However,white arrows).
However, the FA-patches
the FA-patches at fiber
at fiber tips weretips were generally
generally smaller in smaller in non-invasive
non-invasive acinar
acinar cells cells
than in
than in spread cells that underwent BM invasion (Supplementary
spread cells that underwent BM invasion (Supplementary Figure S3A). Vinculin spotsFigure S3A). Vinculin
spots
were were present
present within within the collagen
the collagen IV network
IV network in cell
in both bothfractions.
cell fractions. However,
However, in MSincells,
MS
cells, vinculin was exclusively found in BM-piercing actin spikes (Figure 6E).
vinculin was exclusively found in BM-piercing actin spikes (Figure 6E). In SF cells, vinculin In SF cells,
vinculin predominately
predominately co-localized
co-localized with
with stress stress
fiber tipsfiber tips anchored
anchored within thewithin the collagen
collagen IV
IV scaffold
scaffold (Figure 6F, cf. right
(Figure 6F, cf. right arrow in B).arrow in B).
Figure
Figure 6.
6. Focal
Focal adhesion-mediated
adhesion-mediated actomyosin
actomyosin activation
activationinin MS
MS and
and SF
SF cells.
cells. MCF10A
MCF10Aacini
aciniwere
were fixed
fixed and
and IF-stained.
IF-stained.
(A–D): Representative confocal images of the acinus–BM–substrate interface. (A,C) MS cells (1h on glass, −EGF) and (B,D)
(A–D): Representative confocal images of the acinus–BM–substrate interface. (A,C) MS cells (1h on glass, −EGF) and
SF cells (24 h on glass, +EGF) show the co-localization of actin microspikes and stress fiber ends with vinculin and talin
(B,D) SF cells (24 h on glass, +EGF) show the co-localization of actin microspikes and stress fiber ends with vinculin and talinCells 2021, 10, 1979 13 of 22
(arrowheads) ((A,B): same sample analyzed as in Figure 5D,F). (E) The orthogonal cross sections highlight the co-localization
of vinculin with microspikes in MS cells. (F) SF cell with co-localization of vinculin with stress fiber ends within the BM
scaffold (yellow). White box: position as indicated in ((B), right arrow) (collagen IV and actin signal confocal images in
(E,F) are reused from Figure 5E,G). (G) Overview image of the acinus–BM–substrate interface demonstrates pMLCK-actin
co-localization. (H) Zoom-in on an invasive cell shows actin stress fiber and pMLCK co-localization after BM transmigration.
(I) Detailed view on pMLCK bound to actin microspikes in MS cells and (J) to stress fibers in SF cells. A pMLCK staining of
cells on a planar substrate and a secondary antibody control staining is provided in Supplementary Figure S3B,C. Scale bars
in (A,B,G–J) = 20 µm and (C–F) = 5 µm.
When seeded on planar substrates, breast acini perform a continuous coherent move-
ment (see Supplementary Movie S5) that is essential for acinar differentiation and home-
ostasis [34]. We next addressed how FA-bound MS and SF structures are involved in
actomyosin contractility and acinar cell motion triggered by pro-invasive conditions. To
this end, we analyzed the localization of activated pMLCK with cytoskeletal actin as an
indicator for force-transmitting actin fibers. Figure 6G demonstrates a clear pMLCK-actin
co-localization in the entire basal cell layer at the BM–substrate interface. In detail, acti-
vated pMLCK was bound to actin microspikes in MS cells and actin stress fibers in SF cells
(Figure 6I,J). Furthermore, the overall pMLCK intensity in pre-invasive acinar cells was
comparable to the one in spreading and invasive cells (Figure 6H). Together, these results
indicate that stress fibers and microspikes were mechanically coupled to the underlying
BM and the substrate via mechanosensory FAs. It appears likely that these FAs transmit
actomyosin-driven mechanical stress between the BM scaffold and the ECM.
3.6. Tumor ECM-Induced SF Cell Formation Drives Myosin II-Mediated BM Stress
Finally, we tested how the switch from MS to SF cells contributes to physical BM
disruption. Placing non-invasive MCF10A breast acini onto tumor-like elastomeric sub-
strates (12 kPa) induces the invasive transition characterized by local BM disruption and
cell dissemination [6]. Quantitative cell traction force microscopy was applied to measure
cell force-based BM stress at the acinus–BM–substrate interface.
Image sequences showed the dynamic change in actin cytoskeleton organization in
moving MS and SF cells at the substrate contact plane (Figure 7A,B). Forces exerted by these
cells caused spatially confined hot spots of substrate stress fields (Figure 7C,D). These stress
hot spots appeared at places where actin stress fiber tips were present. Two representative
samples highlight two principal SF cell phenotypes with different stress fiber organizations
generally found in breast acini:
Example 1 illustrates the formation of large elongated SF cells. Here, the same stress
fiber orientation propagated between neighbored cells. The corresponding significant stress
hot spots localized at the borders of these cells (Figure 7A) indicated high cell contractility
along the axes of stress fibers. In contrast, no stress hotspots were detectable underneath
MS cell populations at an early time point (one hour), before SF cell formation started
(Figure 7A,C).
Example 2 exhibited a small SF cell phenotype with more dispersed, thinner, and more
abundant actin stress fibers. These fibers had less-ordered orientations than in sample 1.
Accordingly, stress hot spots were less pronounced (Figure 7B,D). However, the enhanced
number of these spots resulted in comparable total strain energy (SE) of 43–48 fJ for both
SF cell phenotypes at different measuring points (4.5 and 8.5 h). Strain energy is a robust
measure of cell mechanical activity, calculated from substrate deformation and stress maps.
Stress hot spots were localized automatically by segmentation to facilitate comparison
with actin localization (Figure 7E,F). This result demonstrated the co-localization of high-
force amplitudes and SF cells. In addition, the quantification revealed a significant match
(81%) between stress hot spots and SF cell localization (Figure 7G). Whereas not every stress
fiber transmitted detectable forces, overall hot spot formation was associated significantly
with SF cell formation.Cells 2021, 10, x FOR PEER REVIEW 14 of 22
To finally prove the functional link between SF cells and contractility-driven BM
Cells 2021, 10, 1979 14 of 22
stress, we pharmacologically inhibited myosin II activity in invasion-triggered breast
acini. Untreated acini exerted high-force amplitudes after 4.5 h, while myosin inhibition
led to a complete loss of substrate deformation, with residual strain energy levels that
were Towithin
finallythe limits
prove theoffunctional
background linknoise. Most
between SFimportantly, the absence of force
cells and contractility-driven BM
accompanied the lack of SF cells (Figures 7H,I and S4B).
stress, we pharmacologically inhibited myosin II activity in invasion-triggered breast acini.
Together,
Untreated aciniour results
exerted functionally
high-force link theafter
amplitudes EGF-4.5and stiffness-induced
h, while myosin inhibitionswitch
ledfrom
to a
MS to SF cells
complete with
loss of cell contractility.
substrate deformation, At with
the acinus–BM–ECM interface,
residual strain energy levelsthese
that forces cause
were within
mechanical
the limits ofBM stress thatnoise.
background finally contributes
Most to thethe
importantly, invasive
absencetransition of benign breast
of force accompanied the
cells.
lack of SF cells (Figure 7H,I and Figure S4B).
Figure 7. SF cells of invasion-triggered breast acini exert force hot spots on the acinus–BM–ECM interface. TFM image
Figure 7. SF cells of invasion-triggered breast acini exert force hot spots on the acinus–BM–ECM interface. TFM image
sequences show mechanical stress at the BM–substrate interface exerted by MCF10A/RFP-LifeAct acini (ld-BM, +EGF) on
sequences
12 show mechanical
kPa substrates stressConfocal
over time. (A,B) at the BM–substrate
images of theinterface
acinus–ECMexerted by MCF10A/RFP-LifeAct
interface representing the actinacini (ld-BM, +EGF)
cytoskeleton. (C,D)
on 12 kPa substrates over time. (A,B) Confocal images of the acinus–ECM interface representing
Matching stress maps (linear lookup table for pseudo-color display) used to calculate total strain energy within the actin cytoskeleton.
the field
(C,D)
of viewMatching
(indicatedstress maps numbers
by white (linear lookup table for
in (C,D,H)). SFpseudo-color display)
cells were marked used to (magenta).
manually calculate total
Thestrain
stressenergy
map atwithin
one hourthe
fieldExample
for of view 1(indicated
is providedby white numbers in (C,D,H)).
in Supplementary Figure S4A.SF cells
(E,F)were
Hot marked
spots (hs) manually
in stress(magenta).
maps (lightThe stress
blue map atwere
patches) one
segmented automatically
hour for Example and counted
1 is provided for the spatial
in Supplementary correlation
Figure with
S4A. (E,F) SFspots
Hot cells. (hs)
(G) The representative
in stress maps (lightimage illustrates
blue patches) the
were
counting procedure and the quantitative result of hot spots and stress coherence (in total 292 hot spots
segmented automatically and counted for the spatial correlation with SF cells. (G) The representative image illustrates the of four independent
analyzed acini (30 images)).
counting procedure Hs segmentation
and the quantitative result(light
of hotblue
spotspatches) andcoherence
and stress counting (in(green
totaland
292 red
hot numbers)
spots of fourwasindependent
carried out
every two hours for each acinus within a measuring period of 18–20 h. The localization of 237 hot spots matched with SF
analyzed acini (30 images)). Hs segmentation (light blue patches) and counting (green and red numbers) was carried out
cells (green numbers), and 55 did not (red numbers). For a further example of matching hot spots with SF, see
every two hours for each acinus within a measuring period of 18–20 h. The localization of 237 hot spots matched with SF
Supplementary Figure S4C. (H) Representative acinus with MS cell treated with blebbistatin (25 μM). Left: actin
cells (green numbers),
cytoskeleton, right: TFMand stress
55 did map
not (red
(fornumbers).
additional For a further
time example
points, of matching hot
see Supplementary spots with
Figure S4B).SF,
(I)see Supplementary
Calculated strain
Figure S4C.
energies (SE)(H)
of Representative
acini treated with acinus with MScompared
blebbistatin cell treated towith blebbistatin
untreated samples.(25The
µM). Left:shows
graph actin cytoskeleton,
the SE valuesright: TFM
measured
stressamap
over (forof
period additional time points,
18-20 h (images weresee Supplementary
taken every sevenFigure S4B).Bars
minutes). (I) Calculated
show median strain energies
with (SE) of aciniinterval;
95% confidence treated
with blebbistatin
Untreated compared
acini: median SEto= untreated samples.
32 fJ (n = 4, in total The
554 graph
images); shows the SE values
Blebbistatin measured
treated over a period
acini: median SE = 1.4offJ18–20 h (images
(n = 4, in total
were taken every seven minutes). Bars show median with 95% confidence interval; Untreated acini: median SE = 32 fJ (n = 4,
in total 554 images); Blebbistatin treated acini: median SE = 1.4 fJ (n = 4, in total 429 images); DMSO control (not shown):
median SE = 45 fJ (n = 3, in total 438 images). Mann–Whitney U-test with: **** = p < 0.0001. Scale bars: 20 µm. For complete
image series of the actin dynamics, see Supplementary Movies S6 and S7.You can also read