Alps 2 Ocean Cycle Trail Visitor Survey 2020 - Lena Mkwara David Simmons Geoffrey Kerr November 2020 - Research ...
←
→
Page content transcription
If your browser does not render page correctly, please read the page content below
LEAP Research Report
No. 52

Alps 2 Ocean Cycle Trail
Visitor Survey 2020

Lena Mkwara
David Simmons
Geoffrey Kerr

November 2020
Alps 2 Ocean Cycle Trail Visitor
 Survey 2020

 Lena Mkwara
 David Simmons
 Geoffrey Kerr

 Land Environment and People Research Report
 Report No. 52

 November 2020
 ISSN 1172-0859 (Print)
 ISSN 1172-0891 (PDF)
 ISBN 978-0-86476-452-2 (Print)
 ISBN 978-0-86476-455-3 (PDF)

 Lincoln University, Canterbury, New Zealand
Abstract
This report presents the findings from a 2020 survey of Alps 2 Ocean Cycle Trail (A2O)
cyclists. COVID-19 cancelled fieldwork before data collection was complete. The limited data
indicate that cyclists are extremely satisfied with the A2O and associated services, and make
substantial expenditures associated with their ride. The A2O was a strong attractant to cyclists,
the large majority of whom would not have visited the districts in the absence of the trail.

Keywords
A2O Cycle Trail, tourist attractions, tourism spending, economic attribution model,
Mackenzie District, Waitaki District

Acknowledgements
This project benefitted immensely from the contributions of others. We wish to thank the
following people for their generosity and assistance. Waitaki District Council, Tourism
Waitaki and Cycle Journeys for their guidance and support. Accommodation providers and
visitor centre operators who assisted with the distribution of survey cards. Lincoln University
colleagues who peer reviewed the survey instrument. Dr Sally Driml, University of
Queensland, for peer review of the survey instrument and the economic attribution model. Dr
Yvonne Mathews, University of Waikato/Waikato Regional Council, for structuring the
interactive mapping inputs. Dr Bentry Mkwara for GIS mapping assistance. Kathy Kise and
Yifan Cheng for fieldwork assistance. The project was funded by the Lincoln University
Centre of Excellence, Sustainable Tourism for Regions Landscapes and Communities.

 2
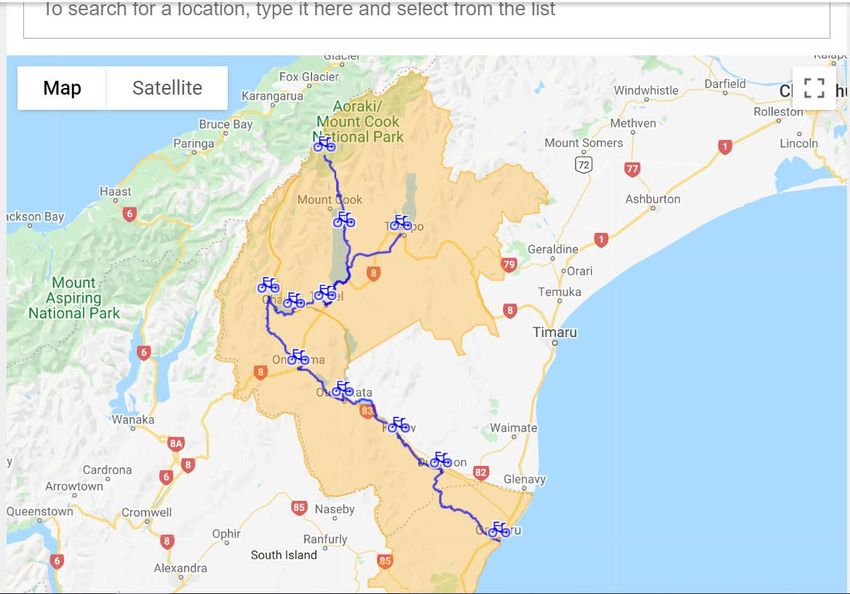
Table of Contents

Executive Summary ..............................................................................................................iv
1 Introduction ................................................................................................................... 5
2 Objectives ..................................................................................................................... 7
3 Methodology.................................................................................................................. 7
 3.1 Survey design ......................................................................................................... 7
 3.2 Sampling design ..................................................................................................... 8
 3.3 Data collection ........................................................................................................ 9
 3.4 Methods of data analysis ...................................................................................... 14
 3.4.1 Economic attribution model ............................................................................ 14
 3.1 A2O tourist attraction associated spending ........................................................... 18
4 Results ........................................................................................................................ 20
 4.1 Responses and data preparation .......................................................................... 20
 4.2 User profiles.......................................................................................................... 21
 4.3 A2O activity........................................................................................................... 25
 4.4 A2O ride ............................................................................................................... 30
 4.5 A2O logistics ......................................................................................................... 43
 4.6 Satisfaction with perceived quality of the A2O experience .................................... 45
 4.7 Cyclist expenditure attributable to the A2O ........................................................... 52
5 Conclusions and recommendation .............................................................................. 55
References ......................................................................................................................... 56
Appendix 1: The A2O questionnaire.................................................................................... 57
Appendix 2: Accommodation providers survey briefing ....................................................... 75
Appendix 3: What cyclist enjoyed the most and suggested areas of improvement .............. 76

 i
List of Figures

Figure 1: The A2O Cycle Trail ............................................................................................... 6
Figure 2: A2O cyclists’ sub-groups ........................................................................................ 8
Figure 3: A2O monthly use by cyclists .................................................................................. 8
Figure 4: Survey invitation intercept sites ............................................................................ 10
Figure 5: Fieldwork key milestones ..................................................................................... 14
Figure 6: Spending categories ............................................................................................ 16
Figure 7: Spending in the area of A2O ................................................................................ 18
Figure 8: Age (n=122) ......................................................................................................... 21
Figure 9: Gender and country of residence ......................................................................... 21
Figure 10: New Zealand cyclists’ home locations ................................................................ 22
Figure 11: Home locations .................................................................................................. 23
Figure 12: Overseas A2O cyclists (n=63) ............................................................................ 24
Figure 13: Where overseas respondents started their trip in New Zealand (n=63) .............. 24
Figure 14: Reasons for using A2O (n=150) ......................................................................... 25
Figure 15: Importance of A2O for visit (n=149).................................................................... 25
Figure 16: The importance of the A2O visit (n=145) ............................................................ 26
Figure 17: What they would have done instead (n=84) ....................................................... 27
Figure 18: Your travel route on the A2O .............................................................................. 30
Figure 19: Where cyclists started the A2O ride ................................................................... 31
Figure 20: Where cyclists finished the A2O ride .................................................................. 32
Figure 21: Cyclists’ stop points............................................................................................ 33
Figure 22: Percentage of respondents completing each section ......................................... 35
Figure 23: Partly completed sections and percentage of respondents................................. 36
Figure 24: Did not do this section(s) .................................................................................... 37
Figure 25: Number of A2O Sections completed (n=140) ..................................................... 38
Figure 26: Number of nights in the area before riding the A2O (n=145) .............................. 39
Figure 27: Nights in the area during A2O ride (n=144) ........................................................ 40
Figure 28: Nights in the area after A2O ride (n=144) ........................................................... 41
Figure 29: Total nights in the area of A2O (n=145).............................................................. 42
Figure 30: Type of support from tour operators (n=134) ...................................................... 43
Figure 31: Type of support by level of support..................................................................... 43
Figure 32: Type of bike (n=137) .......................................................................................... 44
Figure 33: Type of accommodation ..................................................................................... 44
Figure 34: Satisfaction with trail information ........................................................................ 45
Figure 35: Satisfaction with A2O services ........................................................................... 46
Figure 36: Satisfaction with A2O conditions ........................................................................ 47
Figure 37: Satisfaction with your experience of the A2O (n=135) ........................................ 48
Figure 38: Likelihood of recommending the A2O (n=135) ................................................... 48
Figure 39: How cyclists heard about A2O ........................................................................... 49
Figure 40: What cyclists enjoyed the most .......................................................................... 50
Figure 41: Suggested areas of improvement....................................................................... 51

 ii
List of Tables

Table 1: Accommodation providers and visitor centres ....................................................... 12
Table 2: Survey response ................................................................................................... 20
Table 3: Cycle trails that respondents would have cycled if the A2O did not exist ............... 28
Table 4: Commercial activities ............................................................................................ 29
Table 5: Cultural or historic sites ......................................................................................... 29
Table 6: Leisure and recreation sites or activities ................................................................ 29
Table 7: Number of respondents riding each A2O Section .................................................. 34
Table 8: Number of sections completed .............................................................................. 38
Table 9: Time on the trail .................................................................................................... 39
Table 10: Nights after ride ................................................................................................... 41
Table 11: Total nights in the A2O area ................................................................................ 42
Table 12: Respondents’ rating of A2O information .............................................................. 45
Table 13: Respondents’ satisfaction with A2O services ...................................................... 46
Table 14: Respondents’ rating of the A2O conditions .......................................................... 47
Table 15: Other sources of information about the A2O........................................................ 49
Table 16: Total spending/cyclist/visit (NZ$) ......................................................................... 52
Table 17: Average A2O associated spending for partly supported sub-samples (NZ$) ....... 52
Table 18: Partly supported cyclists spending/cyclist/visit (NZ$) ........................................... 53
Table 19: Weighted average spending/cyclist/visit (NZ$) (95% CI) ..................................... 54

 iii
Executive Summary
This report presents the results of a survey of A2O cyclists carried out from January to March
2020. The main objective was to describe cyclists’ use, and to estimate spending attributable
to the A2O, and its economic significance to the local economies. This research was part of a
broader project aimed at assessing the impact and effectiveness of different forms of public
investment in visitor attractions on local and regional economic development involving four
key tourist attractions in the Waitaki and Mackenzie Districts. COVID-19 cancelled fieldwork
before data collection was complete.

Findings indicate that the A2O is a very important regional attraction for cyclists; with 56% of
respondents would not have visited without the A2O. Cyclists are extremely satisfied with the
A2O and associated services, and make substantial expenditures associated with their ride.

Three related measures of spending are assessed. (i) A2O associated spending: All
spending by cyclists over the time spent in the area of A2O. (ii) A2O attributed spending,
which is closely dependent on the A2O. (iii) A2O substitutable spending: This is all spending
by a subset of cyclists who would not have travelled to the Waitaki/Mackenzie area if the
opportunity to visit the A2O was not available.

The average A2O associated spending per cyclist per visit was $2,723 for fully supported
cyclists, $1,766 for partly supported cyclists, and $594 for independent cyclists. Differences
are statistically significant. Assuming 20,000 annual A2O cyclists, A2O annual associated
spending is about $27.0m, which is about 6% of total tourism spending for the Waitaki and
Mackenzie districts combined.

The only group with sufficient data to analyse attributed spending was partly supported
cyclists. Per-capita A2O attributed spending is very similar to A2O associated spending and
A2O substitutable spending. Nearly all partly supported cyclists (96%) were members of the
A2O attributed spending category, demonstrating that the A2O is a very important attraction
for this group. Two thirds of cyclists were in the A2O substitutable spending group. The
absence of the trail, could lead to substantial loss in spending to the A2O area for this group.

Our results support further investigation of tourist spending attributable to different attractions.
This kind of research would help in generating new knowledge for guiding councils and central
government in identifying the right mix of tourist projects and initiatives to promote, support
and invest in.

 iv
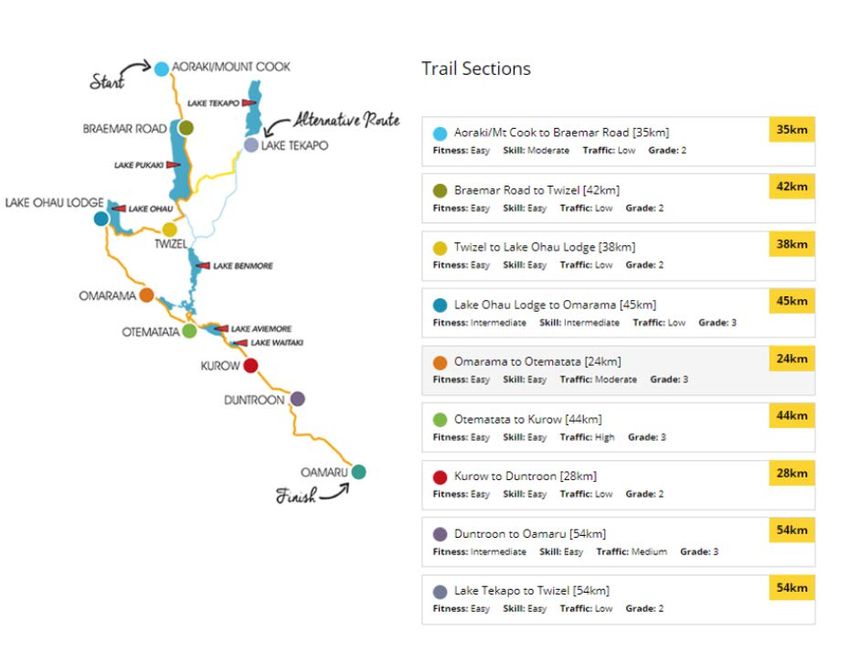
1 Introduction
The Alps 2 Ocean Cycle Trail (A2O) is New Zealand’s longest continuous cycle trail. It stretches over
300 km from Aoraki/Mt Cook Village, passes through the Mackenzie Basin and down the Waitaki
Valley, and ends by the Pacific Ocean in Oamaru 1. The trail passes through a variety of landscapes
including the Southern Alps, hydro lakes and dams, high country sheep stations, cattle and dairy
farms and wineries. It crosses both public and private land. The A2O is owned jointly by Waitaki
District Council and Mackenzie District Council. Tourism Waitaki is responsible for its management,
marketing and operations. A project team made up of members from both councils, Tourism Waitaki
and the Department of Conservation (DOC) is responsible for trail construction (Wilson, 2016).

The trail is divided into 9 sections with two starting points, at Aoraki/Mount Cook and an alternative at
Lake Tekapo (Figure 1). The riding options for a full trail ride (typically 8 sections) include relaxed (8
days), classic (6 days), or fast (4 days) itineraries 2. Settlements located along the trail, including
Tekapo, Twizel, Omarama, Otematata, Kurow, Duntroon and Oamaru, offer a range of visitor
services, including accommodation and food.

The A2O was one of the first of the 23 trails funded as part of Nga Haerenga, the New Zealand Cycle
Trail (NZCT) project that funded the establishment of a series of “Great Rides” across the country.
“The NZCT was one of a number of initiatives established to stimulate jobs to cushion the effects of
the global financial crisis in 2009, and to create conditions for businesses to prosper” (MBIE, 2016,
p.12). The A2O was officially opened in December 2013.

Bicycle tourism and trail tourism contribute significantly to local, regional and national economies, as
well as internationally. A 2016 evaluation study found that around 1.3 million people used the Great
Rides of Nga Haerenga, the New Zealand Cycle Trail in 2015, generating an estimated $37.4 million
for local communities (MBIE, 2016). In the United States of America (USA), bicycle tourism is
estimated to contribute $83 billion annually to the economy. Studies carried out in the United Kingdom
and Canada seem to suggest that bicycle tourists tend to spend more per head per trip than other
types of tourists (Adventure Cycling Association, 2020).

There is anecdotal evidence that many communities along the A2O route have benefitted from a
number of new businesses and existing business revitalisation. A previous research project,
investigating change in Otematata, found that the A2O is perceived to be a welcome initiative to a
small community struggling with both population and economic decline (Wilson & Mackay, 2015).
During the 2015/16 season, it was estimated that the A2O users’ (cyclist and non-cyclists) guest
nights exceeded 1 million. With an estimated average spend of $260 per night per guest, this equates
to over $260 million annual spending for Waitaki and Mackenzie districts combined (Waitaki District
Council, 2017).

However, there are data gaps related to use and spending by A2O cyclists. Counters are available
on some sections of the trail and provide crude estimates of use. However, the accuracy of the data
is questionable due to the possibility of double counting, particularly for single day users who might
pass sections of the trail twice during their ride. Spending by A2O cyclists is unknown. A need for
more data on trail spending and reliable trail count data was highlighted in the 2016 New Zealand
Cycle Trail evaluation reports (MBIE, 2016).

1
 https://www.alps2ocean.com/
2
 https://www.alps2ocean.com/choose-your-itinerary

 5
The 2015/2016 A2O user survey by Wilson (2016), targeting cyclists and all other users, provides a
useful start into this investigation. However, Wilson did not collect detailed spending data, and use
may have changed over time. The Waitaki District Council undertakes some regular spot sampling of
A2O users and provides some data on trail use. However, extrapolating these data to annual use is
limited by the small samples.

This report presents the results of a survey of A2O cyclists carried out from January to March 2020.
It was designed to capture the level of A2O use by different types of cyclists and detailed information
on spending in the area.

This survey was part of a broader project aimed at assessing the impact and effectiveness of different
forms of public investment in visitor attractions on local and regional economic development involving
four key tourist attractions in the Waitaki and Mackenzie Districts. These are:

 • Alps 2 Ocean Cycle Trail
 • The Waitaki Whitestone Geopark
 • The Oamaru Blue Penguin Colony
 • The Dark Sky Project (Tekapo)

Figure 1: The A2O Cycle Trail

Source: https://www.alps2ocean.com/trail-map

 6
2 Objectives
The aims of this research were three-fold.
 (i) To assess spatial use patterns and flows of A2O cyclists.
 (ii) To assess spending attributable to the A2O and its economic significance to the local
 economies.
 (iii) To collect reliable information on use by different groups of cyclists to help interpret data from
 the A2O trail counters.

3 Methodology
This section outlines methods used, including survey design, data collection and data analysis.

3.1 Survey design
An online survey was adopted to enable collection of data from a large number of A2O users. It also
allowed more in-depth questioning than field intercepts and was considered more cost-effective. The
survey was developed based on previous practice, including:
 • an on-going A2O survey undertaken as part of the wider New Zealand Cycle Trail (NZCT)
 surveys,
 • the 2015/2016 A2O user survey by Wilson (2016),
 • a cycle trail user survey by the Central Otago District Council (2015) ,and
 • the Queensland national park tourist expenditure survey by Driml, Brown, Ballantyne, Pegg,
 and Scott (2011).

The online survey included questions on user profiles, A2O use and experiences, and the importance
of the trail to travel decisions, logistics and spending. The economic component of the questionnaire
included a request for respondents to indicate how much money they had spent on package holidays
as well as their spending in the area (delineated by a map) on: travel; accommodation; food and
drinks; activities and trips; other (equipment, souvenirs etc.). Respondents were asked to specify
whether their answers were for themselves or their group, and the time period they applied to.
Questions mirrored the classification of tourism characteristic industries and tourism related industries
defined in the New Zealand Tourism Satellite Account (TSA) 3. The online questionnaire used
Qualtrics software. The full survey appears in Appendix 1. The Lincoln University Human Subjects
Ethics Committee approved the survey.

3
 https://www.stats.govt.nz/information-releases/tourism-satellite-account-2018

 7
3.2 Sampling design
It was anticipated that trail use and spending by cyclists might vary for sub-groups e.g. overseas
versus New Zealand residents, fully/partly supported by an operator versus independent and multi-
day/single day users (Figure 2).

Figure 2: A2O cyclists’ sub-groups

 A2O Cyclists aged 16 years +

 New
 Overseas
 Zealand

 Fully guided Partly supported Independent Fully guided Partly supported Independent

 Multi- Single Multi- Single Multi- Single Multi- Single Multi- Single Multi- Single
 day day day day day day day day day day day day

Previous research on tourism expenditure suggests that random sampling with minimum samples of
30 to 40 participants for each subgroup of interest may meet the criteria for within-group
representativeness (e.g. Driml et al., 2011). This would require a minimum sample of 480 cyclists if
cyclists were evenly distributed across sub-groups. Estimates of the proportion of A2O cyclists falling
within each group are unavailable. Due to these limitations, it was difficult to design an appropriate
sampling frame. Therefore, we aimed at inviting as many cyclists as possible to complete the survey.

The A2O trail counter data show daily numbers for cyclists, which are aggregated to estimate
monthly/annual use (Figure 3).

Figure 3: A2O monthly use by cyclists

 Annual use:
 36,629 in 2019
 26,812 in 2018 (Feb-Dec)
 6000
 5000
 Number of cyclists

 4000
 3000
 2000
 1000
 0
 Jan Feb Mar Apr May Jun Jul Aug Sep Oct Nov Dec
 2018 2168 4381 3772 1245 874 1062 1106 1348 3063 3459 4334
 2019 4005 4197 5573 4712 1633 1297 1054 1173 1647 2762 3788 4788
 2020 4555 4524 4888 4201

Data source: Waitaki District Council

 8
Estimates of use were 36,629 in 2019 and 26,812 in 2018 (February to December), but there are
limitations in using these numbers as benchmarks.
 • One caveat is the possibility of double counting of users who pass trail counters two or more
 times.
 • Trail counters do not provide details on the proportion of cyclists who fall within each sub-
 group.

3.3 Data collection
Respondents were invited to participate in the online survey through (i) trail intercepts and (ii) survey
invitation cards distributed by selected accommodation providers and visitor centres along the trail.
The primary purpose of the intercept approach was to capture riders who did not stay at commercial
accommodation.

Survey invitation through intercepts
A2O cyclists were intercepted at selected sites and briefed about the online survey prior to a request
to provide their email address for online survey distribution. Assurance was given that participation in
both the intercept survey and the subsequent online survey was voluntary, and that completing the
survey and providing an email address did not in any way obligate them to complete the online survey.

The survey invitations were distributed for a total of seven days (2 days in January and 5 days
between February and March. Three more survey invitation days were planned for March and April
(over Easter holiday), but were not carried out due to COVID-19. Selection of survey invitation
intercept sites was informed by stakeholder consultation, trail counter data, and preliminary field
observations. The sites were selected for convenience of access, and at points where cyclists were
expected to stop (i.e., near toilets and picnic tables, at significant barriers/gates and at scenic
viewpoints). The majority of survey invitations were distributed at Oamaru Harbour (at the end of the
A2O), Lake Ohau, Ohau Weir, Lake Pukaki, Quailburn (enroute to Clay Cliffs), and the Kurow-
Duntroon area (Figure 4). Field experience showed that it was not always possible to predict the times
when a particular site might be busy. The length of time survey distributors spent at each site varied
considerably. In-field adjustments were made continuously, conditioned on the number of cyclists
encountered. Figure 4 shows the survey invitation intercept sites and the number of intercepts at each
site.

 9
Figure 4: Survey invitation intercept sites

 10
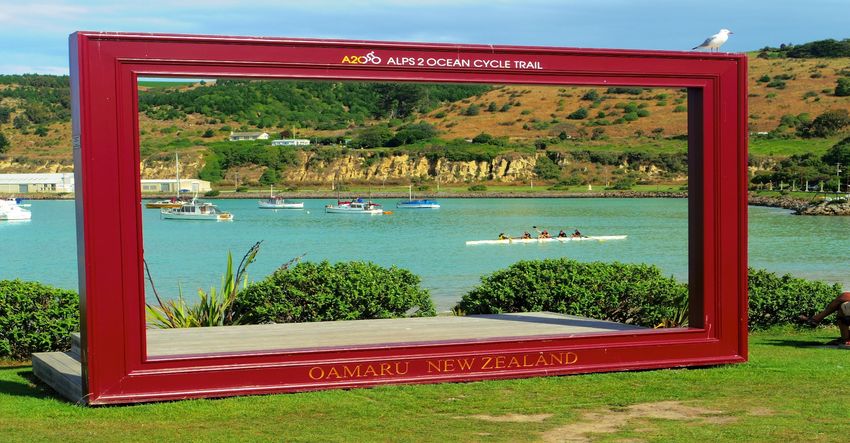
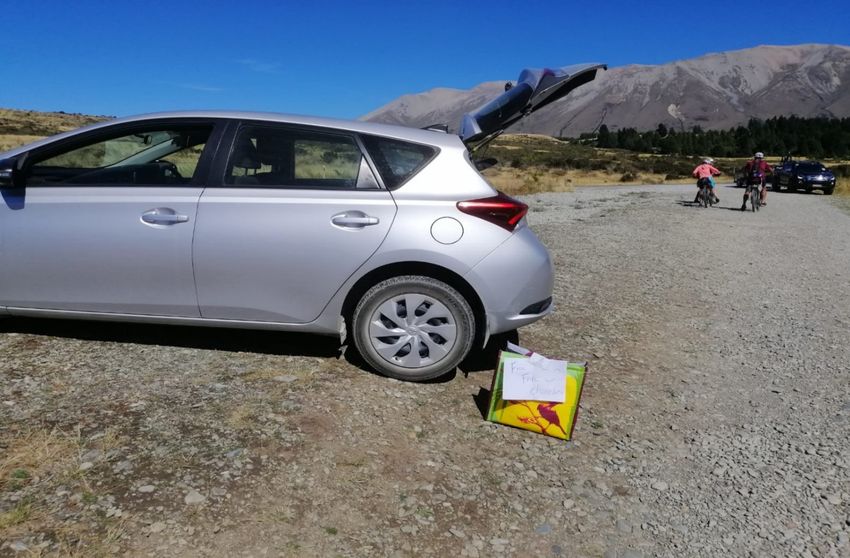
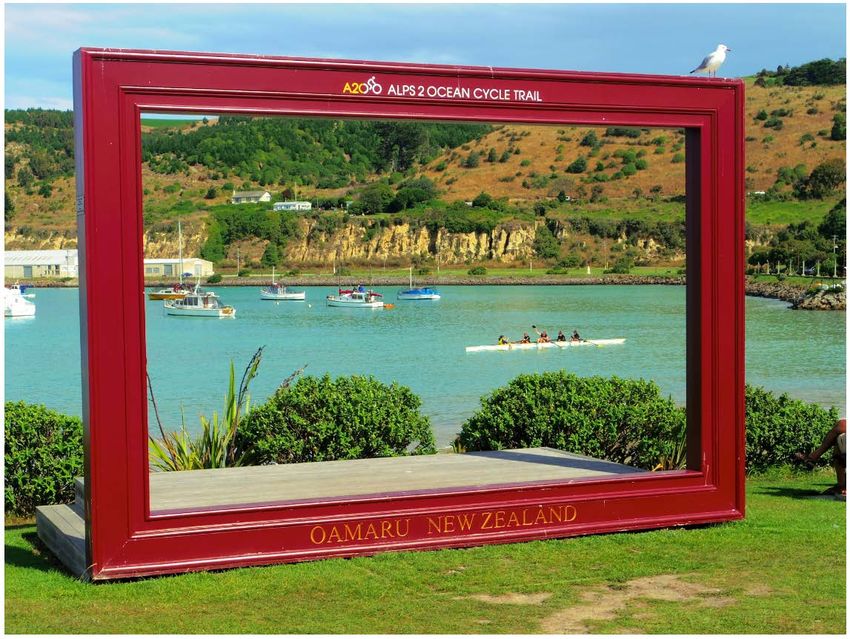
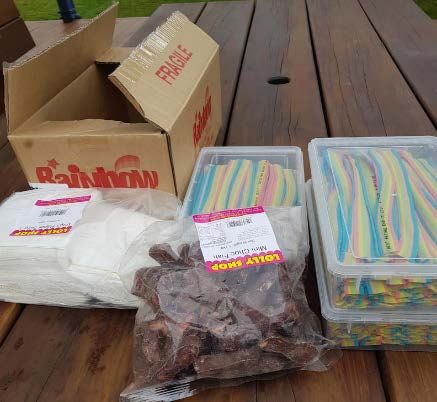
Intercepts at Lake Ohau (with our sign saying “free chocolate fish”)

Finishing point – Oamaru Harbour: This is a place where A2O users take a finishing selfie. It also
a chance to increase marketing of the ride on social media

 11
Survey invitation card distribution by accommodation providers
Personal communication from Cycle Journeys indicated that about 90% of multi-day cyclists in the
upper part of the A2O spent their first night at Lake Ohau Lodge. In the lower part of the A2O, about
90% of A2O cyclists spent a night in the Kurow-Duntroon area. To target these cyclists, 17
accommodation providers, 2 visitor centres and a winery agreed to distribute the survey invitation
cards to their customers (Table 1).

Table 1: Accommodation providers and visitor centres
 Accommodation providers Location
 Duntroon Hotel Duntroon
 Kowhai Cottage Duntroon
 Duntroon Domain Camping Duntroon
 Dansey's Pass Motor Camp Duntroon
 Constable's Cottage B&B Duntroon
 Father Ted's/Duntroon Railway B&B Duntroon
 Kurow Holiday Park Kurow
 Kurow Motels Kurow
 Settlement View Apartment Kurow
 Riverside B&B Kurow
 Western House Kurow
 Waitaki Braids Lodge Kurow
 Valley View Glamping Kurow
 Good Life Apartment Kurow
 Sublime B&B Kurow
 Lake Ohau Lodge Ohau
 The Lakes Motel Twizel
 Visitor centres and winery
 Vanished World Centre Duntroon
 Kurow Museum & Information Centre Kurow
 River-T Winery Kurow

 12
Briefing accommodation providers and visitor centres about the
survey occurred in December 2019 to mid-January 2020.
Initially, to avoid disruptions to business operations, survey
invitation cards were to be distributed to customers for only
eight days across the summer season over selected sampling
times and days (Appendix 2). Experience showed that this
approach was restrictive because some accommodation
providers did not have customers on their sampling days. By
the end of January, providers agreed to distribute survey
invitation cards any time they had customers.

To incentivise participation, accommodation providers received
bottles of wine, one lucky survey respondent got e-gift
vouchers, and confectionery was supplied to cyclists.

 Incentives:
 Bottles of wine for Prize draws of $250 e-gift Chocolate fish & rainbow
 accommodation providers voucher at Kathmandu for sweets for cyclists
 respondents

Further follow-up showed that Airbnb personally gave out survey cards to their customers. For many
other types of accommodation providers, survey cards were left in the rooms or counter and cyclists
could pick one if they were willing to assist with the survey. At visitor centres, cyclist willing to take
part in the survey were invited to pick survey cards at the information desk.

 13
Fieldwork key milestones
Fieldwork commenced in January 2020 and was expected to conclude in April 2020. However, it was
discontinued on 2nd March 2020 due to COVID-19. Fieldwork key milestones are presented in Figure
5.

Figure 5: Fieldwork key milestones

3.4 Methods of data analysis
Descriptive statistics report means, deviations, frequencies and percentages. For categorical data,
Chi-squared tests of the hypothesis of differences between various groups of cyclists were carried
out. For continuous or ordinal data, normality tests were carried out objectively using a Shapiro-Wilk
test, as well as subjectively by observing histograms and box plot outputs in Stata and R console. T-
tests evaluated the significance of differences between group means. Where the assumption of
normality was not met, the Kolmogorov–Smirnov (K-S) test was applied instead of the t-test. Mapping
of cyclists’ home origins, sections completed, start and ends of their A2O ride was carried out using
Geographic Information System (GIS). Sensitivity analysis of estimates of tourist expenditure was
carried out using Monte Carlo simulation in R console.

3.4.1 Economic attribution model
In cases where there is more than one key tourist attraction, it can be valuable to assess the level of
tourist spending that is directly attributable to specific tourist attractions. An economic attribution
model gauged the importance of the A2O as a tourist attraction and the level of spending that is
attributable to it. There are limited studies in this subject area. This project adapted the attribution
model applied by Driml et al. (2011) to assess the economic significance of National Park tourism in
Queensland, Australia.

Tourist attraction associated expenditure: The approach taken here recognises spending by all
A2O cyclists as a starting point, which we term “tourist attraction associated expenditure”. This
measure does not gauge the impact on expenditure of the importance of an attraction to visitors (Driml
et al., 2011), which is addressed by attribution and substitution expenditure estimates (e.g.Carlsen &
Wood, 2004; Driml et al., 2011; Stoeckl, Smith, Newsome, & Lee, 2005).

Attribution expenditure: This is the proportion of all direct spending by tourists to a
region/state/country that can be attributed to a specific attraction (Carlsen & Wood, 2004; Jones &
Wood, 2008). Typically, researchers use a range of motivational, behavioural and importance
measures from surveys to estimate the proportion of spending that is directly attributable to a specific

 14
tourist attraction. For instance, Carlsen and Wood (2004) report the following findings from the
Southern Forest region in Australia, which they used to estimate attribution:
 • 80% of respondents reported that ‘natural environments’ were the number one reason for
 visiting the region;
 • 90% of activities undertaken were nature-based;
 • 95% of visitors ranked forests as ‘important’ in attracting them to the region.
They conclude that 88% (an average of the three variables) of visitor expenditure is attributable to the
national parks and forests in the study area.

However, a concern with this approach is that while a visitor’s choice of a particular tourist activity and
spending could be highly motivated by the existence of a tourist attraction, it does not always follow
that that visitor would not have undertaken some other activity (and its associated spending) in that
same region, in the absence of an attraction (Carlsen & Wood, 2004). For example, in the absence
of the A2O, some cyclists may still opt for other cycle trails in the Waitaki/Mackenzie area.

Substitution expenditure: Some studies have focused on identifying additional expenditure in a
region due to an attraction. That is, the expenditure that would not have occurred in the study area if
the opportunity to visit the attraction did not exist. This component has been termed the “substitution”
effect (Carlsen & Wood, 2004). Substitution expenditure is identified using information from visitors
on whether they would have made their visit to the region if the attraction did not exist

Our approach recognises all spending by cyclists over the time spent in the area of A2O, which we
term “A2O associated spending”. We also define and estimate variations of the attribution and
substitution effects, which we term “A2O attributed spending” and “A2O substitutable spending”,
respectively.

A2O attributed spending: This component of spending is defined as all spending by cyclists who
stated that the A2O was “very important” to their travel and spending decisions. It captures spending
that is closely dependent on the A2O as an attraction to the region. We asked several questions about
the significance of the A2O to cyclists’ travel decisions and preferences and used this information to
define A2O attributed spending by respondents who met at least one of the criteria below:

Inclusion criterion 1
Cyclists for whom the A2O was the only or main reason for visiting the Waitaki /Mackenzie area
(Appendix 1, question 9)
Inclusion criterion 2
Cyclists who indicated that the importance of the A2O to their trip was 70% or greater (Appendix 1,
question 10)

A2O substitutable spending: This is all spending by a subset of cyclists who answered that they
would not have travelled to the Waitaki or Mackenzie area if the opportunity to visit the A2O was not
available. A2O substitutable spending is unambiguously due to the A2O. This component of
expenditure is based on a hypothetical scenario of the A2O not being open to cyclists at the time of
their travel to the area (Appendix 1; questions 11 and 12). Respondents in this category stated that
they would have:
 (i) Stayed at home;
 (ii) Cycled/walked other cycle trails outside the Waitaki/Mackenzie area;
 (iii) Travelled outside the Waitaki/Mackenzie area for other activities/attractions or
 (iv) Travelled to another country

 15
Steps used in this analysis
Our approach takes into account differences in spending by individuals in each category. The steps
followed are outlined in Steps 1 to 4 below.

Step 1: Identify spend for each individual
Step 2: Identify each individual’s spending-generation category
All respondents’ fall within A2O associated spending category. A subset of respondents who meet
the criteria for A2O attributed spending category are identified. Likewise, a subset of A2O attributed
cyclists who meet the criteria for A2O substitutable spending category are identified, as illustrated in
Figure 6.

Figure 6: Spending categories

 A2O associated
 spending

 A2O attributed
 Other
 spending

 A2O substitutable
 Other
 spending

 16
Step 3: Calculate the mean and variance of spend for relevant groups
Average A2O associated spending is;

 �∑ =1 �
 2 / / = = (1)

where, is the number of people in respondent ′ travel party (aged at least 16 years) with
whom expenses were shared and is the number of cyclists who provided information on money
spend in the area

 �∑ =1 �
 2 / / = = (2)

Where, includes only cyclists in the A2O attributed spending category

 �∑
 =1
 �
 2 / / = = (3)

Where, includes only cyclists in the A2O substitutable spending category and
 ≤ ≤

Step 4: Aggregate over groups to find total expenditure in each category

(i) Annual estimates of A2O associated spending
 2 = × (4)
Where is the annual number of users.

(ii) Annual estimates of A2O attributed spending
 2 = × × (5)

Where is the proportion of cyclists in the attributed spending category.

(iii) Annual estimates of A2O substitutable spending
 2 = × × (6)
Where is the proportion of cyclists in the substitutable spending category.

 17
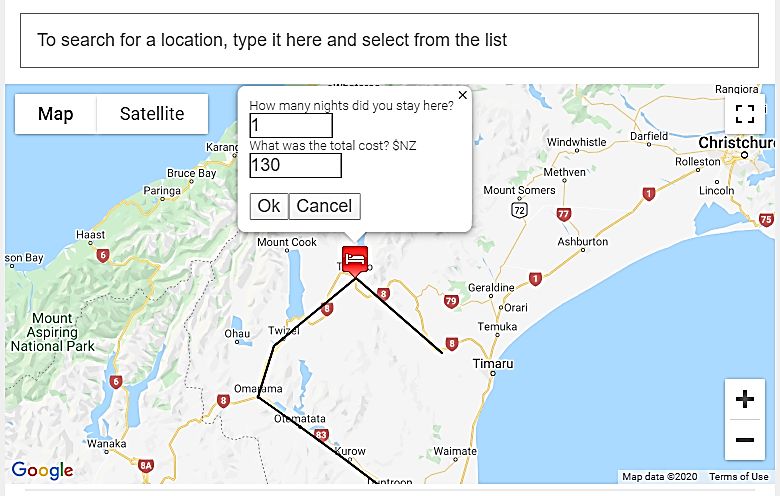
3.1 A2O tourist attraction associated spending
The interactive mapping feature (Figure 7) enabled respondents to provide detailed information on
spending along their travel route by placing markers of their purchases. Those on a tour package
were asked how much they paid for their package and what this package constituted. Package tourists
were also asked if they had spent any money additional to the tour package, which they recorded on
the map.

Feedback showed that the interactive map was too demanding for respondents, so it was removed.
Instead, respondents were asked to report their expenditures on named categories at each major
town along the trail (Appendix 1, questions 39 and 40). Fifteen respondents provided detailed
expenditure using the interactive maps and the rest used the latter approach. The expenditure data
reported here combine information from both approaches.

Figure 7: Spending in the area of A2O

 18
19
4 Results
4.1 Responses and data preparation
In total, 121 cyclists were intercepted over two collection periods:
 • Two days of sampling in January (8 and13 January) (n=21)
 • Five days (26 February to 2 March) (n=100)
Out of these, 62 respondents completed the survey, a response rate of 51%. This response rate is
slightly lower than previous surveys using a similar approach. Wilson (2016) obtained a response rate
of 61% (95% were A2O riders and 5% were non-riders), and Angus & Associates (2013) reported
response rates in the range of 60 -71% for surveys on four other cycle trails.

A total of 88 usable responses came from people recruited through survey invitation cards distributed
through accommodation providers and visitor centres. It was not possible to ascertain the response
rate from survey invitation cards since the total number of cards distributed is unknown.
Accommodation providers and visitor centres were not asked to record the total number of cards
distributed to their customers to avoid overburdening them. Altogether, 150 usable responses were
obtained from the online survey (Table 2).

Table 2: Survey response
 Group Invitations Response Response rate As % of total responses

 Intercepted
 121 emails 62 51% 41%
 cyclists

 Unknown
 Accommodation number of
 88 Not known 59%
 users survey invitation
 cards

 Total 150 100%

Survey data for the two groups were combined, checked for irregularities, coded for analysis, and
uploaded into Stata Version 14.2, R console and Microsoft Excel for quantitative analysis.

 20
4.2 User profiles
Age
Overall, 82.8% (n=101) of respondents were aged at least 50 years (Figure 8). A similar A2O survey
by Wilson (2016), reported 68.1% of respondents aged between 50 and 69 years, very similar to the
65.6% in this group in our survey (n=80).
Figure 8: Age (n=122)

 30.0
 26.2
 25.0

 20.0 17.2
 15.6
 Percent

 15.0 13.1
 10.7
 10.0
 6.6
 5.0 2.5 2.5 3.3
 0.8 0.8 0.8
 0.0
 16-19 20-24 25-29 30-34 35-39 40-44 45-49 50-54 55-59 60-64 65-69 70+
 Years

Gender and country of residence
A slightly higher percentage of females (58%, n=71) than males (42%, n=51) completed the survey
(Figure 9). Wilson (2016) reports similar findings at 52% females and 48% males.
Figure 9: Gender and country of residence

 Gender Country of residence

 Overseas
 Male New
 42%
 Female 42% Zealand
 (n=42)
 58% (n=51) 58%
 (n=71) (n=87)

58% of respondents were New Zealanders (n=87) and 42% were overseas (n=63).

 21
Of the 87 New Zealand respondents, 57% (n=50) came from the North Island and 43% (n=37) from
the South Island (Figure 10). The largest numbers of respondents were from the Auckland (16%) and
Waikato regions (15%), followed by Canterbury, Otago and Southland with 11% each.

Figure 10: New Zealand cyclists’ home locations

 22
Home locations
Only 4 respondents (2% of the total sample) lived locally, 3 were from Oamaru and 1 from Duntroon
(Figure 11).

Figure 11: Home locations

 Elsewhere in South
 Local area (Oamaru and Island
 Duntroon) n=7, 5%
 n=4, 2% Otago
 n=7, 5%
 Canterbury
 n=9, 6%

 Overseas
 n=63, 42% Southland
 n=10, 7%

 North Island
 n=50, 33%

 23
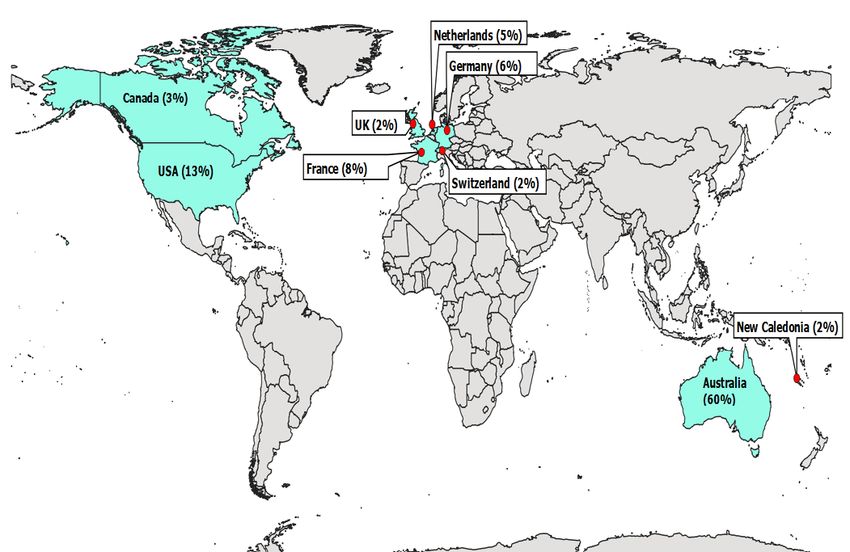
Out of 63 non-New Zealand respondents, 60% came from Australia, 13% from the United States of
America (USA) and 8% from France (Figure 12).
Figure 12: Overseas A2O cyclists (n=63)

Where overseas respondents started their trip in New Zealand
Most overseas respondents started their trip from Christchurch (41%, n=26), followed by Auckland
(35%, n=22) and Queenstown (19%, n=12) (Figure 13).

Figure 13: Where overseas respondents started their trip in New Zealand (n=63)

 45 41
 40
 35
 35

 30
 Percent

 25
 19
 20

 15

 10

 5 3
 2
 0
 Christchurch Auckland Queenstown Wellington Nelson

 24
4.3 A2O activity
Type of trip
About 97% (n=146) of respondents were on overnight trips, and only 3% were on a day trip (two local
area residents, one from Christchurch and one from overseas). However, these figures are not
representative because we distributed survey invitation cards only to cyclists staying at least one night
in the area. Hence, the sample is biased towards cyclists spending at least one night in the area.

Reasons for using the A2O
Most respondents indicated that they were cycling for recreation (n=114), followed by sightseeing
(n=50) and spending time with friends and family (n=37) (Figure 14). These figures are not additive
due to multiple responses per respondent.
Figure 14: Reasons for using A2O (n=150)

 Cycling for recreation 114

 Sightseeing 50

 Spending time/socialising with friends/family 37

 Cycling for exercise 33

 Other 10

The importance of the A2O in the visit to the Mackenzie/Waitaki area
As shown in Figure 15, the A2O visit was the only reason (n=80, 54%) or main reason (n=40, 27%)
to visit for most respondents.

Figure 15: Importance of A2O for visit (n=149)

 90 80
 80
 Number of respondents

 70
 60
 50 40
 40
 30
 18
 20
 10 5 6
 0
 ONLY reason MAIN reason ONE of the JUST something OTHER reasons
 reasons I was doing

 25
The importance of the A2O visit
The importance of the A2O for making the trip was rated 90% -100% by 70% of respondents (Figure
16). Altogether, 90% of respondents rated the importance of their A2O visit to be at least 50%. Ten
percent indicated that their A2O visit was not important; but they would have made the trip anyway.
Figure 16: The importance of the A2O visit (n=145)
 120
 102
 100
 Number of respondents

 80

 60

 40

 20 16
 12
 7 8

 0
 Less than 10% 10% up to< 50% 50% up
What they would have done instead
Those who answered that they would not have visited the Waitaki/Mackenzie area if the A2O did not
exist were asked to state what they would have done instead (Figure 17). Only four (5%) stated that
they would have cycled another trail in the area, or would have visited other attractions in the area.
Fifty-eight percent (n=49) stated that they would have cycled/walked another cycle trail outside the
area, 20% would have stayed at home, 11% would have visited other attractions outside the
Waitaki/Mackenzie area, and 6% would have travelled to another country.

Figure 17: What they would have done instead (n=84)

 Do/visit other
 activities/attractions
 outside the area, 9 Traveled to another
 country , 5 (6%)
 Do/visit other (11%)
activities/attractions in
 the area, 1 (1%)
 Stayed at home, 17
 Cycled/walked (20%)
 another cycle
 trail in the
 area, 3 (4%)

 Cycled/walked another
 cycle trail outside the
 area, 49 (58%)

 27
Respondents who stated that they would have cycled a trail outside the Waitaki/Mackenzie area were
asked which cycle trails they would you have cycled if the A2O did not exist (Table 3).

Table 3: Cycle trails that respondents would have cycled if the A2O did not exist
 New Zealand Cycle Trail Number of respondents
 South Island
 West Coast Wilderness Trail 24
 Otago Central Rail Trail 20
 Clutha Gold Trail 14
 Around the Mountains 14
 Queenstown Trail 12
 Roxburgh Gorge Trail 12
 Queen Charlotte Track 10
 Tasman’s Great Taste Trail 10
 The Old Ghost Road 10
 St James Cycle Trail 8
 Coppermine Trail 2
 North Island
 Mountains to Sea 10
 Hawke’s Bay Trails 8
 Waikato River Trails 7
 The Timber Trail 7
 Rimutaka Cycle Trail 7
 Twin Coast Cycle Trail 6
 Great Lake Trail 5
 Hauraki Rail Trail 3
 Motu Trails 3
 Te Ara Ahi 2
**The number of respondents is not additive because of multiple responses per respondent
The West Coast Wilderness Trail, Otago Central Rail Trail, Clutha Gold Trail, and Around the
Mountains, which are all in the South Island, were the most favoured alternatives.

Other activities and sites visited in the area
Other sites visited and activities undertaken were divided into (i) commercial activities, (ii) cultural or
historic sites, and (iii) leisure and recreation sites or activities.

 28
The most popular commercial activities were winery visits, Hot Tubs Omarama, and Scenic flights
(Table 4). The numbers are not additive since some respondents were involved in more than one
activity.
Table 4: Commercial activities
 Activities Number of respondents

 Winery Visit 37

 Hot Tubs Omarama 21

 Scenic flight (e.g., fixed wing, helicopter, glider) 15

 Sir Edmund Hillary Alpine Centre 6

 Heli-hike 2
 Glacier Explorers 2

 Earth & Sky (Lake Tekapo) 2

 Big Sky Stargazing (Aoraki/Mt Cook) 0
 N/A 0

Kurow Museum was the most popular cultural or historic site, followed by Aoraki / Mt Cook DOC
Visitor Centre and Steampunk HQ (Table 5).

Table 5: Cultural or historic sites
 Cultural or historic sites Number of respondents
 Kurow Museum 31
 Aoraki / Mt Cook DOC Visitor Centre 27
 Steampunk HQ 24
 Vanished World Visitor Centre 21
 The Benmore Visitor Centre 5
 N/A 0

The most visited leisure and recreation site/activity was Elephant Rocks, which received 50% more
visits than Quailburn Historic Woolshed (Table 6).

Table 6: Leisure and recreation sites or activities
 Leisure and recreation sites or activities Number of
 respondents
 Elephant Rocks 90
 Quailburn Historic Woolshed 60
 Clay Cliffs 41
 Swimming 29
 Walking tracks 29
 Oamaru Blue Penguin Colony 23
 Fishing 8
 N/A 0

 29
4.4 A2O ride
Respondents were asked to provide detailed information about their travel while on the A2O using
the interactive mapping features in Figure 18. Information collected included where they started the
A2O ride, where they stopped for at least 10 minutes and where they ended the A2O ride.
Figure 18: Your travel route on the A2O

 1. Select the "start" marker and then click on the map to place it

 2. Select the "places I stopped" marker and click on the map at every place you stopped longer
 than 10 minutes, in travel order

 3. Select the "places I'm planning to stop" marker and click on the map at places you are planning
 to stop 4
 4. You can drag any marker on the map to move it, or double-click to delete it.

 30
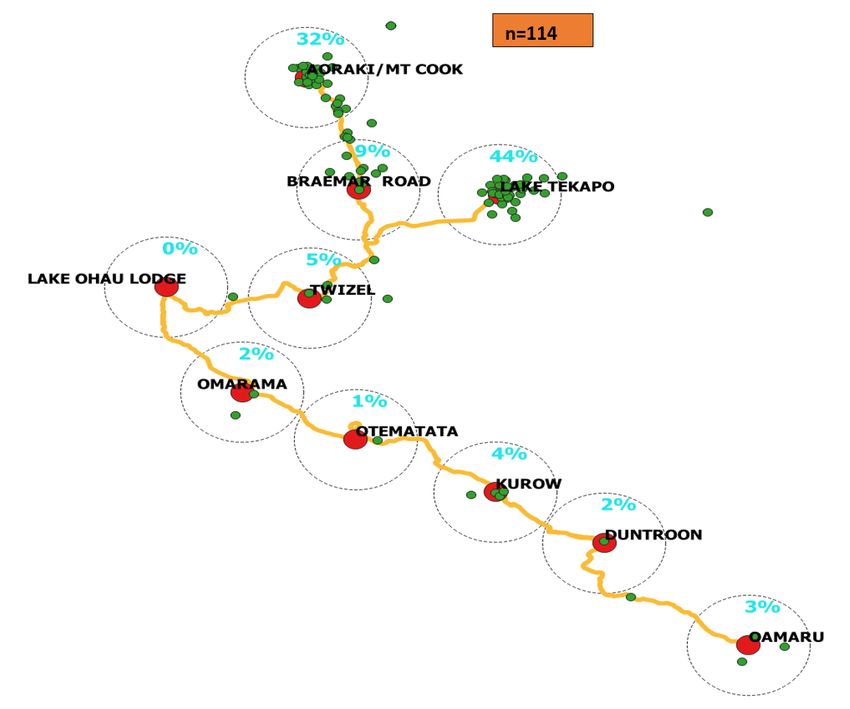
A2O start points
In all, 127 respondents provided latitude/longitude information on where they started the A2O ride,
but 13 of these were not near the trail, leaving 114 usable responses (Figure 19). Even with points
near the trail, there is a potential for errors, given the 10% of known errors.
Figure 19: Where cyclists started the A2O ride

Cyclists who commenced their ride part way between section start points have been assigned to the
section start point. Most cyclists started their ride from the upper part of the trail. About 44% (n=50)
started from the alternative start at Lake Tekapo, followed by 32% on the Aoraki /Mt Cook to Braemar
Road section, and 9% on the Braemar Road to Twizel section. This is not surprising given that survey
invitations by intercepts were mostly in the upper part of the trail.

 31
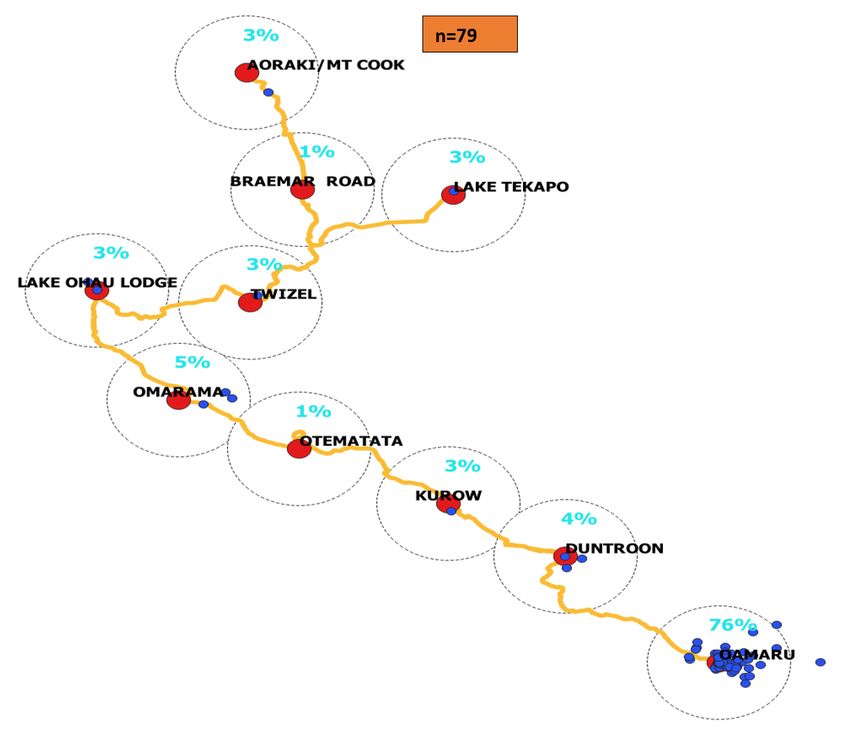
A2O finish points
Out of 127 cyclists who provided information on where they started the A2O ride, only 79 gave detailed
information on where they finished their ride (Figure 20). Most cyclists finished their ride in Oamaru
(76%, n= 60). This is not surprising since most cyclists (n=106) were riding the full trail.
Figure 20: Where cyclists finished the A2O ride

 32
Where cyclists stopped
About 2,000 stopping points were provided by 125 cyclists. Figure 21 shows the places where cyclists
stopped for at least 10 minutes. Reasons for stopping are unknown. There are higher concentrations
of cyclists stopping at or near section end-points. The outliers in Figure 21 suggest either that some
cyclists did not know where they were, or that they had difficulty manipulating the mapping tool.
Figure 21: Cyclists’ stop points

 33
A2O sections ridden
As shown in Table 7, the number of cyclists completing each section varied from 52 for Section 1 to
126 for section 7. Differences in the total number of responses for each section occur because some
respondents did not provide information on the sections they did not ride.

Table 7: Number of respondents riding each A2O Section
 A2O Sections Completed Did part of Did not do Total
 each section the section this responses
 section
 SECTION 1: Aoraki /Mt Cook to Braemar 52 14 25 91
 Road
 ALTERNATIVE START: Lake Tekapo to 54 6 33 93
 Twizel
 SECTION 2: Braemar Road to Twizel 88 9 8 105
 SECTION 3: Twizel to Lake Ohau Lodge 119 6 8 133
 SECTION 4: Lake Ohau Lodge to 117 7 8 132
 Omarama
 SECTION 5: Omarama to Otematata 121 5 8 134
 SECTION 6: Otematata to Kurow 119 8 4 131
 SECTION 7: Kurow to Duntroon 126 4 7 137
 SECTION 8: Duntroon to Oamaru 118 8 7 133

The Kurow to Duntroon section was the most ridden with 92% of respondents completing all of this
section (Figure 22). This was followed by; Otematata to Kurow (91%), Omarama to Otematata (90%),
and Twizel to Lake Ohau Lodge (89%), Lake Ohau Lodge to Omarama (89%), and Duntroon to
Oamaru (89%). Fewer people completed Sections 1 and 2.

 34
Figure 22: Percentage of respondents completing each section

 35
Figure 23 illustrates the percentage of respondents riding part sections of the A2O. Section 1: Aoraki
/Mt Cook to Braemar Road had the highest partial completion rate, followed by section 2: Braemar
Road to Twizel and the alternative start: Lake Tekapo to Twizel and section 6: Otematata to Kurow
and section 8: Duntroon to Oamaru.
Figure 23: Partly completed sections and percentage of respondents

 36
Figure 24 shows the percentage of cyclists who indicated that they did not ride certain sections of the
A2O. The alternative start: Lake Tekapo to Twizel, section 1: Aoraki /Mt Cook to Braemar Road and
section 2: Braemar Road to Twizel had higher percentages of cyclists indicating they did not ride
these sections.
Figure 24: Did not do this section(s)

 37
Number of sections completed
The number of A2O sections completed is shown in Figure 25 and Table 8, with 69% riding the entire
trail. Most of those doing 7 sections either completed section 1: Aoraki /Mt Cook to Braemar Road or
section 2: Braemar Road to Twizel and 6 other sections down the trail. Only 4% did not complete an
entire trail section.

Figure 25: Number of A2O Sections completed (n=140)

 2 sections
 5%
 Part section only 1 Section 4
 4% 4% 3 sections
 section
 2%
 s
 2%
 5 sections
 2% 6
 section
 s
 7 sections 5%
 10%
 All sections
 66%

Table 8: Number of sections completed
 Sections Number of
 completed sections
 completed
 Part section only 5
 1 Section 5
 2 sections 7
 3 sections 3
 4 sections 3
 5 sections 3
 6 sections 7
 7 sections 14
 All sections 93
 Total 140

 38
Time on the trail
The amount of time spent on the trail varied, with 43% spending 6 days on the trail (Table 9).
Altogether, 81% spent 4 to 7 days on the trail. The average time on the trail for those cyclists who
spent at least a day on the trail was 5.1 days.

Table 9: Time on the trail
 Time on the trail Number of respondents Percent
 Less than 1 hour 2 1.4
 1-4 hours (half a day) 7 4.7
 1 day (more than 4 3 2.0
 hours)
 2 days 5 3.4
 3 days 7 4.7
 4 days 15 10.1
 5 days 27 18.2
 6 days 63 42.6
 7 days 15 10.1
 8 days 3 2.0
 9 days 1 0.7
 Total 148 100.0

Nights in the area prior to riding the A2O
Figure 26 shows the number of nights stayed in the area prior to riding the A2O. Most respondents
indicated they stayed one night before the ride (n=76, 52%), followed by 2 nights (25, 17%). Only 14
(10%) did not stay in the area before the ride. Only 18 respondents (13%) stayed more than 3 nights
before the ride. The average stay in the area before the ride was 2.0 nights.

Figure 26: Number of nights in the area before riding the A2O (n=145)
 80 76

 70

 60
 Number of respondents

 50

 40

 30 25

 20 14
 12
 10 4
 3 3 3 2
 1 1 1
 0
 0 1 2 3 4 5 6 7 8 10 12 14
 Number of nights

Average = 2.0 nights

 39
Nights in the area during the A2O ride
The modal stay was 5 nights (n=42, 29%), followed by 6 nights (n=36, 25%) and 4 nights (n=19, 13%).
The average stay in the area during the ride was 4.8 nights (Figure 27)

Figure 27: Nights in the area during A2O ride (n=144)

 45

 40 42

 35 36
 Number of respondents

 30

 25

 20
 19
 15

 10 11 11
 10

 5 6
 5
 2 2
 0
 0 1 2 3 4 5 6 7 8 9
 Number of nights

Average=4.8 nights

 40
Nights in the area after the A2O ride
Most respondents stayed a single night after the A2O ride (n=67, 47%), with 18% staying at least
three nights after the ride (Figure 28 and Table 10). The average stay in the area of A2O after the ride
was 2.4 nights.

Figure 28: Nights in the area after A2O ride (n=144)
 80

 70
 67
 60
 Number of respondents

 50

 40

 30
 28
 20 23

 10
 8 2 4 3 9
 0
 0 1 2 3 4 5 6 7 or
 more
 Number of nights

Average=2.4 nights
Table 10: Nights after ride
 Nights after ride Frequency
 0 28
 1 67
 2 23
 3 8
 4 2
 5 4
 6 3
 7 1
 8 1
 12 1
 14 1
 15 1
 19 1
 25 1
 32 2
 Total 144

 41
Total nights in the A2O area
The modal number of total nights in the area was 7 (17%), followed by 8 (15%) nights. (Figure 29 and
Table 11). The average total stay in the area of A2O was 9.2 nights.

Figure 29: Total nights in the area of A2O (n=145)
 Number of respondents

 30
 25
 20
 15
 10
 5
 0
 1 2 3 4 5 6 7 8 9 10 11 12 13 or
 more
 Number of nights

Average=9.2 nights

Table 11: Total nights in the A2O area
 Total nights Frequency
 1 1
 2 5
 3 5
 4 5
 5 14
 6 10
 7 26
 8 22
 9 11
 10 12
 11 7
 12 7
 13 3
 14 1
 15 2
 16 3
 17 2
 19 1
 20 1
 22 1
 24 1
 25 1
 30 1
 38 2
 41 1

 42
Total 145
4.5 A2O logistics
Support from A2O tour operators
One hundred and thirty four cyclists gave responses on their A2O travel logistics, 19% (n=26) were
on a fully supported trip, 38% (n=51) were partly supported, and 43% (n=57) were independent
(Figure 30).

Figure 30: Type of support from tour operators (n=134)

 45% 43%

 40% 38%

 35%
 Percentage of respondents

 30%

 25%
 19%
 20%

 15%

 10%

 5%

 0%
 Fully supported Partly supported Independent

Level of support
The 77 respondents who were on a fully or partly supported trip were asked about the type of support
they got from tour operators (Figure 31).
Figure 31: Type of support by level of support

 Fully supported (n=26) Partly supported (n=51)

 50 47
 45
 40 40
 40 36
 Number of respondents

 35
 30 26 26 26 26
 25
 20
 15
 10 7
 4
 5
 0
 Accommodation Bike hire Move luggage Shuttle Other

Moving luggage is the most popular service for partly supported cyclists, with almost 92% using this
type of support.

 43
Type of bike
The most common type of bike used by respondents was a mountain bike (42%, n=58), followed by
an e-mountain bike (28%, n=38) (Figure 32).
Figure 32: Type of bike (n=137)

 Mountain bike 42%

 E-mountain bike 28%

 Electric bicycle 12%

 Road/touring/standard bike 12%

 Hybrid bike 4%

 Other 2%

 0% 5% 10% 15% 20% 25% 30% 35% 40% 45%
 Percentage of respondents

Type of accommodation
The type of accommodation used most frequently was hotel/motel/serviced apartment. Rented
house/apartment/flat or unit and self-supported (e.g. caravan, freedom camping vehicle) were also
common (Figure 33). It was common for respondents to use multiple types of accommodation, so
these responses are not additive

Figure 33: Type of accommodation

 100 91
 90
 Number of respondents

 80
 70
 60
 47
 50 43
 40
 30
 20 11 9
 10
 0
 Hotel, motel, serviced Rented house, Self-supported e.g. Non-commercial Other
 apartment apartment, flat or caravan, freedom property e.g. own
 unit camping vehicle holiday and
 family/friends
 property

Travel party
The average party size was 5.6 people, with 81% of 134 respondents reporting travelling as a group

 44
4.6 Satisfaction with perceived quality of the A2O
 experience
Satisfaction with trail information
One hundred and thirty five cyclists provided detailed information about their satisfaction with A2O
information (Figure 34, Table 12). Of those who rated each of the sources (i.e. excluding Don’t
know/NA) 95-97% rated each source as either good or very good.

Figure 34: Satisfaction with trail information

 80%
 70%
 60%
 Satisfaction level

 50%
 40%
 30%
 20%
 10%
 0%
 NZ CYCLE TRAIL website A2O Cycle Trail website A2O Cycle Trail map or brochure

 Very Poor Poor Neither Good Very Good

Table 12: Respondents’ rating of A2O information
 Trail Information Very Poor Neither Good Very Good Total
 Poor respondents
 NZ CYCLE TRAIL website 1 1 2 24 49 77
 A2O website 1 0 3 29 70 103
 A2O map or brochure 1 1 2 37 82 123

 45
You can also read