SMOKING AND QUITTING BEHAVIOUR IN LOCKDOWN SOUTH AFRICA: RESULTS FROM A SECOND SURVEY - Professor Corné van Walbeek Samantha Filby Kirsten van der Zee
←
→
Page content transcription
If your browser does not render page correctly, please read the page content below

SMOKING AND QUITTING
BEHAVIOUR IN LOCKDOWN SOUTH
           AFRICA:

 RESULTS FROM A SECOND SURVEY
               Professor Corné van Walbeek

                     Samantha Filby

                   Kirsten van der Zee

21 July 2020

                                             1
EXECUTIVE SUMMARY

This report is based on the results of an online survey, conducted between 4 June and 19 June
2020. The study was conducted by the Research Unit on the Economics of Excisable Products
(REEP), an independent research unit based at the University of Cape Town. It was funded by the
African Capacity Building Foundation, which in turn is funded by the Bill & Melinda Gates
Foundation.

This report follows on from our first report entitled “Lighting up the illicit cigarette market:
Smokers’ responses to the cigarette sales ban in South Africa”, which was published on 15 May
2020. That report was based on an online survey conducted between 29 April and 11 May 2020.

When the second survey was conducted, the ban on the sales of cigarettes had been extended, even
as the country had moved from lockdown Level 4 to Level 3. The questionnaire was distributed
on Twitter, Change.org (a petition site) and Moya (a data-free platform). The survey yielded
23 631 usable responses. In contrast to the first study, we did not weigh the data, because the
sampling methodology (i.e. online survey) made it impossible to reach the poorer segments of
society. We thus do not claim that the data is nationally representative; we report on the
characteristics of the sample, not the South African smoking population. In the report we often
report the findings by race and gender, because smoking behaviour in South Africa has very
pronounced race-gender differences.

Our most important results regarding quitting during lockdown are as follows:
   • Roughly 27% of smokers in the sample indicated that they had attempted to quit smoking
      cigarettes during the lockdown. There were large racial differences, with African males
      (62%) and females (68%) substantially more likely to attempt to quit than other groups,
      especially White males (18%) and females (17%).
   • Of the smokers who tried to quit, 33% indicated that they had been successful, implying
      that 9% (27% x 33%) of smokers in our sample had successfully quit smoking. Again,
      there were large racial and gender differences, with Africans having the highest quit
      success (36% for males and 48% for females) and Whites having the lowest quit success
      (3.7% for males and 1.8% for females).
   • Based on the unweighted data, the percentage of successful quitters of all respondents
      increased from 7.4% in the first survey to 9.0% in the second survey. (The often-quoted
      quit percentage of 16% in the first survey was based on weighted data).
   • Successful quitters smoked substantially less (average of 7.8 cigarettes per day) pre-
      lockdown than all other respondents (average of 16.4 cigarettes per day), suggesting that
      successful quitters were the least addicted subset of the sample.
   • Seven out of ten (71%) smokers who quit during lockdown intend to stay non-smokers
      after the sales ban is lifted.
   • Amongst those who made a quit attempt, the single most important reason for wanting to
      quit smoking during lockdown is the high price of cigarettes (56%). The unavailability of
      cigarettes (14%) and the ban on the sale of cigarettes (11%), although ranking behind high
      prices, did not feature as strongly. Health concerns (9%), not wanting to be addicted to
      cigarettes (5%), and pressure from family and friends (1.3%) are relatively unimportant in
      the decision to quit smoking.
   • More than 70% of respondents who quit successfully smoked their last cigarette on 2 May
      2020 or before, i.e. during Level 5 of the lockdown. About 16% of successful quitters quit
      between 3 and 31 May 2020 (i.e. during lockdown level 4) and 4% of quitters quit since 1

                                                                                           2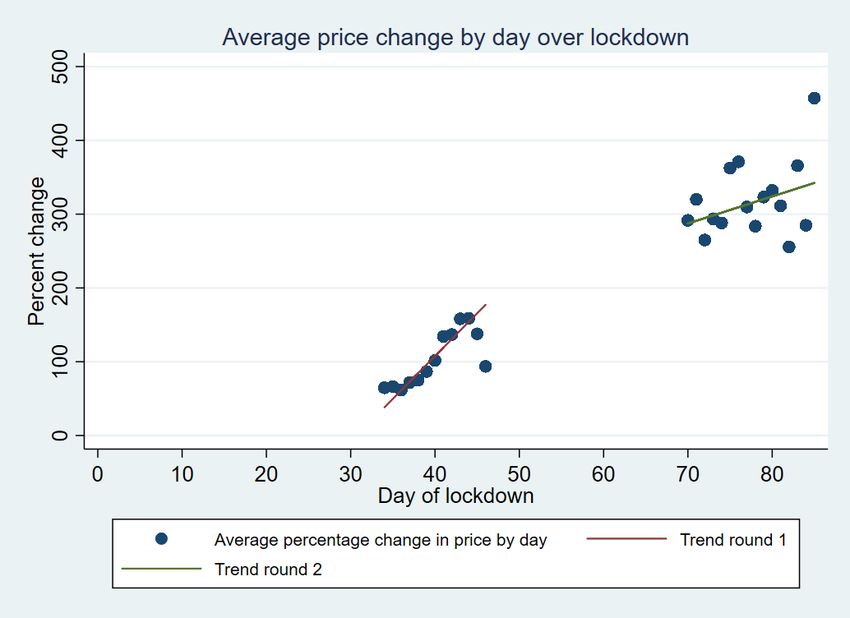
June 2020 (i.e. during lockdown level 3). 8% of successful quitters don’t know when they
       quit smoking.

For respondents who continue to smoke, our survey revealed the following:
   • Average daily consumption decreased from an average of 16.4 cigarettes per day pre-
       lockdown to 13.1 cigarettes per day during the lockdown (average of the last four weeks
       before taking the survey).
   • About half of respondents had smoked less during lockdown than before, while 15%
       smoked more, and 35% smoked the same.
   • Around 93% of continuing smokers in the survey purchased cigarettes during the
       lockdown. This is slightly higher than the 91% reported in the first survey.
   • The main sources of cigarettes for smokers in our survey are friends and family (27%),
       spaza shops (25%), street vendors (11%) and WhatsApp groups (8%). Formal retail outlets,
       which were the predominant outlet before lockdown (53%), have all but disappeared
       (0.3%).
   • 82% of respondents indicated that, pre-lockdown, they never shared individual cigarette
       sticks with other people. This percentage has decreased to 74% during lockdown. The
       percentage of respondents indicating that they regularly shared individual cigarettes (more
       than 50% of cigarettes smoked) has increased from 1.7% pre-lockdown to 8.9% during
       lockdown. This is an increase of 430%.

Our survey revealed the following about cigarette prices, brands and competitive aspects:
   • The average price of cigarettes, as reported by respondents to our second survey, is nearly
       250% higher than pre-lockdown prices, averaging R5.69 per stick (i.e. R114 per pack of
       20 cigarettes). This is substantially higher than the 90% average price increase reported in
       our first report.
   • There are substantial inter-provincial differences in the price increase. The Western Cape
       (379%), Northern Cape (367%) and Eastern Cape (281%) have experienced the largest
       increases, while Limpopo (123%), Mpumalanga (141%) and Gauteng (152%) have
       experienced the smallest price increases.
   • Pre-lockdown, 77% of cigarettes purchased by survey respondents were manufactured by
       multinational tobacco companies (MNCs, i.e. British American Tobacco, Philip Morris
       International, Japan Tobacco International and Imperial Tobacco). By early May this
       percentage had decreased to 38% and by early June 2020 to 18%.
   • Based on our survey, the companies with the largest market share in June 2020 were Gold
       Leaf Tobacco Corporation (26%), followed by Carnilinx (14%), Best Tobacco Company
       (11%), Amalgamated Tobacco Company (10%) and British American Tobacco (9%).
   • None of the top ten cigarette brands that were most purchased by our survey respondents,
       pre-lockdown, are in the top ten list of cigarette brands purchased during the lockdown.
   • Cigarettes produced by MNCs sell at a premium (R6.30 per stick, R126 per pack of 20
       cigarettes) to non-MNC cigarettes (R5.57 per stick, R111 per pack), in our June 2020
       sample. Because the prices of non-MNC brands were substantially lower than the MNC
       brands pre-lockdown, the percentage change in the non-MNC brands is substantially higher
       (231% for MNCs vs 457% for non-MNCs).

The fact that the Fair-Trade Independent Tobacco Association (FITA) initiated a court case to have
the sales ban lifted is ironic, because their members have benefitted disproportionately from the
sales ban. They have greatly increased their share of the market within our sample, and sold their
cigarettes at hugely inflated prices. The extraordinary profits likely earned during the lockdown

                                                                                              3
period will allow them oppose tobacco control reforms more effectively in future. For example,
they could engage in legal battles with the government over the Control of Tobacco Products and
Electronic Delivery Systems Bill or Track and Trace systems.
Being able to produce cigarettes legally for the export market (as has been the case since the
country moved to lockdown level 4), but not able to sell cigarettes in South Africa, has created a
loophole and an incentive to sell illegally in the very lucrative local market. Manufacturers will
find it difficult to resist this temptation, especially because so many companies are selling
cigarettes, despite the sales ban. Given the tobacco industry’s long record of involvement in illicit
trade, it is likely that they will divert cigarettes, ostensibly destined for the export market, to the
local market.
The multinationals have been the biggest losers during the lockdown period. Their markets have
been captured by local companies and, to a lesser extent, by imported cigarettes, significantly
reducing their market share. We predict that, once the sales ban is lifted, there will be a price war,
in which the multinationals will aim to get some of their market share back and the non-
multinational companies will aim to hold on to their markets. The resulting price decrease will be
detrimental to public health.
We argue that, instead of imposing a sales ban to prevent people from smoking cigarettes, the
government would have been able to achieve a similar outcome by substantially increasing the
excise tax (from the current level of R17.40 per pack of 20 cigarettes to R50 per pack or more).
Most smokers that have quit smoking during lockdown did not quit because of health concerns or
because they wanted to follow the government’s regulations, but because the illegal market that
was created by the lockdown made cigarettes unaffordable. Critics of a strategy to increase the
excise tax substantially would argue that to do so would increase illicit trade. That may be possible,
but at least it will not increase to 100%, as is currently the case. Our survey indicates that, more
than anything else, the price of cigarettes made people quit during lockdown.
A substantial (for instance, 100%) immediate increase in the excise tax, followed by above-
inflationary increases in subsequent years, would counteract the impact of a likely price war, once
the sales ban is lifted. It would allow the National Treasury and the South African Revenue
Services to claw back some of the revenue that they have lost during lockdown. Furthermore, it
would encourage smokers to quit, and incentivise many quitters (who may otherwise resume
smoking when the price falls to its “normal” level) to stay non-smokers. However, an important
proviso for such a tax strategy is that the illicit trade in cigarettes is under control. This will be
difficult, given that the illicit operators have been able to entrench themselves during the lockdown
period. However, with political will and with the appropriate use of technology (such as digital tax
stamps and an independent Track and Trace solution), this can be done.
In our first report we argued that, although well-intentioned at the outset, the extension of the
cigarette sales ban into lockdown Level 4 was an error. Based on the results of the second survey,
we believe that the further extension of the sales ban, into lockdown Level 3, amplified the error.
We recommend that the government expeditiously lifts the ban on the sale of cigarettes;
substantially increases the excise tax on tobacco products; and implements better tax enforcement
measures.
4SMOKING AND QUITTING BEHAVIOUR IN LOCKDOWN
SOUTH AFRICA:
RESULTS FROM A SECOND SURVEY
1. INTRODUCTION
On 15 May 2020 the Research Unit on the Economics of Excisable Products (REEP) published a
report titled “Lighting up the illicit cigarette market: Smokers’ responses to the cigarette sales ban
in South Africa”. The report was based on 12 204 valid responses to an online survey of smokers,
conducted between 29 April 2020 and 11 May 2020. The report is available on our website.
The background to the survey was that cigarette sales in South Africa had been banned since 27
March 2020 as part of the lockdown. We reported that, based on a weighted sample, 16% of
respondents successfully quit during the lockdown. Although we did not indicate absolute numbers
in the report, pro-health groups calculated that about one million smokers quit smoking during the
lockdown. Of the smokers who did not quit during lockdown, 90% had been able to purchase
cigarettes during lockdown. Cigarette prices were substantially higher than pre-lockdown. On
average, the price was 90% higher. We found that during the two-week period of the survey,
cigarette prices were increasing at a rate of 4.4% per day. We also reported that the structure of
the market had changed dramatically during the lockdown, with the multinationals losing market
share and the local cigarette manufacturers gaining market share.
We concluded as follows:
Our findings suggest that the ban on cigarette sales is failing in what it was intended to do.
While the original intention of the ban was to support public health, the reality now is that
the disadvantages of the ban outweigh the advantages. People are buying cigarettes in
large quantities, despite the lockdown.
While one should not exaggerate the revenue potential of excise taxes on tobacco products,
since it contributes only 1% of total government revenue, it does not make economic sense
not to collect this revenue. The current sales ban is feeding an illicit market that will be
increasingly difficult to eradicate, even when the lockdown and the COVID-19 crisis are
over. It was an error to continue with the cigarette sales ban into Level 4 lockdown. The
government should lift the ban on cigarette sales as soon as possible.
We sent copies of the report to all members in the National Coronavirus Command Council, and
to officials in National Treasury and the South African Revenue Services with whom we have
engaged in the past.
REEP is a pro-health research unit, with no links to the tobacco industry, focused on the economics
of excisable products. Our past research typically focused on understanding the public health and
fiscal impact of tobacco control policies, and, in particular, excise taxation. More recently,
members of REEP have published a number of papers on the size of the illicit market in South
Africa and in other countries (see www.reep.uct.ac.za for details). Despite our research credentials,
our results were regarded as controversial by the tobacco control community in South Africa. A
number of members of the tobacco control community disagreed with our methodology and
5conclusion that the cigarette sales ban, and especially the extension of the ban after 1 May 2020,
had been unsuccessful in preventing most smokers from accessing cigarettes. Many health
federations and anti-smoking groups supported the extension of the ban on public health grounds.
As economists we do not challenge the public health rationale for the sales ban. Our argument was
practical, namely that it was not stopping (most) people from purchasing cigarettes.
Our report featured prominently in the court case between the Fair-Trade Independent Tobacco
Association (FITA) and the Minister of Cooperative Governance and Traditional Affairs
(COGTA), and in the court case between British American Tobacco (and others) and the Minister
of COGTA (and others). British American Tobacco extensively quoted from our report in their
founding affidavit. In the responding affidavit by the Minister, a number of academics and research
groups evaluated and criticised our report. The single most contested issue about our report is
whether the survey was representative of all smokers in the country. We return to this matter in
the methodology section of this report.
Considering that the cigarette sales ban was extended well beyond the originally announced three-
week period, and beyond the period of the first survey, we ran a second, similar survey of lockdown
smokers and quitters in June 2020. This survey aimed both to update the findings of the first
survey, and to improve on the questionnaire design and reach of the first round (for example, more
thorough advertising amongst lockdown quitters). The current report presents the findings of the
second round of the REEP lockdown survey.
2. METHODOLOGY
We conducted a second online survey of smokers between 4 and 19 June 2020. Many questions in
the second questionnaire were the same as or similar to those of the first round. We excluded some
questions (particularly some detailed questions regarding stock-up), and added some additional
questions regarding when during the lockdown respondents quit, and whether respondents shared
cigarettes with others before and during the lockdown. The round 2 questionnaire is presented in
Appendix A.
As with round 1, the questionnaire asked people about their smoking behaviour and purchasing
patterns before the sales ban, whether they had stocked up before the lockdown (and for how long
they expected their stock to last), whether (and, if so, when) they quit during the lockdown (and
the reasons for quitting), and their smoking behaviour and purchasing patterns during the
lockdown. We also asked respondents about their perceptions of the cigarette and alcohol sales
ban, as well as of the lifting of the ban on alcohol sales in level 3. The last section asked
respondents about their demographic and socio-economic characteristics.
Since the sales ban had been in place for more than nine weeks by the time we launched the second
survey, we did not ask respondents to describe their overall experience during these nine weeks,
since this could have changed considerably, but rather asked about their smoking behaviour
(specifically the number of cigarettes smoked) during the previous month. Also, for the prices paid,
the brand purchased, the packaging type and the retail outlet accessed during the lockdown, we
asked respondents to describe their most recent purchase. In the first round of the survey,
respondents were not asked about their most recent purchase, but about all their purchases in the
lockdown period.
As this was an online survey, we relied on social media to advertise the survey. In order to
participate in the survey, respondents had to be at least 18 years old and must have been regular
6smokers (at least one cigarette per day) the week before the lockdown started. In total, 34 321
eligible participants opened the survey link, and of these, 23 631 individuals completed the survey.
A large number of completed responses (10 803) were received in the first two days of the survey
(4 June and 5 June). On the evening of 5 June, the survey was advertised to the signatories of the
Change.org petition. The Change.org petition was signed by about 600 000 people (presumably
mostly smokers), calling on the government to allow the legal sale of cigarettes. In the following
two days we received another 6776 responses, of which a large portion can presumably be
attributed to Change.org. We also advertised the survey on the Moya data-free platform, using a
separate link. This yielded 5434 complete responses. We asked a pro-health group to advertise the
survey among people who had approached their quit line and who were on their social media
network. Although we only analyse complete responses in this report, 204 respondents who did
not complete the full survey provided sufficient information to be included in the quitting analysis.
We noted some outliers in the lockdown consumption variable; for example, individuals reporting
smoking 10 cigarettes per day before lockdown, and 20 or 50 cigarettes per day during lockdown.
This is likely the result of the wording of the lockdown consumption question: “How many
cigarettes have you smoked on average per day in the last month?” (bold emphasis is in the
questionnaire). It is possible that some individuals interpreted this question as “How many
cigarettes have you smoked in the last month?” (i.e. they missed the words “on average per day”)
and responded with an aggregate for the month. To resolve this issue, we removed all lockdown
consumption responses that were more than 1.5 times the individual’s pre-lockdown consumption.
As a result, 1 371 outlier lockdown consumption numbers were removed, which equates to 6.6%
of all lockdown consumption responses. Although we believe this is an appropriate rule to remove
outliers, based on the data, this approach may result in unintentionally removing accurate data.
We also noted a number of data outliers which suggested data errors in the responses to the
questions on prices, for example, a price of R300 for a pack of 20 cigarettes in the pre-lockdown
period. In cases where obvious errors were observed, a specific set of rules was followed to correct
these errors. A detailed description of these rules is outlined in appendix B.
As was the case in round 1, we oversampled females (even more so than in round 1), Whites, and
the Western Cape and Gauteng provinces, and undersampled males, Africans and the other seven
provinces. In round 1 we weighted the data by race, gender and province with the intention of
making the sample more representative of South Africa’s smoking population. However, because
the survey was done online, poorer, less literate, and less computer-literate South Africans will be
under-represented because they have less access to the internet than more affluent groups.
Cigarette consumption in our sample is also substantially higher than average national cigarette
consumption, suggesting that we do not sufficiently capture light smokers. Based on discussions
with experts in sampling design, and on comments by reviewers of our study in Minister Dlamini-
Zuma’s responding affidavit in the BATSA case, we have been persuaded that weighting the data
by gender, race and province, as we did in round 1, will not solve the representativity problem.
For example, even though we can upweight our sample of Africans to match national proportions,
this will not give a representative picture of the full spectrum of African smokers, because very
poor Africans were not sufficiently captured in our sample. Therefore, for this report we decided
not to weight the data, but to report the results from the sample we surveyed. We thus do not
attempt to claim national representativity.
Because smoking patterns in South Africa have distinct racial and gender dimensions, we
disaggregate our results by race and gender, where appropriate. For example, females smoke
substantially less than males, on average, but this distinction is even greater within race groups.
7African females smoke on average 5.6 cigarettes per day, while White females smoke on average
15.4 cigarettes per day (reference to NIDS wave 5). Table 1 below indicates the number and
proportions of respondents in the various race-gender categories in the two rounds of the survey,
compared to the weighted proportions of smokers aged 18 and older in wave 5 of the National
Income Dynamics Study (NIDS), conducted in 2017. NIDS is a nationally representative, South
African household panel survey, of which there are 5 waves, conducted between 2008 and 2017.
NIDS asks adult respondents various smoking-related questions, and thus provides an appropriate
national comparator for our data (reference to NIDS wave 5). Where appropriate, we show the
findings of rounds 1 and 2 (unweighted), however appendix C describes in detail why readers
should use caution when directly comparing the two rounds.
Table 1. Number of respondents, by race and gender: weighted NIDS wave 5 (2017) data
of smokers, compared with REEP survey data in rounds 1 and 2
NIDS Wave 5 REEP Survey Round 1 REEP Survey Round 2
N Proportion N Proportion N Proportion
Overall 4122 100 12094 100.0 23631 100.0
Males 3081 81.1 5667 46.9 8271 35.0
African 2213 63.8 1589 13.1 2132 9.0
Coloured 654 10.4 910 7.5 1285 5.4
Indian 58 2.0 444 3.7 585 2.5
White 156 5.0 2724 22.5 4269 18.1
Females 1038 18.8 5434 44.9 13272 56.2
African 243 5.1 533 4.4 931 3.9
Coloured 628 8.1 1341 11.1 2851 12.1
Indian 25 0.7 239 2.0 488 2.1
White 142 4.9 3321 27.5 9002 38.1
Race and/or
gender 3 0.1 996 8.2 2088 8.8
undisclosed
Notes: NIDS Wave 5 is weighted using post-stratified, top-up weights.
The second survey yielded about twice the number of responses as the first round. However,
despite its substantial size, the samples, both in round 1 and increasingly in round 2, are not
representative of South Africa’s smoking population by race and gender.
Table 1 clearly indicates the oversampling of females and Whites (compared to NIDS), and the
corresponding undersampling of males and Africans. The survey substantially oversampled people
at the higher end of the socio-economic spectrum (not shown in the table). For example, the median
monthly household income of respondents was between R12 801 and R25 400. According to
Saldru’s income comparator tool (see https://www.saldru.uct.ac.za/income-comparison-tool/) the
median household income for a family of 5 people in 2017 was about R6000 per month. Adjusted
for inflation, that is about R7000 in 2020 prices. The median income for respondents in our sample
is substantially higher than the median income in South Africa. Nearly 90% of respondents
indicated that they had completed matric and approximately 50% of respondents indicated that
they had some form of tertiary qualification. This is substantially higher than the education profile
of the population as a whole. Also, as we report in the results section below, the survey has
8substantially oversampled smokers who purchase cigarettes in cartons (i.e. 10 packs of 20
cigarettes each) and undersampled smokers who purchased cigarettes as single sticks.
Ethics approval for round 2 of the study was granted by UCT’s Commerce Faculty Research in
Ethics Committee (REC 2020/06/002). The survey was administered through SurveyMonkey. The
survey was conducted in English only. In order to incentivise people to complete the survey, ten
respondents were randomly selected to receive a R500 Takealot voucher in a lucky draw. The
results presented here refer to the second survey, unless indicated otherwise.
3. RESULTS
3.1 Quitting during lockdown
The questionnaire had eight questions relating to quitting behaviour during the lockdown. In Table
2, we indicate the intention to quit, the success in quitting and the intention to stay ‘quit’ after the
lockdown is over, by race and gender categories.
Table 2. Quitting behaviour during the lockdown
Intent to stay
Successful Successful
non-smokers,
Attempt to quitter given quitters from
N given
quit (%) quit attempt all pre-LD
successful
(%) smokers (%)
quitting (%)
Males 8 342 32.9 40.8 13.5 73.8
African 2 165 62.4 56.7 35.5 79.8
Coloured 1 300 35.4 34.8 12.3 72.5
Indian 589 28.9 22.4 6.5 65.8
White 4 288 17.9 20.6 3.7 47.5
Females 13 373 23.7 27.6 6.6 69.4
African 945 68.1 69.3 47.5 79.4
Coloured 2 880 30.9 26.8 8.4 68.3
Indian 490 24.3 25.2 6.1 60.0
White 9 058 16.8 10.6 1.8 45.1
Race and/or
gender 2 126 25.3 27.7 7.0 59.1
undisclosed
Total 23 835 27.1 33.2 9.0 70.9
Notes: “Attempt to quit” is an indicator for whether the respondent had attempted to quit during the lockdown or not (asked of all
respondents). The number of observations (N) refers to the respondents who have answered the first question (“Have you attempted
to quit smoking since the sale on cigarettes was banned due to lockdown (since 27 March)? “Successful quitter given quit attempt”
is an indicator for whether the respondent has been successful in their attempt to quit (asked only of those who had attempted to
quit). “Successful quitters from all pre-LD smokers (%)” represents the number of individuals who had successfully quit, as a
proportion of all respondents (including those who had and had not attempted to quit). “Intent to stay non-smokers, given successful
9quitting (%)” is an indicator for whether successful quitters intended to start smoking again or not, once the cigarette sales ban has
ended (asked only of successful quitters).
At the aggregate level, roughly 27% of smokers in the total sample indicated that they had
attempted to quit smoking cigarettes during the lockdown. Of the smokers who tried to quit, 33%
had successfully quit by the time they completed the survey, while 67% of those who attempted to
quit were unsuccessful. Thus, approximately 9% (27% x 33%) of all respondents had quit
successfully (at least at the time of the second survey). Males’ success rate in quitting was almost
double that of females, with 13.5% of males in the sample successfully quitting, compared to 6.6%
of females. Except in the African race group, where females have been more successful at quitting
smoking than males, males have been more successful at quitting smoking than females.
Table 2 shows that there are large differences in quitting behaviour by race. Around 64% of
Africans (62% males and 68% females) attempted to quit, compared to 32% of Coloureds (35%
male and 31% female), 27% of Indians (29% male and 24% female) and 17% of Whites (18%
male and 17% female). 1 Africans were also had the highest overall quit rate compared to any other
race group: around 39% of Africans (36% male and 48% female) who identified as smokers in the
pre-lockdown period successfully quit smoking during the lockdown, compared to 2.2% of Whites
(3.7% males and 1.8% females), who had the lowest overall quit rate of all race groups. Of the
smokers who had successfully quit by the time of answering the survey, 71% intend to stay non-
smokers after the cigarette sales ban is lifted.
Respondents who attempted to quit were asked to disclose the main reason for their attempt to quit
during lockdown. The percentage distribution, broken down by race and gender, is shown in Table
3. The main reason for attempting to quit, espoused by the majority (56%) of attempting quitters,
is the high price of cigarettes during lockdown. In fact (not shown in the table), 67% of successful
quitters indicated that the high price of cigarettes during lockdown was the main reason for their
attempt to quit. This conforms to standard economic theory, which predicts that an increase in the
price of a product will lead to a decrease in consumption. A substantial proportion of the 29% of
quitters in the sample that do not intend to stay non-smokers after the sales ban is lifted probably
have an expectation that cigarette prices will return to pre-lockdown levels after the cigarette sales
ban is lifted, and that therefore their main reason for quitting will no longer apply.
About 14% of respondents who attempted to quit indicated that they attempted to do so because
they could not find cigarettes during the lockdown, and even fewer people (11%) were motivated
to quit by the existence of the ban on cigarette sales. The results are broadly consistent across race
and gender, though there are some interesting differences.
Females were more affected by the higher prices than their male counterparts: 61% of females,
compared to 49% of males, cited that “cigarettes have become too expensive during the lockdown”
as their reason for quitting. Men were more likely to be motivated to quit “because of the cigarette
sales ban” (14.5%) than females (8.7%), while an almost equal proportion of men and women
(around 14%) quit because they “could not find cigarettes”.
1
Note that the quitting percentage for a race group is a weighted average of the quitting percentages of the two
genders, based on the sample. The same applies to the next sentence.
10Table 3. Main reason for attempting to quit during lockdown
Cigarettes
have
become too I don't want Requests/pr
expensive The ban I cannot to be essure from
during motivated find Health addicted to family and
N lockdown me to quit cigarettes concerns cigarettes friends Other
Males 2 740 49.4 14.5 14.2 10.9 6.4 1.5 3.1
African 1 347 38.6 21.0 11.6 16.2 9.0 1.6 2.0
Coloured 455 60.7 11.6 11.4 10.3 3.3 0.7 2.0
Indian 168 54.8 10.1 17.9 4.8 3.6 2.4 6.5
White 770 60.4 5.7 19.7 3.4 4.3 1.7 4.8
Females 3 172 61.6 8.7 13.7 6.7 4.7 1.0 3.5
African 639 30.5 23.8 14.6 16.1 11.9 1.4 1.7
Coloured 891 69.8 6.7 9.3 7.6 3.6 0.6 2.4
Indian 119 58.0 8.4 18.5 6.7 3.4 1.7 3.4
White 1 523 70.1 3.5 15.6 2.2 2.5 1.1 5.0
Race and/or
gender
undisclosed 533 56.5 8.3 17.3 7.3 4.1 1.5 5.1
Total 6 441 56.0 11.1 14.2 8.5 5.4 1.3 3.5
Note: This table includes all respondents who had attempted to quit during lockdown, both those who had succeeded
and those who had failed in their attempt to quit.
11In order to determine whether quitting took place sooner or later after the sales ban was imposed,
we asked respondents who successfully quit smoking when they had smoked their last cigarette.
The options were categorised into roughly two-week periods (Table 4).
Table 4. Approximate date when successful quitters smoked their last cigarette
N 25 March 5 April 19 April 3 May 17 May Since 1 Don't
- - - - - June know
4 April 18 April 2 May 16 May 31 May
Males 1 124 36.0 22.4 13.7 10.1 6.7 3.7 7.4
African 768 38.7 25.1 12.4 7.9 4.9 2.7 8.2
Coloured 160 38.1 15.6 14.4 10.0 11.3 2.5 8.1
Indian 38 39.5 21.1 10.5 7.9 5.3 7.9 7.9
White 158 20.3 16.5 20.3 20.9 10.8 8.9 2.5
Females 878 37.5 23.7 13.1 9.5 5.6 3.1 7.6
African 446 44.8 27.6 9.0 4.9 3.4 2.5 7.8
Coloured 240 34.2 18.8 16.3 13.3 5.0 2.9 9.6
Indian 30 56.7 16.7 6.7 3.3 3.3 3.3 10.0
White 162 18.5 21.6 21.0 17.3 13.0 4.9 3.7
Race and/or 149 37.6 13.4 10.1 5.4 9.4 5.4 18.8
gender
undisclosed
Total 2 148 36.7 22.3 13.2 9.5 6.4 3.6 8.2
Notes: This table includes all respondents who had successfully quit cigarette smoking during lockdown.
12Table 4 shows that the majority of smokers who quit during lockdown quit smoking in the first
month of lockdown (37% quit in the first two weeks, and 22% quit in weeks 3 and 4 of lockdown).
About 8% of people did not know when they had quit, but it is likely that they would have quit
earlier rather than later (they would probably have remembered had they quit more recently). Only
about 16% of respondents who successfully quit smoking did so during Level 4 lockdown (3 May
to 31 May 2020), and even fewer (about 4%) quit after June 1st (recall that the survey closed on 19
June 2020). That most people quit in the first four or five weeks of lockdown suggests that the
public health benefit of people quitting was realised only marginally through the further extensions
of the ban.
It seems plausible that, of all smokers, the least addicted would be the most likely to quit smoking
successfully. In order to investigate this, we asked all respondents how many cigarettes they
smoked on average per day before the lockdown started. We compared this pre-lockdown
consumption between successful quitters and continuing smokers in Table 5 (broken down by race
and gender group).
Except for White males, the results show that successful quitters smoked significantly fewer
cigarettes per day (on average 8.6) than non-quitters (on average 16.4; significant at the 1% level).
Thus, it is likely that our sample of successful quitters was the least addicted, pre-lockdown, of all
the respondents.
Table 5. Average number of cigarettes smoked per day, successful quitters and continuing
smokers
Pre-lockdown cigarette Pre-lockdown cigarette
consumption: consumption:
Continuing smokers Successful quitters
Mean SD N Mean SD N P-values
Males 16.2 9.7 7 103 8.0 7.9 1 102 0.00
African 8.3 6.2 1 382 5.7 4.1 748 0.00
Coloured 12.2 7.5 1 122 7.4 6.2 159 0.00
Indian 13.1 7.0 542 9.9 6.3 38 0.01
White 20.4 9.2 4 057 19.6 12.0 157 0.25
Females 16.5 8.7 12 280 7.0 7.5 866 0.00
African 7.8 6.4 489 4.1 4.2 439 0.00
Coloured 11.3 6.2 2 600 6.0 5.7 236 0.00
Indian 11.8 7.3 456 5.6 4.6 29 0.00
White 18.8 8.4 8 735 16.4 9.3 162 0.00
Race and/or
gender 15.9 8.7 1 922 10.2 12.7 142 0.00
undisclosed
Total 16.4 9.0 21 305 7.8 8.2 2 110 0.00
Notes: “Continuing smokers” includes both smokers who attempted but failed to quit, as well as smokers who did not attempt to
quit. P-values are for the t-test for the difference in means.
13We use logistic regression analysis to explore the correlates of attempting to quit (Table 6) and
success of quitting (Table 7). We present both the marginal effects and odds ratios (ORs). On the
matter of quit attempts, the results show that lighter smokers were more likely to make a quit
attempt than heavier smokers. The marginal effect is -0.006, meaning that, for every additional
cigarette smoked per day (pre-lockdown), a smoker is on average 0.6 percentage points less likely
to attempt to quit smoking during the lockdown period. Relative to Africans, all other race groups
are significantly less likely to make a quit attempt (ORs all less than 1, and marginal effects are
negative). Males are more likely to attempt to quit than females (OR=1.13; 95% CI: 1.052 – 1.205).
Relative to smokers in the city, smokers in rural areas, townships and informal settlements are
more likely to make an attempt to quit (ORs greater than 1, and marginal effects are negative). The
older the smoker, the more likely they are to make a quit attempt (OR=1.009 and marginal effect
is 0.001). For every year in age, the probability of a quit attempt increases by 0.1 percentage points
on average. The longer a person has been smoking, the less likely they are to make a quit attempt
(OR = 0.970, and marginal effect = 0.005). Thus, for every additional year of smoking, the
probability of attempting to quit smoking decreases by 0.5 percentage points on average.
Table 6. Logit regression: Correlates of attempting to quit
Logit regression
Marginal
Independent variables SE Odds ratios SE
Effects
Number of cigarettes smoked per
-0.006*** 0.000 0.968*** 0.003
day before lockdown
Base: African
Asian/Indian -0.217*** 0.017 0.352*** 0.030
Coloured -0.173*** 0.013 0.448*** 0.026
White -0.242*** 0.014 0.303*** 0.019
Prefer not to answer -0.226*** 0.016 0.334*** 0.026
Base: Female
Male 0.020*** 0.006 1.126*** 0.039
Prefer not to answer 0.039* 0.021 1.254** 0.144
Base: City
Farm 0.007 0.015 1.042 0.092
Informal settlement 0.089*** 0.026 1.619*** 0.212
Rural 0.045*** 0.015 1.288*** 0.104
Suburb -0.007 0.009 0.960 0.050
Town -0.001 0.011 0.996 0.063
Township 0.060*** 0.014 1.397*** 0.105
Age 0.001** 0.001 1.009** 0.004
Smoking duration -0.005*** 0.001 0.970*** 0.004
Constant 1.842*** 0.195
Observations 23,121 23 121
Notes: The binary dependent variable is 1 if the respondent attempted to quit, and 0 if they did not attempt to quit.
Significance stars indicate: *** pOn the matter of quit success, the results in Table 7 are qualitatively similar to the results for
quitting attempts, shown in Table 6. For Table 7 we consider only respondents who indicated that
they tried to quit. Respondents who did not try to quit are excluded. Results show that lighter
smokers are more likely to successfully quit than heavier smokers (OR=0.957; 95% CI: 0.943 –
0.972 and marginal effect = -0.008). The marginal effect indicates that for every additional
cigarette smoked per day, the probability of quitting success decreases by 0.8 percentage points.
Relative to Africans, all other race groups were less likely to successfully quit (ORs all less than
1, and marginal effects are negative). Males were more likely to successfully quit than females
(OR=1.163; 95% CI: 1.024 – 1.321)). Older smokers, all else remaining the same, were more likely
to be successful in their quit attempts than younger smokers (OR = 1.016; 95% CI: 1.003 – 1.030,
marginal effect = 0.003). For every year, the probability of successfully quitting smoking increases
by 0.3 percentage points on average. On the other hand, people who had been smoking longer are
less likely to quit successfully (OR = 0.984; 95% CI: 0.970 – 0.997, marginal effect = -0.003),
indicating that for each extra year of smoking, the probability of successful quitting decreases by
0.3% on average. There is a high correlation between age and smoking duration, so these odds
ratios work against each other. The net effect of age and smoking duration is negligible. People in
the suburbs and in towns were less likely to successfully quit than people who live in cities.
Table 7. Logit regression: correlates of quit success
Logit regression
Marginal
SE Odds ratios SE
Independent variables Effects
Number of cigarettes smoked per
-0.008*** 0.001 0.957*** 0.007
day before lockdown
Base: African
Asian/Indian -0.257*** 0.030 0.303*** 0.047
Coloured -0.216*** 0.020 0.377*** 0.034
White -0.305*** 0.023 0.227*** 0.025
Prefer not to answer -0.255*** 0.029 0.305*** 0.044
Base: Female
Male 0.027** 0.012 1.163** 0.076
Prefer not to answer 0.057* 0.035 1.367* 0.251
Base: City
Farm 0.021 0.033 1.116 0.187
Informal settlement 0.045 0.037 1.258 0.232
Rural 0.032 0.027 1.177 0.159
Suburb -0.077*** 0.019 0.659*** 0.067
Town -0.076*** 0.023 0.665*** 0.083
Township -0.029 0.022 0.859 0.100
Age 0.003** 0.001 1.016** 0.007
Smoking duration -0.003** 0.001 0.984** 0.007
Constant 1.475** 0.279
Observations 6,257 6 257
Notes: The binary dependent variable is 1 if the respondent was successful in his/her quit attempt, given quitting was
attempted, and 0 if he/she was unsuccessful. Significance stars indicate: *** p3.2 Smoking behaviour before and during lockdown
The second substantial section of the questionnaire asked about respondents’ smoking behaviour
before the lockdown. For the remainder of this report, we analyse continuing smokers only
(including smokers who did not attempt to quit, and those who attempted to quit but failed), and
refer to them as such.
(a) Daily consumption
Of the continuing smokers, we asked the following question in the section on smoking behaviour
during lockdown: “How many cigarettes have you smoked on average per day in the last month?”.
Respondents were asked to enter a number between 1 and 99. Table 8 shows the average number
of cigarettes consumed by smokers before and during the lockdown (in the month before the
questionnaire was completed).
Table 8. Cigarette consumption per day, pre-lockdown and during lockdown
Pre-Lockdown During Lockdown
Mean SD N Mean SD N P-Values
Males 16.2 9.7 7 103 12.9 9.4 6 343 0.00
African 8.3 6.2 1 382 5.7 5.4 1 059 0.00
Coloured 12.2 7.5 1 122 8.5 6.7 953 0.00
Indian 13.1 7.0 542 10.7 7.0 476 0.00
White 20.4 9.2 4 057 16.2 9.5 3 855 0.00
Females 16.5 8.7 12 280 13.2 8.6 11 222 0.00
African 7.8 6.4 489 5.6 6.1 396 0.00
Coloured 11.3 6.2 2 600 8.2 6.0 2 231 0.00
Indian 11.8 7.3 456 9.7 7.6 389 0.00
White 18.8 8.4 8 735 15.2 8.6 8 206 0.00
Race and/or
gender 15.9 8.7 1922 12.8 8.8 1739 0.00
undisclosed
Total 16.4 9.0 21 305 13.1 8.9 19 304 0.00
Notes: Table includes continuing smokers only (those who did not attempt to quit, and those who attempted but failed
to quit). P-values are for the t-test for the difference in means.
Prior to the lockdown, White males were the heaviest smokers (on average 20 cigarettes per day),
while African females and males were the lightest smokers, both consuming around 8 cigarettes
per day. The relative position of each race-gender category remains largely unchanged between
the pre-lockdown and during-lockdown periods. For our sample, continuing smokers smoked an
average of 13.1 cigarettes per day during the lockdown, down from 16.4 cigarettes per day in the
pre-lockdown period.
We also calculated the percentages of continuing smokers who, on an individual level, decreased,
increased, or kept steady their cigarette consumption per day during lockdown (compared to their
pre-lockdown consumption). The results are shown in Table 9.
16Table 9. Percentage of continuing smokers who changed their daily cigarette consumption
during lockdown
Consumption Consumption Consumption
N
stayed the same Increased Decreased
Males 6 830 34.8 14.1 51.1
African 1 303 18.6 25.1 56.3
Coloured 1 079 24.2 17.2 58.6
Indian 514 36.0 16.0 48.1
White 3 934 43.0 9.4 47.7
Females 11 920 34.3 15.0 50.7
African 473 18.4 23.7 57.9
Coloured 2 510 22.2 19.0 58.9
Indian 438 29.5 22.4 48.2
White 8 499 39.0 12.9 48.1
Race and/or gender
1 876 34.9 15.3 49.8
undisclosed
Total 20 624 34.5 14.7 50.8
Roughly 50% of males and females in the sample indicated that they smoked less than before,
while 15% of females and 14% of males indicated that they smoked more. Across all races, the
proportion of people who indicated that they smoked less during the lockdown was higher than
the proportion of people who indicated that they smoked more.
(b) Purchasing cigarettes during lockdown
All continuing smokers were asked whether they had purchased cigarettes during the lockdown
(“During lockdown, have you purchased cigarettes?”) The percentage of respondents who
indicated that they have purchased cigarettes during the lockdown is shown in Table 10. For
comparative purposes, this is shown for both rounds of data collection.
17Table 10. Percentage of continuing smokers that reported purchasing cigarettes during
lockdown: Round 1 and Round 2 data
Round 1 Round 2
% bought % bought
cigarettes cigarettes
N N P-values
during during
lockdown lockdown
Males 3 789 92.5 7 171 92.1 0.49
African 783 90.0 1384 86.8 0.03
Coloured 599 91.0 1 126 91.8 0.55
Indian 278 89.2 547 91.6 0.26
White 2 129 94.3 4 114 94.1 0.75
Females 3 756 89.7 12 409 93.9 0.00
African 237 78.5 494 78.9 0.89
Coloured 849 88.6 2 615 93.3 0.00
Indian 152 87.5 459 89.8 0.44
White 2 518 91.3 8 841 95.1 0.00
Race and/or gender
678 89.7 1 946 90.2 0.70
undisclosed
Total 8 221 91.0 21 526 93.0 0.00
Note: P-values are for the proportions test for the difference in proportions within groups.
Reporting round 1 and round 2 together allows us to investigate whether smokers’
ability/willingness to purchase cigarettes changed over time, as cigarettes became more expensive,
or more difficult/easy to find during lockdown. For most subgroups, there was no statistical
difference in the proportion of smokers who reported purchasing cigarettes; however, overall,
significantly more smokers purchased cigarettes in round 2 than in round 1. For males, 92% of
respondents in round 2 indicated that they purchased cigarettes during lockdown, a similar
percentage as during round 1. For females, the percentage of respondents who have purchased
cigarettes has increased from 91% in the first round to 94% (statistically significant at the 1%
level). This is driven by significant increases in the percentage of coloured (from 89% to 93%) and
white (from 91% to 95%) females indicating that they have purchased cigarettes during lockdown.
(c) Retail outlet
Respondents were asked where they purchased their cigarettes pre-lockdown (“Where did you
usually buy your cigarettes?”) and during lockdown (“Think about your most recent purchase of
cigarettes (even if it was only a single stick). Where did you buy your cigarettes from?”). Figure 1
indicates the distribution of the retail outlets before and during the lockdown.
18Note that we cannot do a direct comparison with the results from round 1, as respondents in that
round could select more than one outlet type that they had purchased cigarettes from during the
lockdown, whereas in round 2 they could only select one.
Figure 1. Distribution of outlets where respondents purchased cigarettes pre-lockdown and
during lockdown
0,0 10,0 20,0 30,0 40,0 50,0 60,0
Formal retailer (e.g. Pick 'n Pay, Spar) 0,3 53,2
Spaza shop 14,6 25,2
Cafe 6,99,1
Petrol station 0,8 6,7
Tobacco shop (e.g. Tobacconist Cock 'n Bull) 0,1 5,3
Wholesaler 0,4 5,0
House shop 3,35,2
Street vendor 1,4 11,1
Other (please specify) 0,9 5,6
From friends/family 0,3 27,1
Acquaintances who are essential workers 0,22,6
Online platform (e.g. Facebook) 0,1 4,1
Vending machine 0,1
0,1
Acquaintances who are essential workers 2,6
Car guard 2,4
Through Whatsapp 8,1
Before lockdown During lockdown
Note: N = 21 150 for pre-lockdown and N = 19 962 for lockdown
The cigarette distribution network has shifted significantly during the lockdown period. In the pre-
lockdown period, formal retail outlets dominated in the sample, with more than 53% of the market.
Including other formal, yet less dominant, outlet types such as petrol stations (6.7%), tobacco
shops (5.3%) and wholesalers (5%), brings the total “formal” share of retailers to over 70% of the
purchases pre-lockdown. This suggests that, under normal competitive conditions, respondents
prefer these outlet types. In the lockdown period however, formal outlets play a negligible role.
The most important outlet type in our sample during lockdown was “through friends and family”
(27%). Spaza shops (25%) and street vendors (11%) also became important outlets during
lockdown.
Even though all cigarettes purchased during the lockdown are being traded ‘illegally’ (by virtue of
the fact that all cigarette sales were banned during the lockdown period), 34% of the 5.6% (i.e. 2%
overall) of people who selected the ‘other’ option used terms such as ‘drug dealers’, ‘smugglers’,
‘black market traders’, ‘underground’ or ‘illicit traders’ to describe their purchase outlet (not
explicitly shown in Figure 1).
19(d) Packaging type
We asked respondents to identify the packaging type in which they typically purchased cigarettes
pre-lockdown and to identify the packaging type bought in their most recent purchase during the
lockdown. The questions were as follows: “In what quantities/packaging did you usually buy
cigarettes?” for the pre-lockdown section, and “For your most recent cigarette purchase (during
lockdown), what packaging type did you buy? If you bought more than on pack type, choose one”
for the purchase during lockdown. The distribution of cigarette packaging types before and during
lockdown are shown in Table 11.
Table 11. Distribution of different types of packaging of cigarettes pre-lockdown and
during lockdown
Pre-Lockdown During Lockdown
N Packs Cartons Singles N Packs Cartons Singles
Males 7 152 57.4 36.7 6.0 6 635 42.7 38.9 18.4
African 1 395 67.0 8.7 24.4 1 214 37.2 5.8 57.0
Coloured 1136 78.8 16.0 5.2 1 048 53.4 12.2 34.4
Indian 546 69.4 29.1 1.5 504 47.0 43.1 9.9
White 4 075 46.5 53.0 0.5 3 869 40.9 56.0 3.0
Females 12 369 52.9 45.3 1.8 11 701 46.3 44.2 9.5
African 496 67.9 13.3 18.8 394 47.2 12.7 40.1
Coloured 2 625 77.1 19.4 3.4 2 456 55.8 15.6 28.7
Indian 457 68.3 30.9 0.9 414 46.1 44.9 8.9
White 8 791 44.0 55.6 0.4 8 437 43.5 54.0 2.5
Race
and/or
1 953 54.2 43.1 2.7 1 773 46.4 43.2 10.4
gender
undisclosed
Total 21 471 54.5 42.2 3.3 20 106 45.1 42.4 12.5
Prior to the lockdown, 20-packs of cigarettes were the most common packaging type for all races
and genders, except for Whites, who reported that 54% of their purchases were of cartons of
cigarettes. Except for White females, the lockdown period has been characterised by a shift away
from packs toward single cigarettes. On aggregate, while only 3.3% of people purchased single
cigarettes before lockdown, 12.5% reported that their most recent purchase was of a single
cigarette, while the proportion who purchased packs of cigarettes declined by around 9 percentage
points, accounting for the increase in purchases of single cigarettes. The proportion of people
buying cartons remained broadly unchanged, at around 42% both before and during the lockdown.
(e) Sharing cigarettes
One of the reasons for banning the sales of tobacco products, as explained by the Minister of
Cooperative Governance and Traditional Affairs, is that people spread the virus when they share
cigarettes (i.e. different smokers smoking the same cigarette).vii We investigated the prevalence of
sharing cigarettes by asking the following two questions in different sections of the questionnaire:
“Before lockdown, how regularly did you share the same cigarette with another person? (This
does not include offering another person a cigarette from the same box)”), and “In the last month,
20how regularly have you shared the same cigarette with another person? (This does not include
offering another person a cigarette from the same box)”). In each case the options were the same,
namely “never”, “rarely (less than 10% of the cigarettes I smoked were shared with others)”,
“sometimes (between 10% and 50% of cigarettes I smoked were shared with others)” and “often
(more than 50% of cigarettes I smoked were shared with others)”.
In Figure 2, we show the percentage of respondents who have shared the same cigarettes, based
on the categories defined above. Figure 3 shows the percentage change in the proportion of people
who selected each category, pre- and during lockdown. The results indicate that the number of
people sharing cigarettes has increased during the lockdown period. While 82% of people in our
sample had never shared the same cigarette before the lockdown, this decreased to 74% during
lockdown (the difference being statistically significant at the 1% level). At the same time, the
percentage of people who shared cigarettes 50% or more of the time grew from 1.7% of the sample
before the lockdown, to almost 9% of the sample during the lockdown (also statistically significant
at the 1% level). The equates to a 430% increase in the number of people reporting sharing
cigarettes more than 50% of the time (Figure 3) .
Figure 2. Percentage of respondents who have shared the same cigarette, pre-lockdown and
during lockdown (n= 21 526)
90,0
81,9
80,0
74,2
70,0
60,0
50,0
40,0
30,0
20,0
13,3
9,3 7,7 8,9
10,0
3,1 1,7
0,0
Never 50% of the time
Pre-lockdown Lockdown
Note: For differences in proportions test, the tests for all four groups produce P-values of 0.00, thus significant at the 1% level.
21Figure 3. Percentage change in number of people who have shared the same cigarette
between the pre-lockdown period and the period during lockdown
500,0
430,4
400,0
300,0
Percentage change
200,0
148,7
100,0
0,0
-9,4
-30,5
-100,0
Never 50% of the time
(f) Cigarette brands and their manufacturers
There has been a proliferation of new brands during the lockdown. For purchases during lockdown,
93 distinguishable brands were identified by respondents. We were able to identify the
manufacturers of 72 brands; the manufacturers for the remaining 21 brands are labelled as “other”.
Using these manufacturers, we categorise each brand into one of two groups, either multinational
companies (MNCs, comprising British American Tobacco (BAT), Philip Morris International
(PMI), Japan Tobacco International (JTI) and Imperial Tobacco) and non-MNCs. The non-MNC
brands are mostly produced by local/regional companies, many (although not all – Amalgamated
Tobacco Company being an important exception) affiliated with the Fair-Trade Independent
Tobacco Association (FITA). Non-MNC brands also covers a small percentage of brands that are
imported, and include a broad category of brands labelled with a Sinitic language (i.e. no Western
script on the pack) (1%).
In Table 12 we indicate the percentage of respondents, broken down by race and gender, who
smoked MNC brands before the lockdown (based on round 2 data), between 29 April and 11 May
(based on round 1 data), and between 4 and 19 June 2020 (based on round 2 data). The percentage
of smokers who smoked non-MNC brands is simply 100 minus the numbers reported in Table 12.
Appendix C notes in detail why one should be careful when comparing round 1 and round 2 data.
In this case, since we consider the evolution of the tobacco market over the duration of the
lockdown period, we include round 1 data in the table, but we nevertheless urge the reader to use
caution in interpreting the results.
22Table 12. Percentage of smokers who smoked multinational companies’ brands pre-
lockdown and during lockdown
29 April - 11 May 4 June - 19 June
Pre-Lockdown
(Round 1) (Round 2)
N Percentage N Percentage N Percentage
Males 6 985 77.2 3331 37.5 6454 19.9
African 1 344 74.6 665 35.2 1166 23.9
Coloured 1 093 77.8 517 37.1 1015 16.4
Indian 535 84.5 238 55.9 491 35.0
White 4 013 76.9 1911 36.2 3782 17.6
Females 12 176 76.4 3217 38.2 11416 17.4
African 479 83.7 172 50.6 381 24.4
Coloured 2 563 82.9 727 40.4 2396 17.5
Indian 452 81.9 130 53.1 404 32.2
White 8 682 73.8 2188 35.6 8235 16.3
Race and/or
gender 1 901 80.2 569 40.8 1699 19.5
undisclosed
Total 21 062 77.0 7 116 38.1 19 569 18.4
Notes: The pre-lockdown columns relate to round 2 data. Multinational companies include British American Tobacco,
Philip Morris International, Japan Tobacco International, and Imperial Tobacco.
Results show a marked shift away from MNC brands toward non-MNC brands during the
lockdown. Before the lockdown, 77% of respondents smoked brands produced by the MNCs. This
proportion essentially halved by the time of the round 1 survey, in which only 38% of smokers
indicated that they smoked MNC brands. By the time of the second survey, only 18.4% of smokers
reported that they smoked MNC brands.
In Table 13, we indicate the shares of the most popular cigarette manufacturers before the
lockdown and during the lockdown (for both rounds of data collection). For this analysis, we
weight each respondent’s response with the average daily number of cigarettes smoked by him/her
in the various time periods, to get a sense of the full market within our sample. For example, a
person who smokes 20 cigarettes a day will have double the weight in this analysis of a person
who smokes 10 cigarettes a day. Please note that we do not claim that this categorisation is
nationally representative, since our sample is not representative of the smoking population.
23Table 13. Individual companies’ share of cigarettes bought by respondents in our survey,
pre-lockdown and during lockdown: Round 1 and Round 2
Manufacturer Before lockdown Round 1 Round 2
proportion proportion proportion
BAT 48.0 19.7 8.7
JTI 15.3 7.2 4.1
GLTC 12.2 27.1 26.3
Philip Morris 11.5 9.2 4.4
Carnilinx 5.5 11.9 14.3
Pacific Cigarette Company 1.9 3.6 7.9
Amalgamated Tobacco 1.9 4.4 9.6
Best Tobacco 1.5 6.3 10.7
Afroberg Tobacco Company 0.5 3.6 3.4
Protobac 0.4 2.2 0.4
Olomide 0.2 0.2 2.2
Folha 0.1 0.5 0.4
Smokey Treats 0.1 0.0 0.0
Imperial Tobacco 0.0 0.0 0.0
Mastermind Tobacco 0.0 0.3 0.4
Other 1.1 3.8 7.3
Total 100 100 100
Notes: Pre-lockdown shares are based on round 2 data; shares for 29 April to 11 May 2020 are based on round 1 data;
shares for 4 June to 19 June are based on round 2 data. All individual responses are weighted by their declared
consumption. The observations, weighted by consumption, for each category are N=345 992 (pre-lockdown),
N=108 691 (round 1) and N=242 541 (round 2).
Results show that the distribution of producers has changed dramatically between the pre-
lockdown period and during the lockdown. Before the lockdown, the market for cigarettes was
concentrated in the top 4 producers, who made up 87% of the market. 2 By the time of the round 2
survey, this same market share (87%) is made up by the top 8 producers. This indicates that the
market for cigarettes has become substantially less consolidated during the lockdown.
The relative position of MNCs and non-MCS has also changed considerably during the lockdown
(Table 13). While three of the top five producers were MNCs prior to the lockdown, no MNCs are
in the top five in the “during-lockdown” period. In fact, all four MNC producers (British American
Tobacco, Philip Morris, Japan Tobacco International and Imperial Tobacco) have lost substantial
market share during the lockdown, while the market shares of the local producers have increased.
British American Tobacco (BAT) has taken the biggest knock as a result of the sales ban. While
around 48% of smokers in our sample bought BAT brands before the lockdown, BAT’s market
2
Please note that when we mention “market share”, we are referring to the sample, where each person is weighted
by his/her daily consumption. We do not claim that this is representative of the national market shares, as they
would be reported in publications by Euromonitor or Global Data, for example.
24You can also read