Chengdu Hosted in Southwest University for Nationalities
←
→
Page content transcription
If your browser does not render page correctly, please read the page content below
CFA Institute Research Challenge
                Hosted in
              Chengdu
 Southwest University for Nationalities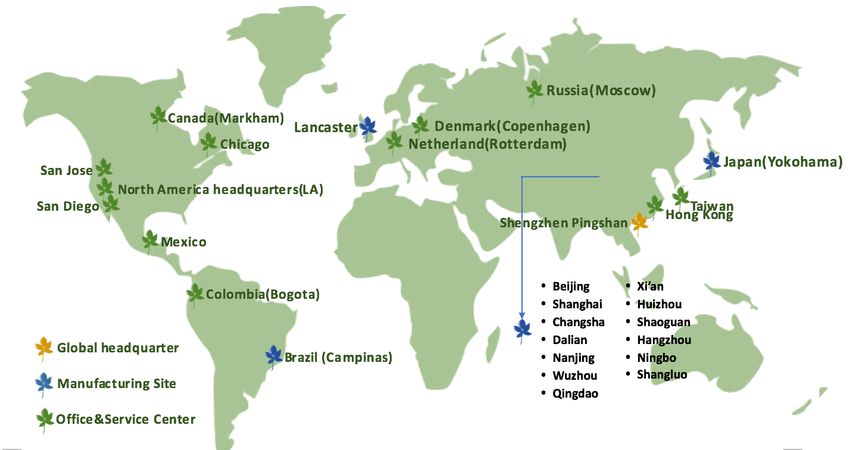
Student Research
Manufacturing Sector: New Energy Industry
This report is published for educational purposes only by students Hong Kong Exchange (HKEx)
competing in The CFA Institute Research Challenge
BYD Company Limited
Date:31-Aug-2016 Closing Price: HKD54.00 Recommendation: BUY (20.17% upside)
Ticker: BYDHK: Wind Database CNY1.00: HKD1.18 Target Price: HKD64.89 (CNY54.86)
Executive Summary
Table 1: Market Profile BYD Company (Hong Kong) Limited (BYDHK or the Company) is a Chinese manufacturing
Market Profile company, which covers three main areas: Automobile Business (AB), Handset Components and
Assembly Services (HC&AS), and Rechargeable Battery and Photovoltaic Business (RB&PB).
Closing Price HKD54.00
Investment Recommendation
52-Week High/Low HKD54.00/HKD30.50
We issue a Buy recommendation on BYDHK with a four-month target price of HKD64.89, that is
Average Volume(1Y) 6,122,016 20.17% over its August 31, 2016 closing price of HKD54.00. Our target price is primarily based on:
Diluted Shares Out 2,728,142,855 Investment Thesis and Outline
Market Cap(HKD in Backed by a promising industry outlook, BYDHK continues its leading position in new energy
Millions) 16,436
industry. The combination of the Sum-of-The-Parts valuation and current market view of BYDHK’s
Beta 1.19
every sector suggest that the stock price of BYDHK is undervalued. This represents an opportunity
EV/EBITDA 24.52 to invest in China’s new energy industry. After determining BYDHK’s exposure and mitigants to
P/B 3.88 investment risks and evaluate the corresponding impacts on valuation, we arrived a Buy
recommendation.
P/E 44.37
• Promising Industry Outlook, with the rising concern over environmental and energy problems,
Source: Wind Database
and strong policy support for new energy industry, the demand of new energy market is on the
rise.
Table 2: Valuation
• Leading Position in New Energy Vehicle (NEV) Market, BYDHK occupied the market share
Valuation of around 27% of Chinese NEV market, and with its advanced battery technology and vertical
integration ability, and independent research and development (R&D) technologies which will
Valuation DCF Multiples soon be used in every BYDHK’s NEV, it is believed that this will enhance BYDHK’s competitive
Estimated Price HKD74.60 HKD55.18 position and will at least secure BYDHK’s market share.
- BYDHK is expected to reach RMB122.8 billion in NEV market by 2020.
Weights 50% 50%
- In HC&AS field, BYDHK will get more orders from manufactures in its filed through its new
Target Price HKD64.89
material and advanced technologies.
Source: Team Calculations • Highly Integrated Business Mode, BYDHK believes through integrating solar power, energy
storage and electrified transportation together can achieve company’s main strategy, this will
drive BYDHK:
Figure 1: Monte Carlo Simulation - More competitive in energy field by reducing manufacturing costs.
30000
Sell Hold Buy
- Fully integrating new energy market from electric power generation to electric storage, and
25000 4.19% 35.21% 60.6% finally to electric applying in NEVs and other fields.
Frequency
20000
• Sum-of-the Parts Valuation, using the Discounted Cash Flow (DCF), and three ways of
15000 Relative Multiples Valuation to value AB, HC&AS and RB&PB separately.
10000
• Investment Risks, including regulatory, market, and operational risks that were assessed 1) for
5000 impact and likelihood and subsequently ranked in a risk matrix, and 2) modeled through a Monte
Carlo simulation.
0
- The results of the Monte Carlo simulation show: 60.6% of the simulations support a buy
recommendation, 35.21% support a hold recommendation, and 4.19% support a sell
Sell Hold Buy
recommendation.
Source: Team Calculations
Table 3: Key Financials and Ratios
Figure 2: Share Price Movement Key Financials and Ratios
70 4500 2014 2015 2016F 2017F 2018F 2019F 2020F
4000
60
RevenueҁCNY in Billions҂ 55.4 77.6 101.5 120.9 145.6 177.0 217.1
3500
50
Net ProfitҁCNY in Billions҂ 0.7 3.1 5.2 7.3 10.0 13.4 17.8
Hang Seng Index
3000
Price Per Share
40 2500 Net Profit Maigin 1.34% 4.04% 5.15% 6.03% 6.86% 7.57% 8.21%
30 2000
Fixed Asset Turnover 1.49 1.99 2.15 2.31 2.46 2.60 2.74
1500
20
1000
Long-term Liabilities to Assets 0.12 0.10 0.06 0.05 0.03 0.02 0.02
10
500 Interest Coverage 1.53 3.07 3.80 4.71 5.72 6.43 7.05
0 0
Earnings Per Share (EPS) 0.18 1.12 1.75 2.48 3.42 4.61 6.16
BYDHK HSCI.HI Return on Equity (ROE) 2.56% 8.71% 9.33% 11.47% 13.52% 15.29% 16.86%
Source: Wind Database Source: Company Data,Team Calculations
1
Figure 3: Milestones of BYDHK Business Description
Founded in February 1995, BYDHK was listed on Hong Kong Stock Exchange and Shenzhen Stock
1995: BYD Company founded, with capital Exchange in July 2002 and June 2011, respectively (Figure 3). BYDHK principally engaged in AB
of RMB2.5 million and 20 members including traditional fuel-powered vehicles and NEV, as well as handset, computer components and
assembly services, and BYDHK is also developing other new energy products such as
rechargeable battery (RB), solar power station, energy storage station, LED business, etc.
2002: Listed on the Hong Kong Stock
Exchange Main Board (1211.HK) Currently, BYDHK has nearly 200,000 employees and 22 industrial parks in the globe. BYDHK has
reached revenue of RMB43,745 million in the first half of 2016 (1H16) (Figure 4), representing a
year on year (YoY) increase of 43.74%, having made a profit of RMB2,260 million with YoY growth
2003: Purchased Xi’an Tsinchuan of 384.23%. The earnings per share was RMB0.87, implying a YoY increase of 359.90%.
Automobile Company Limited Automobile Business
In 2003, BYDHK purchased Xi’an Tsinchuan Auto Co.,Ltd and formed the present BYD Auto Co.,Ltd,
2007:BYD-E listed on the Hong Kong Stock which formally symbolized its entry into the vehicle manufacturing and selling. Nowadays, BYDHK
Exchange Main Board(0285.HK) has established six industrial parks of auto industry. The automobile products include high, medium
and low end of fuel cars, and also include auto mold, auto parts, dual model electric vehicles and
2008: Warren Buffett invested $232 pure-electric vehicles. The total sales volume of car increased to 180,000 with the YoY growth of
million to take a 9.89% stake in BYDHK -14.28% in 1H16 (Figure 5). Comparing with the decline in sales volume of fuel cars, NEV has
realized a rapid growth, whose sales volume has increased to 49,000 with YoY growth of 130.74%
and ranks the first in the world reaching out to 190 cities in 43 countries of six continents. In public
2011 BYD (002594.SZ) was listed on the
Shenzhen Stock Exchange transportation, BYDHK will continue to expand the application of pure-electronic buses and taxis in
global markets. BYDHK has successively won the UN-DESA Energy Grant and Zayed Future Energy
Prize since its popularization and application of the green energy.
2014: BYDHK announced the “5-4-2
Initiative” for NEV Handset Components and Assembly Services
As one of the most comprehensively competitive HC&AS suppliers around the world, BYDHK
provides vertically integrated one-stop services from whole product design, component
2015: BYDHK launched “7+4” Vehicle manufacturing to assembly services for both domestic and overseas markets, and also provides
Electrification Strategy other electronic products’ design, component production and assembly services. According to the
interim report in 2016, this business realized a revenue of approximately RMB16,293 million, of
Source:Company Data which 95.03% came from its holding company-BYD Electronic (International) Company Limited
(BYD-E) (Figure 7). Handset assembly mainly including EMS and ODM and metal casing are the
products that contribute most to the revenue of this business.
Rechargeable Battery and Photovoltaic Business
Figure 4: 1H16 Revenue Breakdown BYDHK’s RB business mainly includes the lithium-ion battery and nickel battery, which are widely
used on handsets, digital cameras, power tools, electric toys and all areas of portable electronic
devices. And, BYDHK also actively researches on and develops power batteries, energy storage
batteries and solar battery products to be applied in the NEV, storage power station and
photovoltaic power station. The company focuses on the new energy chains to provide clients with
the integrative solutions in power generation, storage, transmission and utilization. Several solar
programs of BYDHK have already successively operated in the international markets, including the
United States, German, Japan, United Kingdom, Indian and South Africa, having recorded the
revenue of RMB4.06 billion in 1H16 and turned around with a profit (Figure 8). Meanwhile, BYDHK
has its advanced Double-glazed Solar Photovoltaic module technology, which has a longer product
life cycle and more durable than other products.
Strategy
• Three Green Energy Dreams. This is the final vision of BYDHK to realize the zero emission,
zero pollution, green energy solutions of the whole industry chain from power generation, storage,
transmission to usage (Figure 9).
Source: 2016 Interim Report • The Strategy of Vigorously Developing the NEVs
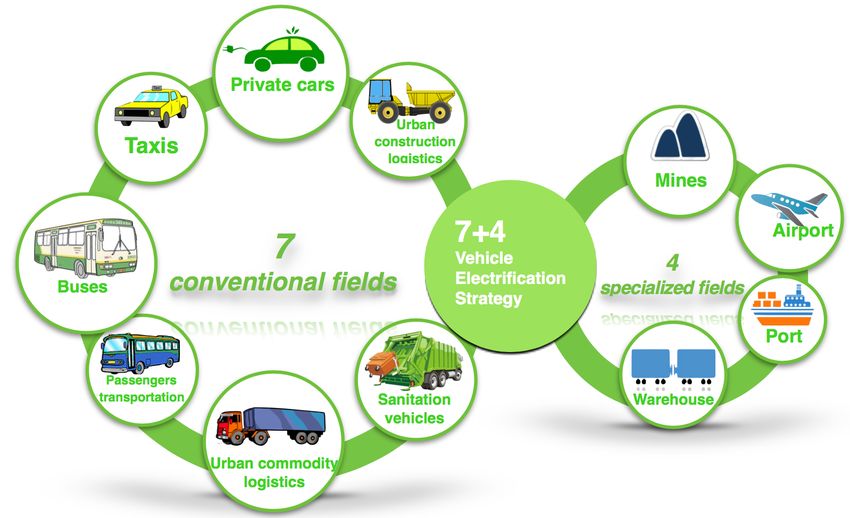
- BYDHK put forward the “7+4” Vehicle Electrification Strategy (“7+4”) (Figure 6), sparing no
efforts to realize the market diversification. “7+4” refers to popularizing the NEV and realizing
its overall coverage in seven conventional fields (private cars, buses, taxis, sanitation
vehicles, urban commodity logistics, passengers transportation and urban construction
logistics) and four specialized fields (warehousing, mines, ports and airports).
Figure 5: Sales Volume and
YoY Growth of AB
Figure 6: “7+4”
0.6 2
0.5
1.5
0.4
1
Million
0.3
0.5
0.2
0
0.1
0 -0.5
2006 2007 2008 2009 2010 2011 2012 2013 2014 2015 1H16
sales volume of BYDHK' A&B yoy BYDHK'volume growth
Source: Company Data,Team Calculations Source: Official Website
2
Figure 7: HC&AS’s Revenue - In April 2014, BYDHK published the “5-4-2 Initiative” target for the NEV in the future and
and YoY Growth redefining the standards of the NEV from three aspects: performance, security and fuel
35 50%
consumption. As for the “5-4-2 Initiative”, “5” represents the 0 - 100 km/h acceleration time of
30 40% less than 5 seconds, “4” refers to electric four-wheel drive, “2” means within 2 liters of fuel
25 30% consumption per 100 km. In the future, most of BYDHK’s NEV will implement the standard of
20 “5-4-2 Initiative”.
Growth
20%
billion
15 10%
• Low-cost Strategy
10 0% - BYDHK makes the vertically integrated industry chain in all three businesses, adheres to self-
5 -10% owned brand, independent R&D, forges one-stop service with the core of R&D design and
0 -20%
independently assembly manufacturing.
20092010201120122013201420151H16
- BYDHK enters into the market by selling and also actively plans, optimizes technological
BYDHK BYD-E Growth of BYDHK process in the field of new energy҅lowering the per unit production cost through economies
Source: Annual Report of scale.
- In June 2016, BYDHK signed the “Cooperative Framework Agreement on the Exploitation of
Figure 8: The Revenue of Lithium Resources in Salt Lake” with Qinghai Salt Lake Industry Co., Ltd(QHSL) and
RB&PB Sector Breakdown Shenzhen Hongdatong Industry Co.,Ltd, in developing the lithium resource of the Salt Lake
together and lower the production cost from the upstream.
700
600
500 Corporate Governance
Thousand
400
Shareholder Structure
300
As of July, 2016, Wang Chuanfu is the first major shareholder, also the ultimate controlling owner,
200
owning 18.79% of the common shares directly. On the whole, three top managers (Wang Chuanfu,
100 Lv Xiangyang and Xia Zuoquan) of BYDHK own 38.08% of the outstanding shares directly or
0 indirectly (Table 4), and 16.15% of all common shares are held by corporations and institutional
2010 2011 2012 2013 2014 2015 1H16
Revenue investors. The public owns the remaining 45.77% (Figure 10) (Appendix 22).
Source: Annual Report,Team Calculations Corporate Governance
The appraisal system of corporate governance mainly consists of equity structure, dividend policy
and organization structure.
Figure 9: Three Green Dreams • Equity Structure: the gap of shareholding ratio among the major shareholders of BYDHK is
quite small and the inside directors account for the largest proportion of shares among the top 10
major shareholders while the Board of Directors owns the high control power, which is beneficial
for the company’s sustainable development but goes against the protection of minority interests
(Appendix 26).
• Dividend Policy: dividend instability will be detrimental to equity financing since BYDHK’s
higher research and development cost and it needs to unload the last year’s profits as the next
year’s capital (Appendix 27).
• Organization Structure: BYDHK owns the Board of Directors, Board of Supervisors, CEO and
Source: SINA all kinds of committees.
- Board of Directors, which has complete structure, meets the relevant regulation of the
Table 4: Shareholding of Top corporate law and rich experienced members can provide constructive feedbacks and
Management development direction for our company’s development. As the founder of the company as
well as the major stockholder, the inside board has strong control power of the company,
Shareholding of Top Management which is conducive to the company’s continuous and stable development but against the
Directly Indirectly
internal supervision (Appendix 23).
- Board of Supervisors, which has complete structure, conforms with the relevant regulation
Wang Chuanfu 18.79% 0.18% and the rich experienced members, whose average educational background are
undergraduate course, can provide effective and scientific supervision for the company. The
Lv Xiangyang 8.77% 5.96%
supervision of the board of supervisors will be more powerful if the outside and inside boards
Xia Zuoquan 4.36% 0.02% of supervisors could be supplemented with each other. Besides that, the average age of the
supervisors except for the chairman of the board of supervisor is 42.5, so the board of
Source:Company Data supervisor performs well.
- CEO has the strong control power and performs well but it will be detrimental to realizing the
scientific decision and well supervision since it plays multiple roles and has the absolute
Figure 10: Shareholder Structure control power in the company (Appendix 24).
- Committee with complete inside control system meets the standard and manages well.
Overall, the corporate governance is in accordance with its articles of association, without any
obvious conflict. It is reasonable to conclude that nowadays BYDHK manages and operates well,
but still exists risks.
Social Responsibility
BYDHK has established the CSR supreme decision-making body—CSR Management Council,
defining the management method of CSR, organizing and formulating the unified CSR working plan
to make CSR management identification and standardization and realize the unified organization
and effective management of CSR work. BYDHK did well in social responsibility, environmental
Source:Company Data protection, employee policies and it has received a number of awards and honors (Appendix 25).
3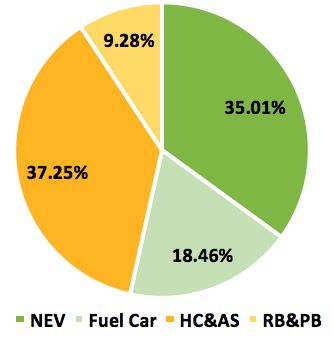
Figure 11: Real GDP Industry Overview and Competitive Positioning
10.0
Macro Economic Analysis
8.0
6.0
• The growth of macro economy has slowed down, but progressed steadily, In 2016,
global economy has made deep changes. Developed economies are recovering slowly while
4.0
economic growth rate of emerging countries is decreasing. With the growth rate of 6.7% 1H16,
2.0 China has seen a drop in its growth. But the government moderately expanded its gross demand,
0.0 actively promoted the structural reform on supply, which makes the national economy increases
2013
World
2014 2015 2016F 2017F 2018F
Advanced Economies
while maintaining steady (Figure 11).
United States EMDE*
China India
• The income of urban and rural residents remains fast growth, and potential
Source: IMF consuming capacity is improving, in recent years, fast growth of China’s economy has made
the income of urban and rural residents remain faster growth, and per capita consumption
Figure 12: Contribution Rate expenditure is increasing. In 2015, China’s ultimate consuming contributed 66.4% of economic
of Combustion to GDP growth, which is 14.8 percentage point higher than in 2014 (Figure 12).
100 • Supportive Policies
90
80 - Stimulus of the Demand in NEVs
70
60 • Measures to Manage Quota on New Energy Vehicles’ Carbon Dioxide Emission
50 (Consultation Document).
• Development Plan for Energy Conservation and New Energy Vehicles
40
30
20 • Assessment Measures for New Energy Public Transportation Promoted Application (Trial)
10
0
• Notice on the 13th Five-year Plan in relation to the Incentive Policies on New Energy
1979 1985 1991 1997 2003 2009 2015 Vehicle Charging Infrastructure and the Promotion of Application of New Energy Vehicles.
- Government Subsidies for Photovoltaic Electric Price
Source: Wind Database,
• Subsidies compensated by National Development and Reform Commission has given great
iFinD Database impetus to the development of photovoltaic business.
- Policies Overseas
Table 5: Electric Price of • Energy Independence and Security Act
Photovoltaic • National Policy Energy Act
2015 2016 Industry Analysis
Resource Photovoltaic Photovoltaic Cities in Each
Region Electric Electric Region
Price Price • Automobile Industry
Ning Xia,Hai
- Automobile industry is growing slightly in whole. The growth of fuel cars is
RMB0.90 RMB0.80 Xi(Qing Hai),Jia weakening, but the growth of NEV is strong. Traditional fuel cars still dominate market
Ⅰ Region per kwh per kwh Yuguan(Gan share, but the growth of traditional vehicles field has been slowing down in recent two years.
Su),Ha Mi(Xin
Jiang),etc By virtue of favorable policies and technological progress, new energy market is developing
Beijing,Tianjin, aggressively. NEV’ substitution for fuel cars already has the realistic base (Figure 13).
Ⅱ Region
RMB0.95
per kwh
RMB0.88
per kwh Hei Longjiang, - Carmakers will increase input on industry segments and competition in these
Sichuan,etc
fields will be fiercer. Sport utility vehicle (SUV) has remained strong growth since 2013
Other cities
Ⅲ Region RMB1.00 RMB0.98 except in Ⅰ, Ⅱ and HAVAL H6 tops the SUV sales; BYDHK has become the technological innovator in NEV
per kwh per kwh region industry (Figure 14).
Source: National Development and - Subsidy policy of new energy has been adjusted. NEV industry will become more
Reform Commission standardized. China is gradually making adjustments in NEV subsidy policies. They have
the intention of turning NEV industry from driving by policy to driving by market and
upgrading the technology by combating subsidy frauds and regulating the development.
Figure 13: YoY Industry Growth - The popularized application of Internet of vehicles has become a developing
400.00%
trend. The industry will focus more on the application and progress of technology, and smart
350.00% driving will become the new growth point of this industry.
300.00%
250.00% • Handset Components and Assembly Services Industry
200.00% - The handset market is gradually saturated and will remain slight growth. Global
150.00%
100.00% shipment of smartphones raises only 0.2% to 0.678 billion handsets in 1H16, which is the
50.00% slowest YoY growth over the years. According to IDC, its growth speed will decline little by
0.00%
2010 2011 2012 2013 2014 2015 little, at an expected CAGR of 4.1% from 2016-2020.
YOY Growth of Fuel Car Industry
YOY Growth of NEV Industry - China will still be the largest smartphone market in the world. Smartphones
YOY Growth of SUV Industry
promoted by China’s brand manufacturer account for 42% of global market share. China’s
Source: CAAM,Team Calculations shipment of smartphones is 235 million in 1H16, with YoY growth of 13.0%.(Figure 14)
- Penetration of metallic parts is promoting rapidly. Sound mechanic performance and
outstanding appearance have contributed to improving the recognition of metal casings.
Figure 14: Smartphone Shipments Metallic parts are used commonly. Their market volume is expanded (Figure 15). Competition
in terms of seizing the market share among FIH Mobile Limited (FIH), Catcher Technology
Co.,Ltd, TongDa Group Holdings Limited (TongDa) and BYD-E is becoming fiercer and
fiercer. Each supplier enlarges the production capacity of CNC, improves product yield and
production efficiency, and stays competitive.
- Consumer electronics undergo frequent upgrading and fast market changes.
Updated needs of the consumers make this industry upgrade quickly. Although metal shell is
very popular now, 3D glass casing has made first appearance.
• Rechargeable Battery and Photovoltaic Industry
- Needs of traditional battery are weakening. The growth of global consumer electronics
is pacing down, but they still remain greater consumption; their competition is fierce, and
Source: Wind Database,
iFinD Database needs for lithium-ion battery and nickel battery are expected to remain in weak state in future
market (Figure 16).
4Figure 15: Utilization of Metallic Parts - Power battery and energy storage battery have increased rapidly and are
40% extremely competitive. With the aid of the rapid growth of NEV, many battery suppliers
35% are increasing their R&D investment in this field, expanding the production capacity so that
30%
they can catch the opportunity of the fast growth in market (Figure 17). The future
25%
competition will be expected to be very fierce.
20% - Opportunities and challenges coexist in photovoltaic. After terrible shuffle in the
15%
previous years, the whole industry reentered into growing path in 2015. Installed capacity
10%
has been growing rapidly, and it is expected to remain stable and orderly in its growth during
5%
the period of 13th Five-Year Plan. However, market competition is still severe and downward
0%
2012 2013 2014 2015 pressure on price is larger.
Source: News Competitive Positioning
• Technological threshold diminishes the threat from new entrants. Fast development of
Figure 16: Volume of 3C in Main NEV benefits BYDHK as a leading company in this industry. BYDHK has mastered core
Manufacturing technology of cell, engine and electric control. In addition, BYDHK has established Central
250
Research Institute, Electric Power Research Institute and Auto Engineering Research Institute
200
concentrating on the R&D and application of technology (Figure 18).
• Fierce competition among existing rivalries. NEV is the main developing trend of future
100 Million
150
vehicles. All auto manufacturers make layouts in industrial segments. What the BYDHK faces not
100 only is the pressure of other domestic brands, but also seizes the global market share. Its new
50
energy passenger vehicle(NEPV) sales volume outside of China is nearly zero.
0 • Suppliers’ ability to bargain is limited. Industries such as auto parts, steel, glass and rubber
2009 2010 2011 2012 2013 2014 2015 are very mature. Together with QHSL, BYDHK develops the lithium mineral in Salt Lake and
integrates the upstream of industrial chain vertically.
Source: Wind Database
• Moderate bargaining power of customers. For HC&AS, revenue mostly depends on the
large orders of brand handset manufacturers. Therefore, the customers remain some ability to
Figure 17: 2015 Market Scale in bargain.
Li-coin Manufacturing
90% • BYDHK has long competitiveness. BYDHK insists on self-owned brand and self-research
81%
80% and development. It has set up Intellectual Property Department and has initiated Talents Training
70% 60.30%
Program. By self-researching and developing to promote automobile performance and reduce the
60% cost, adverse impacts on adjusting subsidy policies and decreasing local subsidy can be
50% counteracted. Then, cost performance can be promoted in whole; brand planning and media
40% 32.30% communication and planning department have been built to improve brand image; its business
30%
17% layout is comprehensive (Figure 19) (Appendix 21).
20%
7.40%
10% 2% Investment Summary
0%
energy storage power parts 3C We issue a BUY recommendation on BYDHK with a 4-month target price of HKD64.89 by
2014 2015 combining a DCF Analysis and a Relative Multiples Valuation. This offers a 20.17% upside from its
Source: CNII closing price of HKD54.00 on August 31, 2016.This valuation is supported by numerous merits, as
outlined below, as well as concerns taken into consideration.
Figure 18: Porter's Five Forces MERITS
• High Growth in Sales Revenue of NEV
- As the environmental and energy problems have become increasingly prominent, and
the government has paid more attention to the NEV industry, NEV industry will enter into
a period of rapid growth. (Figure 20).
- BYDHK is the leader in the field of NEV industry. In the aspects of strategy, the company has
implemented the "7+4" and "5-4-2 Initiative” with a clear management idea; in the aspects of
production, BYDHK is currently the only company mastered the core technology of electric
cars including cell, engine and electric control in the world, owning an obvious technical
advantage.
• Expectations on the Outbreak of Sales Revenue of RB&PB
Source: Team Calculations Rechargeable Battery Business
- With the widespread use of lithium battery in NEV and power storage station market, BYDHK
RB will enter into a new period of growth.
- BYDHK has the technological superiority on the RB. Owning the key technology, BYDHK’s
Figure 19: SWOT Analysis lithium iron phosphate battery takes the domestic market share of more than 25%, ranking
first. In the aspect of ternary batteries, company has a long-term accumulation of R&D as well
as full technical reserves. The ternary batteries have been put into use in the plug-in hybrid
electric vehicle (PHEV).
- BYDHK has the advantages on battery production capacity. BYDHK had built the world's
largest lithium iron phosphate battery production base in 2015. The company expands the
capacity of lithium battery, and is expected to reach more than 13GWH in lithium battery
production capacity by the end of 2016 (Figure 21).
Photovoltaic Business
- There are opportunities exist in the field of photovoltaic industry. In 2015, the global
photovoltaic installed capacity has a rapid growth, and the newly increased installed capacity
Source:Team Calculations
in China hit a record high. Although the product price in photovoltaic industry still maintained
long-term low (Figure 22), it may bring the explosive growth of sales revenue to BYDHK with
the development of the photovoltaic industry. 5Figure 20: Sales Volume of NEV Industry - BYDHK has the advantages of industrial chain in the photovoltaic business. In the terms of
1.8 the photovoltaic business, BYDHK is planning a complete new energy industry chain, which
1.6 provides customers an integration scheme with the power generation, transmission and
1.4
storage of electricity. It is unique in the global market.
1.2 •Sustainable Development of HC&AS
- The shipment of the global smartphone market slowed down, but the replacement rate of
Million
1
0.8 intelligent mobile phone will maintain steady growth. And, metal casing expands the scope of
0.6 application from the high-end models to low-end models with its superior quality and
0.4 performance, and is expected to have more shares in the future.
0.2
- BYDHK has the advantage of technology. In the application of key raw materials, BYDHK has
0 developed PMH technology, realizing the Nano-level fusion of metal and plastic and solving
2011 2012 2013 2014 2015 2016F 2017F 2018F 2019F 2020F
sales volume of NEV industry sales volume of BYDHK's NEV
signal problem. In the aspect of design, the company has SBID technology and can meet the
needs of high-end mobile phone manufacturers.
Source: CAAM,Team Estimates - Keeping cooperation with major manufacturers. Its assembly business gained EMS orders
from the domestic leading brands of smartphones in 2015, and is expected to continue the
cooperation in the future.
• Cost Advantage of the Vertical Integration Mode
Figure 21: Battery Capacity AB: most of BYDHK auto parts can achieve self-sufficiency. For the NEV, BYDHK can supply
three key parts of cell, engine and electric control.
14
12
Rechargeable Battery Business: BYDHK can product electrolyte diaphragm and cathode
materials by itself. And in 2015, the company joined efforts in developing lithium mineral with
10
QHSL , controlling the raw materials.
8
GW
6
Photovoltaic Business: BYDHK has a whole production chain from silicon, PV module to the
solar power station. By controlling the costs of raw materials, the company can minimize the
4
costs, equaling the cost of photovoltaic power with that of coal power. And coupled with the
2 layout of power storage station conducted by the company, it forms a strong synergistic effect.
0
2014 2015 2016F HC&AS: Thanks to the vertical integration platform, BYDHK has cut the product costs and
significantly reduce the development cycle.
Source: Wind Database
Valuation Method
We used a DCF, a Relative Multiples Valuation. The weight of each method is equal to 50%.
Concerns(Possible Investment Risks)
Figure 22: Polycrystalline’s Price
• Policy Risks: The demands of NEV may be in an insufficient situation, which will be incapable
60
of completing the target sale volume. Decelerated growth of China’s GDP, declining policy
subsidies, and insufficient support of the government may affect the sales of NEV.
50
40
• Industrial Risks: 1)The prospect of NEV industry attracts more manufacturers to research the
NEV, increasing competition. 2)The demands for nickel battery decreased year by year, and it will
RMB
30
affect BYDHK's revenue in a way. The prior-period investment of BYDHK was mainly in the R&D
20 of the iron battery, so it does not have an absolute advantage in the production of the ternary
10 battery. If the ternary batteries become the main trend in the future, the company will not have the
absolute competitiveness. 3) The product prices of photovoltaic industry may slump in the future,
0
and competition will be more intense in such an environment. 4) The saturation of global
smartphone and computer markets will aggravate competitions among existing competitors.
• Operational Risks: The company's brand image needs to be improved. The appearance
Source: Wind Database design has been criticized for a long time; the amount of the quality complaints of fuel vehicles
has ranked near the top in the last year; staffs in some sales region appears serious violations.
The company's sales revenue will be negatively affected if it does not resolve the problems
existing in brand image and sales management.
Figure 23: BYDHK Share Prices and News Flow
70
Subsidies to BYDHK's New Energy bus program Financing
BYDHK popularized in
NEV in Beijing, and finished China's market is
60 American Energy completed
Shanghai crashing
market
50
Orders from abroad of
pure-electric bus; air
40 polution causes energy
saving
30
Smart Driving has been carried
out
20 BYDHK is plainning to raising
RMB15 billion after trading Chinese president Xi
Explosion of charge suspension in May
10 Jinpin visited BYDHK's
station for taxi in
factory in UK
Hong Kong
0
Dec-12
Dec-13
Dec-14
Dec-15
Jun-13
Jun-14
Jun-15
Jun-16
Aug-12
Aug-13
Aug-14
Aug-15
Aug-16
Oct-12
Oct-13
Oct-14
Oct-15
May-13
May-14
May-15
May-16
Nov-12
Nov-13
Nov-14
Nov-15
Jul-15
Jul-16
Feb-13
Apr-13
Jul-13
Feb-14
Apr-14
Jul-14
Feb-15
Apr-15
Feb-16
Apr-16
Sep-12
Sep-13
Sep-14
Sep-15
Mar-13
Mar-14
Mar-15
Mar-16
Jan-13
Jan-14
Jan-15
Jan-16
BYDHK
6Table 6: Valuation Valuation
Valuation
Estimated
Weights In order to estimate the share price of the BYDHK, we mainly used the following two valuation
Price
methods: a 5 years DCF and a Relative Multiples Valuation (Table 6).
DCF(CNY) 63.06 50.00% DCF Model
The DCF method is the discounted value of the free cash flow based on the predicted financial
P/E(CNY) 35.12 16.67%
statements, discounting to estimate the intrinsic value of BYDHK stocks. With the diversity of
P/B(CNY) 79.05 16.66%
BYDHK business and its stock ownership, we predicted the financial situation of BYD-E (HC&AS)
and remaining parts except for the mobile phone business (AB, RB&PB) five years after. We
EV/EBITDA(CNY) 25.77 16.67% calculated the free cash flow and equity value of two sections respectively, then added the stock
value of Holitech held by BYDHK, finally got the stock price by dividing the fully diluted shares
Target Price(CNY) 54.86 outstanding. According to the detailed analysis above, the target price is expected to be HKD74.60
(Table 7).
Target Price(HKD) 64.89
The base case for this model was formulated considering about BYDHK’s historical performance,
Source: Team Calculations our evaluations of industry outlook and its competitive positioning, and revenue growth among
businesses. The DCF is most sensitive to the following inputs, the derivations of which are
explained below:
Table 7: The DCF Model • Weighted Average Cost of Capital(WACC)
To better estimate the value, we calculated the WACC and cost of equity of HC&AS, and other
The DCF Model businesses (AB and RB&PB) respectively to reflect the cost and risk of each business. The revenue
BYD-E
Remaining
Buisinesses
Holitech of HC&AS (95.03% in 2016 interim report) mostly comes from its holding company: BYD-E. We
utilized two methods (CAPM and APT) to estimate the cost of equity (Appendix 9). For the CAPM,
PV of FCF/EV 1,981 247,368 17,561
we ran the linear regression of BYDHK’s stock yield against the HSCI for two time intervals(5-year
Less Net Debt 10,566 67,897 / monthly and 3-year weekly) and then averaged to calculate Beta (Appendix 8). And the Beta for the
Less Minority remaining businesses was calculated through comparable companies methodology, and then
Interest / 3,989 /
weighted it according to the operating revenue in 2015 (Appendix 10). The risk-free rate was based
Proportion of
Shares 65.76% 100% 12.59% on 1-year government bonds benchmark yield. The expected market return was the average return
PV of FCF of HSCI over the past ten years. We calculated the cost of debt by weighting and averaging the
Belonging to (5,646) 175,482 2,211 short and long term debt data adopted from 2015 annual report (Table 8) (Appendix 11).
BYDHK
Total EV of 172,047 • Revenue Growth
BYDHK For sales growth rate, we mainly forecast by using the sales of BYDHK's core business, that is the
Financial Data(in Millions) AB, RB&PB, HC&AS. HC&AS’s revenue is represented by BYD-E’s (Figure 27) (Appendix 13).
Fully Diluted
Shares AB: we added the revenue of the four parts together (fuel car excluding fuel SUV, fuel SUV, NEV
2,728
Outstanding excluding pure-electric bus, pure-electric bus) to get the AB’ revenue (Appendix 14).
(CNY) - Sales Volume Forecast: The sales volume of fuel vehicles shows a slow downward trend
Target Price under the condition that SUV sales rise. The NEV sales volume is expected to maintain a
(CNY) 63.06
rapid but stable growth, keeping an estimated annual growth rate of 35.86% of the industry;
Target Price 74.60 sales volume of pure-electric bus is expected to reach 23,747 in 2020 (Figure 24).
(HKD)
- Price Forecast: We used data from the BYDHK’s official website to calculate the average
Source: Team Calculations price of fuel car excluding fuel SUV, fuel SUV, NEV excluding pure-electric bus. Pure-electric
bus price was gotten from team calculations (Appendix 15). Then according to BYDHK’s
annual data of 2015 to adjust to the average price of four classifications, and we finally got
each price (Table 10).
Table 8: WACC Analysis Table 9: Relative Valuation
WACC Analysis Relative Valuation
HC&AS Remaining Businesses EBITDA(CNY in Millions) 11,036
EV from EBITDA(CNY in Millions) 130,330
Risk-free Rate 2.67% 2.67%
Less:Debt(CNY in Millions) 78,895
Beta 1.62 1.16
Plus:Cash and Cash Equivalents(CNY in Millions) 19,323
Market Risk Premium 5.58% 5.58%
Less:Minority Interst(CNY in Millions) 445
Cost of Equity from CAPM 11.73% 9.14%
Market Value(CNY in Millions) 70,312
Cost of Equity from APT 9.27% / Fully Diluted Shares Outstanding (in Millions) 2,728
Pre-tax Cost of Debt 0 4.86% Price from EV/EBITDA(CNY) 25.77
Earnings(CNY in Millions) 5,380
Average Tax Rate 11.91% 16.39%
Price from P/E(CNY) 35.12
Cost of Debt after Tax 0 4.06%
Book Value(CNY in Millions) 60,005
Weight of Equity 100.00% 81.73%
Price from P/B(CNY) 79.05
Weight of Debt 0 18.27%
Average Price(CNY) 46.65
WACC 10.50% 8.21% Average Price(HKD) 55.18
Source: Team Calculations Source: Team Calculations
7Figure 24: Sales Volume of RB&PB: RB welcomes a new round of outbreak because of the development of new energy
BYDHK’s A&B industry, and we have expectations to photovoltaic industry. Based on that, we calculated the
800
cubic equation of sales of RB&PB in line with the future time trend (Figure 25).
600 HC&AS: BYDHK plans to give the whole HC&AS to BYD-E, so we replaced the revenue of
HC&AS with BYD-E future sales forecast. After the regression on many variables, we have found
Thousand
400
that the semi-annual revenue of BYD-E highly fits semi-annual copper production reported by
National Bureau of Statistics of China (NBS), and the R-squared of the quadratic and exponential
200
equations of copper production in six months are very high (Appendix 16). Finally, we got the
0
forecast sales of BYD-E (Figure 26).
2016F 2017F 2018F 2019F 2020F
Pure-electric Bus NEV exculding Pure-electric Bus • Capital Expenditure
Fuel SUV Fuel Car(excluding Fuel SUV) - Due to changes in the business structure, capital expenditures will change significantly in the
Source: Team Calculations next five years: capital expenditures for NEV will increase substantially in order to implement
‘5-4-2 initiative’, to develop NEV and energy storage battery, and to upgrade technology to
Table 10: Price Estimate maintain its leading role; implement “7+4”, launch a variety of new models, realize
industrialization and cover the market.
Price Estimate - HC&AS expanded its production capacity (increased CNC equipment) in 2015; the growth of
(CNY in Thousands)
smartphones is becoming slow, which is not expected to have a greater capital expenditure in
Fuel Car Excluding Fuel SUV 54.58 the future.
Fuel SUV 74.30 • Terminal Growth
Terminal growth is based on the predicted inflation and the growth rate of new energy business.
NEV Excluding Pure-electric Bus 217.31 Considering handset and fuel automobile business have entered a mature business stage, and the
new energy business still has much development space, we predicted the terminal growth is 2.88%,
Pure-electric Bus 1335.07 the sum of the expected inflation rate and the growth rate of new energy.
Relative Valuation
Source: Team Calculations Because of the diversity of BYDHK, it was not easy to find a direct comparison of the company, so
we looked for comparable companies for each business. For the three major businesses of BYDHK,
Figure 25: RB&PB's Sales we looked for companies with a high degree of similarity in business or having a competitive
Revenue relationship in the business, covering Hong Kong, Taiwan, the Chinese Mainland and overseas
18
markets. First we calculated the average relative multiples of each business, then according to each
16
business share of predicted total revenue in 2016 to get the final P/E, P/B and EV/EBITDA, and
14
y = 18023x3 - 130526x2 + 367891x + 4E+06 then calculated them with 2016 forecasted EPS, EBITDA and BVPS to get three different share
12 R² = 0.93658 prices; finally we averaged the three to obtain the price of HKD55.18 (Table 9) (Appendix 12).
10
Million
8 Financial Analysis
6
4
Financial Condition 2013 2014 2015 2016F 2017F 2018F 2019F 2020F
2
0 Profitability
2010 2011 2012 2013 2014 2015 2016F 2017F 2018F 2019F 2020F
Source: Team Estimates Net Profit Maigin 1.56% 1.34% 4.04% 5.15% 6.03% 6.86% 7.57% 8.21%
Gross Margin 13.09% 13.77% 15.28% 17.79% 19.21% 20.69% 22.23% 23.83%
ROE 3.12% 2.56% 8.71% 9.33% 11.47% 13.52% 15.29% 16.86%
Figure 26: HC&AS’s Sales
Revenue ROA 0.99% 0.79% 2.72% 3.40% 4.26% 5.00% 5.64% 6.21%
70
60 Liquidity
50 Current Ratio 0.69 0.77 0.82 0.88 0.85 0.84 0.83 0.83
40
Quick Ratio 0.49 0.58 0.59 0.69 0.65 0.64 0.64 0.64
Million
30
Cash Ratio 0.10 0.07 0.09 0.22 0.20 0.18 0.18 0.17
20
10
Activity
0 Inventory Turnover 5.37 5.07 5.09 5.16 5.43 5.44 5.44 5.42
Accounts Receivable
Turnover 4.31 3.11 3.16 3.43 3.57 3.74 3.74 3.74
Source: Team Estimates Fixed Asset Turnover 1.42 1.49 1.99 2.15 2.31 2.46 2.60 2.74
Total Asset Turnover 0.64 0.59 0.67 0.66 0.71 0.73 0.75 0.76
Figure 27: Revenue Structure Financial Leverage
100% Total Liabilities to Assets 0.68 0.69 0.69 0.64 0.63 0.63 0.63 0.63
90%
33.5% 32.8% 31.7% 30.3% 28.6%
80% 42.4% Interest Coverage 1.76 1.53 3.07 3.80 4.71 5.72 6.43 7.05
70% 7.5%
6.3% 6.5% 6.8% 7.1% Total Liabilities to Equity 2.14 2.25 2.21 1.75 1.69 1.70 1.71 1.71
60% 9.4% 7.3%
7.4% 15.2% 11.9%
50% 19.2% Equity Multiplier 3.14 3.25 3.21 2.75 2.69 2.70 2.71 2.71
40% 25.7%
30%
Long-term Debt to Equity 0.35 0.38 0.31 0.17 0.13 0.09 0.06 0.05
20% 49.6% 53.2% 56.6%
41.1% 45.6% Long-term Debt to Assets 0.11 0.12 0.10 0.06 0.05 0.03 0.02 0.02
10%
24.4%
0% Shareholder Ratio
2015 2016F 2017F 2018F 2019F 2020F
NEV Fuel Car RB&PB HC&AS EPS (CNY) 0.23 0.18 1.12 1.75 2.48 3.42 4.61 6.16
Source: Company Data,Team Estimates Source: Company Data,Team Calculations
8Figure 28: Gross Margin Optimization of Business Structure Contributed by NEV's Sales Growth
Combined with the revenue structure in 1H16 (Figure 4) and BYDHK’s prospects, we estimate that
NEV will be the main force of the company’s revenue in the future. Due to the turnaround of
photovoltaic industry, RB&PB in BYDHK is expected to recover sluggishly. At the same time, the
market growth of smartphones and computers tends to saturation, and the HC&AS’s contribution to
total revenue is decelerating (Figure 27). The company will gradually form a new revenue model
dominated by NEV to create greater margins, which will increasingly bring more benefits to
shareholders than before.
Upgrading of Industrial Structure Conducive to Cost Savings
In the future, the revenue of BYDHK will increasingly rely on NEV. We expected that the gross profit
Source: Company Data, of BYDHK will be efficiently promoted (Figure 28), due to: 1) continuously increasing NEV sales
Team Calculations revenue, as the main source of revenue, will enlarge the company’s economies of scale and reduce
the unit cost (Figure 20). 2) BYDHK’s layout in NEV industry chain will decrease intermediate costs
Figure 29: Liabilities Structure substantially under the new revenue model.
100%
90% Capital Structure Optimized with Solvency Promoted
80%
70%
BYDHK’s long-term debts have an obvious drop with discharging a great deal of maturing debts in
60% 2015 and 2016. The company has financed RMB14.4 billion by private placement in July, 2016, and
50% to some extent, improved the structure of debt-equity. It is believed that the company will have less
40% debt burden in the long run implying long-term debts to assets decreasing with the continuous
30%
20%
increase in margin. And, the drop of debt burden significantly leads to the decline of financial cost,
10% which creates a favorable impact on net profit margin (Appendix 5). In addition, current liabilities will
0% account for more portion of total liabilities due to repayment of a large number of long-term debts
2014 2015 2016F 2017F 2018F 2019F 2020F
Current Liabilities Non-current Liabilites (Figure 29).
Source: Company Data, The Influence of NEV Market and Operating Capacity Keeping Rising
Team Calculations We estimate that BYDHK will keep the leading position in the future NEV market based on its
advanced industrial layout and leading-edge technology (Figure 20). Relying on the rapid
development of NEV market, the sales of BYDHK seems very optimistic. The rapid growth in sales
Figure 30: Total Asset&Fixed volume will effectively promote the inventory turnover and accounts receivable turnover speed,
Asset Turnover which can shorten the operating cycle (Appendix 6). It will also improve the liquidity of assets
3.00 (Figure 30)and make the utilization of assets more efficient, increasing the ROA level obviously
2.50 (Appendix 6).
2.00
Strong Operating Cash Flow Facilitating Reinvestment
1.50 The newly equity financing increased the capital strength of BYDHK and provided security
1.00 guarantee for capital expenditure and investment. We estimate BYDHK will increase investment in
0.50
the future, focusing on NEV and energy battery program (Figure 31). The growth of net profit mainly
benefited from NEV program will generate more and more operating cash inflow which will be used
0.00
2014 2015 2016F 2017F 2018F 2019F 2020F into reinvestment. Under the support of strong operating cash inflow and stable financial pattern, we
Total Asset Turnover Fixed Asses Turnover estimate the cash flow obtained by financial activities is stable (Appendix 3).
Source: Company Data,
Team Calculations DuPont Analysis
For the reason of rapid growth of the NEV sales volume, BYDHK’s net profit will obviously ascend
driven by uprating business structure. We forecast the ROE will increase, that of 2020 doubling
Figure 31: Reinvestment Ratio
more than that of 2015. Simultaneously, the rapid growth of revenue will promote asset turnover
efficiently better than 2015 and have a slow rise. Besides, thanks to the recent debt repayment,
equity financing and promising revenue growth, the company will maintain a stable financial pattern,
which means the total debt to equity will make a minor effect on ROE (Appendix 31).
Dividend Payment and EPS Analysis
We predict that BYDHK will not distribute dividend to shareholders and remain the present shares
outstanding in the next five years since its rare dividend payment in the past and the large
requirement of capital for investment in NEV industry. Shareholders will benefit from the continuous
rise in EPS whose rapid growth relies on the net profit mainly generated by increasing revenue and
gross profit (especially by NEV) (Figure 32).
Source: Company Data,
Team Calculations ROE Decomposition
2013 2014 2015 2016F 2017F 2018F 2019F 2020F
Figure 32: EPS (in CNY)
ROE 3.12% 2.56% 8.71% 9.33% 11.47% 13.52% 15.29% 16.86%
Net Profit Magin 1.56% 1.34% 4.04% 5.15% 6.03% 6.86% 7.57% 8.21%
Total Asset Turnover 0.64 0.59 0.67 0.66 0.71 0.73 0.75 0.76
Equity Multiplier 3.14 3.25 3.21 2.75 2.69 2.70 2.71 2.71
Source: Company Data, Source: Company Data,Team Calculations
Team Calculations
9Figure 33: Risk Matrix Investment Risk
Regulatory Risk
• Reduction of Government Subsidies and Shrink of Profit Margins (R1) / (High
Likelihood, High Impact)
- NEV: As the government subsidies for PHEV with a range of 100 to 150 kilometers reduced
from RMB31,500 to RMB25,000 per vehicle to 2020, the profitability of new energy business
would be shrinking (Appendix 17).
- Photovoltaic: Decline in subsidies for electricity prices due to the electricity market reform,
which weakens BYDHK’s profitability and financing ability and make it more difficult for the
construction and operation of photovoltaic power plants. In 2016, the electricity price of Class
I, Class II resource were reduced by RMB0.1 and RMB0.07 per kwh respectively and Class
III resource was decreased by RMB0.02 per kwh (Appendix 18).
Source: Team Analysis
Market Risk
Table 11: Mitigation
• Slowdown of China's Economic Growth (M1) / (High Likelihood, Moderate Impact)
Risks Mitigating Factors The slowdown of china’s economic growth leads to a serious overcapacity problem. The GDP
Regulatory risk growth rate of China has continued to decline (Figure 11). Since 2011, the GDP growth rate of
China has continued to decline. In 2012, the GDP growth rate has dropped below 8% while that
Government Rising sales of NEV, subsidies
barrier and technological in 2015 went down to 6.9% for the first time in nearly 30 years. The profitability and growth
Subsidies(R1)
innovation. capability of enterprises have been greatly restricted.
Market risks
The new energy market is • Foreign Exchange Risk (M2) / (High Likelihood, High Impact)
Slowdown of China's BYDHK's foreign exchange risk mainly exists in foreign business income, international
Economic during a period of
Growth(M1) development; the growth of procurement and assembly service business. We expect a rising trend of the exchange rate of
consumption maintains robust
HKD against RMB as a result of a continuous rise of exchange rate (HKD against RMB) since
Foreign Exchange Using financial tools to hedge December 2015. According to sensitivity analysis, the increase in exchange rate (HKD against
Risk(M2) foreign exchange risks RMB) by 2% will result in a target price drop from HKD64.89 to HKD63.73 (Table 12).
Absolute cost advantage; long-
Decline in Oil
Prices(M3)
term trends in new energy • Decline in Oil Prices (M3) / (Moderate Likelihood, Low Impact)
industry.
The decline in oil prices and its long-term maintenance will dampen consumers’ enthusiasm of
1.Huge demand;2.Competition buying NEV. It will benefit traditional fuel cars and restrain the demand for new energy cars in
impels improvement and the short term.
Unstable Market innovation; subsidies barrier;
Demand(M5) industry chain integration;
3.Structural optimum of mobile • Unstable Market Demand (M4) / (Moderate Likelihood, High Impact)
business
- Lack of charging pile: As of the end of 2015, China's NEV to its charging pile ratio is more
Operate risks
than 10:1, which severely inhibited its market demand.
Higher decision making
Corporate efficiency; Solidified cohesion - Consumers buy electric cars for policy incentives rather than their car needs.According to
Governance and enhanced competitiveness statistic, only 5% of the people purchase NEV out of their car requirements (Appendix 19).
Risk(O1) owing to the 2015 employee’s
stock ownership plan. - According to statistics, there are 64% of quality complaints of pure-electric vehicle with regard
RMB4 billion repaid the loans, to battery, and 36% of quality complaints of PHEV concerning engine.
Financial Risk(O2)
optimized the capital structure.
- Market competition intensifies. 1) AB: an increasing number of potential entrants in new
Low Consumer The cooperation with Center energy market. 2) HC&AS: oversupplied mobile phone casing and intensifying competition
Satisfaction(O3) Art will improve vehicle design
and enhance the brand image. among metal casing suppliers lead to a price fall of phone casing. The profit margin shrinks.
The industry chain integration According to sensitivity analysis, if the total sales sales volume of NEV changes from 131,300
Cost Control(O4)
reduced the cost. below to 122421, our recommendation will change from buy to hold while further drop to 78,559
for a sell recommendation (Table 12).
Source: Team Analysis
Operational Risks
Table 12: Sensitivity Analysis
• Corporate Governance Risk (O1) / (Moderate Likelihood, Moderate Impact)
̴ Base Case Buy Sell
Both the position of chairman and the general manager are the real controllers of the company
The Exchange Rate
0.8454 0.8889 1.2673 —Wang Chuanfu. The structure of centralized management will cause an opaque information
of HKD to RMB
problem and may endanger the company into a latent operational risk.
Ratio of Cost to
81.61% 83.44% 94.06%
Income • Financial Risk (O2) / (Moderate Likelihood, Moderate Impact)
Sales Volume of In Debt Maturity Structure҅short-term debt is mainly considered in the debt financing. With high
NEV Excluding 118000 128001 56345
Pure-electric Bus ratio of short-term debt is destabilizing the use of capital. In general, financial leverage is
Sales Volume of
12000 9106 /
decreasing, while still in the relatively high level.
Pure-electric Bus
Total Sales Volume • Low Consumer Satisfaction (O3) / (High Likelihood, High Impact)
131300 122421 78559
of NEV BYDHK's sloppy design and excessive imitation of the appearance fail to meet consumers’
Source: Team Analysis demands and preference for original design. Besides, a bunch of after-service complaints
revealed due to technical constraints and deficiency in ideology of after-service.
Table13: Rating Guide • Cost Control (O4) / (Low Likelihood, High Impact)
buy hold sold The adjustment of subsidies makes BYDHK face the risks of cost increasing and profit margins
bigger than range from -15% to smaller than
declining. According to the sensitivity analysis, if the proportion of sales cost against revenue
15% 15% 15% rises 2%, our target price will drop from HKD64.89 to HKD62.40 (Table 12).
10Appendices
Appendix 1: Statement of Comprehensive Financial Position (BYDHK)
CNY in Million 2013 2014 2015 2016F 2017F 2018F 2019F 2020F
Assets
Cash & Cash Equivalents 4,511 3,950 6,011 19,323 19,032 21,197 24,994 30,505
Derivative Financial Instruments - - 18 25 31 37 46 58
Short-term Deposits 200 139 269 274 279 285 291 297
Accounts & Bills Receivables 13,135 22,435 26,679 32,478 35,291 42,639 52,063 64,179
Other Receivables 2,676 3,900 5,419 7,290 8,750 10,666 13,170 16,443
Inventories 8,776 10,046 15,807 16,556 19,412 23,033 27,613 33,412
Other Current Assets 668 364 317 323 329 336 343 350
Current Assets 29,966 40,834 54,519 76,270 83,124 98,193 118,520 145,245
PP&E-net 34,935 37,213 39,039 47,120 52,373 59,170 67,956 79,333
Equity Capital Investment 1,084 1,414 1,889 1,795 2,079 2,456 2,952 3,605
Available-for-sale Financial Assets 9 35 3,071 3,071 3,070 3,070 3,070 3,069
Goodwill and Intangible Assets 4,995 6,373 7,169 11,006 13,232 16,179 20,064 25,178
Prepaid Land Lease Payments 4,628 4,448 4,656 7,907 9,305 11,126 13,482 16,524
Other Non-current Assets 2,398 3,692 5,143 6,571 7,806 9,396 11,442 14,081
Non-current Assets 48,049 53,175 60,967 77,470 87,865 101,397 118,967 141,790
Total Assets 78,015 94,009 115,486 153,740 170,989 199,590 237,487 287,035
Liabilities
Trade and Bills Payables 22,293 25,851 30,656 41,904 49,169 58,408 70,120 84,976
Tax Payable 166 143 289 399 475 570 692 846
Interest-bearing Bank and Other Borrowings 16,172 19,173 26,413 32,223 33,892 41,346 51,171 63,804
Other Current Liabilities 4,713 7,856 8,752 11,676 13,809 16,571 20,135 24,736
Current Liabilities 43,344 53,022 66,110 86,201 97,345 116,895 142,118 174,363
Interest-bearing Bank and Other Borrowings 8,652 10,979 11,230 9,469 7,985 6,733 5,677 4,787
Other Non-current Liabilities 1,162 1,113 2,116 2,116 2,116 2,116 2,116 2,116
Non-current Liabilities 9,814 12,092 13,346 11,586 10,101 8,849 7,794 6,903
Total Liabilities 53,158 65,114 79,457 97,787 107,446 125,745 149,912 181,266
Equity
Equity Attributable to Owners of the Parent 21,710 25,366 32,294 51,964 59,281 69,293 82,713 100,575
Share Capital 2,354 2,476 2,476 2,728 2,728 2,728 2,728 2,728
Reserves 19,238 22,890 26,618 46,036 53,353 63,365 76,784 94,647
Proposed Final Dividend 118 - - - - - - -
Perpetual Loans - - 3,200 3,200 3,200 3,200 3,200 3,200
Non-controlling Interests 3,147 3,529 3,735 3,989 4,261 4,552 4,862 5,194
Total Equity 24,856 28,894 36,029 55,953 63,543 73,845 87,575 105,769
Total Liabilities and Equity 78,015 94,009 115,486 153,740 170,989 199,590 237,487 287,035
Predicted Statement of Comprehensive Financial Position is summarized by Statement of Financial Position of HC&AS (Equals to BYD-E
(0285.HK)) and Remaining Businesses (AB, RB&PB).
11HC&AS (Equals to BYD-E) Remaining Businesses
CNY in Million 2016F 2017F 2018F 2019F 2020F 2016F 2017F 2018F 2019F 2020F
Assets
Cash & Cash Equivalents 1,296 2,210 2,759 3,652 4,990 18,027 16,822 18,438 21,342 25,515
Derivative Financial Instruments - - - - - 25 31 37 46 58
Short-term Deposits 274 279 285 291 297 - - - - -
Accounts & Bills Receivables 8,542 9,226 10,735 12,463 14,446 23,936 26,065 31,904 39,600 49,734
Other Receivables 628 732 851 987 1,143 6,662 8,019 9,815 12,183 15,300
Inventories 4,246 4,925 5,695 6,570 7,567 12,310 14,487 17,338 21,043 25,845
Other Current Assets 1 1 1 1 1 322 328 335 342 349
Current Assets 14,987 17,374 20,326 23,964 28,443 61,283 65,750 77,867 94,556 116,801
PP&E-net 7,043 7,916 8,912 10,052 11,361 40,077 44,457 50,258 57,904 67,972
Equity Capital Investment 400 400 400 400 400 1,395 1,679 2,056 2,552 3,205
Available-for-sale Financial Assets - - - - - 3,071 3,070 3,070 3,070 3,069
Goodwill and Intangible Assets 23 27 31 36 42 10,983 13,205 16,148 20,028 25,136
Prepaid Land Lease Payments 359 416 481 555 639 7,548 8,889 10,645 12,928 15,885
Other Non-current Assets 722 842 979 1,137 1,320 5,849 6,964 8,417 10,305 12,761
Non-current Assets 8,547 9,600 10,803 12,181 13,762 68,923 78,265 90,594 106,786 128,028
Total Assets 23,534 26,974 31,129 36,145 42,205 130,206 144,015 168,461 201,342 244,830
Liabilities
Trade and Bills Payables 9,953 11,545 13,350 15,401 17,738 31,950 37,624 45,058 54,720 67,239
Tax Payable 149 174 202 235 272 250 301 368 457 574
Interest-bearing Bank and Other Borrowings - - - - - 32,223 33,892 41,346 51,171 63,804
Other Current Liabilities 1,760 2,037 2,351 2,708 3,114 9,915 11,772 14,220 17,427 21,622
Current Liabilities 11,862 13,756 15,903 18,344 21,124 74,339 83,589 100,992 123,775 153,238
Interest-bearing Bank and Other Borrowings - - - - - 9,469 7,985 6,733 5,677 4,787
Other Non-current Liabilities - - - - - 2,116 2,116 2,116 2,116 2,116
Non-current Liabilities - - - - - 11,586 10,101 8,849 7,794 6,903
Total Liabilities 11,862 13,756 15,903 18,344 21,124 85,924 93,690 109,841 131,568 160,142
Equity
Equity Attributable to Owners of the 11,672 13,217 15,225 17,801 21,081 44,345 50,116 58,120 68,964 83,547
Parent
Share Capital 4,052 4,052 4,052 4,052 4,052 2,728 2,728 2,728 2,728 2,728
Reserves 7,619 9,165 11,173 13,749 17,029 38,417 44,188 52,192 63,036 77,619
Proposed Final Dividend - - - - - - - - - -
Perpetual Loans - - - - - 3,200 3,200 3,200 3,200 3,200
Non-controlling Interests - - - - - 44,345 50,116 58,120 68,964 83,547
Total Equity 11,672 13,217 15,225 17,801 21,081 48,334 54,378 62,672 73,826 88,740
12You can also read