CFA Institute Research Challenge CFA Society Vancouver Team C - hosted by
←
→
Page content transcription
If your browser does not render page correctly, please read the page content below
CFA Institute Research Challenge
 hosted by
 CFA Society Vancouver
 Team C
Integrated Telecommunications Service sector Toronto Stock Exchange Team C This report is published for educational purposes only by students competing in the CFA Institute Research. Challenge. Date: January 20th, 2017 Closing Price: $43.84 Recommendation: HOLD Ticker: T CN CAD 1.00 = USD 0.75 Target Price: $44.63 Market Profile Closing Price $43.84 Highlights 52-Week High/Low $44.40/$37.38 We initiate coverage on TELUS with a HOLD recommendation and target price of Avg. Volume (3M) 994,011 $44.63 one year going forward. This implies a 1.79% upside based on the company’s Shares Outstanding 591.40 million closing price as of January 20th, 2017. Given our expected dividend payment of $1.98 Market Cap $25.99 billion per share in 2017, we derive a total return of 6.31%, which is less than TELUS’s costs of equity and, thus, justifies our HOLD recommendation. Beta 0.90 EV/EBITDA 8.59x Business Model – TELUS generates most of its revenue through its telecommunication infrastructure which requires ongoing capital expenditures to P/E 18.61x maintain revenue growth. Dividend Yield 4.37% Competitive Positioning – TELUS is characterized through the highest ARPU as Key Financial Data well as the lowest churn rates among its peers. However, ongoing competition 2013 2014 2015 could drive down ARPU and lower revenue growth. Rev. Growth 4.4% 5.2% 4.2% Industry Trends – Rapid technological advancements and structural changes EBITDA Ma. 35.2% 35.1% 34.1% intensify pressure on telecommunication companies. High penetration rates and Profit Ma. 11.3% 11.9% 11.1% slowing revenue growth indicate a mature stage of the industry. EPS 2.08 2.31 2.29 Financial Analysis – Solid financial performance through stable EBITDA Div./share 1.36 1.52 1.68 margins and revenue growth. High infrastructure investments decrease cash-flow generation and increase debt levels. Div. Yield 3.7% 3.6% 4.4% ROE 16.5% 18.4% 18.3% Valuation – TELUS’s shares provide limited upside potential for capital appreciation. High dividend growth rates are expected to slow down and cash Valuation Summary flow to equity is anticipated to decrease through higher capital expenditures. Method Price Weighting Consequently, we expect yearly total return for investors to decrease until the FCFF $43.06 25% price has adjusted to its fair value. FCFE $34.29 20% Risk – Regulatory uncertainty and increasing competition influence the outlook DDM $41.52 25% on TELUS’ share price. Higher churn rates and decreasing ARPU are considered major risk factors and could alter our investment decision. EV/EBITDA $45.88 10% P/E $50.63 10% Recent News P/Book $52.07 10% January 18th, 2017 – TELUS announced presentation of fourth quarter results to $42.94 100% be webcasted on Thursday, February 9th, 2017. Cost of equity – January 17th, 2017 – TELUS invests $250 million in its fibre optic network. 3.93% Div. Yield TELUS plans to connect more than 90% of homes and businesses in Surrey, B.C. 12 month target $44.63 directly to its fibre optic network. Surrey is the second largest municipality in the Expect. Div. 2017 $1.98 province and provides further growth potential for new customers. Total return 6.31% Last-Twelve-Month Performance Monte Carlo Simulation - 1 year forward 125% 120% 9.8% 73.3% 16.9% 14 Thousands 115% 12 110% 10 8 105% 6 100% 4 2 95% 0 90% 01/2016 04/2016 07/2016 09/2016 12/2016 T CN SPTSX 1
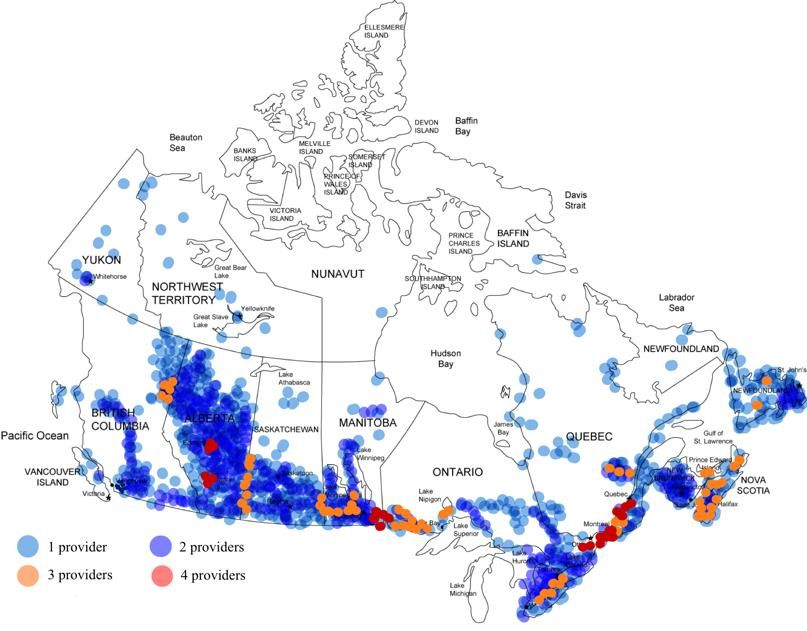
Business Description
Figure 1. TELUS Structure TELUS Corporation is a Canadian telecommunication company headquartered in Vancouver,
 TELUS British Columbia. It is the incumbent communication service provider in British Columbia and
 Corporation Alberta with a strong market share in both of its primary segments, Wireless and Wireline
 (Figure 1). TELUS mostly generates revenue through its telecom infrastructure. It provides a
 wide range of related products and services such as data, internet, voice and television as well
 Wireless Wireline as cloud based to businesses and households. (See AppendixA1 for detailed corporate structure)
 Wireless
 Data Voice
 The wireless segment, which makes up 55% of overall revenue (Figure 2), is TELUS’ fastest
 growing business unit, generating most of its revenue through voice and data services. In 2008,
 Advanced Internet
 Solutions IPTV TELUS and Bell Canada agreed on a network sharing contract to compete directly with Rogers
 Communication. TELUS is operating under two brands, TELUS Mobility and Koodo both of
 which focus on separate market segments. While Koodo is offering lower priced products,
 Small TELUS mobility addresses higher-end segments.
 Healthcare Business
 Solutions Wireline
 According to Figure 2, the Wireline segment makes up 45% of TELUS’ revenue, providing
 voice and data services such as IPTV, internet, hosting services, local and long distance landline
Figure 2. Total Revenue share connections. According to Figure 3 data services account for 69% of wireline revenue. Apart
 from this, TELUS also offers several products for small and medium businesses such as cloud
 based PBX, network and cloud solutions which aim to provide affordable process
 optimizations. Driven by continuous product diversification, TELUS recently launched its
 healthcare segment and became the largest EMR provider in Canada by offering various
 45% healthcare solutions such as claim management and health monitoring.
 55% One of the most recent trends is TELUS’s IPTV and Satellite TV service known as Optik TV
 which allows subscribers to access more than 630 digital channels.
 Future expansions
 TELUS continues to invest in wireless capacity and network growth as well as in broadband
 infrastructure expansion and upgrades. One of its strategic objectives is to increasingly connect
 Wireless Wireline businesses and residential units with fibre-optic cable, by expanding rural broadband
Source: TELUS Annual Reports. connections. These investments increase internet speeds and the capacity to support TV,
 Internet and data service growth. It also enhances the reach of its healthcare solutions, and
Figure 3. Wireline Revenue share provides backhaul capability to expand wireless services. TELUS mainly focuses on the
 telecom business; however, successfully adapts to industry changes and is resilient enough to
 4% overcome economic downturns.

 Management and Governance
 27% The average tenure of TELUS executives has exceeded the respective tenure of peer companies
 by around 25% which indicates higher loyalty and lower turnover. (Appendix B1a) Fourteen
 years as the company’s CEO, Darren Entwistle guided TELUS through a period of rapid
 69% growth. He returned to his old position on August 2015 after a leave for fourteen months.
 Investors’ confidence grew after a 4.2% revenue growth the following month of Darren
 Entwistle’s reappointment and his $10 million investment in TELUS shares.
 The oversight of the board is realized through four committees Audit, Corporate Governance,
 HR & Compensation and Pension (Appendix B1b). Each committee is composed of board
 Data Voice Service Other directors with the objective to ensure the alignment of policies and strategy. In order to maintain
Source: TELUS Annual Reports. a neutral standpoint in discussions and decisions, TELUS’ executive team is not involved in any
 of the sub-committees of the Board. Additionally, TELUS launched the National Sustainability
 Council in 2015 which is expected to solidify TELUS award-winning disclosure in corporate
Figure 4. TELUS National Coverage governance.
 Embracing Culture
 Increasing diversity and inclusiveness have been reflected throughout all levels of the
 organization. A clear policy is supervised by the Corporate Governance Committee which
 enable TELUS to be recognized by Mediacorp Canada as one of the best employers with
 respect to diversity.
 Shareholders’ Rights
 To ensure shareholders’ rights, a Corporate Secretary has been designated by the Board as its
 agent to receive and review communications and meeting requests. A new policy has been
 adopted in 2015 to improve the previous say-on-pay and shareholder engagement policy in
 order to encourage timely, honest and ongoing dialogue.
 Code of Ethics
Source: CRTC Data Collection The TELUS Code of Ethics and Conduct is used to assist TELUS team members in maintaining
 the highest standards of ethical conduct in the corporate and professional dealings. Ethicsline,
 as part of the annually renewed code allows team members to anonymously raise complaints.
 2
ESG
 Figure 5. Revenues and Percentage
 Environmental, social and governance concerns could negatively influence the business going
 of Wireless Sector.
 50 52% forward which would alter our investment decision. Among its peers, TELUS has the most
 percentage of independent director and meeting attendance percentage, indicating an organized
 40 51% management structure. In terms of ranking, TELUS scored the best in the RobecoSAM Rank,
 50%
 Sustainalytics Rank, ISS Quality Score and CDP Climate Score compared to peers Bell and
 30 50% Rogers (See appendix B2). Our analysis of TELUS’s ESG factors show that there is a low
 49% 48%
 20 49% probability that ESG factors will have a negative impact on the valuation.
 47% 46% Industry Overview and Competitive Positioning
 10

 0 44% Industry Overview
 2011 2012 2013 2014 2015 Over the past 5 years, the telecommunication industry saw an average annual revenue growth of
 wireline wireless
 2.8% (Appendix C1a) with approximately 94% of revenue generated through services that are
 Wireless%
 no longer price-regulated. In general, the EBITDA margin for telecom companies is 39.8% with
 Source: CRTC data. a 7.6% growth 2014 to 2015 (Appendix C2a). The average ROE for the telecommunications
 sector is 15.5% and the average debt to equity ratio is 1.688 (Appendix C2b).
 The fastest growing segments are internet and wireless which capture around 70% of the
 Figure 6. GDP Growth of Canada. industry’s revenue. During 2011 to 2015, wireless data services alone grew by an average
3.50% annual rate of 18.8% and gained a market share to 51% (Figure 5). The greatest decline in
3.00%
 revenue was experienced by access line services, which have been gradually decreasing by
 4.8% annually over the last 5 years. Additionally, revenues generated from television services
2.50% have experienced an average annual decrease of 0.4% (Appendix C3a) due to high substitution
2.00% by online streaming. Technological advancements led to a shift from voice services towards an
1.50% increasing need for data volume and navigates potential infrastructure investments going
1.00%
 forward.
 The five largest telecommunication providers, including TELUS, account for 84% of total
0.50%
 market revenue. Smaller resellers are responsible for nearly 68% of the services offered but
0.00% only account for 4% of revenues (Appendix C4a). This indicates a highly-concentrated market
 which increases the risk of further regulations. Short life cycles of technological advancements
 continue to fuel growing need for greater infrastructure investments.
 Historical Forecast
 Source: Statcan, IBIS Demand Drivers
 Moderate GDP growth leads to increasing corporate activity and lower unemployment rate
 Since 2010, Canadian GDP growth has been fluctuating with a downward sloping trend, from
 Figure 7. Per Capita Disposable 3.1% annual change in 2010 to 1.3% in 2016 (Figure 6). However, after a resource driven
 Income Growth decline in recent years, Canada’s economy was able to recover which led to a positive economic
4.00% outlook, especially for Alberta. Canadian GDP is anticipated to pick up speed by with an
3.00% estimated 1.8% growth rate in 2017, passing through the fear of a real estate bubble as well as
 constrained export activity caused by a stagnant Eurozone economy. These trends will likely
2.00% result in an increasing demand for data consumption and other telecommunication services.
1.00% Growing Per Capita Disposable Income
0.00% Over the past five years, per capita disposable income has increased at an annualized rate of
-1.00% 2.1% (Figure 7). However, this trend might be weakened by increasing level of household
 indebtedness over the most recent years. Rising consumer debt in Canada could intensify the
 existing concerns about a possible recession. Further pressure can be expected from housing
 Historical Forecast prices as they continue to increase.
 Nonetheless, we expect disposable income to develop positively as the Canadian economy is
 Source: Statcan, IBIS.
 anticipated to recover and GDP to grow. Thus, we assume an annual growth rate of 2.5% over
 the next 5 years forward which will support the trend towards higher smart phone penetration.
 Demographics: Population, Immigrants and Age Groups
Table 1. Historical Population by Age The number of Canadian residences has been growing steadily at around 1% annually for the
 Groups (Thousands) past ten years. At the same time, Canada is characterized by an aging population with a mean of
 48 years. (Table 1) The workforce gap is expected to be filled by a growing number of
 < 20 20 - 64 > 64
2010 immigrants at younger age, higher education and larger purchasing power. High immigration
 7874 21335 4796 rates provide potential for further revenue growth within the telecommunication industry.
2011 7867 21526 4950 According to Statistics Canada, adults in the age of 40 to 54 years spend the most on
2012 7854 21729 5167 telecommunication services, which leads to higher profitability going forward (Appendix C5).
2013 7849 21923 5384 Technology Innovation
2014 7849 22106 5589 Given the continuing trend of Internet of Things (IoT), mobile payments, video streaming and
2015 7851 22211 5787 fast evolving electronic devices, telecommunication companies are facing both challenges and
2016 7898 22398 5991 opportunities. The increasing demand for data services challenges network capacity and is
Growth 0.05% 0.81% 3.78% anticipated to be accompanied by decreasing prices. Disruptive technology such as OTT (over
CAGR 0.93% 0.17% 3.46% the top) offerings and increasingly available free Wi-Fi networks has the potential to affect
 Source: Statistics Canada TSPs by competing for entertainment viewership and wireless data services (Appendix C6).
 However, telecommunication service providers also have the chance to acquire new growth
 3

opportunities though technology innovations. A vertical cross-sector collaboration involving
 Figure 8. Five Forces Analysis. software platforms and embedded systems boost the chance for revenue growth as well as
 Entry of cooperation with other operator partners.
 new
 barriers
 Competitive positioning
 5 The communication industry is continuously exposed to characteristic changes. High demand
 4
 Rivalry for voice service in recent decades has been replaced by data services being the new revenue
 3
 aong Level of driver. VOIP, Skype and Facetime limit the demand for phone connections. Free internet in
 2
 existing Subsitute
 1 public places and Shaw’s free Wi-Fi hot spots can cause lower demand for data plans.
 competit s
 ors 0 However, we perceive a shift within the same industry rather than a substitution through new
 products. Thus, the risk of substitution of the telecommunication industry is low. Since TELUS
 Bargainn Bargainn is highly diversified within the industry, we think it can adapt to current trends and maintain
 ing ing stable revenue growth.
 power of power of The bargaining power of suppliers is mainly influenced by the government through the
 buyers suppliers distribution of spectrum licenses and regulations. However, recent attempts to increase
 competition has failed due to low economies of scales for smaller companies. Thus, we do not
 Figure 9. Monthly postpaid Churn expect any extensive regulatory pressure in the near future.
 Rate. The Canadian telecom industry is considered an oligopoly leading to low rivalry among
1.50% existing competitors. Over the past years, we perceived low changes in market share of the big
 three service provider (4% since 2009). We calculated the Herfindahl-Hirschman index (HHI)
1.30% of the telecom industry which results in a score of over 2700 (for detailed description, please
 refer to Appendix D1d). According to the US Department of Justice, an industry with HHI of
1.10% over 2500 is considered highly concentrated. Due to limited threats from new entrants and
 substitution, the telecom industry has relatively high pricing power and maintains high profit
0.90% margins. However, going forward we expect competition among existing competitors to
 increase (Appendix D1b).
0.70%
 Churn Rate
 2012 2013 2014 2015
 According to the Federal Commissioner for Complaints for Telecommunications Services
 Telus Rogers Bell (CCTS) report, the number of complaints TELUS received was half the number of Rogers, and
 Source: TELUS Annual Reports. one fifth of the number of Bell (Appendix D1e). Consequently, TELUS maintains the lowest
 postpaid customer churn rates (0.94%) which indicates the loss of clients per month as a
 Figure 10. Commercial Mobile percentage of the existing customer base (Figure 9). Thus, we expect TELUS to maintain a
 Spectrum License sustainable growth going forward. However, 1% per month is still ~12% per year, which
 Holdings by Percentage. requires high marketing spending and promotional offer to attract new customers.
50%
 Spectrum
40% Mobile Spectrum license is vital for the telecommunications industry since they enable larger
 data volumes. The key players currently own more than three quarters of the national mobile
30% spectrum licenses. TELUS increased the market share of its spectrum license holdings from
 15% in 2010 to 25% in 2016, thereby becoming the second largest spectrum holder in Canada
20% (Figure 10). As TELUS continues to significantly invest in spectrum licenses, it is expected to
 maintain high quality services.
10%
 Infrastructure Investment
0%
 Since the telecommunication industry is a technology intensive industry, investment in network
 infrastructure is a key success factor. Since Bell and TELUS started network sharing in 2009,
 Roger’s competitive advantages have decreased and the company keeps losing market share
 (Figure 11). While TELUS and Bell have announced plans to upgrade their network to increase
 2010 2016
 wireless speed, Rogers is yet to announce any such plans to maintain its market position
 Source: Innovation, Service and (Appendix D1f).
 Economic Development Canada.
 ARPU
 ARPU, average revenue per user, is a measure used in the telecommunication industry to
 Figure 11. Market Share of describe the quality of product and services. Higher ARPU proves customers’ willingness to
 Telecom Industry. pay more for premium services (add-ons, high priced plans, see Appendix D2a,D2b). It is also
40.00% an indicator of loyalty because customers who stay with the company’s plans are losing the
 advantage of initial promotional discounts and usually pay more for their contracts. According
30.00%
 to Figure 12, since TELUS has a high ARPU, we can assume that it maintains a loyal customer
20.00% base. From our survey, most TELUS/Koodo users are satisfied in terms of signal strength,
 internet speed, data charges, customer service, and 65.22% TELUS users would recommend
10.00% TELUS to others. However, as our survey revealed, many customers leave TELUS due to high
 data charges. Consequently, we think that TELUS’s high ARPU could lead to higher churn
0.00% rates going forward (For detailed survey results please see Appendix D3).
 Small Competitors
 Despite the fact that the Canadian government has been encouraging competition within the
 2010 2016 industry, the telecom giants have eliminated competition from smaller telecom companies
 primarily through acquisition. TELUS acquired Public Mobile in 2013 while Rogers acquired
 Source: CWTA. Mobilicity in 2015 and Bell is currently undergoing the approval process to acquire MTS. Other
 small competitors such as PC Mobile are resellers rely on large operators to package and deliver
 4
their mobile services. The revenue and subscribers generated through reseller arrangements are
 Figure 12. Blended ARPU. lower than 1% of the whole Canadian market and therefore resellers have very limited
65 competition (For the detailed small competitor analysis please refer to Appendix D4).

60 Investment Summary
55 We issue a HOLD recommendation on TELUS with a 1-year target price of $44.63 using the
 weighted average of the following valuation methods: Discounted Cash Flow to Firm,
50 Discounted Cash Flow to Equity, Dividend Discount method, and Trading Multiples. By
45
 including the expected dividend payment in 2017 of $1.98, our return would be 6.31% in one
 2015 year based on the company’s closing price as of January, 20 2017.
 th
 2011 2012 2013 2014
 Merits
 Telus Rogers Bell
 Incumbent service provider in Western Canada with strong nationwide presence
 Source: TELUS Annual Reports.
 TELUS continuously invests in spectrum licenses and infrastructure to enhance its service
 quality and increase its customer base. The company maintains a great market share in both its
 Figure 13. Historical Performance.
 wireless and wireline segment and currently serves 14.2 million customers. Recent growth
 47 drivers are TELUS’s TV and internet services, which grow faster than its competitors.
 Additionally, TELUS’ ARPU is the highest in the industry given its strong presence in Western
 45 Canada. Higher smartphone penetration rates as well as lower levels of unemployment and
 43
 Potential upside higher household incomes support higher-priced phone plans in British Columbia and Alberta.
 Given its strong market position, TELUS can maintain revenue growth going forward.
 41
 Solid profitability and strong cash flow base support capital expenditures
 39 TELUS is one of the few telecommunication companies that achieve consistent revenue and
 subscriber growth. The company continues to increase product diversification with segments
 37
 such as TELUS Health and TELUS International, which will strengthen their position in the
 35 telecommunication market. Strong wireless metrics and customer satisfaction combined with
 2014 2015 2016 2017 the lowest churn rate in the industry foster TELUS ability to compete with other service
 Source: Bloomberg. providers. Stable EBITDA margins show TELUS’ ability to maintain its profitability and
 financial performance. A sustained positive operating cash flow supports high investments in
 infrastructure, further enhancing TELUS’ growth objective. High dividend yields benefit
 Figure 14. P/E multiple. investors and increase the attractiveness of TELUS shares going forward.
24.x TELUS is trading at a lower P/E multiple with respect to its peers
 An analysis of the current trade multiples show that TELUS trades at a discount compared with
22.x the industry average despite a competitive dividend yield (Figure 14). We also perceive a rather
20.x
 stable valuation multiple, which indicates little price fluctuations in 2016. These findings are in
 line with our valuation outcome and indicate stable returns over the course of last year. Going
18.x forward we think that TELUS has limited upside potential characterized by a rather stable
 performance. Despite a low P/E ratio we do not think that TELUS is currently undervalued and,
16.x thus, we do not issue a BUY decision. These findings are in line with our HOLD
 recommendation.
14.x
 01/2016 04/2016 07/2016 09/2016 12/2016 Concerns
 TELUS BELL High valued Canadian telecommunication industry due to slow economic growth
 ROGERS SHAW
 The telecommunication industry delivers stable returns through high dividend yields and decent
 Source: Bloomberg.
 growth. In an economic downturn or uncertain market environment, investors seek for stable
 investment opportunities. While Canadian corporate and government bond rates were
 continuously declining over the past years, TELUS’s dividend yield steadily grew and provided
 Table 2. 10-year Bond Yield greater return opportunities. A 10-year corporate bond issued by TELUS currently trades at a
 Comparison yield of 3.42% compared to the current dividend yield of 4.37% (Table 2). Thus, many
 investors might swap corporate bonds with telecommunication stocks to receive higher returns.
Return 2012 2013 2014 2015 2016
 A cross country comparison reveals that Canadian telecommunication companies are currently
Stock overvalued with respect to its US peers, which are traded at a discount (Figure 15). An
Total 18.4 19.2 (5.9 18.6 optimistic outlook on the US economy and a likely increase in interest rates trigger a lower
 16.7 demand for telecommunication stocks. Investors seek for higher risk rewarded returns and
return % % %) %
Dividend 3.9% 3.9% 3.8% 4.6% 4.4% avoid industries with low growth potential.
 Going forward we expect higher economic growth in Canada resulting in an increase in interest
Bond rate and lower demand for TELUS stocks.
Yield
Gov. 1.98 3.19 2.27 1.88 1.93 Ongoing competition and fast pace technology advancements
bond % % % % % TELUS is exposed to high competition in both its wireline and wireless businesses. Due to a
 3.26 4.32 3.55 3.62 3.42 high market penetration and limited growth opportunities, telecommunication service providers
TELUS
 % % % % % must attract clients from their competitors to increase market share. Expansion in other
 provinces is difficult due to the expensive construction of infrastructure and limited economies
 Source: Bloomberg. of scale. Therefore, TELUS must continue to significantly invest in its existing
 telecommunication infrastructure (especially fibre technology), web hosting and spectrum
 licenses while simultaneously deploying technological advancements. Consequently, TELUS
 maintained elevated capital expenditures and reached the highest capital intensity ratio among
 5
its peers. However, high pay-offs and returns on these investments remain uncertain and
 Figure 15. EV/EBITDA - Canada negatively impact our outlook on TELUS.
 Decreasing liquidity puts pressure on debt levels and dividend growth going forward
 9.01x Avg. TELUS continues to heavily invest in infrastructure and spectrum licenses mainly financed
 8.83x 8.57x through the issuance of long term debt. At the same time TELUS maintains dividend growth
 rates of above 10%. Higher debt levels increase interest expenses which puts pressure on
 profitability over the next years. Thus, we consider TELUS’s dividend growth unsustainable
 8.28x
 8.15x and predict a decrease in growth in following years.
 Structural change in the industry leads to declining revenue from voice services
 High substitution of voice services and a maturing wireline market leads to a decline in the high
 TELUS BELL ROGERS SHAW profitable voice and long-distance revenue. A recent Canadian Radio-television and
 Telecommunications Commission (CRTC) report showed a trend towards the usage of mobile-
 EV/EBITDA - US only services among Canadians households (currently 24%). Consequently, TELUS must focus
 on higher revenues and cash flows from TV and internet services in order to maintain its
 7.04x 6.93x profitability in the wireline sector. High investments in its fibre technology are necessary which
 Avg. increases the pressure on liquidity.
 6.72x
 Financial Analysis
 6.20x
 TELUS stock provided great returns over the last 5 years
 Over the last 5 years, TELUS stock provided superior returns and high dividend yields. The
 AT&T VERIZON SPRINT
 annualized total return, which assumes dividends to be reinvested, was on average 13.5%,
 combined with 9.0% capital appreciation each year (Figure 16). If we compare both dividend
 Source: Bloomberg. yield as well as total return with the respective 10 year bond rates, we can conclude that TELUS
 provided an attractive return over the last 5 years due to a well performing stock price.
 Changes in capital structure influence return on equity
 Figure 16. Return Analysis.
 TELUS has an attractive 2015 ROE of ~18.1%. However, compared to its Canadian peers ROE
55
 is below the industry average of ~21.1%. With respect to its peers, TELUS has lower profit
50 margins as well as lower leverage (Table 3). High ARPU rates, however, lead to a superior
 asset turnover which positively influences ROE. Going forward, we project ROE to continue its
45
 upward sloping trend, mainly driven by increases in debt and a change in capital structure. The
40 increase in TELUS’s EBITDA margin is offset by elevated interest payments, which leads to a
 stable profit margin. Asset turnover is expected to slightly decrease due to decrease revenue
35
 growth and high investments in infrastructure, leading to an increase in assets. Overall we
30 project a stable ROE going forward.
25 Declining growth rates and ongoing industry maturation
 2012 2013 2014 2015 2016 2017 TELUS achieved reasonable top-line revenue growth rates over the last 5 years with a CAGR of
 4.7%. Driven by increases in the subscriber base as well as broadband internet data usage,
 Total return TELUS’ last twelve-month revenue ended in Q3 2016 grew to $12.7 billion compared with
 Capital appreciation
 $12.5 billion in 2015 and $12 billion in 2014. However, increasing competition and industry
 Source: Bloomberg. maturation led to a recent slowdown in growth rates. In 2016 wireless penetration is expected to
 stagnate despite stable churn rates, indicating a decline in new customers. Additionally, TV
 subscriber growth is expected to slow down, which has been the major growth driver over the
 Table 3. Du Pont Analysis. last 5 years (Table 4).
 Going forward we expect a decreasing growth potential, leading to a decline in revenue growth
 2012 2013 2014 2015 and customer base expansion.
Profit 11.0 11.4 11.9 11.1
Margin % % % % Stable EBITDA margin with expected growth going forward
Peer avg. 13.8 12.6 12.9 12.3 Higher restructuring costs in addition to a depreciated Canadian dollar and higher roaming costs
 % % % % led to a decrease in the EBITDA margin to 34.1% in 2015 (Figure 17). However, headcount
Asset reductions of approximately 1,500 full-time employees initiated at the end of 2015 improved
Turnover 0.54 0.54 0.54 0.50 the EBITDA margin to up to 34.9% over the last twelve month ended in Q3 2016. Labor costs
Peer avg. 0.52 0.49 0.46 0.42 per employee grew on average 3% per year which was less than revenue growth and, therefore,
Leverage 2.6x 2.7x 2.9x 3.3x support a strong EBITDA margin. However, with decreasing revenue levels TELUS has to
Peer avg. 4.3x 4.2x 4.0x 3.9x maintain low operation costs in order to sustain profitability and therefore a high ROE. Going
 15.8 16.4 18.6 18.1 forward we expect TELUS to increase its EBITDA margin through further reductions in
ROE % % % % operating expenses.
Peer avg. 30.4 25.9 22.6 21.1 Table 5: Liquidity Analysis
 % % % % 2012 2013 2014 2015 2016E 2017E 2018E 2019E 2020E
 Source: Bloomberg
 Debt/Equity 86.6x 98.5x 126.2x 158.2x
 Interest coverage 5.3x 5.0x 5.2x 5.3x 4.8x 4.4x 4.2x 4.3x 4.4x
 Gross debt/ EBITDA 1.7x 2.0x 2.2x 2.9x 3.1x 3.2x 3.2x 3.2x 3.1x
 (Div. + share
 68% -6% 15% 13% 22% 57% 66% 90% 95%
 buyback) / FCFE

 6
Increasing debt levels due to high capital expenditures
 Table 4. Subscriber Base.
In 2016 TELUS heavily invests in its telecommunication infrastructure as well as spectrum licenses and
 2012 2013 2014 2015
thousand E has released its intention to invest $10.0 billion across British Columbia, Alberta and Ontario
Wireless 7,670 7,807 8,100 8,457 8,507 until 2019, and $2 billion cumulated in Quebec until 2020 (Figure 18). Strategic considerations
Growth 4.5% 1.8% 3.8% 4.4% 0.6% include the acceleration of fibre penetration, especially in Edmonton and Vancouver, the
Access 3,009 upgrade of TELUS’ network infrastructure as well as the acquisition of additional spectrum
line 3,406 3,254 3,169 3,053 licenses. Elevated capital expenditures led to a decrease of free cash flow and an increase of
Growth. -5.2% -4.5% -2.6% -3.7% -1.4% leverage, mainly through the issuance of long-term debt. Therefore, DBRS downgraded
Internet 1,359 1,420 1,475 1,566 1,631 TELUS’s corporate bonds from A to BBB in 2015 (Table 7). Increasing financing costs reduce
Growth 5.7% 4.5% 3.9% 6.2% 4.2% the profitability of TELUS going forward. Given TELUS high liquidity needs over the next
TV 678 815 914 1,002 1,058 years, we perceive a high probability that leverage will increase rather than decrease. A further
Growth 33.2 20.2 12.1 9.6% 5.6% increasing debt level is difficult to maintain and has the potential to negatively impact TELUS’
 % % % credit rating which would increase the cost of financing and put pressure on profitability.
 13,11 13,29 13,65 14,07 14,20
Overall 3 6 8 8 5 Table 6: Dividend Analysis
Growth 3.0% 1.4% 2.7% 3.1% 0.9% 2012 2013 2014 2015 2016E 2017E 2018E 2019E 2020E
 Dividend/share $1.22 $1.36 $1.52 $1.68 $1.85 $1.98 $2.10 $2.18 $2.26
 Source: Annual Report
 Growth rate 22.0% 11.5% 11.8% 10.5% 10.0% 7.3% 5.9% 4.1% 3.3%
 Payout ratio 66.0% 67.3% 65.6% 73.2% 68.6% 74.0% 77.0% 77.0% 76.2%
 Figure 17. Financial Performance. Dividend Yield 3.9% 3.9% 3.8% 4.6% 4.4%
 $12.5 $12.7 Peer avg. 4.5% 4.2% 4.2% 4.5%
 $12.0
 $10.9 $11.4
 Unsustainable dividend growth
 TELUS has continuously increased its dividend payments with growth rates exceeding 10%
 over the last 4 years which led to a payout ratio of over 70% in 2015. Simultaneously, an
 increasing dividend yield to 4.6% in 2015 enhanced the attractiveness of TELUS stocks with
 respect to the fixed income market. Many investors might have shifted their investment from
 corporate bonds to TELUS shares to achieve higher returns. However, going forward we do not
 think that TELUS can maintain a payout ratio of over 80%, therefore, leading to a decline in
 2012 2013 2014 2015 LTM dividend growth. The underlying calculation assumes = (1 − ) ×
 which would result in a dividend growth of = (1 − 0.73) × 18.1 = 4.88%.
 Revenue EBITDA
 Source: Annual Report. Valuation
 Figure 18. . Infrastructure We derive a fair value of $42.94 based on our combined valuation methods which allocates the
 Investments (Million) weights 25% to FCFF and a fair value of $43.1, 20% to FCFE and a fair value of $34.3 as well
 as 25% to DDM and a fair price of $41.5. The remaining 30% are allocated to our comparable
 analysis. The following chart represents a summation of the entire valuation section. We
 multiply the fair price by cost of equity adjusted for the current dividend yield in order to derive
 our price target of $44.63 one year going forward.
 $42.94
 Figure 19. Valuation Summary
 1
 P/Book Exit Multiple
 P/E Exit Multiple
 0.8
 EV/EBITDA Exit Multiple
 2012 2013 2014 2015 2016 Comparable Metrics:
 0.6
 Spectrum - 67 1,171 2,048 1,000 DDM
 FCFE
 Wireline 0.4
 1,270 1,398 1,527 1,684 1,750 FCFF
 CapEx
 Valuation Metrics:
 0.2
 Wireless Analyst target prices
 711 712 832 893 950
 CapEx 52-week trading rage
 0
 $0.00 $10.00 $20.00 $30.00 $40.00 $50.00 $60.00
 Source: Annual Report.
 DCF (FCFF & FCFE)
 Table 7. Credit Rating – DBRS. Given the nature of the telecommunication industry and TELUS’ stable financial performance,
 a discounted cash flow method was used to calculate the intrinsic value of the share price. Our
 2012 2013 2014 2015 analysis is based on 3 case scenarios, a base case, a bull case as well as a bear case. We
TELUS included trends from the historical performance, the industry outlook as well as an assessment
Corp. of TELUS competitive positioning.
Issuer rating A A A BBB Free cash flow to the firm is expected to decrease over the next 2 years followed by a larger
 (low) (low) (low) increase from 2018 onwards. This is due to high capital expenditures related to fibre optic
TELUS cables, 5G technology, and growth in TELUS Health. During this period we assume that
Comm. TELUS will take on more debt to pay for the investments. Free cash flow to equity holders is
Issuer rating A A A BBB forecasted to follow the opposite trend as FCFF because the high amount of debt being used to
 (low) (low) (low) fund capital expenditures. The sections below will provide additional color. (Detailed financial
 forecasts can be found in Appendix E)
 Source: DBRS Report
 Revenue Growth
 Revenue growth is primarily driven by the overall industry outlook as well as the assessment of
 TELUS competitive positioning. The main input variables are the net add of subscribers in each
 7
Table 8. FCFF Sensitivity Analysis. ($) service line, encompassing wireless, access lines, internet and TV. The resulting subscriber base
 is then compared with ARPU of each segment in order to derive an overall outlook on revenue
 WACC (%) growth. In the period between 2016 and 2020 we expect access line net adds to be negative with
 $47. decreasing ARPU which partly offset the revenue growth generated through TV and internet
 Terminal growth (%)

 47 5.40 5.64 5.89 6.14 6.39 services which will be the key growth driver going forward. Future growth will be driven by the
 1.25 44.1 40.1 36.6 33.4 30.5 acquisition of new customers through the expansions of the existing infrastructure and enhanced
 service quality. However, we expect revenue growth to slow down due to a maturing industry.
 1.50 48.1 43.6 39.6 36.1 32.9
 Capital Expenditures / Debt
 1.75 52.5 47.5 43.1 39.1 35.6 TELUS will continue to invest in advanced technology and infrastructure upgrades. High
 2.00 57.7 51.9 46.9 42.5 38.6 investments in fibre cable infrastructure for households and businesses is expected to continue
 until the end of 2018. Thus, capital expenditures remain elevated and debt levels continue to
 2.25 63.6 57.0 51.3 46.4 42.0 increase.
 Share Repurchases
 TELUS has recently engaged in a large amount of share repurchases, returning upwards of $500
 million to shareholders over the past year. We have forecasted TELUS to fully utilize their
 Table 9. FCFF
 normal course issuer bid for 2016 leaving the year end share count at 588 million. By 2020 we
 Free Cash Flow to the firm ($) are forecasting share repurchases on a much smaller scale leaving the 2020 share count at 578
 million.
 2017E 2018E 2019E 2020E
EBIT WACC
(1-t) 2,036 2,077 2,143 2,211 TELUS’ weighted average cost of capital is broken down into four parts:

Dep. 1,646 1,789 1,903 1,992 The cost of equity was determined using the Capital Asset Pricing Model, where we inputted a
 10 year risk free rate of 1.75%, a cash adjusted levered beta of 0.90 and a market risk premium
(CapEx) 2,600 2,548 2,497 2,447 of 7.25%; resulting in a 8.30% cost of equity. The cost of debt was taken by looking at the yield

(WC) (72) (364) 9 (25) to maturity on a 10Yr. TELUS corporate bond, where we then accounted for taxes by using the
 effective tax rate of 27.5%. The after tax cost of debt is 2.63%. The weights of equity and debt
FCFF 1,155 1,683 1,540 1,781 were computed using 2016E data, wherein we determined that the weight of equity is 62.10%
TV of and the weight of debt is 37.90%. The WACC of TELUS is 5.89%.
FCFF 35,320
 Beta
 Beta for CAPM was calculated using research performed by Aswath Damodaran, he has
 calculated the unlevered beta adjusted for cash for Wireless and Wired Telecom providers in
 North America. We analyzed his data and revenue weighted the two betas to depict the business
Table 10. FCFE Sensitivity Analysis.($) model of TELUS. The beta was then levered up with the according debt to equity ratio, giving
 us a 0.90 cash adjusted levered beta.
 Cost of Equity (%)
 $37. Terminal Growth Rate
 34 7.80 8.00 8.30 8.50 8.80 We used a terminal growth rate of 1.75% as the perpetual growth of TELUS’ future cash flows.
Terminal growth(%)

 1.25 34.8 33.6 32.5 31.5 30.5 Over the past 50 years, the average real Canadian GDP growth rate has trended just above 2%,
 we chose a growth rate just below that to be conservative and reflect the correlation between the
 1.50 35.8 34.5 33.4 32.3 31.3 growth in the Canadian economy and TELUS.

 1.75 36.9 35.5 34.3 33.1 32.1 FCFF

 2.00 38.1 36.6 35.3 34.0 32.9 We took the present value of each cash flow and discounted it by the weighted average cost of
 capital to find the present enterprise value of the firm (Table 9). To find the terminal value we
 2.25 39.4 37.8 36.4 35.0 33.8 utilized the Gordon Growth method by taking 2020 FCFF and dividing it by the difference
 between WACC and the terminal growth rate, then discounting it back to the present. After
 which, debt was deducted and cash was added back to find the equity value, outputting a fair
 value share price of $43.06.
 We utilized a sensitivity analysis to see the impact of changes in the weighted average cost of
 capital and terminal value on the share price (Table 8). Both of these inputs can greatly impact
 valuation giving us ~$16 range, when WACC changes from between 5.64% and 6.14% and
 Table 11. FCFE terminal value changes between 2.00% and 1.50%.
 Free Cash Flow to Equity
 2017E 2018E 2019E 2020E
 FCFE
 e
 Net Income 1,575 1,587 1,646 1,712
 Free cash flow to equity holders has similar inputs as free cash flow to the firm. In the case of
 TELUS, the difference is found with increasing debt levels. As mentioned earlier, we forecast
 Dep. 1,646 1,789 1,903 1,992
 TELUS’ capital expenditures to be funded through additional debt giving us much lower cash
 (CapEx) (2,600) (2,548) (2,497) (2,447) flows to equity holders in later years. The FCFE method returned a fair value share price of
 (WC) (72) (364) 9 (25) $34.29 (Table 10).
 (Debt (5,750) (6,250) (6,500) (6,500) As the table 11 shows, FCFE for 2016/2017 trends closely to net debt additions, after which
 RePMT)) capital expenditures slow and depreciation increases. The terminal value of FCFE was
 New 7,250 7,250 6,750 6,550
 Debt calculated in a similar manner to FCFF, except the cost of equity was used to discount cash
 FCFE 2,049 1,463 1,311 1,282
 flows. The additional of the present value of cash flows plus the terminal value returned an
 TV of FCFE 14,840 equity value of $22Bn, which was divided by 588 million shares to return the fair value share
 price.
 Dividend discount model (DDM)
 For 2017 onwards we have forecasted slightly smaller dividend growth, with dividend per share
 of $2.26 in 2020.
 8
Using the cost of equity of 8.30% as the discount rate we found the present value of the
 forecasted dividends (Table 13). To find the terminal value of dividend the Gordon Growth
 method we used a conservative growth estimate which gave a terminal value of $34.24. The
 Table 12. Dividend Sensitivity. ($)
 present value of dividend was added to the terminal value to give a share price of $41.52 per
 Cost of Equity (%) share (Table 12).
 $43. For 2016, TELUS will pay over $1 billion back to shareholders in dividends which is not
 included in our DDM calculation. However, we have forecasted this number to increase to $1.3
Dividends Growth Rate (%)

 10 7.80 8.00 8.30 8.50 8.80
 billion in 2020 which is extremely conservative considering the cash that is currently being
 3.10 44.4 42.2 40.2 38.4 36.8 expended on repurchases. As discussed above, we have forecasted minimal share repurchases
 3.20 45.2 42.9 40.9 39.0 37.3
 over the next 5 years.
 There is a higher forecasted dividend growth rate to offset the reduction in share repurchases
 3.30 46.0 43.6 41.5 39.6 37.8 and concept that as the business continues to mature and de-lever they will deliver more back to
 shareholders as a steady dividend.
 3.40 46.9 44.4 42.2 40.2 38.4
 Relative Valuation
 3.50 47.8 45.2 42.9 40.9 39.0 A multiples analysis was done in addition to the DCF and DDM models for additional color on
 the direction of the company share price. During the relative valuation looked at three
 multiples: EV/EBITDA, Price/Earnings and Price/Book. These multiples were chosen for their
 simplicity and clear ability to reflect per share value. There were three comparable companies
 analyzed during the relative valuation: BCE, Rogers, and Shaw. We also compared TELUS to
 American companies but found that US competitors often trade at lower multiples which
 Table 13. Dividend Discount Model
 unfairly impacted TELUS’ valuation.
 Detailed Forecast Results Enterprise Value/EBITDA
 2017 2018 2019 2020 We took the median of the Canadian competitors for last twelve months, 8.83x’s and multiplied
 E E E E
 it by 2016 EBITDA of $4.63Bn to find an Enterprise Value of $40.88Bn. After taking out debt
Shares
 588 582 580 578 and adding back cash we found a fair value share price of $45.88.
Outstanding
 Price/Earnings
Div. ($) 1.98 2.10 2.18 2.26
 A P/E multiple of 18.8x’s was put on a projected earnings per share of $2.69 to give a share
Growth
 7.3% 5.9% 4.1% 3.3% price of $50.63. We understand that TELUS has historically traded at a lower P/E multiple,
Rate
PV of
 more in line with BCE Inc. but believe that TELUS’ P/E will not increase enough to justify a
 1.91 1.87 1.79 1.71 HOLD recommendation.
Div.($)
TV of Price/Book
 34.24 A similar process was followed for Price to Book, where a multiple of 4.07x was applied to a
Div.($)
 $12.77 BVPS, yielding a share price of $52.07.
 Enterprise Value/Subscribers
 During our multiples analysis we also looked at enterprise value to subscribers, but found that
 TELUS trades at a very different multiple to the peer group. TELUS has a larger percentage of
 Table 14. Monte Carlo Simulation wireless subscribers compared to Bel which skews this multiple, if we used the same
 methodology as the above comparables we would derive a fair value share price of $28.53.
 Statistical Results
 Monte Carlo Simulation
 Simulation paths 100,000 We utilized a Monte Carlo Simulation to analyze the expected share price range one year going
 Minimum $38.80 forward. This simulation reflects the base case of our valuation and derives similar results using
 historical standard deviation and returns. We ran 100,000 simulation paths 1 year into the future
 Maximum $50.75 with daily price changes assuming that we are exposed to 253 trading days per year. The results
 Mean $44.72 illustrate the impact of deviations in underlying assumptions which enables us to analyze the
 sensitivity of our HOLD recommendation. With a mean of $44.72, our calculation proves to be
 Skewness 0.08 very accurate with respect to our valuation method. 73.3% of all simulated share prices support
 Kurtosis 0.04 our HOLD recommendation, while 9.8% indicate a SELL scenario and 16.9% would lead to a
 BUY scenario. 74.4% of the scenarios lead to a share price above the current market value.
 Median $44.70
 Investment recommendation
 5% confidence level $42.54
 Our system for issuing an investment recommendation depends on TELUS’s underlying cost of
 95% confidence level $46.95 equity. As described earlier we assume cost of equity to be 8.3%. If we receive an expected
 return above that threshold we issue a BUY recommendation. With the current dividend yield
 of 4.27%, an additional 4.03% return through capital appreciation is required to issue a BUY
 recommendation. The underlying assumption for our HOLD recommendation is to receive an
 overall return that exceed the risk-free rate of 1.75%. Given the current dividend yield we
 would tolerate a capital depreciation of (2.62%). Expected returns below the risk-free rate are
 given a SELL recommendation.
 Given our price target of $42.94 and the expected dividend payment of $1.98 in 2017, our
 return would be 6.31% in one year based on the company’s closing price as of January 20th,
 2017. Consequently, we issue a HOLD recommendation.

 Investment Risks
 [AR] Deceasing ARPU due to price wars and regulations
 Canadian telecommunication companies are characterized through high profit margins and
 elevated price levels. Consequently, the Canadian government tries to encourage smaller
 competitors to enter the market in order to increase competition and lower costs for consumers.
 9
Figure 20: Risk Matrix Smaller service provider can lease spectrum licenses at lower costs which could lead to
 destructive price wars and an overall decrease in ARPU. Furthermore, other telecommunication
 Impact High companies could initiate aggressive promotional strategies which would harm TELUS’s growth
 perspective and put pressure on TELUS elevated ARPU going forward. Further risk factors
 include the expansion of regulatory pressure such as the skinny basic (effective March 1, 2016)
 which gives Canadians residences access to an affordable basic TV package that costs no more
 US than $25 per month. Higher demand for these packages could lead to a decrease in TELUS’s
 AR
 customer base and, therefore, slow down revenue growth substantially.

 Likelihood High
 Likelihood Low

 MR [CR] Impact on churn rate
 CR TELUS was able to maintain low churn rates over the past years. However, an increase in churn
 CE rates going forward could lead to a decrease in the number of customers and, therefore, to an
 LC TE unexpected decrease in revenue. Key factors in the forecasts of churn rates are TELUS’s
 reputation as well as service quality and price. Main driver of TELUS service quality is its
 infrastructure which is exposed to high risks such as damages and an overload of traffic.
 TELUS must be able to maintain its services, which requires proactive actions. Failure in
 maintaining service quality could decrease confidence, causing peaking churn rates and a
 decrease in the number of customers.
 Impact Low Another potential risk for Telus comes from its partnership with Bell. Telus and Bell have been
 sharing their network for wireless service since 2009. Both network infrastructures affect the
 other company’s reputation and service quality. Consequently, the relationship is built on trust
Table 15. Risk Mitigation. which could lead to complications going forward. Company specific disruptions could affect
Risk Mitigation the other company’s customers.
 TELUS actively [CE] Unexpected capital expenditures
 participates in CRTC The wildfires in Fort McMurray in the summer of 2016 proved that TELUS is exposed to the
Decreasing ARPU
 review and consultation
 processes
 risk of natural disasters. In the event of wild fires or earthquakes, TELUS’ network
 infrastructure could be substantially damaged which increases capital expenditures and causes
 Ongoing investments in service quality to decrease. TELUS would have to raise debt borrowing to pay for these
Churn Rate increase service quality and
 network reliability unexpected expenditures due to its low cash reserves. This would decrease TELUS’
 profitability and thus, has a negative impact on its stock price. Even if part of the infrastructure
 Enterprise-wide business
 continuity program,
 is covered by an insurance, it may take a relatively long time for TELUS to repair its
 ongoing optimization of infrastructures and recover its normal service quality.
Unexpected CapEx
 disaster recovery
 capability for network
 [TE] Technology impacts
 assets Over the years, as technology in the telecom industry advances, Canadian residences are
 Ongoing infrastructure demanding faster and more reliable internet connections as well as greater data volume.
Technology impacts
 investments Consequently, TELUS has to continuously invest in infrastructure to keep up with latest
 Long-term bonds issued technological trends. Elevated capital expenditures could remain high and not decrease going
Market Risk with fixed interest forward. Thus, return on investments would be lower, which decreases profitability in the
 obligation future. Additionally, new technological advancements increase the risk of substitution. For
 High initial infrastructure example, Netflix and free online streaming services have been attracting TV subscribers (Figure
US entrants investments and low 21). Also, landline phone users have declined due to the rise of VOIP services such as Skype,
 economies of scale Facetime and other instant messaging applications in the past 10 years. If TELUS continues to
 TELUS continuously lose its wireline subscribers, it might negatively affect TELUS’ share price.
 monitors recently
Heath risk
 published studies and [MR] Market risk
 regulations TELUS share performance is exposed to changes in interest rates going forward. One of the
 main characteristics of telecommunication companies is a high leverage due to extensive capital
 expenditures. TELUS has announced several investment plans for the next couple of years
 mainly financed by the issuance of new debt. However, its revenue may not be able to offset the
 Figure 21. TV Subscriber vs Netflix higher debt costs especially if interest rates are going to rise. A resulting decrease in profit
 Subscriber in Canada margins could have a tremendous effect on TELUS’s share price. Moreover, higher interest
 rates may induce investors to invest in fixed income securities rather than equities. As a
12000 consequence, demand for TELUS shares may decrease, which may lead to price depreciations.
10000 [US] US telecommunication companies enter the Canadian market
 8000 In Canada the CRTC, Department of Innovation, Science and Economic Development (ISED)
 and the Competition Bureau are in charge of regulating the communication industry with the
 6000 purpose to increase competition among market players. Thus, TELUS is exposed to regulatory
 4000 decisions which could impact overall profitability and market position. One of the major risks is
 the approval of US companies entering the Canadian market which would increase the
 2000 competitive pressure and, therefore, lower profitability going forward.
 0
 2011 2012 2013 2014 2015 2016
 [LC] Legal claims due to potential health risks
 Increasing data usage and expansion of TELUS’s wireless infrastructure expose Canadian
 TV subscribers(in thousands) residence to potential health risk due to radiofrequency signals. Tighter regulations on
 Source: Statcan. radiofrequency emissions could lead to higher investments in safety standards and, therefore,
 exposes TELUS to increasing legal costs. Proven impact on health issues of residences could
 further lead to legal claims against TELUS and negatively impact reputation and customer trust.
 10
Section A: Business Description
Appendix A1: Corporate Structure.

 TELUS Corporation
 National telecommunication
 company that provides a wide
 range of telecommunications
 products
 Wireless Wireline
 Fastest growing segment; Make up 45% of the revenue;
 Voice and data services provide the
 most revenue; Provides various data services.
 Joint network sharing agreement with
 Bell Canada.
 Telus Home Phone
 TELUS Mobility
 Offers wired connections for fixed monthly rates.
 Attracts elder clients; Providers unlimited calling and up to 9 calling
 Requires fixed term contract. features.

 Koodo Telus Internet
 Targets younger aged customers;
 Fixed term contract is not Offers DSL and dial up services to businesses;
 required Currently upgrading pure fibre internet;
 More flexibility. Second most satisfactory ISP in Canada for 2016.

 Business Connect
 Cloud based PBX which supports VOIP calling;
 Targets small businesses.

 TELUS TV
 Cloud based PBX which supports VOIP calling;
 Targets small businesses.

 Advanced Solutions
 Cloud based PBX which supports VOIP calling;
 Targets small businesses.

 11
Section B: Management and Governance
Appendix B1: Executive Team Members and Board of Directors
Appendix B1a: Executive Team.
Executive Position Career History with TELUS Background Shares
Darren President and Joined TELUS in 2000 Bachelor of Economics (Honours) degree from 626,382
Entwistle CEO served as President and CEO for Concordia University
 fourteen years MBA in Finance from McGill University
 In May 2014, Darren became the Diploma in Network Engineering from the University
 Executive Chair of the Company of Toronto
 August 2015 resumed position as Serves on the boards for the Business Council of
 CEO Canada, the Gairdner Foundation and the Canadian
 Board Diversity Council.
Josh EVP, TELUS Oversees TELUS Health, University of Victoria’s Bachelors of Electrical 265325
Blair Health, Payment Solutions and TELUS Engineering program.
 President, International Graduate of the Executive Program at Queen’s School
 Business Has oversight of TELUS sourcing of Business.
 Solutions West Solutions. Serves on the Board of Governors and Executive
 Chair, TELUS Serves as TELUS’ Chief Committee for the Business Council of British
 International Corporate Officer Columbia and the Governor’s Council of Canada.
David EVP Joined TELUS in 2004, CMO Professional engineer who holds a Master’s degree in 93,374
Fuller President Oversees all aspects of consumer Business Administration from York University
 TELUS marketing, the development and Bachelor of Applied Science in Engineering from
 Consumer and management of TELUS’ full Queen’s University
 Small Business range of products and services for David was the country Managing Director for
 Solutions consumer and small business BearingPoint. He has also held management positions
 customers. with KPMG Consulting and Canadian Pacific.

Doug EVP Doug held progressively senior Eight years working experience in Ernst and Young as
French CFO roles, including Controller for the senior manager in auditing and accounting practice.
 largest business divisions, He supported numerous clients IPO efforts including
 Consumer Solutions, Business Clearnet. He holds a Bachelor of Arts (Honours),
 Solutions and Technology Commerce and Economics from the University of
 Strategy, as well as leading Toronto. He is also a Chartered Professional
 Corporate Accounting, Financial Accountant, a member of the Canadian and Ontario
 Reporting and Bid Governance. Institutes, and is based in Toronto.

Monique EVP Monique is now a trusted advisor Worked at BCE and Bell Canada International before 72,354
Mercier Corporate to the TELUS executive joining Emergis in 1999 as Executive Vice President
 Affairs Chief leadership team and Board of of Law & Human Resources
 Legal and Directors. Graduated from the University of Montreal Law
 Governance School and holds a master's degree in politics from
 Officer Oxford University.

Eros EVP Joined TELUS in 2000, Eros Before joining Clearnet in 1995, Eros held senior 164,847
 Technology served as the executive vice management positions in engineering and marketing at
Spadotto Bell Mobility.
 Strategy president and CTO of TELUS
 Mobility. Responsible for leading Eros holds a Bachelor of Applied Science in Electrical
 TELUS’ integrated network Engineering from the University of Windsor. Master
 technology strategy, guided of Business Administration, from the Richard Ivey
 TELUS through the acquisition of School of Business at Western University in
 Clearnet Communications. Canada. He is a member of the Ontario Board of
 Directors for The Duke of Edinburgh's Award.
Francois EVP President of Quebec and Atlantic Mr. Gratton holds an MBA from Harvard Business 61,478
Gratton President, Canada since 2012 before named School and a Bachelor of Law from the Université de
 Business as EVP for business solutions for Montréal. He sits on the boards of Foundation
 Solutions East Eastern Canada. Guided TELUS Montréal Inc., La Presse, Gesca and Square Victoria
 and TELUS through acquisition of Emergis. Communications Group in addition to being a member
 Québec of Le Cercle des présidents du Québec and the
 Harvard Business School Advisory Board.

 12
You can also read