Guangzhou, China The Chinese University of Hong Kong, Shenzhen - CFA Institute Research Challenge
←
→
Page content transcription
If your browser does not render page correctly, please read the page content below
CFA Institute Research Challenge
 Hosted in
 Guangzhou, China
The Chinese University of Hong Kong, Shenzhen
The Chinese University of Hong Kong, Shenzhen Student Research
 Healthcare Industry
 Hong Kong Stock Exchange
 Ali Health Information Technology Limited

 Date: 02/12/2016 Current Price: HKD 4.05(26/11/16) Recommendation: BUY
 Ticker - SEHK: 241 Headquarters: Hong Kong HK Target Price: HKD 9.16
Figure 1 Summary of Market, Financial and
Valuation Data
 Executive Summary
 Alihealth Information Technology Limited (“Alihealth” or the “Company”), the Hong Kong-listed health
 care flagship of e-commerce giant Alibaba Group, targets mainland China’s growing online healthcare
 market by reportable operating segments: Drug PIATS (Product identification, authentication, and
 tracking systems), Pharmaceutical e-commerce, Medical service network, and Online health insurance
 intermediary.

 Investment Recommendation
 We issue a BUY recommendation on Alihealth with a 12-month target price of HKD 9.16/share with
 a 126.2% upside from its closing price of HKD 4.05 on November 26, 2016. Our target price is calculated
 by (1) using the Simple Regression to forecast the Company's three core business segments’ future
 revenue, and then (2) using the Price-to-Sales ratio & Discounted Cash Flow model to arrive at a
 current intrinsic value of HKD 9.16 per share. Our recommendation is primarily driven by:

 • Promising Industry Outlook – favorable changes in macroeconomic conditions including aging
 population, government deregulation, technology penetration and urgent needs to alleviate inherent
 market pains that drive the online healthcare industry, in transformation into a trillion-dollar one by
 2020, and still with ever-increasing market size.

 • Competitive Positioning - Alihealth is competitive in the Chinese online medical service industry,
 determined by its broader business scope, larger user base, intensive investment it attracted, win-win
 cooperation business strategies, and Alibaba eco-systems. It is predicted that Alihealth will adapt to the
 changing environment and rapidly grab a lucrative share in the emerging industry.

 • Valuation method: Simple Regression and Discount Cash Flow Model with P/S ratio
Source: Company data § Simple Regression, the Company’s revenue is decomposed into three parts based on business
 segment. Each part’s future revenue is estimated by regressing relevant historical data first to
Figure 2 Historical Stock Price from April 2014 to obtain a predicted market size and market share, followed by multiplying each business
November 2016 segment’s market share and the correspondent estimated market size.
 § Discount Cash Flow Model & P/S Ratio, the future value of the Company is obtained by (1)
 multiplying the P/S ratio by the estimated revenue in 2021 as a representative for the
 Company’s perpetual value, (2) taking the summation of free cash flow from 2017 to 2020 and
 the perpetual value together to get the cumulative future value, (3) discounting the future value
 by WACC, and getting the price at HKD 9.16. We believe this value estimation method is more
 market-oriented and more suitable to an emerging industry with enormous uncertainty.

 • Current Undervaluation of Alihealth Shares, based on our valuation and the high discount to
 the common shares relative to its historical trading performance, Alihealth’s stock price is
 undervalued partly due to its great loss in the fiscal year 2016, which we believe is temporary.

 • Investment Risks, including changeable regulation, resistance from traditional healthcare
 stakeholders, abnormal equity structure etc. and that were (1) assessed for impact and likelihood and
Source: Yahoo Finance
 subsequently ranked in a risk matrix, and (2) modelled through a Monte Carlo simulation.
Selected Key Financials (Thousand HKD)
 Figure 4 Consolidated income statement
 2014 2015 2016 HKD/RMB=0.8
Revenue 21,990 29,744 56,595 2016 2015 2014
 Revenue Growth / 35.26% 90.27% RMB ’000 RMB ’000 RMB ’000
Gross Profit 10,851 15,964 37,993 REVENUE (PIATS) 56,595 29,744 21,990
 Gross Margin 49.35% 53.67% 67.13% Cost of revenue (18,602) (13,780) (11,138)
Cash And Cash Equivalents At Beginning Of The Year 84,534 173,102 1,213,586 Gross profit 37,993 15,964 10,851
 Net Cash Flow From/ (Used In) Operating Activities 1,295 (55,387) (117,175) Other income 14,702 87,238 3,664
 Net Cash Flows From/ (Used In) Investing Activities 8,593 35,177 (430,033) Sales and marketing expenses (80,787) (54,014) (5,181)
 Net Cash Flows From Financing Activities 78,682 1,060,694 - Administrative expenses (91,797) (58,950) (28,254)
 Net Increase (Decrease) In Cash And Cash Equivalents 88,568 1,040,484 (438,769) Product development expenses (76,153) (34,130) (13,502)
 Other expenses (26,143) (54,241) (706)
 Adj: Effect On Foreign Exchange Rate Changes 0 0 39,040
 Share of profits and losses of:
Ending Cash and Cash Equivalents 173,102 1,213,586 813,857
 A joint venture 11,892 5,688 (1,453)
Current Ratio 2.16 10.10 5.57
 An associate 13,176 9,268 7,682
Total Debt Ratio 28.76% 10.07% 14.31% LOSS BEFORE TAX (197,117) (83,178) (26,898)
Profit Margin -125.81% -282.76% -351.56% Income tax expense (1,851) (927) (768)
Asset Efficiency 7.29% 3.75% 4.62% LOSS FOR THE YEAR (198,968) (84,105) (27,666)
Leverage 1.00 1.00 1.00 Attributable to:
Note: (1) Only figures from 2014 to 2016 is useful for analyzing the Company Owners of the parent (191,608) (81,221) (31,360)
 Non-controlling interests (7,360) (2,884) 3,694
due to its transition in 2014. Thus, Revenue Growth rate in 2014 cannot be LOSS PER SHARE ATTRIBUTABLE
calculated. (2) The reason why there is a great increase in unlevered cash is that TO ORDINARY EQUITY
the Company generated over HKD 1 billion investment through issuance of new HOLDERS OF THE PARENT
 Basic and diluted RMB(2.34) cents RMB(1.04) cents RMB(0.84) cents
shares. Figure 3
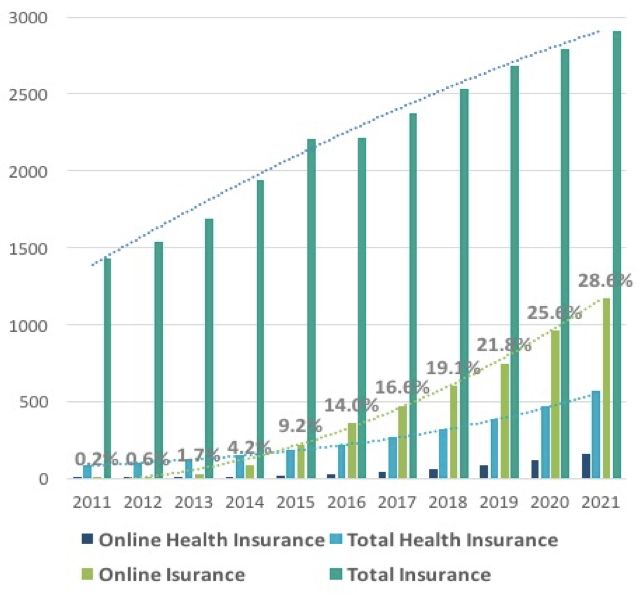
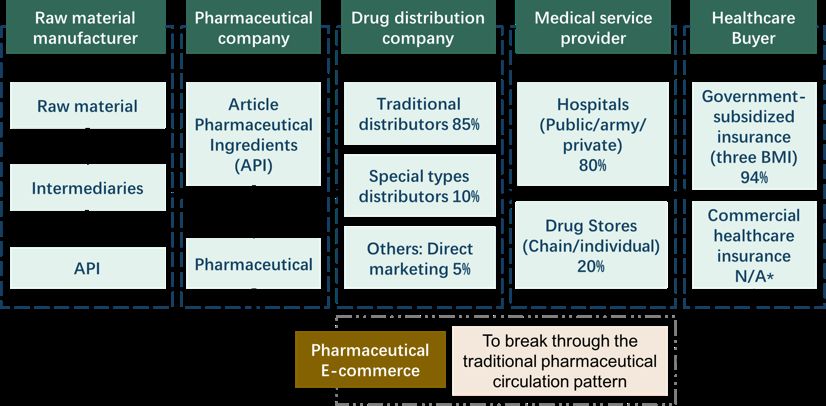
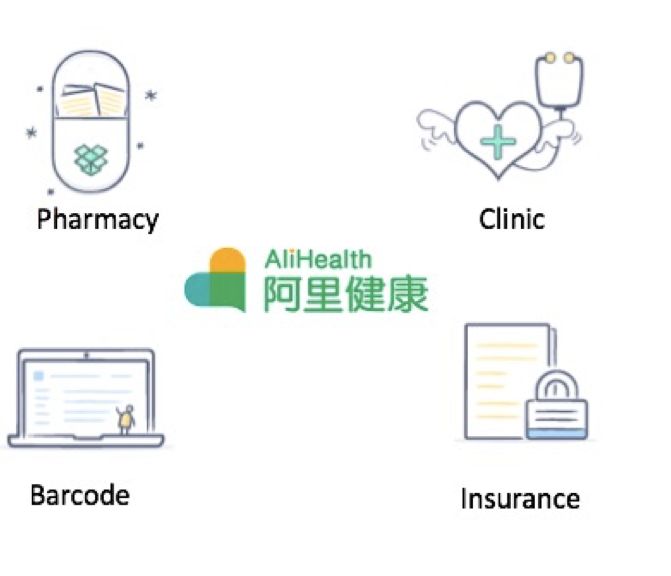
Figure 5 Alihealth Expenses Categories in Fiscal Business Description
2016 (in million)
 Alihealth is an integrated healthcare information and content service provider, entrancing itself in
 mainland China. It was originally called CITIC 21CN but changed the name in 2014 when the Alibaba Group
 bought a 54% stake in CITIC 21CN.1 The predecessor CITIC 21CN is a Hong Kong-based telecom and
 information company. In succession of CITIC 21CN’s latest advances in information technology, Alihealth
 is capable to offer internet-based solutions for the healthcare industry.

 The company is currently operating with negative net income, and its operating loss doubled in fiscal year
 2016 (Figure 3) mainly due to its great expenses in marketing, administration, and product development
 (Figure 5). In particular, product development expenses increased by RMB 42 million, or 123% compared
 with the preceding year. Acting as a novice in an embryonic industry with enormous uncertainty, the high
 operating cost is inevitable and we believe the net loss is temporarily acceptable. Overall, Alihealth’s
 business scope will promise it considerable rewards if it successfully expands from the drug-coding system
 to an e-pharmacy platform, online consultation and diagnosis services and selling health insurance
 (Figure 7).
Source: Company data
 • Drug PIATS
Figure 6 Alihealth Gross Profit Growth Drug PIATS (Product Identification, Authentication, and Tracking System) is Alihealth’s main revenue
 stream from 2014 to 2016, and its franchise of PIATS was granted by Chinese Food and Drug
 Administration (the CFDA). However, the medicine tracking system was relegated from mandatory to
 voluntary status by the government in February 2016, which would momentously affect Alihealth’s
 business performance. For this reason, the Company’s share price dropped by 16% on the next transaction
 day after the policy on PIATS was released (Figure 32).2

 Therefore, Alihealth seeks to expand by venturing into other three business segments as substitutes, i.e.
 pharmaceutical e-commerce, medical service network and online insurance (Figure 7). Although these
 three functions are still under construction, their future prospects are still estimated to be promising.

 • Pharmaceutical E-commerce
 Chinese healthcare market is highly fragmented, and there is a long supply chain before the healthcare
 products are received by the customer (Figure 8), leaving much room for improving efficiencies in the
 pharmaceutical products supply chain. Alihealth aims at using Internet-based technology as a solution,
 simultaneously use it to increase the transparency and reduce information asymmetry (Figure 9).
Source: Company data
 Online drug sales in China requires qualification certificates. Alihealth has got permission like this by either
 acquisition or cooperation, enabling itself occupying the market rapidly (Appendix 14). The integration
Figure 7 Ali Health Product and Services
 will provide consumers the widest range of pharmaceutical and healthcare products available in China,
 and thus drive the user traffic for its websites or applications. These interminable efforts aim to increase
 customer satisfaction and increase occupancy rates.

 • Medical Service Network
 The PRC government has implemented various healthcare reform initiatives to encourage a tiered medical
 service network and encourage doctors to practice at multiple locations (Appendix 11).5 Meanwhile,
 Internet, big data and various innovative technologies have provided new opportunities to address
 healthcare sector issues.5 Under such circumstances, integrated medical service network can be beneficial
 business model initiatives for Alihealth as well.

 The sharp market pains of traditional healthcare industry are demanding prompt solutions, which implies
 a great market hole for Alihealth to fill by building a networked medical service community, in assistance
 of alleviating the problem of uneven distribution of medical resources between urban and rural areas, and
Source: Company website, www.alihealth.cn.en fulfill the growing pharmaceutical and healthcare needs of the rural populace (Figure 9). 10

Figure 8 Supply Chain of Traditional
Pharmaceutical Industry vs. Online Pharmacy
(Figure on the right)
Source: Deloitte

Figure 9 Expectation of Internet Medical Service

 • Online Health Insurance Intermediary
 The online insurance platform brings insurance provider, healthcare facility, and consumer together,
 aiming at connecting claim, payment, pharmacy, and health services, and facilitating patient medical
 process.
Source: Deloitte
 The central government of PRC expects commercial health insurance claims to take up a greater proportion
 of the total health expenditure in mainland China by 202011. Data from the Insurance Association of China
 showed that online insurance premiums grew 260% year-on-year to RMB 81.6 billion during the first half
 of last year. In addition, it is estimated that digital insurance sales in mainland China will reach RMB 400
billion in 2018, accounting for 12% of the country’s entire insurance market, estimated to be worth RMB 3
Figure 10 Estimation of Online Health
 trillion (Figure 10). However, currently, the present market size of Internet insurance business only makes
Insurance Market (in Billion)
 up a tiny proportion of the whole insurance market in China, which leaves great opportunities for Alihealth
 to explore in the insurance market. Thus, Alihealth actively capitalizes on the trend seeking for eligible
 ventures such as Taiping Life and Ping An Insurance Company (Appendix 14).

 Shareholder Structure
 As of March 2016, the largest beneficial owner of Alihealth is Perfect Advance Holding Limited (“Perfect
 Advance”), amounting to 54.09% of the total outstanding shares (Figure 11). Perfect Advance is owned by
 Alibaba Investment Limited (“AIL”) as to 70.21% and AIL is wholly owned by Alibaba Group Holding Limited
 (Figure 11). Therefore, Alihealth is seen as an affiliated entity of Alibaba Group. Since Alibaba is the Chinese
 E-commerce giant with strong assets, good profitability, and the traffic that flows over its sites dwarfs that
 of the other e-commerce companies, Alihealth is brought to the spotlight and is expected to gain a larger
 customer base under Alibaba’s umbrella. However, the one share being overwhelming big and interior agent
 control will cause sort of problems, which will be mentioned in the ‘Risk’ section.

 Corporate Governance
Source: National Bureau of Statistics & team analysis
 Alihealth has recently changed all the executive managers to those with ‘Alibaba background’, either
 appointed as managers by the Group before or had working experiences there. Mr. Wu Yong Ming, from
Figure 11 Shareholder Base Alibaba Group, has been appointed as the Chairman of Alihealth in April, 2015. As one of the 18 founders of
 Alibaba Group, he was responsible for its search business, advertising and wireless services for more than
 15 years. Later, Mr. Wang Lei has been appointed as a chief executive officer of the company with effect from
 April 17, 2015. Prior to his current position, Mr. Wang has held various positions within Alibaba Group since
 joining in 2003 (Appendix 12).6 With two experienced senior managers to join Alihealth, Alibaba Group
 shows its ambition to promote healthcare service development.

 Industry Overview & Competitive Positioning
 The Internet-based healthcare industry has just been in the ascendant. In just four years, China’s online
 healthcare delivery business soared by as much as 674%, from $31 million to $2.4 billion in 2015 (Figure
 12).8 As predicted, the health care spending in China will grow to $1 trillion by 2020.7 The combined forces
 of demographic development, government stimulus, enhanced health awareness among the public, and
 improved R&D capability may help the industry to reach a more sophisticated market.

Source: Company data
 Demand Drivers
Figure 12 Future Market Size of Online Medical Demographics
Services (in million) China’s vast population is aging fast. The senior population (over 65 years old) accounts for 9.7% of the total
 population in 2016, considerably rising from 8.4% in 2011 (Figure 13). The elderly, who have a higher
 incidence of disease, longer and often more complicated treatment courses, incur five times more medical
 expenditures than their younger counterparts (Figure 15), amounting to RMB 1072.3 per person annually.
 Overall, changing population structure leads to great pressure for government in providing a complete public
 medical service system, and also opportunities for healthcare providers potential value-added space.

 Urgent Needs to Alleviate Healthcare Market Pains
 The traditional healthcare industry is decaying, leaving severe problems including scarcity of national
 medical resources, uneven distribution, and doctor-patient information asymmetry, etc. (Figure 9 &
 Appendix 11). For instance, there are 35 and 28 third-grade Class A hospitals in Beijing and Shanghai
 respectively, while for Tibet, Hainan, and Guizhou, the numbers are 1, 6, and 6. Worse still, outpatient doctors
 who used to treat 60-70 patients daily 20 years ago now need to treat at least 120 patients a day. It is
 fundamental to improve the doctor’s work efficiency and upgrade the hospital operation mechanism. Future
Source: Analysis 易观智库 medical service will not be limited to a hospital or region; patients may, depending on their needs, choose
 the doctor team and treatment location using online, offline or a combination of resources. It is exactly what
Figure 13 Aging Chinese Population Alihealth is implementing, which should increase service and treatment effectiveness, and thus appeal to a
 broader customer base.

 Government Deregulation
 Various policies have also been introduced by
 Chinese government to alleviate the market pains
 illustrated above, one of them is encouraging
 online medical companies to participate. As part of
 its ongoing medical reforms, China is trying to
 lessen hospital reliance on drug sales for revenue
 as it hopes to enable patients to choose on whether
 to buy prescription drugs in hospitals or retail
 pharmacies (E-pharmacy included). Authorities
 have given opportunities for e-commerce firms
 such as Alihealth to enter the prescription drug
 business through selling OTC and prescription
Source: Deloitte drugs online. Once the prescribed drugs policy is
 fully liberalized, the existing drug market is
 expected to shift from the hospital and retail
Figure 14 Shift of Existing Drug Market terminals to the online and e-commerce terminal.
(See figure on the right) It is estimated that about RMB 150 billion sales
Source: Deloitte amount will transfer from hospital and retail
 terminal to online e-commerce terminal (Figure
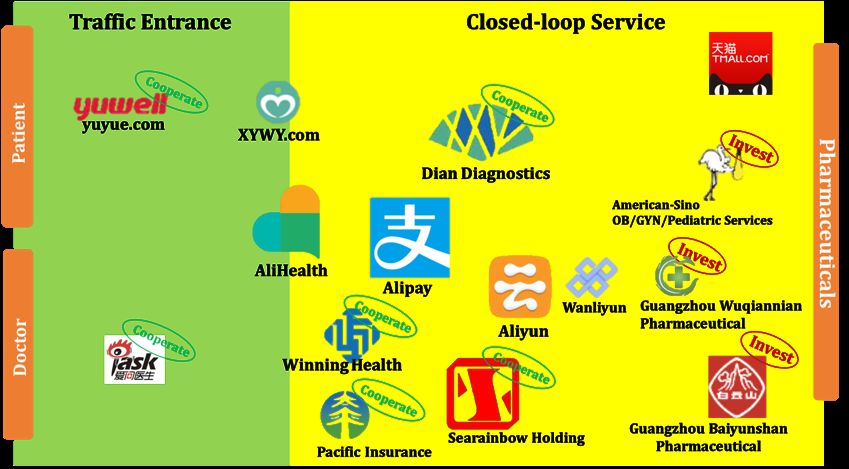
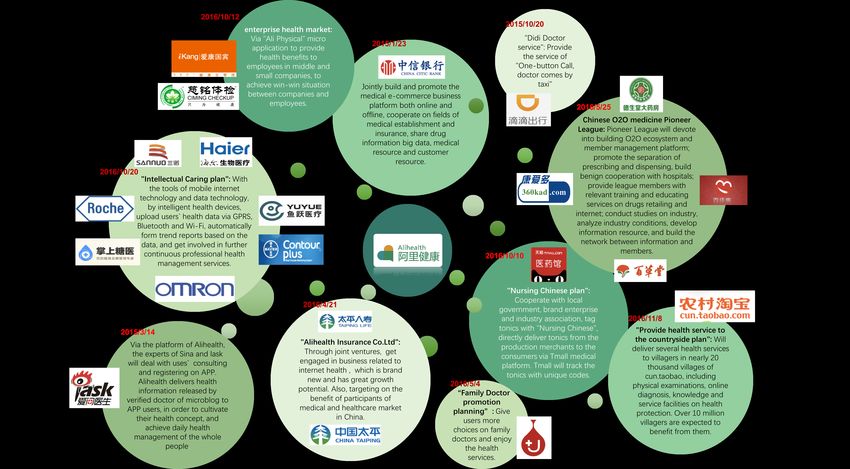
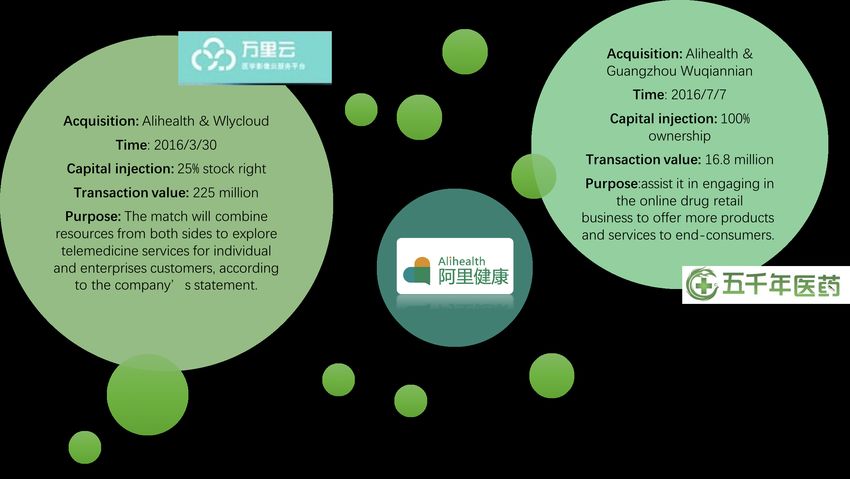
14), which is a great market Alihealth can grasp.
Figure 15 Annual Average Medical
 Additionally, Chinese government approaved the doctors’ multi-sited practice legal, making it possible for
Expenditures in Different Age Group
 services such as tele diagnosis and online family doctor, which are Alihealth’s main business segments
 (Appendix 11).

 Penetration and Development of Technology
 Internet medical services industry is intensively intermingled with intellectual technology to generate its
 social and commercial value. The revolutionary trend of using big data and cloud computing techniques can
 help institutions like Alihealth to build up an integrated medical services network. In respect of the online
 pharmacy and clinics, the increasing prevalence of mobile devices and Apps among middle age and elderly
 group, where 20% users aged over 40, creates a great opportunity to enlarge the industry customer base
 (Figure 16).

 Competitive Positioning
 Considerable Investment in Alihealth
 Alihealth has strongerer financing capability since 2014 IPO, where it received more than 1 billion RMB
 investment. Among all its competitors, only We Doctor, which is partly funded by Tencent, has ever surpassed
Figure 16 Comparison of age structure of Alihealth (Appendix 8b). However, when taking financing rounds into consideration, Alihealth has absorb all
Chinese Internet Users in 2008 & 2014 its investment within one round, i.e., the issuance of shares in 2014, while We Doctor has gone through five
 rounds of financing. Additionally, almost all Alihealth’s competitors have not gone public yet, while Alihealth
 is listed in the HK stock market. This also promises Alihealth a fruitful future of raising funds from the public
 to support its expansion.

 Broader Scope of Healthcare Services
 Alihealth is proceeding faster in building an integrated multi-functional network than its rivals. It is noted that
 among all the competitors, only IT giants Baidu and Tencent, are comparable with Alihealth for their evenly
 matched capital strength as Alibaba Group. However, comparing business scope and spectrum, Alihealth
 projects to provide the widest range of services in the idustry, including e-pharmacy, tele diagnosis, family
 doctor, specialist appointment, online insurance, health knowledge, and health examination (Figure 17). In
 contrast, Baidu Doctor and We Doctor, which are funded by Baidu and Tencent respectively, only provide
 limited services.
Source: Deloitte

Figure 17 Internet Medical Services offered Larger Active-user Amount
by Alihealth and its Competitors Alihealth is capable to achieve a larger user base within a shorter period compared to other online healthcare
 providers. Since 2014, Alihealth has launched its own APP, and until the 4th quarter of 2015, its APP active-
 users’ penetration rate has arrived 8.3% (Figure 18). The high penetration rate can attribute to the high
 expenditures on marketing, a well reputed patron Alibaba, and eligible cooperators such as Tmall Medicine
 (the largest E-pharmacy platform in China) (Appendix 14a).

 Bunches of Win-win Cooperation with Various Companies
 To build the whole Internet healthcare ecosystem in China, Alihealth has cooperated with various companies
 with respect to different business segments including smart medical devices, health management tools, and
 online medical selling, etc. For example, in terms of pharmaceutical e-commerce, the Company spent 16.8
 million RMB to fully acquire Guangzhou Wu Qian Nian Pharmaceutical Chain Co., Ltd, which enables it to
 provide more products and services to customers online. In an attempt to reverse the situation of low user
Source: Analysys 易观智库 flow rate, Alihealth cooperated with Iask Doctor, so as to take the advantage of Sina’s great number of online
 users and direct more traffic to Alihealth platform (Appendix 14a).

Figure 18 Market share of third party mobile Alibaba Ecosystem to Increase User Loyalty
payment transaction size in China, 2016Q1 Alibaba Group, as Chinese greatest E-commerce giant, provides great many mature supporting applications in
 assistance of Alihealth’s operation (Appendix 8e). Alibaba’s ecosystem establishes a closed-loop business, to
 increase user loyalty (Appendix 8d). Alihealth exploits this feature, by using Ali Pay (China’s largest online
 payment tool with 13% larger user base than the second player) to lock its users and cultivate user loyalty.
 (Figure 19). This action will ensure Alihealth a stable flow of users and market share in the future.

 Investment Summary
Source: Analysys 易观智库
 We issue a Buy recommendation on Alihealth with a 12-month target price of HKD 9.16/ share with a
 projected total return of 126.2% from its November 26, 2016 closing price of HKD 4.05.
Figure 19 Chinese Online Payment
Penetration Rate
 Investment Drivers
 Growing Demand for Online Healthcare Services and E-pharmacy
 The demand for Internet-based healthcare and medical services has been growing at an extremely fast speed,
 and the mobile terminal will play an increasingly important part, which is projected to account for 55% of the
 total Internet-based healthcare market (Figure 20). Benefited from the macroeconomic condition, the rapid-
 growing and high-yield industry, amounting to a total value of 693 billion RMB till 2020, gives a promising
 premise for Alihealth’s future market cap.

 Great Financial Support from Alibaba Group
 Aliheath is a subsidiary of Alibaba, the leading e-commerce giant in China. Based on the strong financial
 support from Alibaba Group, Alihealth is accelerating the cooperation and acquisition in medical business to
 construct the framework of a whole medical e-commerce ecosystem (Appendix 14).
Source: XinHua.com
 • For e-commerce drug sales, Alihealth recently worked with a network chain of 65 drugstores in China,
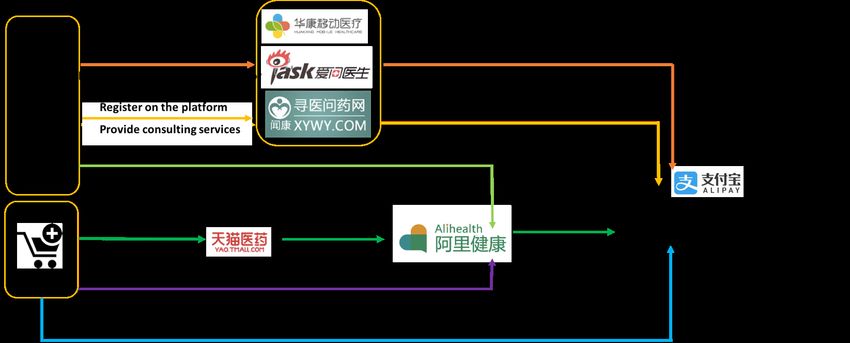
making the latest step to get e-commerce drug sales rolling in the country. In addition, Alihealth bought
 full ownership of Guangzhou Wuqiannian Medicine Co Ltd with RMB 16.8 million, which holds the
Figure 20 Market Size and Market Structure Internet Drug Transaction Service Qualification Certificate, in order to assist itself to engage in the
Forecast of Internet Medical Service in 2017 online drug retail business to offer more products and services to end-customers.
 • For online health insurance market, Alihealth established an internet health insurance-related
 operation with six other companies through a venture with a proposed registered capital of 1 billion
 RMB.
 • In order to make better use of latest technology for its remote medical services, Alihealth invested $35
 million to acquire 25% stake in China Resources Wandong Medical Equipment’s medical imaging unit.
 This company builds cloud-based big data medical imaging platforms along with cloud storage to
 support remote medical imaging services.

 Strong financial position supported by Alibaba with 100% equity and 0% debt allows Alihealth to venture
 into a broader business scope to seek for more targeted customers and thus a larger market share in the
 online healthcare realm.

 Significant Amounts of Traffic Directed by Yao.tmall.com
 Alibaba transferred the operation rights of Tmall’s online pharmaceutical business to AliHealth in April 2015.
 Tmall is the largest third party e-commerce medicine selling platform, which has a dominant position in terms
 of sales volume in B2C medical area (Figure 21), and also for the whole E-commerce business which accounts
 for more than 50% of the total market share (Figure 22). Although Tmall has ceased online sales of medicines
 since August 1st, 2016 because Chinese government tightened its control over the country’s nascent e-
 pharmacy industry, Tmall can still help to generate and direct more site traffic and build scale to Alihealth.
 Additionally, Alihealth will be able to offer consumers the widest range of pharmaceutical and healthcare
 products available in China, because Yao.tmall.com hosts 186 licensed pharmacies offering over-the-counter
 medicine, contact lens, medical devices, and other general healthcare products. We estimate the sales
 generated after cooperation with Tmall will become the primary revenue for Alihealth in the immediate
 future.

 Formation of the Closed-loop System Thanks to the Establishment of Whole Healthcare
 Ecosystem
 Alihealth is trying to extend service from medicine towards health care by carrying out cooperation with
 dozens of hospitals, medical institutions, medical organizations, insurance companies and other online
 medical platforms. Its goal is to build a healthcare ecosystem that can utilize e-commerce, big data and other
 technologies to improve the healthcare supply chain and ultimately provide users with a better healthcare
 experience.
 Currently, there are large amounts of Internet medical service providers focusing on professional, vertical
 breakdown of different areas, such as Chunyu Doctor and Jiuyi 160, which only provide a limited range of
 services (Figure 17). In comparison, Alihealth provides various services including e-pharmacy, tele diagnosis,
Source: BCG data family doctor, and insurance. This will help to increase customer stickiness and loyalty.
 In addition, Alipay, which is the most famous online payment tool in China (Appendix 8e), will also pave the
 way for Alihealth, providing online payment support for transactions on Alihealth.
Figure 21 Sales Volume of Alihealth’s Online
Drugstore Yao.tmall.com and its competitors
 Investment Methodology
 Our target price is calculated by (1) using the industry average Price-to-Sales ratio to estimate the Company's
 three core business segments’ future revenue, and then (2) using the Discounted Cash Flow model to arrive
 at a current intrinsic value of HKD 9.16 per share.

 Investment Risks
 Key risks pertaining to Alihealth include:
 • Regulatory risks, including the changeable regulations on online pharmaceutical and healthcare
 industry and the difficulty to obtain specific certificate to run a new business
 • Market risks, including strong resistance by retail pharmacy and other stakeholders
 • Corporate governance risks, including Alibaba Group’s dominant governance and act as the majority
Source: niuniuwang.cn shareholders
 Other risks either trivial or shared by the whole stock market will be discussed in the Investment Risk section.

Figure 22 Market share of Chinese e-
commerce B2C platforms Valuation
 Overview of the Valuation Methodology
 We basically used the Discounted Free Cash Flow to Firm (DCF) method in arriving at a value per common
 share of HKD 9.16. This method involves projecting its free cash flow to year 2020 and estimating the firm’s
 terminal value in year 2021 by using Price-to-Sales ratio. The time selection is based on our assumption that
 Alihealth’s business model will become mature and tends to be stable after five years’ ups and downs.

 In applying the DCF analysis, the company was broken down into three components based on its core business
 segments excluding the PIATS which was suspended by CFDA in February 2016. We forecasted the core
 components using a two-stage growth model. The first phase includes a detailed year-to-year forecast up to
 2020, and for the second phase we used a terminal value derived from revenue. The first phase of the forecast
 covers the most uncertain growth and development period for the Company with various changes but merely
 accounting for 2.454% of the cumulative present value, while the largest proportion of the Company’s value
 lies in the second period. We estimated the terminal value as its growth opportunity in the future by applying
 P/S ratio. Based on this approach, Alihealth’s value HKD 9.16 per share is calculated (Figure 23).
Projecting 4-year Free Cash Flow
Figure 23 Valuation Summary Revenue: Revenues can be decomposed into the revenue from pharmaceutical e-commerce, medical service
 network, and online health insurance intermediary. Each business segment’s future sales can refer to the
 market share Alihealth occupies in each business segment for each year, and multiply the overall industry
 market size respectively. By summing up the revenue derived from the three business segments, we can get
 the estimated revenue for the next five years (Figure 24). The estimation of the revenue from 2017 to 2021
 is interpreted in the Terminal Value Estimation part as elaborated as follows.

 Weighted Average Cost of Capital: The cost of equity was calculated using the CAPM. The risk free rate of
 2.89% was based on the current yield of 10-year bonds (November 2016, The People’s Bank of China). Beta
 of 1.9985 in the year 2017 was computed by regressing historical Alihealth returns with the Hong Kong
Source: Team estimation Tracker Fund (2800) returns from November 2014 to November 2016. The market premium of 7.6% is based
 on a local study that analyzed 71 countries in 2016. Applying CAPM to the components above resulted in a
Figure 24 Revenue Estimation cost of equity of 18.08% in 2017 (Figure 25).

 For the cost of capital part, since Alihealth does not have any debt up to now, we believe that the Company has
 received great support from the Alibaba Group. By analyzing the annual reports of some other Alibaba’s
 subsidiaries such as Suning Yun Shang (苏宁云商), we found that they do not incur debt at the initial period
 of development, so we expected that Alihealth will not have any debt in the next 4 years. Therefore, the WACC
 is equal to the cost of equity, which is 18.08% from year 2017 to 2021. After year 2021 when the Company
 becomes mature, Alihealth may more or less incur debts and borrowings, but we don’t need to consider the
 cost of debt in our valuation because we used the P/S ratio in estimating the terminal revenue after year 2021.

Source: Team estimation Terminal Value Estimation: P/S Ratio
 Apart from traditional Discounted Cash Flow model, Alihealth requires a revenue valuation methodology that
Figure 25 WACC Analysis is more market-oriented, to fit with the characteristic as a firm belonging to the online healthcare industry –
 i.e. operating emerging business with potential high yield but negative earnings for present, high market
 expectation and concentration but also great uncertainty. This prompts us to employ the P/S ratio as a bridge
 to connect the estimated sales with terminal value. The reason why we chose P/S ratio and the main idea
 behind it will be explained in detail in Appendix 6.

 The first step is that we directly picked the forecasted revenue of each industry division for the Company’s
 core business segments in the year 2021. Then, Price-to-Sales ratio is involved in our estimation: the
 numerator is viewed as an indicator of Alihealth’s market value while the denominator can reveal its actual
Source: Team estimation performance. Alihealth’s three business segments are operated in three unique industries, competing against
 different competitors, and therefore we should use different P/S ratio for each business sector. After randomly
Figure 26 Monte Carlo Simulation selecting 20-30 representative companies from home and abroad for each sector, we calculate the average
 P/S ratio by deducting the highest one and lowest one as an ease of some extreme cases (Appendix 2). Given
 the revenue of three segments in year 2021, we then multiply each segment’s revenue with correspondent
 industry P/S ratio respectively and obtain the market value. Predicted market value for each business
 segments in year 2021 is then summed up to be our terminal value in the valuation. For the detailed
 calculation steps, please refer to Appendix 2.

 Summary of Valuation
 Using the WACC of 18.08% to discount the Company’s future value to the present year of 2016, and then adjust
 for the exchange rate between CYN and HKD, the estimated stock price of HKD 9.1586 can be calculated, which
 indicates that Alihealth is undervalued at present. However, as mentioned earlier, this result comes from
 ignoring PIATS business when estimating the future revenue for the company, while PIATS may create positive
 economic value added (EVA) to the company in the future. Since the EVA is hard to estimate, we take the
 expected value of EVA to be zero in our valuation, which gets our target price at HKD 9.16.

 Monte Carlo Simulation
 It’s clear that with our valuation model, the standard deviation at 0.249345 is reasonably low. Setting the
 mean to 9.16, with the low standard deviation, after 100000 times counting, the 95% confidence interval of
 price ranges from 8.67 HKD to 9.65 HKD, which is quite centralized to our valuation price 9.16 HKD. This is a
 fair support for our highest expected price valuation due to the minor fluctuation (Figure 26). A probable
 reason why the result of the Monte Carlo sensitivity analysis has such a high degree of concentration is that
 using some relatively small-sized database we collect may result in over fitting, which will lead to a smaller
 variance in the Monte Carlo simulation. This is limited by the amount of data we are able to access to. For the
Source: Team analysis detailed calculation steps, please refer to Appendix 15.

Figure 27 Cash and Cash Equivalents 2014- Financial Analysis
2016
 The selected key financials on the first page reveals Alihealth’s prospects moving forward, highlighting our
 assumption. Alihealth is an extremely new company given birth from CITIC 21CN in 2014. The years prior to
 2014 are thus not ideal starting points for our financial analysis since business strategies were radically
 altered after the transformation.

 Solid Cash Reserves Aided by Share Issuance
 Alihealth’s unlevered free cash flow has increased drastically from 177 million in 2014 to over 1 billion in
 2016 (Figure 27). A crucial reason for such a high cash reservation is that Alihealth issued new shares in
 April 2014, contributing an increase of cash by six times. Thanks to its high cash reserves to support its
 business operations, Alihealth has zero bank loans and extremely high liquidity. This will give Alihealth more
 flexibility in operation and less financial constraints, enabling it to grasp more investment and development
Source: Company Data opportunities in the future.
Increasing Gross Profit Margin
Figure 28 Gross Profit and Gross Margin The Company had an increased gross profit margin of 67.1% for fiscal year 2016 as compared with that of 53.7%
 for the preceding year (Figure 28). The improvement in profitability was mainly attribute to the economies of
Growth
 scale in the operation of drug coding system. Additionally, Alihealth is providing healthcare services using latest
 technologies, which has no cost in inventory and relatively low cost of revenue compared to other product-
 selling and physical-store-based businesses. Forward looking gross profit will amplify due to the increase
 demand and larger market cap.

 ROE Decomposition
 Alihealth is a special case in stock market, with negative net profit while still captive to investors. It has been
 suffering a great loss in the past 2 years, while witnessed a 600% growth of its equity which reflects high
 investment confidence. The current ROE is a negative number but as our projection, the negative ROE will turn
 positive in 2019 to ~25.74%. The main drivers of this reverse include profitable businesses, high efficiency of
 using assets and meanwhile maintaining none-debt-incurred operation.

 Flexibility in Financing Future Ventures
Source: Company data Frequent mergers and acquisitions of Alihealth was funded through a 100% equity and 0% debt structure. The
 credit profile frees Alihealth from encumbrance by either short-term or long-term interest payment and debt
 obligations. The combination of target capital structure and their financing capability will allow them to acquire
Figure 29 ROE Decomposition a more diversified portfolio of facilities. The revenue generated from these increased acquisitions will lead to
 Alihealth growth.

 Grasp Opportunities to Expand
 In fiscal year 2016, the cost of revenue increased by 35%, spitted up by the product development expenses
 (+123.1%), administrative expenses (+55.7%), and the sales and marketing expenses (+49.6%) (Figure 29).
 It’s common for a firm in its infancy eager to occupy the market, not to mention Alihealth is enduring the
 transition sandwiched among drug retail stores, hospitals, authorities, and rivals. The high expenses on R&D
 and marketing is projected with a 5-year CAGR of 159% until the company ultimately secure its throne of the
Source: Company Data industry.

 Economic, Social, and Political Backdrop Conductive for Further Revenue Growth
Figure 29 Alihealth’s Operating Expenses Attractive outlook, including the favorable demographic trend, the increase technology penetration rate,
 unsolved market pains and the government gradual deregulation, are presented for Alihealth.
2014-2016
 Their core businesses are likely to surge from the macroeconomic movements, leading to a projected 5-year
 revenue CAGR of over 200%. Taking a closer look into each division, the market share and aggregated result
 are estimated to be 45% and 110.60 billion for E-pharmacy, 10% and 40.84billion for online medical service
 network, 4% and 6.01 billion for online health insurance intermediary, provided that they keep on integrating
 online and offline medical distribution channels through acquisition and joint ventures.

 Investment Risks
 Regulatory Risk
 [R1] Certificate to Run a Business (Low Probability, High Impact)
 Drug PIATS has been the primary revenue generator of Alihealth. The suspension of PIATS business by CFDA
 may completely cut off Alihealth’s revenue source, which has brought 90.3% revenue growth rate during the
 past year. The stock and events chart shows how regulation shook Alihealth’s stock price (Figure 32).

 However, the overall policy environment is mild. Beijing hopes to boost retail drug sales at pharmacy chains
 and online, and wrest some sales away from hospitals, which currently control around 75% of drug sales, so Ali
 Health still has opportunities to expand its online business. Thus, we evaluate the risk as low probability.
 To retain the growth in their ancillary business segment, Ali Health can work closely with relevant PRC
 authorities to secure the operations conducted under CFDA’s direction. Another strategy is to network with
 hospitals and pharmacy companies, building partnership rather than rivalry, as the PIATS’ temporary
 brokerage is a result of being sued by some pharmacy companies.
Source: Company data

 Economic Risk
Figure 30 Risk Matrix [E1] Financial Crisis Accompanied with Purchasing Confidence Plunges (Low Probability, High
 Impact)
 We cannot exclude the possibility of recession caused by either natural disasters or wars domestically or in
 neighboring countries. Though the last time of consumption downturn should trace back to 1960s, namely fifty
 years ago, the low likelihood of economic depression does not mean that we can ignore its devastating effect.
 Figure suggests that a trivial decrease of retail commodity sales than our estimated value will result in a
 significant drop of price.

 Operational Risk
 [O1] Legal and Ethical Issues of Dispensing Errors (Moderate Probability, Moderate Impact)
 As a pharmaceutical e-commerce operator, Ali Health may easily be involved in the legal and ethical issues
 related to safety and health hazards that the lack of oversight may pose on patients.
Source: Team analysis To minimize the likelihood of those dispensing errors, Alihealth inspects international pharmacies and only
 approves those meeting stringent safety requirements with required prescription. The drug PIATS is one of
 tracking solutions that can assist Ali Health’s online platform providing authentication services to customer.
 [O2] IT Systematic Error (Low Probability, Low Impact)
 IT operational risks in digitalized pharmacy can be characterized by following event factors: internal and
 external fraud, which is an act committed by employees or a third party that may lead to data theft/loss,
 computer homicide such as using IT systems to perform a hateful act that results in the death of a patient, and
system failure that occurs in a multitude of ways once a pharmacy business is automated. To mitigate risk like
 this, the Company should maintain the supervise of pharmacy information systems and fix its systematic error
Figure 31 Effect of Alihealth’s percentage of immediately after it occurs.
 [O3] Acquisition Risk (Low Probability, Moderate to High Impact)
market share on Targeted share prices Alihealth faces a significant amount of acquisition risk due to their aggressive growth strategy. It acquired
 Wuqiannian Inc. with 168 million RMB, a noteworthy amount accounting for ~10% of its total equity. There is
 thus a high impact if such investments fail to perform in accordance with managerial expectations. Thus,
 cautiously weighting the qualification of every merged corporation is necessary.

 Market Risk
 [M1] Immature Market with Unstable Demands (High Probability, Low Impact)
 Demand is unstable for an emerging online business, as most consumers still concerns about the safety and
 reliability of Alihealth. The mismatch of supply and demand frequently happens in pharmacy industry. Since
 the loss owing to shrinkage is not significant, pharmacies commonly accept it or pass on higher prices to
 consumers.
 [M2] Strong Resistance by Retail Pharmacy (High Probability, Moderate Impact)
 The resistance from retail pharmacy may constrain Alihealth’s future expansion through squeezing it out of the
Source: Team estimation market. Apparently, from the charts on the bottom-right corner, stock price may fluctuate from 1.61-18.82 if
 we gave different percentage changes for each component (Figure 31). The impact is undeniable as significant
 and the only mitigating factor is to cooperate instead of compete with provincial pharmaceutical institutions.

 Corporate Governance Risk
 [C1] Shareholder Structure Unfavorable to Minority Shareholders (Low Probability, Low Impact)
 Alihealth’s current shareholder structure is favorable to Alibaba Group itself while may be a threat to other
 minor shareholders, since more than 50% of the total shares are under the control of Alibaba Group. Thus,
 there will be a danger that Alibaba group dominates the decision process when deciding the Company's future
 strategy and direction, which can be a threat to other shareholders. For example, they may decide to issue an
 equity offering to all of its shareholders for financing purpose, which will cause benefit loss for the minor
 shareholders, because the equity offerings will flood the market with more shares, diluting the value of the
 available shares.

 Supply Chain Risk
 [S1] Limited Sourcing (Moderate Probability, Moderate Impact)
Figure 32: Stock price & News Events The uncertainty inherent in the procurement and transportation is high for an e-commerce based company. For
 Ali Health particularly, with only 5 main pharmaceutical suppliers, they are of significant bargaining power
(Figure below) (Appendix 9). The lack of back-up sourcing companies may easily result in inventory shortages or delaying
Source: Yahoo Finance delivery if one of the main suppliers disrupted. To reduce the risk of being out of stock, Alihealth could find
 more suppliers to secure their inventory and satisfy customer’s demand.
 Stock Price & Event
Appendices

Appendix 1: Financial Statements

Consolidated Income Statement Consolidated Income Statement (Common-size)
(Thousand RMB)
 2014 2015 2016
 2014 2015 2016
 REVENUE 100.0% 100.0% 100.0%
 REVENUE 21,990 29,744 56,595
 Cost of revenue -50.7% -46.3% -32.9%
 Cost of revenue (11,138) (13,780) (18,602)
 Gross profit Gross profit 49.3% 53.7% 67.1%
 10,851 15,964 37,993

 Other income 3,664 87,238 14,702 Other income 16.7% 293.3% 26.0%
 Sales and marketing expenses (5,181) (4,014) (80,787) Sales and marketing expenses -23.6% -13.5% -142.7%
 Administrative expenses (28,254) (58,950) (91,797) Administrative expenses -128.5% -198.2% -162.2%
 Product development expenses (13,502) (34,130) (76,153) Product development expenses -61.4% -114.7% -134.6%
 Other expenses (706) (54,241) (26,143) Other expenses -3.2% -182.4% -46.2%
 Share of profits and losses of: Share of profits and losses of:
 A joint venture (1,453) 5,688 11,892 A joint venture -6.6% 19.1% 21.0%
 An associate 7,682 9,268 3,176 An associate 34.9% 31.2% 5.6%
 PROFIT (LOSS) BEFORE TAX (26,898) (83,178) (197,117) PROFIT (LOSS) BEFORE TAX -122.3% -279.6% -348.3%
 Income tax expense (768) (927) (1,851) Income tax expense -3.5% -3.1% -3.3%
 PROFIT (LOSS) FOR THE YEAR (27,666) (84,105) (198,968) PROFIT (LOSS) FOR THE YEAR -125.8% -282.8% -351.6%

Consolidated Balance Sheet Consolidated Balance Sheet
(Thousand RMB) (Common-size)
 2014 2015 2016 2014 2015 2016
NON-CURRENT ASSETS NON-CURRENT ASSETS
Property and equipment 8,075 4,180 6,546 Property and equipment 2.0% 0.3% 0.5%
Intangible assets 28,826 - - Intangible assets 7.3% 0.0% 0.0%
Investment in a joint venture 69,484 75,172 87,064 Investment in a joint venture 17.6% 5.3% 6.5%
Investment in an associate 86,358 95,626 108,802 Investment in an associate 21.8% 6.8% 8.1%
Long-term deposits - - 110,250 Long-term deposits 0.0% 0.0% 8.2%
Total non-current assets 192,743 174,978 312,662 Total non-current assets 48.8% 12.4% 23.2%
CURRENT ASSETS CURRENT ASSETS
Trade receivables 18,980 1,070 106 Trade receivables 4.8% 0.1% 0.0%
Prepayments, deposits and other receivables 6,518 14,994 14,824 Prepayments, deposits and other receivables 1.6% 1.1% 1.1%
Cash and cash equivalents 177,071 1,217,679 1,020,558 Cash and cash equivalents 44.8% 86.4% 75.7%
Total current assets 202,569 1,233,743 1,035,488 Total current assets 51.2% 87.6% 76.8%
Total assets 395,312 1,408,721 1,348,150 Total assets 100.0% 100.0% 100.0%

CURRENT LIABILITIES CURRENT LIABILITIES
Trade payables 2,194 3,653 3,751 Trade payables 0.6% 0.3% 0.3%
Other payables and accruals 45,837 60,374 55,358 Other payables and accruals 11.6% 4.3% 4.1%
Deferred revenue 17,167 19,908 86,873 Deferred revenue 4.3% 1.4% 6.4%
Advance from customers 28,569 38,174 39,878 Advance from customers 7.2% 2.7% 3.0%
Tax payable 15 15 - Tax payable 0.0% 0.0% 0.0%
Total current liabilities 93,782 122,124 185,860 Total current liabilities 23.7% 8.7% 13.8%
NON-CURRENT LIABILITIES NON-CURRENT LIABILITIES
Deferred tax liability 4,247 5,174 7,019 Deferred tax liability 1.1% 0.4% 0.5%
Deferred revenue 15,657 14,532 - Deferred revenue 4.0% 1.0% 0.0%
Total non-current liabilities 19,904 19,706 7,019 Total non-current liabilities 5.0% 1.4% 0.5%
Total liabilities 113,686 141,830 192,879 Total liabilities 28.8% 10.1% 14.3%
Total asset minus total liabilities 281,626 1,266,891 1,155,271 Total asset minus total liabilities 71.2% 89.9% 85.7%

EQUITY EQUITY
Equity attributable to owners of the parent Equity attributable to owners of the parent
Share capital 36,916 72,305 72,305 Share capital 9.3% 5.1% 5.4%
Reserves 300,555 1,253,315 1,149,055 Reserves 76.0% 89.0% 85.2%
Total equity attributable to owners 337,471 1,325,620 1,221,360 Total equity attributable to owners 85.4% 94.1% 90.6%
Non-controlling interests (55,845) (58,729) (66,089) Non-controlling interests -14.1% -4.2% -4.9%
Total equity 281,626 1,266,891 1,155,271 Total equity 71.2% 89.9% 85.7%

Managerial Balance Sheet Managerial Balance Sheet (Common-size)
 2014 2015 2016
 2014 2015 2016
Cash 177,071 1,217,679 1,020,558 Cash 58.72% 94.64% 87.81%
Working capital requirement (68,284) (106,060) (170,930) Working capital requirement -22.65% -8.24% -14.71%
Fixed asset 192,743 174,978 312,662 Fixed asset 63.92% 13.60% 26.90%
Total asset 301,530 1,286,597 1,162,290 Total asset 100.00% 100.00% 100.00%
Short term debt 0 0 0 Short term debt 0.00% 0.00% 0.00%
Long term debt 0 0 0 Long term debt 0.00% 0.00% 0.00%
Equity 301,530 1,286,597 1,162,290 Equity 100.00% 100.00% 100.00%
Total liability and equity 301,530 1,286,597 1,162,290 Total liability and equity 100.00% 100.00% 100.00%
Appendix 2 Valuation of Each Division

Drug PIATS: excluded from the forecast
Operating the Drug PIATS faces regulatory risk and drug producers’ resistance. In 2016, CFDA tightened the regulation in this business area, which greatly
affected Alihealth’s revenue derived from PIATS. Later, Alihealth decided to change its focus from PIATS to other Internet-medicine related business. Thus, we
will not count Drug PIATS as a profitable stream for its future operation in our valuation.

For the rest of Alihealth’s business, future values are estimated individually through multiplying sales with industry Price/Sales ratio. To estimate sales in each
of its business segment, (1) future market size will be predicted first, (2) followed by multiplying Alihealth’s potential market share in 5 years.

Pharmaceutical e-commerce
Alihealth’s pharmaceutical e-commerce business value is computed using the formula below, which can be directly obtained by multiplying the pharmaceutical
E-commerce market size, Alihalth’s market share and the industry P/S ratio together.

 Alihealth Pharmaceutical Ecommerce Business Value
 = ×Ali′ s Market Share×P/S Ratio

 = × ×Ali′ s Market Share×P/S Ratio

 = × × × ×Ali′ s Market Share×P/S Ratio

 * TRSCG: Total retail sales of consumer goods in China
 MCS/TRSCG: Percentage of medicine commodity sales to total sales of consumer goods
 TMROI/MCS: Percentage of medicine retailers’ operating income to medicine commodity sales

For the pharmaceutical E-commerce market size, though offset by obstacles from government regulation and other uncertainties, recent years still witnessed
an rosy trend of medical selling gradually going online. Thus, based on the current E-pharmacy’s 1% proportion in the whole medical retail industry, we
estimate it will reach to 4% in 2021.

As for the future market size of the whole medical retail industry, we have to refer to the future retail sales of consumer goods in China (TRSCG), percentage of
medicine commodity sales (MCS/TRSCG), as well as percentage of medicine retailers’ operating income (TMROI/MCS). Basically, market size of the medicine retail
industry is equivalent to the medical retailer’s operating income, and TRSCG, MCS/TRSCG, TMROI/MCS are components with available consecutive data from
2010 to 2015. We give each component a linear or exponential equation, which fit the historical trend and can be employed to forecast its future value in 2021.
For Alihealth market share, we use the occupation rate of Alibaba’s Tmall’s occupation rate as a benchmark.
Both being subsidiaries of Alibaba, Alihealth is of high probability to follow Tmall’s expansion mode. The
assumption, 45% market share in online medical selling is therefore reasonable - just slightly worse than
Tmall’s performance (58.1%) during the past decade (Figure 22).

The average P/S ratio in the medicine retail industry is used as an approximation of Alihealth’s P/S ratio in
pharmaceutical e-commerce business. For the other business categories, the same method is used in terms
of calculating correspondent P/S ratio.

Medical service network

 Alihealth Medical Service Network Business Value
 = ×Ali′ s Market Share×P/S ratio
 = ( + )×Ali′ s Market Share×P/S ratio
 *MMS: Mobile-based medical service market size
 PCMS: PC-based medical service market size

Online medical service can be categorized into either mobile-based medical service or PC-
based service. Both have trends close to linear regression lines. The summation of them can be
lent to predict the future online medical service market size. For Alihealth’s market share, an
estimated 10% market share is given for year 2021. Our reason is that Alihealth has not yet
completely constructed its medical service network function, and the fierce competition
Chunyu Doctor and Baidu Doctor makes it difficult occupy the market.

 Estimated total Internet medical service market (Billion)
 45

 40

 35

 30
 y = 2.01x + 1.31
 25
 R² = 0.94488
 20

 15
 y = 1.8046x - 2.4493
 10 R² = 0.77123
 5

 0
 2011 2012 2013 2014 2015 2016 2017 2018 2019 2020 2021

 Estimated total Internet medical service market (Billion)
 MMS Billion
 PCMS Billion
 Total Internet medical service market size (Billion)
Online health insurance intermediary

 Alihealthp s Online Health Insurance Business Value

 = × Ali′ sMarket Share × P/S Ratio

 = × + % ×Ali′ sMarket Share×P/S Ratio

 ×
 = × + % ×Ali′ s Market Share×P/S Ratio

 *OHIP: market size of online healthcare insurance payment
 THIP: China’s total health insurance payment
 OIP: online insurance payment
 TIP: total insurance payment

In order to get Alihealth’s online insurance business value, the whole industry The Average Charing Fee (Operating income/Trading volume)
market size would be estimated first. Usually, online health insurance 4%

intermediaries charge commission fee for basic services and add a premium on 3%

value-added services. For the basic commission rate (Figure), Taobao and TMALL, 3%

the two largest platforms in China’s e-commerce industry, are used as 2% The average charging fee is 2.60%

representatives since the two business modes have similarity, both acting as 2%

intermediaries for participants to make transactions. For the premium service fee,
 1%

 1%

it is assumed that they will charge at 5% on average. 0%

 The Average Charging Fee Of Alibaba Group
 (Operating Income /Trading Volume)

 Alibaba's mouthly Taobao monthly online Tmall monthly online Mobile mothly online Percentage of mobile Alibaba's China total e- Average charging fee
 Operating income
 online trading volume trading trading volime trading online volume commerce operating (Operating income
 /Trading volume
 (0.1*Billion) volume(0.1*billion) (0.1*Billion) volume(0.1*Billion) (0.1*Billion) income (0.1*Billion) /Trading volume)
 2011-06 1,310.00 1,140.00 170.00 18.34 1.40 30 2.29%
 2011-09 1,410.00 1,190.00 220.00 23.97 1.70 33 2.34%
 2011-12 2,130.00 1,720.00 410.00 53.25 2.50 54 2.54%
 2012-03 1,780.00 1,450.00 330.00 67.64 3.80 40 2.25%
 2012-06 2,090.00 1,670.00 420.00 95.83 4.60 56 2.68%
 2012-09 2,280.00 1,790.00 490.00 127.03 5.60 62 2.72%
 2012-12 3,460.00 2,550.00 910.00 256.61 7.40 102 2.95%
 2013-03 2,941.84 2,230.00 710.00 315.07 10.70 72 2.45%
 2013-06 3,451.34 2,570.00 880.00 412.99 12.00 92 2.67%
 2013-09 3,736.59 2,750.00 990.00 548.23 14.70 N/A 0.00%
 2013-12 5,287.09 3,460.00 1,830.00 1,043.91 19.70 N/A 0.00% 2.60%
 2014-03 4,300.85 2,950.00 1,350.00 1,180.01 27.40 N/A 0.00%
 2014-06 5,009.16 3,420.00 1,590.00 1,644.28 32.80 133 2.66%
 2014-09 5,556.66 3,800.00 1,760.00 1,990.54 35.80 136 2.45%
 2014-12 7,870.47 4,940.00 2,930.00 3,268.89 42.00 221 2.81%
 2015-03 6,000.92 3,810.00 2,190.00 3,037.72 51.00 139 2.32%
 2015-06 6,731.98 4,270.00 2,460.00 3,705.78 55.00 167 2.48%
 2015-09 7,129.33 4,380.00 2,750.00 4,401.13 62.00 183 2.57%
 2015-12 9,643.17 5,630.00 4,010.00 6,511.39 68.00 299 3.10%
 2016-03 7,420.00 4,490.00 2,930.00 5,410.00 73.00 194 2.61%
 2016-06 8,370.00 5,080.00 3,290.00 6,260.00 75.00 246 2.94%

The future value of THIP, OIP, and TIP is estimated by adding a trend line based on the historical data, similar as the case for E-pharmacy and medical service
business (Figures).

 Estimation of Total and Online Insurance Payment
 China's total health insurance payment (Million)
 Online insurance Percentage of
 Total insurance Online insurance 300000
 Year payment online insurance
 payment growth rate
 (0.1*Billion) payment

 2011 14339.25 32 0.002231637 250000
 y = 18360x - 8244
 2012 15487.93 90 1.8125 0.005810977 R² = 0.76497
 200000
 2013 17222.24 291 2.233333333 0.016896757

 2014 20234.81 859 1.951890034 0.042451596
 150000
 2015 24282.50 2234 1.600698487 0.092000412

 2016 23295.57 3600 0.611459266 0.154535819
 100000

 2017 24944.17 4732 0.314444444 0.189703646

 2018 26592.77 6000 0.267962806 0.225625236 50000

 2019 28241.37 7500 0.25 0.265567853

 2020 29889.97 7750.7 0.033426667 0.259307721 0
 2006 2007 2008 2009 2010 2011 2012 2013 2014 2015 2016 2017 2018 2019 2020 2021
 2021 31538.57 8737.78 0.127353658 0.277050608
(continued)

 Total insurance payment
 Online inssurance payment (0.1*Billion)
 (health insurance included, 0.1 Billion)
 35000 10000
 y = 1648.6x + 215.17 9000 y = 987.08x - 2120.1
 30000 R² = 0.96084 8000 R² = 0.94155
 25000 7000
 6000
 20000
 5000
 15000 4000
 3000
 10000
 2000
 5000 1000
 0
 0
 2011 2012 2013 2014 2015 2016 2017 2018 2019 2020 2021
 2003 2004 2005 2006 2007 2008 2009 2010 2011 2012 2013 2014 2015 2016 2017 2018 2019 2020 2021

Faced with the status quo that big insurance companies have their own website to sell their insurance
products, and customers tend to be more loyal to an insurance company and product so may bot tend
to switch their choices to other e-commerce platforms, it is pessimistically assumed that Alihealth will
occupy 4% of the total market share in the business.

Appendix 3 Forecast: Revenue Growth in the Next 5 Years

 Forecast Revenue from Pharmaceutical E-commerce

 2017F 2018F 2019F 2020F 2021F
 Estimated medicine retailers' main operation income (Million RMB) 1,730,480 1,964,190 2,214,200 2,480,990 2,765,030
 Percentage of online retailer to the scale of medicine retailer 1.32% 1.74% 2.30% 3.06% 4.00%
 Estimated online medicine retailer revenue (Million RMB) 22,842 34,177 50,927 75,918 110,601
 Market share Alihealth accounts 2.14% 4.58% 9.80% 20.97% 45.00%
 Estimated Alihealth's revenue (Million RMB) 489 1,565 4,991 15,920 49,771

 Forecast Revenue from Medical Service Network

 2017F 2018F 2019F 2020F 2021F
 Estimated medical service network‘s main operation income
 25,560 29,380 33,190 37,010 40,820
 (Million RMB)
 Market share Alihealth accounts 1.58% 2.50% 3.94% 6.23% 10%
 Estimated Alihealth's revenue (Million RMB) 404 735 1,308 2,306 4,082

 Forecast Revenue from Online Health Insurance Intermediary

 2017F 2018F 2019F 2020F 2021F
 Estimated Chinese total health insurance revenue (Million RMB) 212,076 230,436 248,796 267,156 285,516
 Estimated online insurance ratio 19.00% 22.60% 26.60% 25.90% 27.70%
 Estimated online health insurance revenue (Million RMB) 40,294 52,079 66,180 69,193 79,088
 Market share Alihealth accounts 1.32% 1.74% 2.30% 3.04% 4%
 Estimated Alihealth's revenue (Million RMB) 532 906 1,522 2,103 3,164
You can also read