Market and Trade Profile: Japan - Japan - Visit Britain Travel Trade
←
→
Page content transcription
If your browser does not render page correctly, please read the page content below
Market and Trade Profile Japan

Market and
Trade Profile: Japan

Japan

Market and Trade Profile Japan

Overview

•   Chapter 1: Inbound market statistics provides insights on key statistics about
    Japanese travellers and who they are. It takes a look at Britain and its
    competitive set as well as activities of Japanese visitors in the UK.

•   Chapter 2: Understanding the market takes a close look at Japanese
    consumer trends, booking, planning and further travel behaviour of this source
    market. Perceptions of Britain held by the Japanese are also highlighted.

•   Chapter 3: Access and travel trade shows how the Japanese travel to the UK,
    how to best cater for their needs and wants during their stay and gives insights
    into the Japanese travel trade. Further ways of working with VisitBritain and
    other useful research resources are pointed out.

                                                                                                  2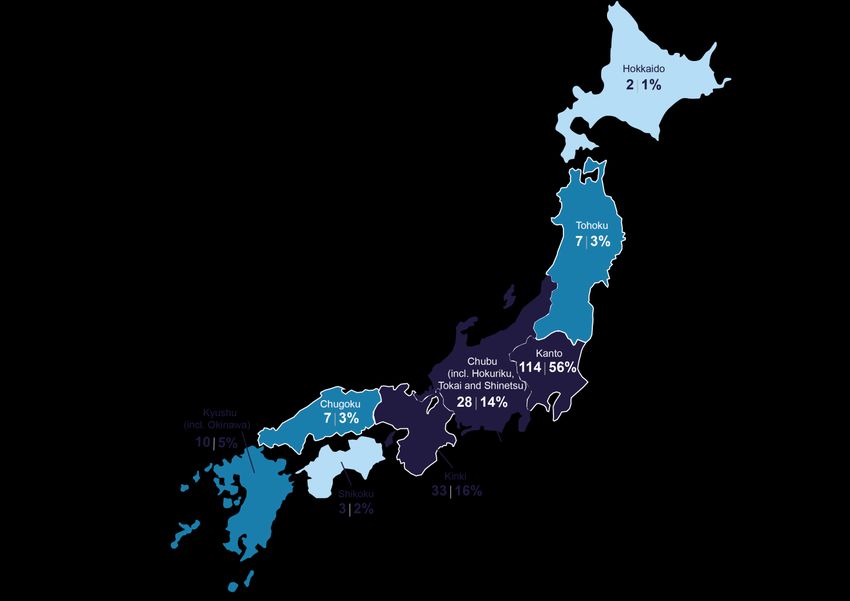
Market and Trade Profile Japan

Contents
Chapter 1:
Market statistics
   1.1 Key statistics               6
   1.2 Visitor demographics        17
   1.3 Britain & competitors       21
   1.4 Inbound activities          23

Chapter 2:
Understanding the Market
   2.1 Structural drivers          31
   2.2 Consumer trends             35
   2.3 Booking and planning        38
   2.4 Reaching the consumer       41
   2.5 Perceptions of Britain      46

Chapter 3:
Access and Travel Trade
   3.1 Access                      54
   3.2 Travel trade                57
   3.3 Caring for the consumer     63
   3.4 Working with VisitBritain   68
   3.5 Useful resources            69

                                                                         3
Market and Trade Profile Japan

Chapter 1:
Inbound market
statistics

                                                  4
Market and Trade Profile Japan

Chapter 1: Inbound market statistics

Chapter summary
• In 2016, Japan jumped up 4 places in the international tourism
  expenditure ranking, from 20th in 2015 to 16th with outbound
                                                                                 +4
  spending of US$18.5 billion.                                          places in the
• The Japanese outbound market is forecast to continue to               international
  grow, and should reach over 30 million staying visits abroad              tourism
  by 2025, after struggling between 2013 and 2015. The UK,
  their 5th most popular destination in Europe in 2016, should           expenditure
  benefit from this positive trend and see visits from Japan grow     ranking in 2016
  17% between 2016 and 2025.                                                vs 2015
• Japan was the UK’s 26th largest source market in terms of
  visits and 24th most valuable for visitor spending in 2016.
  Average spend per visit from Japan was 46% higher than the
  global average for all inbound visits to the UK in 2016.
• 1-in-3 Japanese visitors came to the UK in the summer months in 2016, but the
  shoulder seasons are popular too with 1-in-4 visits happening in the last quarter
  and a similar proportion in the second.
• Virtually all departing holiday visitors from Japan would recommend a holiday or
  short break in the UK, and 47% would be ‘extremely’ likely to do so (compared to
  45% of all inbound holiday visitors).
Source: UNWTO, Oxford Economics, International Passenger Survey by ONS, CAA

                                                                                                               5
Market and Trade Profile Japan
Chapter 1.1: Key statistics
Key insights
• In the last five years the Japanese outbound market has
been struggling. Outbound visit volumes declined 9%
between 2012 and 2015, before recovering in 2016 and
2017 (+1% and +7% year-on-year respectively).
+27%
• Visits from Japan to the UK have followed this trend, with visits from Japan
visits declining from 2012 to 2015 before an increase in to the UK in 2016,
2016. Forecasts suggest moderate growth in future. compared to 2015
• Most visits from Japan to the UK are made for holidays or
business (46% and 31% of all 2016 visits from Japan
respectively). On average, business visitors from Japan stay
longer and spend more in the UK than holidaymakers.
• London is by far the leading destination for a trip to Britain
(74% of visits from Japan to Britain included an overnight
stay there in 2014-2016), but Japanese visitors spent almost
as much time in the rest of England as in London (47% and
49% of the nights spent by Japanese visitors in the UK on
average in 2014-2016 respectively).
• The most popular activities undertaken by Japanese visitors
in Britain include going shopping, dining in restaurants,
visiting museums or art galleries, sightseeing famous
monuments/ buildings and visiting castles or historic houses.
Source: International Passenger Survey by ONS, Oxford Economics
6Market and Trade Profile Japan
1.1 Key statistics: global context and 10 year trend
Global context Inbound travel to Britain overview
Measure 2016 Measure Visits Nights Spend
(000s) (000s) (£m)
10 year trend
International tourism
18.5 2007 308 2,691 226
expenditure (US$bn)
2008 239 2,175 165
2009 235 2,592 305
Global rank for international
16 2010 223 1,905 182
tourism expenditure
2011 237 1,949 191
Number of outbound 2012 243 2,806 306
21.7
overnight visits (m) 2013 225 2,237 213
2014 222 1,696 226
Most visited destination 2015 194 2,060 214
USA
overall
2016 246 2,288 215
Most visited destination in Share of UK total
Germany 0.7% 0.8% 1.0%
Europe in 2016
Source: International Passenger Survey by ONS, UNWTO, Oxford Economics
7Market and Trade Profile Japan
1.1 Key statistics – volume and value
Inbound volume and value Nights per visit, spend
Measure 2016 Change Rank out of Averages by Nights Spend Spend
vs. 2015 UK top journey purpose per per per
markets in 2016 visit night visit
Visits (000s) 246 +27% 26 Holiday 5 £128 £686
Nights (000s) 2,288 +11% 30 Business 6 £177 £1,121
Visiting Friends/
Spend (£m) 215 +1% 24 13 £42 £550
Relatives*
All visits 9 £94 £876
Source: International Passenger Survey by ONS; * low sample size
8Market and Trade Profile Japan
1.1 Key statistics: journey purpose
Journey purpose 2016 Journey purpose trend (visits 000s)
50% 46% 200
180
Share of visits
40% 37%
160
31% 31% 140
30% 24% 120 113
100
20% 16% 80 76
60
6% 40 40
10% 3% 3%
1% 20 8
0% 0 8
Holiday Business VFR Study Misc.
Japan All markets Holiday Business VFR Study Misc.
• Most visits from Japan to the UK are made for leisure:
46% were made for holidays and 16% to visit friends or • In 2016 there were about twice as many leisure visits than
relatives. However, business is the second-most business visits from Japan to the UK: 153,000 visits for
common reason for which the Japanese visit the UK, holiday and VFR, compared to 76,000 business visits.
comprising 31% of all Japanese visits. • However, in terms of inbound spending, 39% came from
• Japanese visitors are almost half as likely to be visiting Japanese business visits in 2016, followed by holiday
friends and relatives in the UK than the all-market visitors (36%), while VFR only comprised 10% of inbound
average (16% of all visits from Japan compared to 31% spending in the UK for the Japanese market.
of all visits to the UK in 2016). Fewer visits were made • Japanese visits to friends and relatives tend to be longer
for study (3%), or miscellaneous purposes (3%). than business and holiday visits. Japanese business visitors
• 49% of staying holiday visits made by Japanese are staying a night longer than holidaymakers on average,
residents to the UK (excl. UK nationals) are made by and spending a third more per night in the UK in 2016.
repeat visitors, below the all-market average (63%). • Study and holiday visits together represented over half of
the nights spent by visitors from Japan in the UK in 2016
Source: International Passenger Survey by ONS; repeat / first time visitors question asked in 2015 (28% and 26% respectively).
9Market and Trade Profile Japan
1.1 Key statistics: seasonality
Seasonality 2016
35% 33%
30% 27%
28% • Japanese visitors tend to go to the UK in the summer
Share of visits
25% 25%
25% 23%
months: in 2016, a third of visits from Japan to the
20%
20% 20% UK were made between July and September, which
15% slightly over index on the global average.
10% • 1-in-4 visits were in October-December, closely
5% followed by April-June (23% of visits), and January-
0% March (1-in-5).
Jan-Mar Apr-Jun Jul-Sep Oct-Dec
• The shoulder periods in October-December and
Japan All markets April-June have gained in popularity in recent years
among Japanese visitors to the UK.
Seasonality trend (visits 000s)
140
120
100
81
80
61
60 56
40 48
20
0
2003 2004 2005 2006 2007 2008 2009 2010 2011 2012 2013 2014 2015 2016
Jan - Mar Apr - Jun Jul - Sep Oct - Dec
Source: International Passenger Survey by ONS
10Market and Trade Profile Japan
1.1 Key statistics: length of stay and accommodation
Accommodation stayed in, 2014-2016 Duration of stay trend
(nights, %share) (visits 000s, 3-year rolling average)
140
2% 1%
120
5% 100
88
80
6% 72
60
40 35
8%
20 24
41% 0 2
13%
Nil nights 1-3 nights 4-7 nights
8-14 nights 15+ nights
• Most Japanese visitors stay in the UK for a week or less,
24% with slightly more visits lasting 4-7 nights than short stays
of 1-3 nights. Proportion of those types of stays versus
Hotel/guest house Free guest with relatives or friends longer ones have remained fairly similar in the last few
years.
Hostel/university/school Bed & Breakfast • On average in 2014-2016, Japanese visitors spent about
Paying guest family or friends house Rented house/flat 2-in-5 nights in the UK at hotels or guest houses, with
nearly 1-in-4 spent as a free guest with relatives or
Other Own home friends. During that period, Japanese visitors were also
Source: International Passenger Survey by ONS
more likely to spend nights in a hostel/university/school
than the all-market average (13% and 7% respectively).
11Market and Trade Profile Japan
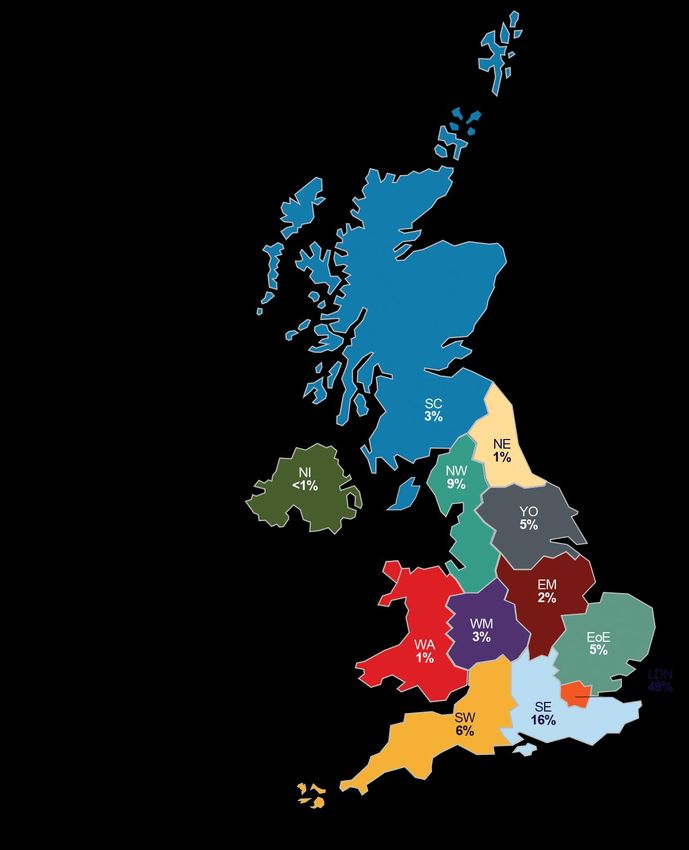
1.1 Key statistics: regional spread
Nights
Visits to the UK (2014-2016 yearly average) (% share, 2014-2016)
Region Nights stayed Visits
(000) (000)
Total 2,015 221
Scotland (SC) 56 13
Wales (WA) 24 3
Northern Ireland (NI) WMMarket and Trade Profile Japan
1.1 Key statistics: regional spread and top towns and cities
Top towns and cities visited (2012-2016) • London is the leading destination for a trip to Britain.
49% of the nights spent in the UK by visitors from
Japan were in London, compared to 40% of all inbound
Town Average yearly overnight visits (000s)
visitors‘ nights in 2014-2016.
London 164 • A similar proportion of the nights spent in the UK by
Edinburgh 10 Japanese visitors was spent in the rest of England,
47% on average in 2014-2016. Japanese visitors were
Oxford 8 less likely to stay in the other nations than on average
across all markets.
Manchester 7
• 6% of all visits from Japan were bought as a package
Cambridge 4 or an all-inclusive tour in 2016*, similar to the global
average.
Regional spread (2014-2016) • Japanese visitors are overall less likely than the
60%
average to go to the British countryside or villages, or
49% 48% to the coast or beaches.
Share of nights
50% 47%
40%
40%
• Visitors from Japan are more likely than the all-market
30%
average visitors to use transport within a city or a town.
They are more likely to use public transport than taxis.
20%
10% 3%
8% • They are also less likely to use the train to travel
1% 3% 1%
0%Market and Trade Profile Japan
1.1 Key statistics: visits to coast, countryside and villages
Propensity to visit coast, countryside and villages
10%
VFR: Went to the coast or beaches
13%
22%
VFR: Went to countryside or villages
17%
0%
Business: Went to the coast or beaches
2%
4%
Business: Went to countryside or villages
2%
3%
Holiday: Went to the coast or beaches
14%
11%
Holiday: Went to countryside or villages
18%
4%
All journey purposes: Went to the coast or beaches
10%
11%
All journey purposes: Went to countryside or villages
13%
0% 5% 10% 15% 20% 25%
Japan All markets
Source: International Passenger Survey by ONS 2016, note: VFR for Japan are based on a low sample size
14Market and Trade Profile Japan
1.1 Key statistics: use of internal modes of transport
Propensity to use internal modes of transport
1%
Ferry/boat
2%
Car/vehicle you/group brought 1%
to the UK 15%
6%
Hired self-drive car/vehicle
8%
Private coach/minibus (for 6%
group only) 4%
Public bus/coach (outside 9%
town/city) 8%
42%
Taxi
32%
26%
Train (outside town/city)
28%
Bus, Tube, Tram or Metro Train 67%
(within town/city) 53%
3%
Domestic flight
2%
0% 10% 20% 30% 40% 50% 60% 70% 80%
Japan All markets
Source: International Passenger Survey by ONS, 2013
15Market and Trade Profile Japan
1.1 Key statistics: purchase of transport and package tours
Transport services purchased before or Proportion of visits that are bought as part
during trip (%) of a package or all-inclusive tour*
60% 16%
53%
52% 14% 14%
50%
12%
40%
36%
35% 10% 9%
31% 29%
30% 27% 27%
8%
26% 27%
26% 25%
24% 24%
23% 6% 6%
20%
6%
20% 18% 18%
15% 3%
4%
10%
5% 2% 1% 1%
1%
0% 0%
Pre During Pre During Pre During Pre During Pre During Business Holiday VFR All journey
Transport Train travel Airport Coach travel Car hire purposes
within transfer
London
Japan All markets
Japan All markets
International Passenger Survey by ONS, 2016. VisitBritain/IPSOS 2016, base: visitors; *To be defined as a package, a holiday must be sold at an inclusive price covering both fares to and from the UK and the
cost of at least some accommodation. Neither the respondent nor the travel agent from whom the package was bought will know how much of the inclusive price is accounted for by fares or by accommodation.
16Market and Trade Profile Japan
1.2 Visitor demographics
Visitor characteristics
• More visits from Japan to the UK were made by men
than women (58% vs 42% respectively, on average
between 2014 and 2016). 86%
• 63% of Japanese visitors are 35+ years old (2014- of visits from Japan to the
UK originated in the most
16). The number of Japanese visitors under 35 has central part of Japan, from
declined significantly over the last 10 years. the regions at the centre of
• This is in line with the rapidly ageing Japanese Honshu
population: about 28% of the Japanese population
were 65 years old or older as estimated in 2017, with
an additional 12% aged 55-64 years old. However,
few Japanese aged 65+ visit Britain.
• 91% of departing Japanese visitors felt either ‘very’
or ‘extremely’ welcome in Britain, which is slightly
above the all-market average (88%). 87% of them
were also ‘very’ or ‘extremely’ likely to recommend
Britain for a holiday or short-break.
Source: International Passenger Survey by ONS, CIA World Factbook 2017, CAA 2016
17Market and Trade Profile Japan
1.2 Visitor demographics: gender and age groups
Visitor demographics (2014-2016): Age group trend
gender ratio of visits from Japan: (average visits in 000s on rolling 3 years ending in)
42% women, 58% men 120
Women (% share of visits by journey
purpose) 100
80% 72%
56% 52% 52% 56% 57%
60% 45% 80
40% 30%
Visits (000s)
20%
13%
20%
60 60
0%
Business Holiday VFR Study Misc. 50
49
Japan All markets 40
Men (share of visits by journey purpose) 27
100% 86% 20 19
80%
80% 67% 9
55% 5
60% 44% 48% 48% 44% 42% 0 1
40% 28%
2004 2005 2006 2007 2008 2009 2010 2011 2012 2013 2014 2015 2016
20%
0%
Business Holiday VFR Study Misc. 0 -15 16-24 25-34 35-44
Japan All markets 45-54 55-64 65+ Not Known
Source: International Passenger Survey by ONS
18Market and Trade Profile Japan
1.2 Visitor demographics: origin
Visits to the UK in 2007
• Most visits from Japan to the UK are made by
visitors from the central part of Japan.
• More than 1-in-2 visits from Japan to the UK
originate from Kanto, which includes the Greater
Tokyo area, followed by those from Kinki (16%), and
Chubu (14%).
• A third of the Japanese population actually lives in
or around Tokyo, on the Kanto central plain. 94% of
the population lives in urban areas, with the regions
of high density being along the coasts.
Visits in 000s | % share of visits
High
Medium
Low
Source: International Passenger Survey by ONS, CIA World Factbook 2017
19Market and Trade Profile Japan
1.2 Visitor demographics: welcome and recommending Britain
Feeling of ‘welcome’ in Britain Likelihood to recommend Britain
70% 65% 50% 47%
45% 45%
45%
60% 40%
40%
49%
50% 35%
39% 30%
40%
25%
30% 25% 20%
20% 15% 13%
12% 10% 9%
9%
10%
5%
0% 0% 0% 0% 0% 1% 0% 0%
0% 0%
Extremely Very Quite Not very Not at all Extremely Very likely Quite likely Not very Not at all
welcome welcome welcome welcome welcome likely likely likely
Japan All markets Japan All markets
Source: CAA 2016, base for Japan = 66 respondents
20Market and Trade Profile Japan
1.3 Britain and competitors
Market size, share and growth potential
• Britain was the 5th most visited destination in Europe by
Japanese travellers for overnight trips in 2016, behind
Germany, Spain, France and Italy.
• The Japanese outbound market has been struggling in
recent years, although a more positive trend has been
observed since 2016. Japanese outbound visits are Britain
forecast to continue increasing in the coming years:
forecasts suggest outbound visits will reach over 30 ranks 5th
million in 2025, up 41% on 2016. most visited destination in
Europe from Japan
• While visits to Britain are also expected to grow,
forecasts show that they would grow at a slower rate
than the overall outbound visits from Japan between
2016 and 2025 (+17%).
• Britain has maintained its market share in the five years
to 2016, while the US, Spain and Italy gained.
• Looking forward, the UK‘s market share is forecast to
decline very slightly; meanwhile, the US is forecast to
lose share with France and Germany gaining.
Source: Oxford Economics
21Market and Trade Profile Japan
1.3 Britain and competitors
Britain’s market share of Japanese Historic and potential visits to Britain (000s)
outbound visits among competitor set
600
52%
United States 57%
54%
10% 500
Germany 9%
11%
7%
Spain 7% 400
6%
7%
Australia 7%
6% 300
284
10%
France 7%
10%
6% 200
Italy 6%
5%
4%
United Kingdom 4% 100
4%
3%
Switzerland 3%
0
5%
0% 20% 40% 60%
2025 2016 2011
Source: Oxford Economics, based on overnight visit
22Market and Trade Profile Japan
1.4 Inbound activities
Inbound Britain activities
• For Japanese visitors, going shopping is
the most popular activity when they visit
the UK, followed by dining in restaurants,
and visiting museums and art galleries.
Sightseeing famous monuments/ buildings
and visiting castles or historic houses also
often feature in Japanese visits to the UK.
• Overall, they are more likely than the all-
market average to watch live art
performances, such as a ballet, an opera
or a musical. However, they are less likely
than the average to participate in nature-
related activities, such as cycling, visiting
parks or gardens, or walking in the
countryside or along the coast.
• They have a higher propensity than
average to buy British food and drinks
products, or books and stationery during
their visit to Britain.
Source: International Passenger Survey by ONS, rankings based on 2006-2016 data
23Market and Trade Profile Japan
1.4 Inbound activities
Propensity to visit museums and Propensity to visit built heritage sites
galleries
10%
52% VFR: visited religious buildings 18%
VFR
23% 34%
VFR: visited castles/historic houses 23%
34%
49% Holiday: visited religious buildings 35%
Holiday
48% Holiday: visited castles/historic houses 42%
48%
9% 4%
Business: visited religious buildings 4%
Business
6% 12%
Business: visited castle/historic houses 6%
38% All journey purposes: visited religious 20%
All journey buildings 20%
purposes 28% All journey purposes: visited 30%
castles/historic houses 28%
0% 20% 40% 60%
0% 20% 40% 60%
Japan All markets Japan All markets
Source: International Passenger Survey by ONS 2016
24Market and Trade Profile Japan
1.4 Inbound activities
Propensity to attend the performing arts Number who went to watch live sports
during trip from Japan to the UK (000s)
All journey purposes: Went to the 11%
theatre/musical/opera/ballet 0.8
9%
Cricket 0.7
14%
VFR: Went to the theatre/musical/opera/ballet 0.0
8%
Business: Went to the 4%
theatre/musical/opera/ballet 1.2
2%
Football 0.7
Holiday: Went to the 11%
theatre/musical/opera/ballet 0.2
14%
0% 10% 20% 0 1 1 2
Japan All markets Holiday VFR Misc.
Source: International Passenger Survey by ONS 2011 and 2016
25Market and Trade Profile Japan
1.4 Inbound activities
Propensity to go for a walk or cycle Propensity to visit a park or garden
Holiday: Walking along the coast 3%
11% VFR: Visiting 51%
Holiday: Cycling 0% parks or
2%
19% gardens 32%
Holiday: Walking in the countryside 26%
Business: Walking along the coast 1%
1% Holiday: 32%
Business: Cycling 0% Visiting parks
0%
or gardens 50%
Business: Walking in the countryside 3%
5%
VFR: Walking along the coast 11%
11% Business: 8%
VFR: Cycling 4% Visiting parks
2%
or gardens 7%
VFR: Walking in the countryside 41%
28%
All journey purposes: Walking along the coast 4% All journey
8% 28%
purposes:
All journey purposes: Cycling 1%
1% Visiting parks
32%
18% or gardens
All journey purposes: Walking in the… 20%
0% 20% 40% 60% 0% 20% 40% 60%
Japan All markets Japan All markets
Source: International Passenger Survey by ONS 2007, 2010 and 2016
26Market and Trade Profile Japan
1.4 Inbound activities
Propensity to go to restaurants, go to Propensity to purchase selected items
pubs, and socialise with locals
VFR: went to bars or night clubs 12%
14% None of these 34%
VFR: dining in restaurants 77% 38%
62% 23%
VFR: socialising with the locals 47% Other holiday souvenir (not mentioned above)
50% 16%
45% 4%
VFR: went to pub 53% Items for your home e.g. furnishing 3%
Holiday: went to bars or night clubs 3% 2%
14% Electrical or electronic items e.g. camera 3%
Holiday: dining in restaurants 60%
70% 6%
CDs, DVDs, computer games etc 5%
Holiday: socialising with the locals 15%
36%
Food or drink 32%
Holiday: went to pub 26%
50% 24%
Business: went to bars or night clubs 5% Games, toys or gifts for children 6%
7% 9%
Business: dining in restaurants 52% 18%
49% Books or stationery 13%
Business: socialising with the locals 9%
15% 11%
Cosmetics or toiletries e.g. perfume 12%
Business: went to pub 31%
31%
Bags, purses etc 14%
All journey purposes: went to bars or night clubs 5% 9%
12%
All journey purposes: dining in restaurants 59% Personal accessories e.g. jewellery 8%
61% 10%
All journey purposes: socialising with the locals 19% 36%
34% Clothes or Shoes 41%
All journey purposes: went to pub 29%
45%
0% 20% 40% 60%
0% 10% 20% 30% 40% 50% 60% 70% 80% 90%
Japan All markets
Japan All markets
Source: International Passenger Survey by ONS 2007, 2008, 2011 and 2013
27Market and Trade Profile Japan
1.4 Inbound activities
Propensity for visit to include an English
language course
80%
70% 67%
61%
60%
50%
40%
30%
20%
11%
7% 9%
10% 6%
3% 2% 4%
3%
0%
Holiday Business VFR Study Misc
visitors visitors visitors visitors visitors
Japan All Markets
Source: International Passenger Survey by ONS 2013
28Market and Trade Profile Japan
Chapter 2:
Understanding
the market
29Market and Trade Profile Japan
2.Understanding the market
Chapter summary
• Japan had the world’s 4th largest economy by GDP in PPP terms
in 2017, after China, the USA, and India. Among 50 nations,
• Japan has one of the lowest birth and fertility rates in the world; Britain is the
as a consequence, its population is expected to decrease slightly 5th strongest
in the years to come. nation brand
• The Japanese population is ageing. Forecasts from the United for the Japanese
Nations suggest that 30% of the Japanese will be aged 65 years people
or over in 2030, compared to 12% in Asia in total.
• Most Japanese book their trip to Britain online. When travel and
accommodation are booked together as a package, Japanese
visitors are more likely than the all-market average to make a
booking face-to-face (32% vs 26% in 2016).
• Japanese visitors have longer lead-in times compared to most other
inbound markets when arranging their trip to Britain.
• Japanese travellers are more likely than the average international
visitor to be influenced by travel guidebooks when choosing their
destination (44% vs 25%).
• The majority of Japanese holiday visitors chose Britain as a
destination because of its cultural attractions.
Source: CIA World Factbook, VisitBritain/IPSOS 2016, United Nations World Population Prospects 2017 (medium variant)
30Market and Trade Profile Japan
2.1 Structural drivers
Demographics & society
• Japan is a parliamentary constitutional monarchy, composed of 4 main
islands – Hokkaido, Honshu, Shikoku, and Kyushu – and over 6,800
smaller islands and islets. The country is divided into 47 prefectures.
• The Japanese mainly reside near the coast, with about a third of them
94%
of the Japanese
concentrated in and around the capital, Tokyo, on the central Kanto plain population lives in
on Honshu. Over half of the Japanese population live in the major urban urban areas
areas: Tokyo (38.0m), Osaka-Kobe (20.2m), Nagoya (9.4m), Kitakyushu-
Fukuoka (5.5m), Shizuoka-Hamamatsu (3.4m), and Sapporo (2.6m).
• Japan has an ageing population, and is one of the oldest populations in
the world (life expectancy is over 85 years old) and one of the lowest
birth and fertility rates in world (respectively 7.7%, ranking 223rd globally,
and 1.41 children born per woman, ranking 209th globally, according to
2017 estimates). As a consequence the Japanese population is expected
to fall in the coming years, though the population of seniors will rise.
• Full-time workers are entitled to between 10 and 20 days of paid annual
leave a year, depending on seniority. In addition to those, there are 16
national public holidays. Since 2000 the Happy Monday system has
moved some national holidays to Monday to obtain a long weekend.
Source: Oxford Economics, CIA World Factbook 2017, japan-payroll.com, officeholidays.com
31Market and Trade Profile Japan
2.1 Structural drivers: population and economic indicators
Population dynamics Economic indicators (% growth unless stated)
Measure 2017 Indicator 2017 2018 2019 2020
estimate
Total population (m) 127.4 Real GDP 1.8% 1.7% 0.9% 0%
Median age 47 years old Real consumer spending 1.2% 1.0% 1.0% -0.4%
Disposable income 1.8% 1.5% 1.5% 1.6%
Population growth rate (2017-2022) -0.3%
Consumer prices 0.5% 0.7% 1.2% 1.8%
Source: Oxford Economics, CIA World Factbook 2017
32Market and Trade Profile Japan
2.1 Structural drivers: general market overview
General market conditions
• The Japanese population is ageing and as a • Despite weak growth since the early 1990s,
consequence it is expected to fall by 0.3% over Japan was the world’s 4th largest economy by
the next 5 years. The Japanese median age GDP in PPP terms* in 2017, after China, the
was 33 in 1980, and is expected to be 52 by USA, and India.
2030. Japan is the second oldest country when • Since 2013, its economy has been recovering
ranking the world’s nations by their median age. and is forecast to grow in 2018, partly due to
• Japanese workers get between 10 and 20 days monetary easing led by the Bank of Japan,
of annual leave depending on seniority. with lower risk levels then the APAC average.
• However, some risks still exist. Increased
Key demographic and economic data protectionism abroad could impact exports.
The second step of the consumption tax hike,
Measure (2017 data) Japan which has been delayed twice and is now due
in October 2019, is a downside risk.
Population (m) 127.4
• Consumer spending growth has remained
GDP per capita PPP (US$) 38,055 sluggish because of weak wage growth.
Annual average GDP growth
0.5 • In recent years, Japan has also been less of a
over past decade (%) growth engine for the HNWI** population than
Annual average GDP growth it had been. Despite this, Japan ranks as the
1.8
in 2017 (%) 2nd largest source market of HNWIs in 2016,
with about 2.9 million (up 6% on 2015).
Source: International Passenger Survey by ONS, Oxford Economics, CIA World Factbook 2017,
UN‘s World Population Prospects – 2015 Revision, japan-payroll.com, Capgemini World Wealth Report 2017
*Purchasing Power Parity, adjust the GDP value for price differences; **HNWIs: stands for High Net Worth Individuals, people whose liquid assets are worth US$1m or over
33Market and Trade Profile Japan
2.1 Structural drivers: exchange rate trends
Exchange rate trends (cost of GBP in JPY)
300.0
250.0
200.0
150.0
100.0
50.0
0.0
2001 2002 2003 2004 2005 2006 2007 2008 2009 2010 2011 2012 2013 2014 2015 2016 2017 2018
Please find the most up-to-date exchange rate trend based on monthly averages at visitbritain.org/visitor-economy-facts.
Source: Bank of England
34Market and Trade Profile Japan
2.2 Consumer trends
• In 2016, 17.1 million Japanese travelled overseas. This
is behind the record of 18.5 million recorded in 2012 and
slightly behind the 17.8 million Japanese travelling
overseas in 2000.
• In 2016, over 30 million valid Japanese passports were
in circulation which equals about one quarter of the
30%
Japanese population. This number was down compared
of Japanese will be
to 2015, but the number of passports issued was up aged 65 years or over
15% in 2016 compared to the previous year. The ratio of in 2030
passports that were issued in 2016 was relatively high
among Japanese aged 30 years or younger.
• FIT (free independent travels) outnumbered package
tours for the purpose of tourism in 2016, accounting for
51% of the Japanese overseas tourism trips.
• Security and safety plays an important role in the
decision of a holiday destination for Japanese travellers.
• Japanese consider Hawaii as their most desirable
destination. Europe gained some interest in 2017;
France, Italy and also Scandinavia tend to top the list of
preferred European destinations.
Source: United Nations World Population Prospects 2017 (medium variant), Ministry of Foreign Affairs, JTB Tourism Research & Consulting
35Market and Trade Profile Japan
2.2 Consumer trends: overall trends
Wellbeing and health
• There is a boom in people pursuing healthy and happy lifestyles not only physically but also mentally. Consumption
of organic foods and an emphasis on fitness through activities such as yoga demonstrate this.
• Wellbeing is recognised as an important part of longevity and consumers realise that their long work hours impact on
health. Health products and supplements are some of the most heavily advertised products in Japan. Beauty centres,
spa and travelling for spa treatments feature prominently in Japan.
Ageing population
• With one of the lowest fertility rates in the world and highest longevity, Japan society is ageing, making the older
segments especially important; however, at present these only account for a small proportion of visitors to the UK.
• The Japanese retirees constitute a key target segment for entertainment and travel industries as they have both
money and time, making them a target for the travel trade too. Lately though solutions like virtual reality has allowed
them to see the world’s wonders without travelling.
Security and safety concerns
• The March 2011 earthquake and tsunami caused crucial damage and impact on overseas travel just after the
disaster. During this period, the outbound travel slowed down. However, the initial impact was still lesser than
previous crises such as September 11, SARS, and Swine Flu.
• Even recently, security remains a big concern: the attacks in Europe have certainly not played in favour of outbound
travel to this continent. France lost its title of most visited European destinations from Japan in 2016 (but it has been
gaining back market share in the last months). The trade also reported some slowdown in demand for the UK in the
summer 2017, although there were few cancellations.
36Market and Trade Profile Japan
2.2 Consumer trends: travel trends
Rise of the FIT segment and change in travel trends
• With just over half of the overseas tourism trips taken independently (51%), the ‘Free and Independent Travel’
segment, or FIT, is changing the overseas travel landscape in Japan. More flexibility on travel itinerary, smaller travel
groups and other travel-related offers are now required by many in the market.
• The importance of social media and, as a consequence, of the image overseas travellers are presenting of themselves
on the likes of Instagram accounts for some of the changes. Inspiration for a trip is increasingly taken from blogs and
other social media influencers. Images and experiences that can be shared on Instagram can also influence the way
an itinerary is built by the Japanese independent travellers.
• They will still want safety guarantees; and historic sites, cultural attractions and food will still be important parts of their
trip. But many also increasingly prefer to eat where locals eat vs. restaurants that could accommodate groups or
mainly cater for tourists, or to discover new destinations rather than going back to the same place.
Different travel needs for different demographic groups
• While nature and scenery are important components of a trips for all, women will also be more likely to favour relaxing
activities and shopping. Women travelling alone still represent a valuable segment of the Japanese outbound market,
and sometimes travel for shopping as their main purpose.
• Traditionally, graduating students used to take a “graduation trip” (or sotsugyo ryoko) between February and March
and this was a highly coveted segment for the travel industry in Japan. With some young people staying at home, with
no work, graduating trips are important for that age segment.
• As the Japanese population is ageing, older people’s travel needs are becoming quite important. This older group still
tends to travel in full-package tours. Around 3-in-4 older men and women would prefer a full-package option to go
abroad when choosing a travel package type, as it can help address language or security barriers.
Source: JTB Tourism Research & Consulting
37Market and Trade Profile Japan
2.3 Booking and planning
• Japanese visitors have slightly longer lead-in times compared
to most other inbound markets, especially for looking at options
and prices and booking their trip to Britain.
• Close to 4-in-10 Japanese visitors booked their trip to Britain 3
to 6 months in advance, and a similar proportion did so only 1 Over half
to 2 months in advance. of Japanese holiday
• Japanese holiday visitors to Britain are a bit less likely to have visitors booked their
booked their transport and accommodation separately than the travel to Britain and
average visitor (45% vs 48% respectively). accommodation there
• Whether they booked those elements separately or together, together as a package
most Japanese holiday visitors booked their trip online, mostly
on their laptop or desktop. However, the number of Japanese
people booking travel products on smartphones has
increased in recent years.
• While almost a third of Japanese holiday visitors to the UK
prefer booking a transport and accommodation package face-
to-face, booking holiday packages through the phone is also
more common. In general, though, a traditional tour
operator/travel agency with an online presence is the main
popular booking portal for Japanese outbound holidaymakers.
• Japanese visitors would also be more likely to book activities
before their trip to Britain rather than during.
Source: VisitBritain/IPSOS 2016, JTB Tourism Research & Consulting
38Market and Trade Profile Japan
2.3 Booking and planning: booking channels and ticket sales
How trips to Britain were booked Propensity to make a purchase before or
during trip
100% 2% 1% 0%
45% 41%
6% 11% 10%
90% 40%
7% 3%
80% 7% Don’t know 35% 30%
29%30% 30%
28%
32% 30% 29%28%
70% 24%
Did not book – stayed with 25%
23% 22%
60% friends / relatives 18% 19% 20% 19%
20%
50% By phone
15% 11%
40% 84% 8% 9%
78% Face to face 10% 9%
30% 58% 3%
5%
20% Online
0%
Pre During Pre During Pre During Pre During Pre During
10%
Theatre / Sporting event Guided Guided Tickets / passes
0% Musical / tickets sightseeing sightseeing for other tourist
Travel Accommodation Holiday Concert tickets tours in London tours outside of attractions
(travel and London
accommodation) Japan All markets
• Japanese visitors are quite digital-savvy, with most of • Apart from a guided sightseeing tour before their
them booking transport to the UK and accommodation trip, they are less likely to purchase activities than
online, when those elements were bought separately. the all-market average.
• However, when booking them as a holiday package, they • Overall, Japanese visitors tend to purchase their
are more likely than the average visitor to book face-to- holiday activities ahead of their trip.
face (32% vs 26% for the all-market average). • However, 75% of the Japanese respondents who
• Most Japanese booked their UK holidays through a travel visited Britain said they like to be spontaneous on
agent, tour operator or travel comparison website. holiday and decided on some of their itinerary at
the last minute.
Source: VisitBritain/IPSOS 2016, base: visitors (online survey)
39Market and Trade Profile Japan
2.3 Booking and planning: lead-times
Decision lead-time for visiting • Japanese visitors had slightly longer lead-times than the
global average when preparing their visit to the UK.
Britain • Fewer Japanese visitors would start thinking about their
60%
trip or deciding on visiting the UK in the 2 months leading
to their departure than the all-market average (13% vs
50% 48%
18% and 21% vs 27% respectively).
45%
44% • Only a few Japanese visitors would have started looking at
40% 36% 37% 37% their options and prices to visit Britain within the month
31%
prior to their trip, 3% compared to 12% across all markets.
30%
30% • Only about 1-in-10 visitors booked their trip to the UK in
the same timeframe, while 22% did so on average across
19% 19%
20% all markets.
11% 11% 12%
• Between 3 and 6 months of their trip is a critical time in the
10%
3% 4% 5% 3% 3% planning of a trip for Japanese people: 45% of them
1% 1% decided on visiting the UK in that timeframe, while 44%
0%
6+ months 3-6 months 1-2 months Less than 1 Don't know were starting to look at options and prices and 37%
before trip before before month before booked the main elements of their trip. A further 37% of
% starting to think about trip at each stage Japanese visitors book between 1 and 2 months of their
% deciding on the destination at each stage UK trip.
% looking at options/prices at each stage • Only slightly more Japanese visitors book their travel to
% booking the trip at each stage
the UK and accommodation together than booked them
separately (52% vs 45% respectively).
Source: VisitBritain/IPSOS 2016, base: visitors
40Market and Trade Profile Japan
2.4 Reaching the consumer
• Mobile technology is highly developed in Japan.
• The Japanese are avid consumers of blogs.
• A majority of internet users (69%) are active social
network users with LINE having the highest number of Biggest influences in
users. choosing a destination for
Japanese holidaymakers:
• ‘Wallet phones’ allow the Japanese to make purchases
through a built-in smartcard in the device, in some travel
respects equivalent to a bank debit card in Britain. guidebooks,
• For some Japanese, ‘planning’ is one of their favourite travel agent or
parts of a trip away from home. tour operator
• Travel guidebooks and tour operator brochures or website
websites have more of a role as sources of information in
Japan than is the case in the typical market.
• Almost as many holiday visits to Britain are booked
through a travel agent as directly with the carrier but the
majority are booked on the Internet rather than face-to-
face.
Source: ICT Research & Consulting
41Market and Trade Profile Japan 2.4 Reaching the consumer: broadcast media landscape TV • On average, Japanese people spent over 2 hours weekly watching TV, listening to the radio or reading newspapers and magazines in 2016. • In terms of advertising, TV expenditure accounted for almost a third of the total ad market in 2016. • There are 5 major private network/digital terrestrial television stations including one national station - NHK (equivalent of BBC). Other main national TV players are TV Asahi, Fuji TV, Nippon TV (NTV), and Tokyo Broadcasting System (TBS). • The broadcasting format in Japan changed from analogue to digital terrestrial in July 2011 and the number of digital channels has grown. Satellite and cable pay TV are quite popular in Japan. • The proportion watching movies (other than at a movie theatre) jumped from about 40% to 52% of the Japanese population between 2011 and 2016, the highest participation rate in ‘hobbies and amusements’ in 2016. Travel is a popular topic for television shows; there are various weekly shows about travel on the five major stations. These range from a daily visual documentary taken from the window of a train to 1h episodes about world heritage sites. Radio • The radio landscape is quite limited in this market with only a few stations listened to by only 7% of the population. The FM radio stations tend to have programming targeted at youth with music, and commercial programming and the AM radio stations target the older demographic, with mostly news, sports, traditional music, horse racing and foreign language learning. • NHK public service operates different radio channels, including a news channel, a classic-music based one, a cultural/educational one, as well as the external service Radio Japan. • Main radio stations are Tokyo-based, such as Inter FM, J-Wave, Tokyo FM and TBS Radio. Source: BBC Japan media profile, Santander Trade Portal‘s ‘Japan: Reaching the consumer‘ profile, Statistics Japan on Leisure Activities and Time Use
Market and Trade Profile Japan

2.4 Reaching the consumer: print media landscape
Newspapers
• Print media are still quite influential in Japan, thanks to a good reputation and wide audience.
  National newspapers sell in millions of copies, and some also have afternoon and evening editions.
• However, as Japan has a very advanced digital landscape, most newspapers also have an online
  version. Access to online newspapers can sometimes be paid-for as there has been a decrease in
  advertising revenues in this print sector.
• Main titles include: Asahi Shimbun (daily, with pages in English), Yomiuri Shimbun (daily, with pages
  in English), Nihon Keizai Shimbun, The Japan Times (in English), Mainichi Shimbun/ Mainichi Daily
  News (daily, with pages in English), Nikkei Asian Review (in English), Sankei Shimbun (daily) and
  Nikkan Sports.
• Kyodo and Japan Today are two prominent news agency in the Japanese market. They are also
  present on internet and accessible in English. Bilingual communications and advertising (in English
  and Japanese) are quite common in this market, but promotional material should include some
  elements in Japanese at least.
Magazines
• The effects of the economic downturn have been felt in the media sector since late 2008 and a
  number of well-known magazines have stopped publication. Newspapers also are increasingly finding
  it difficult to generate ad revenue. However, internet revenue continues to grow.
• Digitalisation is also important in Japan: online newspapers and magazines are getting more interest.
  Many magazines have branched out onto the Internet and usually feature content that is not found on
  their print version.

Source: BBC Japan media profile, Santander Trade Portal‘s ‘Japan: Reaching the consumer‘ profile
Market and Trade Profile Japan

2.4 Reaching the consumer: connected media landscape
Internet
• According to InternetWorldStats, Japan counted about 118 million internet users in 2017, about 94%
  of the country's population. Key reasons for using the Internet are for sending and receiving emails,
  consulting news and other media content; also for browsing websites and blogs, and online shopping.
  Japan is the world's second biggest market for spending on online advertising, with Japanese online
  advertising representing more than print advertising in 2016.
• Mobile technology, including wallet phones and other barcodes and quick scan apps and solutions
  have long been adopted by the Japanese market.
Social Media
• Social media are quite popular in Japan. Almost seven in ten internet users are active social network
  users and this share is expected to grow to 77% by the end of 2019. The main reasons for using
  social network sites are to keep in contact with people or to know what friends are doing.
• A new trend is LINE, an instant messaging application for smartphones and PCs, which has become
  hugely popular with 40 million users in Japan and 100 million users worldwide since its launch in
  June 2011. LINE is a good media for targeting people in their 20s and 30s. The rapid growth of LINE
  is an example of the importance of local players in the Japanese social media landscape. Its app for
  smartphone is also very popular.
• Other popular Social Network Services (SNS) site include Facebook at 17 million (28%), Twitter at 13
  million (21%) and Mixi at 5 million (8.1%).
• Instagram is very popular for sharing photos, and is largely used by the younger audience when on
  holidays.

Source: BBC Japan media profile (quoting InternetWorldStats), Santander Trade Portal‘s ‘Japan: Reaching the consumer‘ profile, Statistics Japan on Time Use, Macromill, ICT Research & Consulting, Netrating

                                                                                                                                                                                                      44
Market and Trade Profile Japan
2.4 Reaching the consumer: influences
Influences on destination choice
Talking to friends / relatives / colleagues 26%
40%
Information from search engines [e.g. Google] 29%
33%
Looking at prices of holidays/flights on price comparison websites 25%
31%
Websites providing traveller reviews of destinations [e.g. TripAdvisor] 29%
30%
Talking to friends or family in your social network (e.g. via Facebook / Twitter) 13%
26%
An accommodation provider/ hotel website 34%
26%
A travel guidebook 44%
25%
Travel agent or tour operator website 37%
25%
Travel blogs / forums 22%
22%
Travel programme on TV 27%
19%
A special offer or price deal you saw advertised online 13%
19%
Travel agent or tour operator brochure 25%
18%
An official tourist organisation website or social media site for the country or destination 22%
18%
An official tourist brochure for the country / city / region 21%
17%
A travel feature / article in a magazine or newspaper 18%
16%
Direct advice from a travel agent/tour operator (face-to-face, over the phone) 18%
16%
Images or videos your friends or family have posted to social media 11%
15%
Images / information in online adverts 11%
15%
A special offer or price deal you saw advertised offline e.g. in a newspaper, magazine or on TV 14%
15%
Images or videos from a photo/video sharing social network site 10%
14%
Travel app 12%
14%
Images / information in adverts in a magazine or newspaper 15%
12%
Articles on an online encyclopaedia e.g. Wikipedia, Wikitravel 10%
12%
Images / information in TV adverts 12%
11%
Seeing social media posts from celebrities talking about their holiday destinations 6%
9%
Images / information on billboards / poster adverts 6%
9%
Travel programme on radio 5%
6%
Information in radio adverts 4%
6%
0% 5% 10% 15% 20% 25% 30% 35% 40% 45% 50%
Japan All markets
Source: VisitBritain/IPSOS 2016, base visitors & considerers. Which of the following sources influenced your choice of destination? (Market scores have been adjusted so that the sum of all influences
for each market is equivalent to the global total, to enable meaningful comparisons)
45Market and Trade Profile Japan
2.5 Perceptions of Britain
• When asked the most important reasons for choosing Britain as a
holiday destination, cultural attractions are the main reason why
Biggest draws to the UK
the Japanese chose the UK by far (over half chose this as a key for Japanese holiday
motivation). The fact that English is spoken, as well as the visitors:
possibility to discover a new destination when visiting the UK, also British cultural
appealed to many holidaymakers. attractions,
• Japanese travellers tend to look for a holiday destination that will somewhere
provide fun and laughter, where they can enjoy the beauty of the
landscape, chill and slow down to a different pace of life. However,
English is
they would usually consider the USA as the best to deliver on their spoken
top holiday ‘wants’, and Australia as the best to deliver on the latter
two. Britain rates highly for visiting a place with a lot of history and
historic sites, seeing world-famous sites and places, broadening
their mind, stimulating their thinking, and feeling special or spoilt.
• France is also often better perceived for those attributes than the
UK.
• Overall, the Japanese rank the UK 4th for its culture, among 50
nations, just the global ranking (5th).
Source: Arkenford 2013, VisitBritain/IPSOS 2016, Anholt-GfK Nation Brands Index 2017
46Market and Trade Profile Japan
2.5 Perceptions of Britain
Britain’s ranking (out of 50 nations)
Measure Japanese All
respondents respondents
Overall Nation Brand 5 3
Culture (overall) 4 5
The country has a rich cultural heritage 6 7
The country is an interesting and exciting place for contemporary culture such as
4 3
music, films, art and literature
The country excels at sports 6 4
People (overall) 6 6
If I visited the country, the people would make me feel welcome 20 13
Tourism (overall) 5 3
Would like to visit the country if money was no object 8 6
The country is rich in natural beauty 27 24
The country is rich in historic buildings and monuments 6 5
The country has a vibrant city life and urban attractions 4 4
Source: Anholt-GfK Nation Brands Index 2017
47Market and Trade Profile Japan
2.5 Perceptions of Britain
Cultural associations Adjectives describing a potential trip to
Britain
46% 19%
Museums Educational
45% 33%
Music 36% 30%
Fascinating
39% 32%
Films 24% 10%
37% Exciting
30%
Sports 22% 17%
36% Romantic
17%
Modern Design 16% 10%
29% Relaxing
16%
Pop videos 17% 3%
29% Spiritual
8%
Sculpture 13% 3%
23% Stressful
8%
Opera 16% 4%
23% Risky
7%
Street Carnival 5% 2%
14% Boring
7%
Circus 6% 3%
13% Depressing
5%
0% 10% 20% 30% 40% 50% 0% 10% 20% 30% 40%
Japan All respondents Japan All respondents
Source: Anholt-GfK Nation Brands Index 2017
48Market and Trade Profile Japan
2.5 Perceptions of Britain
Holiday wants and % saying destination is best place for…
Importance GB FR IT AU US GE
6.12 Have fun and laughter 12% 17% 10% 24% 28% 10%
5.88 Enjoy the beauty of the landscape 33% 41% 34% 48% 25% 34%
5.80 Chill/ slow down to a different pace of life 16% 17% 15% 34% 19% 15%
5.70 See world famous sites and places 39% 55% 33% 20% 26% 33%
5.67 Enjoy high quality food and drink (gourmet food) 4% 56% 14% 7% 7% 14%
5.55 Broaden my mind/ Stimulate my thinking 36% 40% 26% 29% 38% 26%
5.55 Visit a place with a lot of history/historic sites 47% 55% 35% 10% 8% 35%
5.55 Enjoy local specialities (food and drink) 12% 43% 23% 19% 10% 23%
5.41 Offers good value for money 5% 5% 5% 13% 14% 5%
5.38 Good shopping 19% 35% 11% 14% 23% 11%
5.38 Do something the children would really enjoy 8% 8% 17% 47% 33% 17%
5.27 Explore the place 30% 31% 22% 27% 28% 22%
5.27 Be physically healthier 6% 8% 12% 33% 15% 12%
5.26 Feel special or spoilt 35% 43% 24% 24% 23% 24%
5.25 Feel connected to nature 13% 11% 17% 66% 27% 17%
5.17 Soak up the atmosphere 26% 26% 20% 26% 28% 20%
5.17 The people are friendly and welcoming 10% 11% 13% 31% 24% 13%
5.16 Easy to get around by public transport 24% 20% 18% 9% 22% 18%
5.12 Experience things that are new to me 11% 12% 11% 28% 37% 11%
5.05 It offers unique holiday experiences 15% 18% 15% 40% 27% 15%
4.98 Enjoy peace & quiet 17% 18% 17% 32% 11% 17%
4.97 A good place to visit at any time of year 12% 17% 13% 29% 20% 13%
4.94 Revisit places of nostalgic importance to me 22% 20% 15% 12% 19% 15%
4.87 Provides a wide range of holiday experiences 13% 16% 12% 44% 33% 12%
4.85 Experience activities/places with a wow factor 21% 29% 16% 33% 40% 16%
4.78 Do what I want when I want spontaneously 33% 1% 1% 6% 31% 1%
4.69 Get off the beaten track 15% 14% 6% 16% 14% 6%
4.64 Visit places important to my family's history 22% 25% 19% 16% 22% 19%
4.59 Have dedicated time with my other half 23% 29% 24% 32% 25% 24%
4.57 Do something environmentally sustainable/ green 9% 17% 5% 27% 4% 5%
4.43 Get some sun 10% 17% 9% 49% 23% 9%
4.41 Meet and have fun with other tourists 20% 12% 14% 26% 36% 14%
4.37 Meet the locals 32% 10% 32% 16% 62% 32%
4.30 Fashionable destination 24% 57% 9% 6% 23% 9%
4.23 Go somewhere that provided lots of laid on entertainment/nightlife 15% 22% 21% 17% 49% 21%
4.18 To participate in an active pastime or sport 9% 9% 6% 23% 34% 6%
4.14 Experience adrenalin filled adventures 19% 12% 19% 26% 55% 19%
3.95 Party 20% 33% 21% 21% 46% 21%
3.92 Watch a sporting event 27% 36% 25% 15% 44% 25%
3.77 Do something useful like volunteering to help on a project 16% 20% 9% 15% 19% 9%
Source: VisitBritain/Arkenford 2013
49Market and Trade Profile Japan
2.5 Perceptions of Britain
Motivations for choosing Britain as a holiday destination
52%
Cultural attractions 42%
27%
Wide variety of places to visit 25%
32%
Wanted to go somewhere new 23%
13%
Vibrant cities 22%
24%
Countryside/natural beauty 22%
19%
Easy to get around 22%
34%
Somewhere English-spoken 22%
18%
Visiting friends or relatives 22%
20%
Ease of getting to the country 21%
26%
A culture different from own 19%
12%
A mix of old and new 19%
19%
Contemporary culture 18%
15%
Try local food and drink 18%
12%
A good deal 18%
32%
Security / safety 17%
18%
Accommodation (variety & quality) 16%
10%
Easy to get plan/organise 16%
7%
Meeting locals 13%
11%
Wide range of holiday activities 13%
14%
The climate / weather 12%
10%
Cost of staying in the destination 12%
4%
Watching sport 10%
5%
Visit a film/TV location 9%
6%
Easy to visit with children 8%
0% 10% 20% 30% 40% 50% 60%
Japan All markets
Source: VisitBritain/IPSOS 2016, base: visitors (Market scores have been adjusted so that the sum of all influences for each market is equivalent to the global total, to enable meaningful comparisons)
50Market and Trade Profile Japan
2.5 Perceptions of Britain
Sought-after Britain activities
Visit Buckingham Palace 38%
18%
Enjoy traditional afternoon tea & cakes 24%
7%
Take a leisurely steam cruise in the Lake District 20%
6%
Visit Edinburgh castle 18%
4%
View London from Shard tower / London Eye 16%
4%
Take the mountain train up Snowdon 16%
5%
Visit 16th c. historic Chatsworth House & gardens 15%
4%
Go to a Premier League football match 14%
6%
Have fish & chips at the seaside 14%
5%
Shop on London's Oxford Street 13%
4%
Go on the Harry Potter studio tour 13%
5%
Dine by the fire in a cosy Welsh pub 13%
3%
Spot wildlife in Scottish Highlands 12%
4%
Go walking in Yorkshire's moors & hills 12%
4%
Tour around quaint Cotswold villages 11%
5%
Watch a musical in London's West End 10%
4%
Relax in Bath rooftop spa overlooking Roman baths 10%
3%
Enjoy a night out in Newcastle's bars 4%
1%
0% 10% 20% 30% 40%
% any % first
Source: Anholt-GfK Nation Brands Index 2013; If you went on a holiday/vacation to Britain which of the following activities would you most like to do? Please choose a first, second and
third choice
51Market and Trade Profile Japan
Chapter 3:
Access and travel
trade
52Market and Trade Profile Japan
3. Access and travel trade
• Most visitors from Japan came by plane to the UK (8-in-10 in
2016), but Eurostar services are also quite popular, which hints
at a combined trip in the UK and continental Europe.
• Direct, non-stop seat capacity has halved in the last ten years. + 2.5%
However, there was some good news in recent years, with an in seat capacity
upward trend in the numbers of seats available on direct flights between 2015 and
from Japan to the UK from 2015 to 2017. 2017 on direct, non-
• At the moment, all flights link Tokyo to London, and split quite stopping routes
equally between British Airways flights and local carriers, with between Japan and
both JAL (Japan Airlines) and ANA serving this route. the UK
• For long-haul travel most Japanese will still turn to agencies to
plan all or parts of their trips. The Japanese travel trade is
highly regulated, with high levels of customer protection. There
are two main periods in the year when brochures are written:
October-March and April-September.
• The market is maturing though: as customers are more
knowledgeable about destinations, travel companies have to
adapt and are now more specialised and customer-centric.
• Understanding the Japanese culture and building personal
relationships are key to succeed in working with the trade.
Source: Apex Rdc 2016, International Passenger Survey by ONS
53You can also read