The Global Domain Name Market in 2018 - Afnic Studies April 2019
←
→
Page content transcription
If your browser does not render page correctly, please read the page content below
The Global Domain
Name Market in 2018
            Afnic Studies
                  April 2019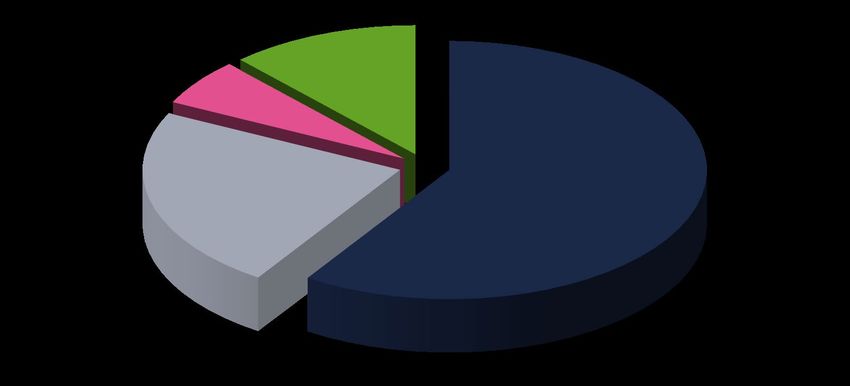
THE GLOBAL DOMAIN NAME MARKET IN 2018                                                                2/46

    Contents
1. Introduction ....................................................................... 4
2. Executive summary ............................................................ 6
3. Global trends ...................................................................... 8
    3.1.     An upswing ahead? .............................................................. 8
    3.2.     Contrasting performances.................................................... 9
    3.3.     nTLDs, from loss of momentum to fresh impetus? ........... 10
    3.4.     A market dominated by the .COM in 2018 ........................ 10

4. Legacy TLDs in 2018 ........................................................ 12
    4.1.     Contrasting situations ........................................................ 13
    4.2.     Improved retention rates ................................................... 13
    4.3.     Implications in terms of naming strategies ....................... 14

5. ccTLDs (country-code Top-Level Domains).................... 16
    5.1.     Dynamics very different from one region to another ......... 16
    5.2.     Influence of gTLDs-like and penny-ccTLDs .......................17

6. nTLDs ............................................................................... 19
    6.1.     Definition of new TLD "segments"..................................... 19
    6.2.     Performance of new TLD "segments" ................................ 20
    6.3.     Distribution of new TLDs in volumes of domain name
             registrations ....................................................................... 21
    6.4.     Change in retention rates per segment .............................. 24
    6.5.     Global change in the stock of new TLDs ............................ 25
    6.6.     The Utilization Rate, an indicator of the longevity of
             nTLDs ................................................................................. 26
    6.7.     "Leaders" still fragile .......................................................... 27

7. The distribution of domain names in the world at year-
   end 2018 ........................................................................... 29
    7.1.     Overview............................................................................. 29
    7.2.     Weight of segments in Africa ............................................. 30
    7.3.     Weight of segments in Latin America ................................ 30

                                                                                    www.afnic.fr | contact@afnic.fr
                                                                               Twitter: @Afnic | Facebook: afnic.fr
THE GLOBAL DOMAIN NAME MARKET IN 2018                                                           3/46

    7.4.   Weight of segments in Asia-Pacific .................................... 31
    7.5.   Weight of segments in Europe ........................................... 32
    7.6.   Weight of segments in North America ............................... 33
    7.7.   Summary tables.................................................................. 35
    7.8.   Lessons learnt .................................................................... 36

8. Highlights of 2018 and early 2019 ................................... 37
    8.1. A particularly active market for technical registry operators 37
    8.2. Growing cash requirements are increasingly driving the
           strategies of the main players in the market ...................... 38
    8.3. Diversification strategies and new products ......................... 41

9. Conclusions and outlooks ................................................ 44

                                                                               www.afnic.fr | contact@afnic.fr
                                                                          Twitter: @Afnic | Facebook: afnic.fr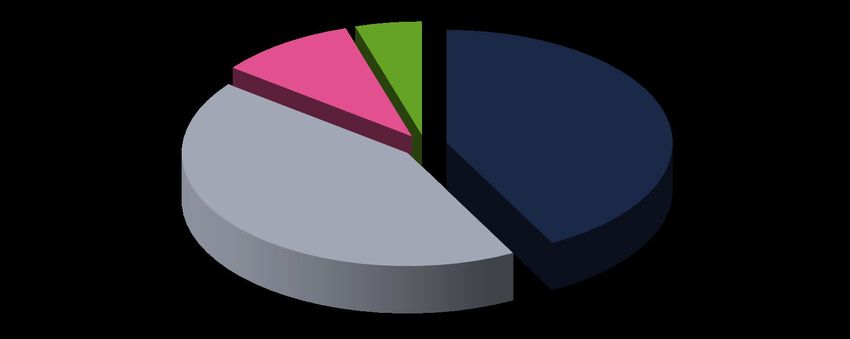
THE GLOBAL DOMAIN NAME MARKET IN 2018                                                   4/46

1. Introduction
   The publication of ICANN statistics as at 31/12/18 allows a quantified assessment of
   2018, a period of moderate upswing after the "set-down" of 2017.
   The data on which this study is based come from ICANN reports (Transactions -
   registries), from information provided by registries in certain frameworks such as the
   Council of European National Top-Level Domain Registries (CENTR) or the Asia
   Pacific Top-Level Domain Association (APTLD) or via their websites, and research
   conducted by Afnic. In some cases, we have also relied on specialized sites such as
   NTLDSTATS.COM.
   Our figures may vary slightly from those reported by other sources, in particular due to
   the lack of precise data for certain country code Top-Level Domains (ccTLDs).

   A supplement to the annual review of the market for domain names in France

   This study supplements our Annual review of the French domain name market
   published at the beginning of each year. It helps put into perspective the specific trends
   of the French market by comparing local data with global data.

   For the record:

     - the growth of the French market as a whole was 2.1% in 2018 compared with 3.2%
     in 2017 [for the .FR these same figures were 4.4% in 2018 against 5.2% in 2017];

     - the market shares of the various segments were, at the end of 2018, 37% for the
     .FR, 45% for the .COM, 12% for the "Other Legacy TLDs" and 2% for the "new
     TLDs".

   We refer the reader to this document for more information on the French market. It can
   be downloaded for free from the Afnic website:

     - in French: https://www.afnic.fr/medias/documents/etudes/Le_.FR_en_2018.pdf

     - in English: https://www.afnic.fr/medias/documents/etudes/The_.FR_in_2018.pdf

                                                                      www.afnic.fr | contact@afnic.fr
                                                                 Twitter: @Afnic | Facebook: afnic.fr
THE GLOBAL DOMAIN NAME MARKET IN 2018                                                 5/46

Definitions

APTLD: Asia Pacific Top-Level Domain Association.

CENTR: Council of European National Top-level Domain Registries.

ICANN: Internet Corporation for Assigned Names and Numbers.

TLD (Top-Level Domain): top-level domain. .FR and .ORG are top-level domains.

ccTLD (country-code Top-Level Domain): top-level domain corresponding to a territory or
country. The ccTLD for France is the .FR, but there are other French ccTLDs such as .RE
(Réunion Island), .PM (Saint-Pierre and Miquelon) etc.

gTLD (generic Top-Level Domain): generic TLD, not attached to a particular country or
territory. .COM, .NET, .ORG are gTLDs.

Legacy gTLD: generic TLD created before 2014. These are "legacy" TLDs such as .COM,
.NET, .ORG or more recent (2001-2004) such as .INFO, .BIZ, .MOBI, etc.

nTLD (new Top-Level Domain): generic TLD created after 2014. NTLDs are divided into
several sub-segments such as geoTLDs (regions, cities, etc.), Community TLDs (community-
based), .BRANDs (TLD suffix corresponding to major brands) or generic nTLDs (common
dictionary terms).

Penny TLD: TLD that is free or sold at a very low price.

                                                                 www.afnic.fr | contact@afnic.fr
                                                            Twitter: @Afnic | Facebook: afnic.fr
THE GLOBAL DOMAIN NAME MARKET IN 2018                                                                              6/46

2. Executive summary
        At the end of 2018, the global domain name market represented some 330 million
        domain names, including:

             •     176 million legacy TLDs (.COM, .NET, .ORG, etc.),

             •     27 million nTLDs created from 2014 onwards,

             •     and 126 million ccTLDs (so-called "geographic" domains). 1

  •       Overall market growth in 2018 was 4.0%, an improvement compared with the 1.2% in
          2017. An upswing is therefore observed in 2018 after the turbulent period of 2015-2017,
          but the pace of growth remains well below the levels recorded in the early years of the
          decade. 2019 should continue this trend of moderate growth.

  •       nTLDs resumed growth in 2018, with a 15% increase in stock. Their market share is still
          marginal (8%), compared with that of the .COM (43%) and ccTLDs (38%). The Other
          Legacy segment suffered the most with a loss of 6% in stock.

  •       The disposals therefore continued between the nTLDs and Other Legacy TLDs, but the
          sometimes low retention rates of the former show that there is also a tendency for holders
          not to renew defensively filed domain names deemed useless in a context where the
          proliferation of TLDs renders ineffective or overpriced any protection strategy based on
          mass filings.

  •       Regional ccTLD dynamics continued to be mixed, with constant catch-up in Africa (+9%)
          and Latin America (+6%), while North America (+1%) and Europe (-1%) seem destined
          for some stagnation. Asia-Pacific (+12%) recorded this good performance due to a sharp
          increase in .TW (Taiwan), which may result in a poor performance in 2019.

  •       Among the nTLD segments, the Communities suffered from the collapse of the ".pyc"
          ("Russian"), the Geographics are stable and the Generics increased by 13% in stock. The
          .CORPs are experiencing an explosion (+414%) because of three of them who may
          deserve to be reclassified as Generic. The number of .CORPs has been on a downward
          trend for two years, with a net balance of -9 TLDs in 2018 (-14 in 2017).

  •       Three-quarters of the new TLDs have fewer than 5,000 names in the portfolio, while only
          1% exceed 500,000. For many of them (except the .CORP), the low volumes are a serious
          handicap for the balance of their accounts and the financing of their development.

  •       The change in the utilization rate of nTLDs taken as a whole continues to be encouraging,
          having continuously improved since 2015. However the share of unused and renewed

  1
      32 million "penny" ccTLD have been withdrawn from this total, for reasons explained later in this study.

                                                                                                   www.afnic.fr | contact@afnic.fr
                                                                                              Twitter: @Afnic | Facebook: afnic.fr
THE GLOBAL DOMAIN NAME MARKET IN 2018                                                         7/46

      names is tending to decrease, which no doubt betrays a tendency among holders to
      manage their renewals more strictly.

•     The study of the distribution of domain names in the various ICANN regions shows that
      ccTLDs are leaders in every region except North America, dominated by the .COM.

•     These data highlight the difficulty for new entrants to impose themselves faced with
      "cultural prisms" in one case prioritizing the notions of region and proximity, and in the
      other case a global approach that overrides any reductive specific feature implied by the
      TLD chosen.

•     The strategies of the major players were structured in 2018 by phenomena such as the
      overall slowdown in growth relative to the levels of the first half of the decade; cash stress
      experienced by many nTLD players; the race for critical size to achieve economies of scale
      and synergies; the growing presence of financial groups that can support ambitious
      external growth strategies.

•     We have therefore seen a proliferation of buybacks, mergers, and changes in back-end
      registries, but it is difficult to say whether the profitability and sustainability objectives of
      the players concerned will be achieved in a context where create operations tend to
      decrease while the retention rates need to be monitored.

•     China still holds significant market opportunities, but in the medium term many players
      base their hopes on the next ICANN round, whose due date is still relatively distant. In the
      shorter term, the players are oscillating between the temptation to increase their tariffs (at
      the expense of volumes) or to boost their volumes (to the detriment of profitability).
      Entrepreneurial strategies tend to give way to purely financial approaches that bring
      certain players back to reality.

•     As we already noted in 2018, the fact remains that the registry - registrar system will no
      doubt have to change in the future, by increasingly favoring the emergence of specialized
      or "proximity" resellers, who will take care of marketing nTLDs to the relevant niche
      markets. The transformation is not an obvious one for every player and remains slow to
      enter the mores, registrars often considering themselves as wholesalers whose role is not
      to build and facilitate dealer networks optimized for this or that target. Current and future
      nTLDs cannot, however, be successful without the changing of the retail system.

•     At the registry level, the services related to "Data", the improvement of the DNS
      infrastructures, Cybersecurity, "Blockchains" and the Internet of Things remained the main
      areas for development and diversification, to which were added in 2018 the problems and
      solutions for managing digital identities.

                                                                            www.afnic.fr | contact@afnic.fr
                                                                       Twitter: @Afnic | Facebook: afnic.fr
THE GLOBAL DOMAIN NAME MARKET IN 2018 8/46
3. Global trends
The domain name market (excluding the penny TLDs) represented 330 million names
worldwide at year-end December 2018, up 4.0% from 2017 (317 million). After a noticeable
slowdown, the bottom of which seems to have been reached during the 1st quarter of 2018,
overall growth picked up again in 2018.
3.1. An upswing ahead?
The chart below shows the end of the "bell" phenomenon which reflects the sharp acceleration
in growth in 2015/2016 before a depression in 2017/2018 following the delete operations of
the names up for renewal.
The continuous improvement in the growth rate throughout 2018 makes it possible to hope for
a market upswing, stronger than the sudden accelerations linked to one-off campaigns for
mass filings.
Change in growth rates
2016-2018
.FR / 12 months Legacy gTLDs / 12 months ccTLDs / 12 months Global / 12 months
16,0%
14,0%
12,0%
10,0%
8,0%
6,0%
4,0%
2,0%
0,0%
04
05
06
08
09
10
11
12
02
03
04
05
06
08
09
10
11
12
02
03
04
05
06
08
09
10
11
12
07/16
01/17
07/17
01/18
07/18
The new TLDs are not included on this chart because the large variations in their amplitude
would overwrite the other curves. They represented +146% in 2016, -15% in 2017 and +15%
in 2018. The bottom of the cycle was reached in March 2018 (-20%) after which this segment
saw its situation improve and return to growth from August 2018 onwards.
www.afnic.fr | contact@afnic.fr
Twitter: @Afnic | Facebook: afnic.frTHE GLOBAL DOMAIN NAME MARKET IN 2018 9/46
3.2. Contrasting performances
Table 1 below shows the main indicators for each market segment between 2016 and 2018.
Stock
Variations (%) Market share (%)
(m ND)
2016 2017 2018 2016 2017 2018 2016 2017 2018
.COM 131 135 142 3.7% 2.8% 5.2% 42% 43% 43%
Other Legacy
37 36 34 2.8% -1.9% -6.0% 12% 12% 10%
TLDs *
nTLDs 28 24 27 146.2% -14.6% 15.4% 9% 8% 8%
Total gTLDs ** 197 195 204 12.8% -0.6% 4.3% 62% 62% 62%
ccTLDs *** 118 122 126 7.1% 2.9% 3.4% 38% 38% 38%
TOTAL 315 317 330 10.6% 0.8% 4.0% - - -
Penny ccTLDs **** 23 25 32 16.4% 17.1% 20.2% - - -
m ND: Year-end data expressed in millions of Domain Names.
* Other Legacy TLDs: generic TLDs created before 2012, such as .AERO, .ASIA, .BIZ, .NET, .ORG, .INFO, .MOBI, etc.
** Total gTLDs: measures all the domain names managed under a contract with ICANN. This includes the new TLDs, some
of which are not, strictly speaking, "generic".
*** ccTLDs or "country code Top-Level Domains", i.e. domains corresponding to territories, such as the .FR for France. The
data presented no longer include "Penny TLDs" ie ccTLDs retailed at very low prices, if not free of charge. These ccTLDs are
subject to very large upward and downward movements that do not reflect actual market developments and bias aggregate
data.
**** Penny ccTLDs: estimated volume of names filed in these "low cost" or free domains.
With 142 million names, .COM remains the heavyweight of this market. Its market share
increased by 0.5 points in 2018, rising from 42.6% to 43.1%, as a result of a growth rate that
increased sharply in 2018 (5.2% vs. 2.8% in 2017) .
The Other Legacy TLDs suffered particularly badly in 2018, losing 6% in stock after the 2% of
2017. These figures show that negative factors weigh on these TLDs, factors that we shall
explain later in our study.
New TLDs gained 15% in stock after losing 15% in 2017. These relatively large variations in
amplitude denote the impact of some aggressively marketed TLDs such as the "penny
ccTLDs", which we cannot yet remove from our statistics as these aggressive strategies may
only be punctual, linked to launch periods.
The country code Top-Level Domains (ccTLDs), which had a good year in 2016 and a
significant slowdown in 2017, resumed the path to moderate growth in 2018.
The market shares are relatively static overall, the main change to note being that of the Other
Legacy TLDs which lost 2 points in favor of the other segments.
If 2017 could be considered a set-down year after the euphoria of 2015/2016, 2018 was
undeniably a period of resumed growth, on bases that one can hope are more solid because
they are less related to domaining practices.
www.afnic.fr | contact@afnic.fr
Twitter: @Afnic | Facebook: afnic.frTHE GLOBAL DOMAIN NAME MARKET IN 2018 10/46
3.3. nTLDs, from loss of momentum to fresh impetus?
The chart below shows a quarterly view of the change in market share of the various segments
since the introduction of the first nTLDs in January 2014. Note the strong growth of nTLDs up
to Q1 2017, before a period of decline in Q2 and Q3 2017 and stabilization at the end of the
year and Q1 2018. 2018 saw a recovery in the momentum of gains in market share, even if
they remain modest overall with less than 10% for all of the 1,300 new TLDs created since
2014.
At the same time, the ccTLDs were fairly stable in their market shares, even if the trend was
slightly downward in 2018. This being said, this segment combines so many different situations
in terms of eligibility conditions or marketing strategies, that it is impossible to make a
judgement on this overall performance.
Change in market share per type of
TLD
2014-2018
100%
80%
60%
40%
20%
0%
ccTLDs
3.4. A market dominated by the .COM in 2018
The same data expressed in net balance highlight the weight of the different segments in the
overall performance of the market in 2018. It can be seen that the .COM alone accounts for
56% of the net balance, while ccTLDs contributed 33% and nTLDs 29%. These figures are
inflated by the under-performance of the Other Legacy TLDs, which reduces accordingly the
basis for calculating the various contributions as percentages.
The data in absolute value are more interesting to locate the orders of magnitude from 2016
to 2018. For example, the net balance was 30 million names in 2016, before falling to 2 million
in 2017 due to delete operations. The figure of 13 million in 2018 is one of the signs of a return
to normal, but we can see that the net balance of the gTLDs is 82% due to the good
performance of the .COM (7/8.5).
www.afnic.fr | contact@afnic.fr
Twitter: @Afnic | Facebook: afnic.frTHE GLOBAL DOMAIN NAME MARKET IN 2018 11/46
Net balances
Weight in the total
(millions of DN)
2016 2017 2018 2016 2017 2018
.COM 4.7 3.7 7.0 16% 156% 56%
Other Legacy TLDs 1.0 -0.7 -2.2 3% -31% - 17%
nTLDs 16.6 -4.1 3.7 55% -172% 29%
Total gTLDs 22.3 -1.1 8.5 74% -47% 67%
ccTLDs (excluding "Penny") 7.8 3.5 4.2 26% 147% 33%
TOTAL 30.1 2.4 12.7 - - -
These data are useful for giving an idea of the relative positions and dynamics of the major
market segments - Legacy, ccTLD and nTLD - but they do not explain them. Now let's take a
closer look at each of these three segments to try to better understand the phenomena at work
in 2018.
www.afnic.fr | contact@afnic.fr
Twitter: @Afnic | Facebook: afnic.frTHE GLOBAL DOMAIN NAME MARKET IN 2018 12/46
4. Legacy TLDs in 2018
There are now 18 "Legacy TLDs", or "traditional" domains created before 2012: AERO, ASIA,
BIZ, CAT, COM, COOP, INFO, JOBS, MOBI, MUSEUM, NAME, NET, ORG, POST, PRO,
TEL, TRAVEL, XXX.
The stocks of these Legacy TLDs vary considerably, from the few names of the .POST to the
142 million of the .COM.
In order to present relevant summary tables and indicators, we shall only distinguish the six
most important in terms of volume, aggregating the other 12 in an "Others" line.
Create operations
Stocks (thousands) "M" (thousands) (*)
(thousands)
% %
2017 2018 Var. 2017 2018 Var. 2018
2018 2017
.BIZ 2 138 2 240 5% 562 811 44% 1 430 67% 66%
.COM 135 027 142 049 5% 33 324 35 476 6% 106 573 79% 77%
.INFO 6 980 5 539 -21% 3 136 1 504 -52% 4 036 58% 67%
.MOBI 544 480 -12% 67 54 -18% 425 78% 71%
.NET 14 951 14 288 -4% 3 029 2 762 -9% 11 527 77% 74%
.ORG 10 835 10 663 -2% 2 023 1 953 -3% 8 709 80% 80%
Others 1 133 1 162 3% 291 328 13% 834 74% 65%
TOTAL 171 608 176 422 3% 42 431 42 888 1% 133 534 78% 77%
* "M" refers to the number of domain names retained in 2018. This figure is obtained by a fairly simple equation: M = Stock at
31/12/2018 - Create operations 2018.
This is because the stock of a TLD at the end of 2018 is mathematically constituted by the names of the stock as at 31/12/2017
retained in the portfolio to which have been added the domain name creations of 2018. It is therefore possible to deduce a
"retention rate" based on these data from the various registries at ICANN [% R] for the names that were in stock at the end of
2016.
Rr R 2018 = M / Stock 2017
This "retention rate" should not be confused with the Renewal Rate, which only concerns the names that were up for renewal
during the year in question. Names filed for several years are "retained" but not "renewed".
In 2018, the global Legacy stock grew by 3% while create operations appreciated by only 1%.
The explanation lies in the retention rate which gained 1 point, rising from 77% in 2017 to 78%
in 2018.
www.afnic.fr | contact@afnic.fr
Twitter: @Afnic | Facebook: afnic.frTHE GLOBAL DOMAIN NAME MARKET IN 2018 13/46
4.1. Contrasting situations
The data presented above show that the situations of the main Legacy TLDs are quite
contrasting. They most often follow promotional campaigns that have their effects in terms of
create operations in the first year, and in terms of delete operations the following year.
The case of .INFO was emblematic of this situation in 2018. After 2017, a year marked by an
excellent performance in China, which caused an explosion in the number of its create
operations by 68%, the TLD saw the same create operations halved in 2018 compared with
2017 and its retention rate lose 9 points, resulting a loss of 21% in stock. These variations
could seem worrying for the health of the suffix if one only considered 2018, but put back in
their context they seem rather natural.
The .BIZ in 2018 was in the same situation as the .INFO the previous year: in May 2018 it
recorded create operations for 382,000 domain names or 10 times its monthly average. The
campaign explains the strong growth of its create operations, just as it will probably result in
2019 in phenomena similar to those experienced today by .INFO.
Beside these large TLDs which maintain their business with campaigns, others are
experiencing real difficulties. For example, .MOBI whose create operations have been
declining for several years: 500,000 in 2013, 161,000 in 2014, 113,000 in 2015, 131,000 in
2016, 67,000 in 2017 and 54,000 in 2018. These TLDs are threatened by the scarcity of
demand, often because of the multiplication of possible choices, which "vampirise" their
potential prospects while encouraging the rights holders to practice highly targeted defensive
strategies on TLDs considered critical in relation to their business.
The case of .NET is something else, although similar dynamics are at work. Verisign has been
steadily increasing .NET prices for several years and at least a portion of the "losses" of create
operations are due to these price increases. However, the retention rate is improving, which
suggests that .NET is still a choice TLD that holders prefer to keep.
4.2. Improved retention rates
Most of the retention rates in 2018 showed sometimes very significant improvements, as in the
case of .MOBI. .INFO was an exception with its loss of 9 points, but this can be explained by
the performance in China in 2017.
This general trend towards improved retention rates is linked to the end of the 2017/2018 wave
of delete operations caused by the massive create operations in 2016 (with a time lag linked
to the redemption and "pending delete" periods).
This is a good sign for these extensions that are starting out in 2019 on a sound basis, at least
those whose promotional campaigns were not too aggressive.
www.afnic.fr | contact@afnic.fr
Twitter: @Afnic | Facebook: afnic.frTHE GLOBAL DOMAIN NAME MARKET IN 2018 14/46
Var. 17/18
2012 2013 2014 2015 2016 2017 2018
(in pts)
.BIZ 76.6% 75.3% 66.8% 68.3% 76.2% 66.4% 66.9% 0.5
.COM 78.2% 78.0% 77.5% 77.4% 78.2% 77.4% 78.9% 1.5
.INFO 46.2% 51.2% 61.2% 65.3% 76.6% 66.9% 57.8% -9.1
.MOBI 68.7% 69.6% 58.1% 68.6% 76.6% 70.8% 78.2% 7.4
.NET 77.4% 76.6% 76.6% 76.7% 79.6% 73.9% 77.1% 3.2
.ORG 78.6% 78.4% 78.2% 78.4% 82.2% 79.6% 80.4% 0.8
Others 74.3% 69.1% 64.5% 81.4% 82.5% 64.8% 73.6% 8.8
TOTAL 76.1% 76.4% 76.4% 76.8% 78.5% 76.6% 77.8% 1.2
Change in Retention Rates for Legacy gTLDs 2012-2018
4.3. Implications in terms of naming strategies
We have already noted that the improvement in retention rates could be linked to the end of
"purges", that is to say that the names remaining in the portfolio are intended to be kept in
increasing proportions.
There are mainly four reasons for keeping a domain name:
- (a) because it is used and therefore important for its holder;
- (b) because the holder wants to keep the name even if they are not using it at present
(current project, conviction that the name will gain value, etc.)
- (c) because it corresponds to a brand that the holder wants to protect (defensive domain
registration)
- (d) because the holders are lackluster in the management of their domain names and
renew the names without questioning the merits of the operation.
Among all these reasons, (a) and (b) are the strongest because they are related to uses or to
a perception of value. (c) and (d) are the weakest and very sensitive to price changes as to the
appearance of new TLDs that may need to be filed. This leads to disposals in a context where
budgets are not infinitely expandable. The sums spent on defensive filings deposits in Legacy
TLDs are allocated to other defensive registration in the nTLDs, and the holders who have
managed their portfolios in a rather loose manner are forced to adopt optimization strategies.
It is more than likely that the Legacy TLDs (except the .COM) suffer from these disposal
strategies that dry up their create operations and force them either to practice aggressive
promotional campaigns to temporarily maintain their stocks, or to assume a certain decline
while looking for ways to retain their current holders.
The good health of the .COM in terms of create operations (+6% in 2018) can be explained by
the existence of campaigns, but it is more probably due to a refocusing of users on the
TLDsthey know best. It is these TLDs (.COM and the main ccTLDs) that are still the subject of
www.afnic.fr | contact@afnic.fr
Twitter: @Afnic | Facebook: afnic.frTHE GLOBAL DOMAIN NAME MARKET IN 2018 15/46
sustained create operations and generally enjoy high retention rates. The consequence is that
the domainers, when they are not Chinese, tend to favor the TLDs that are well-established at
the expense of newcomers with a higher risk profile.
These different phenomena (the refocusing of create operations, the disposals of retained
names, a relative loss of interest in defensive filings and speculative operations, largely explain
the decline of the "Other Legacy TLDs", the difficulties of many nTLDs in finding their market,
and the relative good health of the .COM and the main ccTLDs.
www.afnic.fr | contact@afnic.fr
Twitter: @Afnic | Facebook: afnic.frTHE GLOBAL DOMAIN NAME MARKET IN 2018 16/46
5. ccTLDs (country-code Top-Level Domains)
ccTLDs as a whole confirmed their growth momentum, with +3.4% in stock against +2.9% in
2017. Performance deteriorated between the peak of October 2017 (+5%) and the trough of
August 2018 (+1.8%) before recovering during Q4 2018.
5.1. Dynamics very different from one region to another
The study of regional dynamics shows, however, that the situations differ according to
geographical area. In North America, the performance characteristics mainly reflect that of the
.US, which is slowly returning to growth in 2018 after the 2017 "purge".
Latin America saw its growth increase significantly in 2018, moving from a balanced situation
in 2017 to a growth rate of 6%. This phenomenon is mainly due to the .BR (+250,000 names)
and .MX (+165,000 names).
Even excluding penny TLDs, Africa posted strong growth of 9% compared with 6% in 2017,
which illustrates the rapid development of the Internet, probably related to catch-up effects.
Asia-Pacific is the region with the highest score, with growth of 12% against 2% in 2017,
despite the poor performances of .CN (China), .CC (Cocos Islands) and .NU (Niue Islands)
which according to our estimates respectively lost 480,000, 270,000 and 150,000 names.
These losses were largely offset by the explosion of .TW (Taiwan), which gained nearly 4,100
names following a promotional campaign.
Europe finally is the only region to have lost stock, even if the loss remains very limited
(-1%). The biggest variations are in gain, those of .FR (+139,000 names) and .PT (Portugal,
+111,000 names) and in losses, those of .DE (Germany, - 110,000 names), .EU (-158,000
names), .SE (Sweden, -205,000 names), .RO (Romania, -238,000 names) and .RU (Russia, -
350,000 names).
Data excl. Stock (millions) Variations (%) Market share (%)
penny CcTLDs 2016 2017 2018 2017 2018 2016 2017 2018 18/17
North America 4.8 4.8 4.9 -0.4% 0.9% 4.1% 4.0% 3.9% - 0.1
Latin America 7.7 7.7 8.2 0.0% 5.9% 6.5% 6.3% 6.5% +0.2
Africa 1.4 1.5 1.6 5.9% 8.6% 1.2% 1.2% 1.3% +0.1
Asia-Pacific 34.6 35.3 39.4 2.1% 11.5% 29.3% 29.1% 31.3% +2.2
Europe 69.5 72.2 71.7 3.9% -0.7% 58.9% 59.4% 57.0% -2.4
TOTAL 118.1 121.6 125.7 2.9% 3.4% - - - -
Although losing 2.4 points of market share, the European market is still dominant with 57% of
domain names filed in ccTLDs (excluding the "pennies"), followed by the Asia-Pacific region
(31%).
www.afnic.fr | contact@afnic.fr
Twitter: @Afnic | Facebook: afnic.frTHE GLOBAL DOMAIN NAME MARKET IN 2018 17/46
The other three regions do not account for more than 12% all three combined, which shows
the low numbers of ccTLDs and their significant potential, which translates into high growth in
Africa and Latin America.
5.2. Influence of gTLDs-like and penny-ccTLDs
To avoid bias due to their high volatility, we have excluded from our global tracking these TLDs
made specific by the innovative marketing strategies of their registries. But this does not detract
from the interest of following the sample over time.
It should be recalled that these ccTLDs have been "diverted" from their original purpose, i.e.
marketed not as national TLDs, but as generic TLDs, against a backdrop of semi-gratuity
where the highly attractive price replaces the potential lack of any "generic" meaning of the
ccTLD.
The most well-known gTLDs-like are .TV (Tuvalu Islands - "Television"), .ME (Montenegro -
"Me / Myself"), .CO (Colombia - "Commercial"), .NU (Niue Island - "New" in Swedish) or even
the .LA (Laos - "Los Angeles"). We have added the .VC (Cape Verde - Venture Capitalist).
The penny ccTLD identified this year, subject to an inventory, are the .CC (Cocos Islands), .CF
(Central African Republic), .GA (Gabon), .GQ (Equatorial Guinea), .IO (British Indian Ocean
Territory), .ML (Mali), .PW (Palau Islands), and .TK (Tokelau Islands).
If we make a distinction between the three ccTLD segments based on the marketing strategies
of their registries, the "true ccTLDs", the quasi-gTLDs and the penny ccTLDs, we obtain the
data collected in the table below.
2015 2016 2017 2018
Stock 106.3 113.8 117.3 121.7
ccTLDs Variation 7.9 7.5 3.6 4.4
Var. (%) 8% 7% 3% 4%
Stock 3.9 4.3 4.3 4.1
Quasi-gTLDs Variation 0.4 0.4 0 -0.2
Var. (%) 12% 11% -1% -5%
Stock 30.8 23.1 25.2 31.6
Penny CcTLDs Variation 9.0 -7.7 2.1 6.4
Var. (%) 41% -25% 9% 26%
Stock 141.1 141.2 146.7 157.5
TOTAL Variation 17.4 0.1 5.6 10.8
Var. (%) 14% 0% 4% 7%
The proportions did not significantly change in 2018, with "quasi-gTLDs" undergoing a slight
decrease, showing that they are also likely to be victims of competition from the new TLDs.
www.afnic.fr | contact@afnic.fr
Twitter: @Afnic | Facebook: afnic.frTHE GLOBAL DOMAIN NAME MARKET IN 2018 18/46
"Classic" ccTLDs saw their market share erode to 77% from 79% in 2017, with 2018 being a
mild recovery after the 2017 'low'.
"Penny-ccTLDs" saw their stock increase sharply (26%), but this should not necessarily be
interpreted as an "improvement" for this segment, which is subject to high volatility. This is why
we have excluded them from our market trend analyzes, although in 2018 they accounted for
nearly 60% of the net change in all types of ccTLDs combined.
Penny ccTLDs are only found in Africa and Asia-Pacific, as shown in the table below.
Data Stock (millions) Variations (%) Market share (%)
Penny CcTLDs 2016 2017 2018 2017 2018 2016 2017 2018 18/17
Africa 1.9 4.3 8.8 122% 105% 8% 17% 28% +11
Asia-Pacific 21.2 20.9 23.0 -1.0% 10% 92% 83% 72% -11
TOTAL 23.1 25.2 31.6 9.0% 26.2% - - - -
Although Asia-Pacific dominates thanks to the .TK, it is Africa which enjoyed the strongest
expansion dynamic among these TLDs, the use of which is problematic. These domain names
most often point to content generated automatically in order to capture traffic by taking
advantage of the law of large numbers. The question that arises is how long will these bubbles
will last before exploding, due the loss of interest among those who used them to create cheap
addresses on the fly, but who will not continue to do so if prices were to increase.
www.afnic.fr | contact@afnic.fr
Twitter: @Afnic | Facebook: afnic.frTHE GLOBAL DOMAIN NAME MARKET IN 2018 19/46
6. nTLDs
It should be recalled that the only thing new Top Level Domains often have in common is that
they are "new". This is not enough to qualify them because this feature will disappear over time
(and of course at the next ICANN round). Too often, observers refer to the success or failure
of "new TLDs" without taking time to group them into segments that make sense and allow for
a more nuanced approach.
6.1. Definition of new TLD "segments"
This is why we have created different market segments, corresponding to the most frequent
approaches in specialist circles. It is obvious that these TLDs are still "young", such that the
uses made of them may lead to revisions of this segmentation which is still highly biased by
the "nature" of the nTLDs and the conditions for being eligible to hold them:
Community: domain name filings reserved for the members of a community, and if
applicable, with use being community-centric.
Geographic: nTLDs of a geographical character designating a city or region.
Generic: nTLDs consisting of generic terms.
Corporate or Brand TLDs: TLDs corresponding in general to flagship brands, filed by
private entities for internal use or extended to their customers, excluding all other users.
Our nTLD segmentation attempts to reflect the purpose of TLDs rather than their "ICANN
status", since the latter are difficult to qualify and have sometimes been adopted for tactical
reasons (such as the privileges granted to "Community" nTLDs). There is currently no "official"
nTLD nomenclature, so our segmentation is liable to change based on information made public
by the registries or ICANN.
An additional complexity factor is the degree of restriction required by each registry. Access to
a ".CORP" can be relatively "open" (if the only condition to be met is, for example, being a
client of the delegate) when the registration of a Generic TLD may equally as well be subject
to conditions. NTLDSTATS.COM, which provides a nomenclature, is based on a framework
that ranges from "Unrestricted" to "Restricted" through "Semi-restricted" and "Brand".
However, while this approach may explain the data on volumes (or their absence) according
to eligibility conditions, it does not teach us anything about the purpose and market positioning
of nTLDs.
The differences in dynamics observed for each of our segments show that the typology used
is relevant today. But it remains susceptible to change, as shown by the appearance in 2018
of a handful of .CORP TLDs with very high volumes. Undoubtedly nTLD families will continue
to refine in the future, requiring periodic revisions of the classification of these top level domains
in order to keep as close as possible to market realities.
www.afnic.fr | contact@afnic.fr
Twitter: @Afnic | Facebook: afnic.frTHE GLOBAL DOMAIN NAME MARKET IN 2018 20/46
6.2. Performance of new TLD "segments"
Create operations
Stocks (thousands) Retention
(thousands)
R. % R. % R.
2017 2018 Var. 2017 2018 Var.
2017 2018 2017
Community TLDs 142 63 -56% 4 3 -13% 60 42% NA
Geographic 1 019 1 038 2% 230 196 -15% 842 83% 87%
Generic 22 427 25 289 13% 13 141 16 972 29% 8 317 37% 35%
Corporate 208 1 069 414% 127 913 619% 156 75% 47%
TOTAL 23 796 27 458 15% 13 502 18 084 - 9 374 39% 37%
2018 saw the segment of "Community" TLDs undergo an abrupt correction, mainly because
of the ".pyc" ("Russian") which sank from 125,000 names to 46,000. The other domains of this
segment are mostly losing stock, but the decline remains limited. The create operations are
down by 13% and the turnover rate is low, 42%, due to delete operations made under the
".pyc".
Geographical TLDs as a whole posted moderate growth of 2%, the dynamic of create
operations not being very encouraging (-15%) and the renewal rate is down, although still
above 80%. The best performances in this segment were achieved by .TIROL (+54,000
names) and .COLOGNE (+51,000). The "worst" by .KIWI (- 182,000) and .LONDON (- 18,000).
The under-performance of .KIWI, which lost nearly 90% of its stock in one year, weighs heavily
on aggregated geo-TLD data. The retention rates still remain at 83%, which is by far the best
of the four segments.
The generic TLDs, which represent 92% of the names registered as nTLDs, saw a growth of
13% and an increase in their create operations of 29%. Their very low turnover rate, 37%,
slightly improved but nevertheless demonstrates the existence within this segment of large
players oriented low-cost and which could eventually be considered as "Penny TLDs". Here,
the "Top 3" in 2018 were represented by .TOP (+1,821,000 names), .CLUB (+466,000) and
.SITE (+421,000). At the other end of the spectrum is .WIN (-575,000 names), .WANG (-
461,000) and .XYZ (-337,000).
The .CORP (or .BRAND) segment is the one that "exploded" in 2018, but this variation is
actually due to only three TLDs (out of 624) whose classification among the .CORP segment
could be subject to revision. They are the .APP (+361,000 names), the .ICU (+290,000) and
the .FUN (+152,000). Together, these TLDs represent 93% of the change in the segment in
2018.
www.afnic.fr | contact@afnic.fr
Twitter: @Afnic | Facebook: afnic.frTHE GLOBAL DOMAIN NAME MARKET IN 2018 21/46
The table below shows the change in the number of TLDs in each segment since the
launch of 2014.
Number in Variations (net balance)
2014 2015 2016 2017 2018 2015 2016 2017 2018
Community TLDs 7 12 12 12 12 +5 - - -
Geographic 50 58 62 63 63 +8 +4 +1 -
Generic 334 441 488 495 500 +107 +47 +7 +5
Corporate 74 306 647 633 624 +232 +341 -14 -9
TOTAL 465 817 1 209 1 203 1 199 352 392 -6 -4
nTLDs with at least 1 portfolio name as at 31/12 of each year.
After 2014-2015, which saw the creation and activation of most of the nTLDs (+465, +352,
+392), 2017 and 2018 were marked by the first delete operations, which were essentially
.CORP domains abandoned by their owners. Since this segment obeys specific dynamics, it
is impossible to deduce from these delete operations that they were consecutive to
"commercial failures". These are more likely to be reorientations in the digital strategies of the
groups concerned, changes of flagship brands making the .CORP obsolete, or simply
defensive create operations from the beginning that their delegatees do not want to continue
to finance, because they don't know how to use them.
It is likely that the overall number of nTLDs will continue to decline steadily in the future, hitting
the .CORP in particular. In fact, the other three segments are open to third parties, which
makes buy backs from other registries possible. In addition, in the event of a default with no
buyback, ICANN rules provided for a precautionary deposit allowing TLDs to continue to
operate for 3 years. For this reason, the first nTLD delete operations will appear in the
Community, geo-TLD and generic segments with some delay.
6.3. Distribution of new TLDs in volumes of domain name
registrations
The distribution in volume of domain name registrations does not reflect the number of TLDs
in each segment, as shown in the two graphs below. With 500 TLDs (42% of the total), generic
nTLDs represent 94% of domain name registrations; with 624 TLDs (53% of the total) .CORP
only represent 1% of domain name filings.
www.afnic.fr | contact@afnic.fr
Twitter: @Afnic | Facebook: afnic.frTHE GLOBAL DOMAIN NAME MARKET IN 2018 22/46
Distribution of nTLDs by type (2018)
Community TLDs
12
1%
Generic
500
42%
Corporate or brand
624
52%
Geographic
63
5%
Distribution of nTLDs by volume
(2018)
Community TLDs Corporate or brand
62 916 1 068 566
4% Geographic
0% 1 038 089
4%
Generic
25 288 906
92%
These two diagrams sufficiently illustrate the variety of economic models and strategies of
each segment. The .CORPs generally respond to internal needs, while the Community and
www.afnic.fr | contact@afnic.fr
Twitter: @Afnic | Facebook: afnic.frTHE GLOBAL DOMAIN NAME MARKET IN 2018 23/46
Geographic nTLDs target customers meeting membership or location criteria. Finally, generic
nTLDs can develop global ambitions as well as focus on niche markets, depending on the
potential represented by their terms.
The graph below shows the breakdown of nTLDs by volume range. We can see that the "Less
than 5,000 names" represent a little more than 75% of the total, while the "More than 500,000"
represent only 1%.
Breakdown of nTLDs
by volume range
Dec. 2018
0%
0%
3%
3%
3%
8%
75%
8%
>1M From 500,001 to 1 M From 100,001 to 500,000
From 50,001 to 100,000 From 25,001 to 50,000 From 10,001 to 25,000
From 10,001 to 25,000 < 5,000
If we take into account ICANN's fees ($ 25,000 minimum fixed cost) and the various costs
related to the management of a TLD (staff, technical operator, promotion, etc.) and that we
estimate a hypothetical average budget of $100,000 per year, it can be seen that the
equilibrium threshold for a TLD marketing its domain names at around $20 is 5,000 names
(10,000 for a $10 fee close to that of .COM).
Excluding the .CORPs which obey very different forms of logic, one obtains 287 TLDs of less
than 5,000 names (ie 50% of TLDs excluding .CORP) and 478 TLDs with less than 10,000
names (83% of TLDs excluding .CORP).
This means at present that 50% of the new TLDs are potentially "loss making" if they sell below
the $ 20 threshold and 83% if they sell below the $ 10 threshold. Even if these estimates are
relatively rough, orders of magnitude show that quite a large number of TLDs must be in a
fairly precarious situation at the moment. The tension on costs (ICANN and others) will grow
as time goes by. Registries are placed in a particularly uncomfortable situation, because they
cannot develop their TLD without the requisite means, but these expenses may strangle them
quickly enough in case of failure of promotional campaigns.
www.afnic.fr | contact@afnic.fr
Twitter: @Afnic | Facebook: afnic.frTHE GLOBAL DOMAIN NAME MARKET IN 2018 24/46
Some have engaged in recent years in low-cost strategies that translate into exceptional
volumes for such "young" top level domains. But 1,000,000 domain names "sold" for 1 cent
only generate $ 10,000 in fact, which is one-tenth of the annual budget we took as a working
hypothesis, or the equivalent of 1,000 names sold for $ 10 apiece.
High volumes can therefore be indicators of success, but also the reflection of particularly risky
strategies based on the fact that holders attracted by very low prices at the time of creation will
agree to renew their names at more "normal" prices in the following years.
6.4. Change in retention rates per segment 2
Retention rates are therefore a key factor for analyzing the success of a TLD and its chances
of sustainability.
Unsurprisingly, you can see that the Generics rate is the lowest, albeit rising in 2018 (37% vs.
30% in 2017). But this rate remains an average, as we shall soon see.
After a "purge" in 2017, the .CORP rate has returned to its 75% level. Geographic nTLDs are
the better off with more than 80% of the names renewed from one year to the next.
Change in retention rates per
segment
90%
80%
70%
60%
50%
40%
30%
Corporate or brand Geographic Generic Together .COM
20%
12/15 06/16 12/16 06/17 12/17 06/18 12/18
(The .COM rate is added as a comparison.)
2
We make a difference between the Retention Rate, which includes all the names "kept" from one year to the next, and the
Renewal Rate, which takes into account only "renewed" names. A name registered for 5 years will be "retained" for 5 consecutive
years and renewed once, at its expiration date.
www.afnic.fr | contact@afnic.fr
Twitter: @Afnic | Facebook: afnic.frTHE GLOBAL DOMAIN NAME MARKET IN 2018 25/46
6.5. Global change in the stock of new TLDs
The all-time peak of nTLDs was reached in March 2017, after which the waves of create
operations in November 2015, February 2016 and June 2016 resulted in delete operations that
weighed heavily on the overall volume. The stall of August 2017 (create operations of June
2016 expiring with the offset related to the redemption grace period and pending delete period)
is visible.
The decline continued throughout 2017, reaching a low in February 2018, after which volumes
began to rise again, first slowly and then steadily from June 2018.
Change in the number of names in
nTLDs
35 000
30 000
25 000
20 000
15 000
10 000
5 000
0
This development is interesting in that it shows the impact of strong waves of create operations,
which first result in dramatic increases in volumes, before causing delete operations in the
following years that hinder growth. The overall nTLD stock has curiously fallen back to the
long-term trend initiated in 2014, with a surplus of a few hundred thousand names representing
the remainder of the 2015-2018 variations.
This phenomenon remains a concern because it is a linear expansion, whereas the number of
nTLDs was exponential from 2014 to 2016, meaning that the number of names filed by nTLDs
has remained lower than it should have been. Beside a few nTLDs playing the volume card at
any price, the vast majority are "vegetating" far below expectations.
www.afnic.fr | contact@afnic.fr
Twitter: @Afnic | Facebook: afnic.frTHE GLOBAL DOMAIN NAME MARKET IN 2018 26/46
6.6. The Utilization Rate, an indicator of the longevity of
nTLDs
The retention rate can be cyclically affected by the impact of previous promotional campaigns.
It is therefore interesting to study the rate of use of TLDs, which is a valuable indicator for
anticipating future developments in renewals. Common sense leads to the fact that names
exploited and/or valuable for their holders will be renewed more willingly than unused names
having no value other than defensive.
We have calculated these rates based on the data presented by the website NTLDstats.com
in its "parking" section. By eliminating all of the "parked" names, redirects and HTTPs errors,
we obtain a number of domain names that are fairly likely to be actually used. This utilization
rate "deduced" from the rest is, of course, only a rough estimate, which should be used in
terms of magnitude and trends without giving too much importance to precise values.
Change in usage of nTLDs 2015-2018
100%
90%
80%
70%
60%
50%
40%
30%
20%
10%
0%
2015 2016 2017 2018
Parking Errors Redirects "Real" use
Source: nTLDtats.com. Data as at 31/12.
Based on our calculations, the results of which are presented above, the utilization rate globally
doubled between 2015 and 2016, rising from 10% to 20%. In 2017, the dynamics were broken
and the utilization rate remained at about the same level as in 2016. It improved again in 2018
from just over 20% to 30%, and almost 40% if redirects are included.
Given these figures, some may rightly consider that a utilization rate close to 25% three years
after the opening of nTLDs is relatively low; but here again one must be wary of averages.
Indeed, as nTLDtats.com shows, some large "penny nTLDs" have very low utilization rates
that suggest that the same rates should be higher in more modest namespaces in terms of
volume.
www.afnic.fr | contact@afnic.fr
Twitter: @Afnic | Facebook: afnic.frTHE GLOBAL DOMAIN NAME MARKET IN 2018 27/46
6.7. "Leaders" still fragile
The "leaders" were selected according to a volumetric criterion: the reference sample group
included all nTLDs having or having had, 500,000 domain names or more in stock on 31/12 of
any year since 2014.
It is true that these leaders are largely TLDs marketed on the basis of aggressive marketing
strategies, or are otherwise "low cost". But they are nevertheless important to study in order to
understand some mechanisms of market operation.
The table below shows that these 13 extensions alone accounted for 58% of the names filed
in the 1,199 nTLDs on 31/12/18, and two-thirds of the names created during the past year.
The stocks of both categories, sample group and non-sample group, grew at the same pace
in 2018, 15-16%, while the create operations of the sample group continued to soar (44%)
while those of the non-sample group "only" increased by 18%. The difference can be explained
in terms of retention rates: 24% for sample group members, 48% for the non-sample group
members.
Create operations
Stocks (thousands) %Retention
(thousands)
2017 2018 Var. 2017 2018 Var. 2017 2018
.TOP 2 137 3 957 85% 1 083 3 402 214% 22% 26%
.XYZ 2 641 2 305 -13% 1 671 1 633 -2% 14% 25%
.LOAN 2 397 2 219 -7% 1 594 2 135 34% 91% 4%
.CLUB 1 215 1 681 38% 810 1 319 63% 44% 30%
.ONLINE 776 1 154 49% 506 871 72% 46% 37%
.SITE 538 959 78% 405 789 95% 22% 32%
.VIP 915 852 -7% 476 124 -74% 78% 80%
.SHOP 517 663 28% 298 470 58% NA 37%
LT 345 627 82% 315 426 35% 70% 58%
.WORK 176 534 203% 143 473 230% 41% 35%
.WIN 1 037 462 -55% 450 215 -52% 47% 24%
.BID 484 242 -50% 311 155 -50% 28% 18%
.WANG 618 157 -75% 325 33 -90% 30% 20%
Total Top 500K 13 798 15 811 15% 8 386 12 045 44% 30% 24%
Others 9 999 11 648 16% 5 117 6 044 18% 50% 48%
Total nTLDs 23 796 27 459 15% 13 503 18 090 34% 43% 34%
% Top 11 / total
58% 58% 62% 67%
nTLDs
Source: ICANN reports
Sample group consisting of nTLDs holding or detaining
more than 500,000 names in their portfolio as at 31/12 of one year since 2014.
www.afnic.fr | contact@afnic.fr
Twitter: @Afnic | Facebook: afnic.frTHE GLOBAL DOMAIN NAME MARKET IN 2018 28/46
Data from each TLD of the sample group shows that the averages are always misleading, with
"24%" masking the 4% of .LOAN as well as the 80% of .VIP.
The matrix table below highlights the different dynamics found among the TLDs of our sample
group.
Two grew quickly in 2018 (.TOP, .SITE); two others suffered on the create operations but
improved their renewal rates (.VIP, .XYZ); three others showed a marked decline with the
deterioration of the two indicators (.WIN, BID, .WANG). The latter saw their create operations
progress while losing retention points.
These different profiles show the strategy at work in terms of marketing, from active low-cost
campaigns (last category) to a focus more on customer loyalty and less on volumes of create
operations (.VIP, .XYZ). In the case of the three TLD suffixes that are declining, the data may
indicate "exits" from promotional campaigns that have not resulted in the expected results in
terms of loyalty.
Create operations
Create operations increasing
decreasing
Others (Outside sample group)
Retention rate .VIP
.TOP
increasing .XYZ
.SITE
.LOAN
.WIN .CLUB
Retention rate
.BID .ONLINE
decreasing
.WANG LT
.WORK
(Excluding .SHOP)
The nTLD segment therefore still needs to be analyzed by putting into proper perspective the
impact of the "leaders", who are subject to strong fluctuations due to their marketing strategies,
just as ccTLDs should be considered without the penny ccTLDs that distort the overall
performance characteristics.
The finding revealed by the table above contradicts the gloom or pessimism that can be seen
in certain specialized publications about new TLDs. In fact, this segment is highly concentrated
and its leaders are trees that hide the forest: they are not representative of all these new
entrants who are essentially continuing to progress, even if their growth is slower than their
promoters had hoped.
www.afnic.fr | contact@afnic.fr
Twitter: @Afnic | Facebook: afnic.frTHE GLOBAL DOMAIN NAME MARKET IN 2018 29/46
7. The distribution of domain names in the world at
year-end 2018
The analysis of the development of the major segments of the domain name market, Legacy
TLDs, ccTLDs, and nTLDs, can be completed by studying the distribution of stocks of these
same segments in the major regions of the world. 3
By convention, we have used the ICANN nomenclature for reference, even though it can
sometimes be open to discussion.
In 2017, we focused on presenting, for each major segment of domain names (.COM, Other
Legacy, ccTLD, nTLD), the proportion of different ICANN regions. This approach highlighted
North America's weight for .COM and Other Legacy TLDs, Europe for the ccTLDs, and Asia
Pacific for nTLDs.
In 2018, we present the opposite view, that is, the proportion of each major segment in the
different ICANN regions.
7.1. Overview
In 2018, .COM was the market leader with 43% market share, followed by ccTLDs (excluding
Penny) with 42%. The other two segments, Other Legacy and nTLD, accounted for 10% and
5% of worldwide filings, respectively.
World
Weight of different segments - 2018
nTLDs
Other Legacy 14 874
TLDs 5%
30 853
10%
ccTLDs
132 449
42%
.COM
135 091
43%
3
For the .COM, Legacy and nTLDs the distribution of names by regions of holders has been estimated by ZookNic.
www.afnic.fr | contact@afnic.fr
Twitter: @Afnic | Facebook: afnic.frTHE GLOBAL DOMAIN NAME MARKET IN 2018 30/46
As we shall see, these global data conceal significant regional disparities.
7.2. Weight of segments in Africa
In Africa, local ccTLDs are leaders, with a 55% market share, while the .COM comes in second
place. Other Legacy TLDs account for 7% (instead of 10% globally) and nTLDs remain
marginal with 2%.
Africa
Weight of different segments - 2018
Other Legacy nTLDs
TLDs 2%
7%
.COM ccTLDs
36% 55%
These figures contradict the idea that African users give priority to .COM over local ccTLDs on
the grounds that they are more expensive, more demanding in terms of eligibility, less
automated etc. In actual fact, these brakes may exist but are not sufficient to ensure that the
.COM in Africa has the leading position it holds worldwide.
7.3. Weight of segments in Latin America
The state of the market is even more pronounced in Latin America than in Africa. ccTLDs are
the absolute leader with almost 60% market share, while .COM holds only 23%, Other Legacy
TLDs 6% and nTLDs 12% (this is due to the presence of holders with large portfolios especially
in Panama).
www.afnic.fr | contact@afnic.fr
Twitter: @Afnic | Facebook: afnic.frTHE GLOBAL DOMAIN NAME MARKET IN 2018 31/46
Latin America
Weight of different segments - 2018
nTLDs
12%
Other Legacy
TLDs
6%
.COM ccTLDs
23% 59%
In addition to the anomalies related to the concentration of nTLDs in favor of structures located
in the region, the figures suggest that there is a strong preference in Latin America and Africa
for local ccTLDs, which also benefits local economies of the region as opposed to .COM and
the other Legacy TLDs whose profits are cashed by registries mostly located in the United
States.
7.4. Weight of segments in Asia-Pacific
The situation in Asia-Pacific is about the same as in Africa and Latin America: ccTLDs are the
market leaders (57% market share), followed by .COM (27%), Other Legacy TLDs (6%) and
nTLDs (10%).
www.afnic.fr | contact@afnic.fr
Twitter: @Afnic | Facebook: afnic.frTHE GLOBAL DOMAIN NAME MARKET IN 2018 32/46
Asia-Pacific
Weight of different segments - 2018
nTLDs
Other Legacy 10%
TLDs
6%
.COM ccTLDs
27% 57%
Two factors may explain the situation in the region. On the one hand, the constant efforts of
the Chinese Authorities to create a "national preference" for the benefit of the .CN to the
detriment of "non-accredited" domains. On the other hand, the presence in China of a certain
number of domainers having invested heavily in nTLDs, which explains why this share of the
market is double that of the segment globally.
7.5. Weight of segments in Europe
We saw last year that Europe accounted for 54% of the names filed in ccTLDs. The reverse
view is that ccTLDs have a 64% market share in Europe, the largest of all the ICANN regions.
.COM is at 27% as in Asia Pacific, but Other Legacy TLDs fall to 8% and nTLDs to 2%.
www.afnic.fr | contact@afnic.fr
Twitter: @Afnic | Facebook: afnic.frYou can also read