Tropical Fresh Fruit Exporter's Guide to China - A market research report for local agri-businesses in Cambodia, Lao PDR, and Vietnam - Connecting ...
←
→
Page content transcription
If your browser does not render page correctly, please read the page content below
Tropical Fresh Fruit Exporter’s Guide to China
A market research report for local agri-businesses in Cambodia,
Lao PDR, and Vietnam
Imprint

Published by the
Deutsche Gesellschaft für
Internationale Zusammenarbeit (GIZ) GmbH
Registered offices
Bonn and Eschborn, Germany

Support of Regional Economic Cooperation in Asia (SRECA)
Tayuan Diplomatic Office Building 1-14-1
Liangmahe Nanlu No 14
Beijing 100600, Chaoyang District
PR China
T + 86 10 8532 1857
F + 86 10 8532 5774
sreca@giz.de
www.connecting-asia.org
www.giz.de/en/worldwide/34101.html

As at
March 2020

Design
GIZ SRECA / MZ Marketing Communications (MZMC)

Photo credits
MZ Marketing Communications (MZMC)
GIZ (cover and back)

Author(s) / Compiled by
MZ Marketing Communications (MZMC)
www.mzmc.com.cn |
www.producereport.com

Editor(s)
GIZ SRECA
www.connecting-asia.org

Disclaimer
The views and opinions expressed herein by the authors do not necessarily imply or reflect the opinion of the organi-
sation.

On behalf of the German Federal Ministry for Economic Cooperation and Development (BMZ).

GIZ is responsible for the content of this publication.
8.3       Imports.................................................. 23
Contents
1     Executive Summary ........................................ 1                  8.4       Consumption........................................ 24

2     Market Overview............................................. 3           9      Durian ........................................................... 25

    2.1      Production ............................................... 3           9.1       Overview ............................................... 25

    2.2      Imports .................................................... 4         9.2       Production ............................................ 25

3     Banana ............................................................. 6        9.3       Imports.................................................. 25

    3.1      Overview.................................................. 6           9.4       Consumption........................................ 26

    3.2      Production ............................................... 6      10          Jackfruit..................................................... 27

    3.3      Imports .................................................... 7         10.1      Overview ............................................... 27

    3.4      Consumption ........................................ 10                10.2      Production ............................................ 27

4     Mango ............................................................ 11         10.3      Imports.................................................. 27

    4.1      Overview................................................ 11            10.4      Consumption........................................ 27

    4.2      Production ............................................. 11       11          Logistics .................................................... 29

    4.3      Imports .................................................. 12          11.1      Overview ............................................... 29

    4.4      Consumption ........................................ 14                11.2      Sea Freight ............................................ 29

5     Watermelon................................................... 15              11.3      Guangxi Border Trade.......................... 29

    5.1      Overview................................................ 15            11.4      Yunnan Border Trade .......................... 32

    5.2      Production ............................................. 15            11.5      Gray Channel ........................................ 34

    5.3      Imports .................................................. 16     12          Distribution .............................................. 34

    5.4      Consumption ........................................ 16                12.1      Supply Chain ........................................ 34

6     Longan ........................................................... 18         12.2      Wholesale Markets ............................... 35

    6.1      Overview................................................ 18            12.3      Retail ..................................................... 36

    6.2      Production ............................................. 18       13          Regulatory Environment ......................... 38

    6.3      Imports .................................................. 19          13.1      GACC ..................................................... 38

    6.4      Consumption ........................................ 20                13.2      Market Access ....................................... 39

7     Lychee ............................................................ 21        13.3      Required Import Documentation ....... 40

    7.1      Overview................................................ 21            13.4      Other Governing Bodies ...................... 41

    7.2      Production ............................................. 21       14          Challenges ................................................. 41

    7.3      Imports .................................................. 21          14.1      Consumer Standards ............................ 41

    7.4      Consumption ........................................ 22                14.2      Market Access ....................................... 41

8     Dragon Fruit .................................................. 23            14.3      Competition ......................................... 41

    8.1      Overview................................................ 23            14.4      Cold Chain ............................................ 42

    8.2      Production ............................................. 23            14.5      Investment Environment .................... 42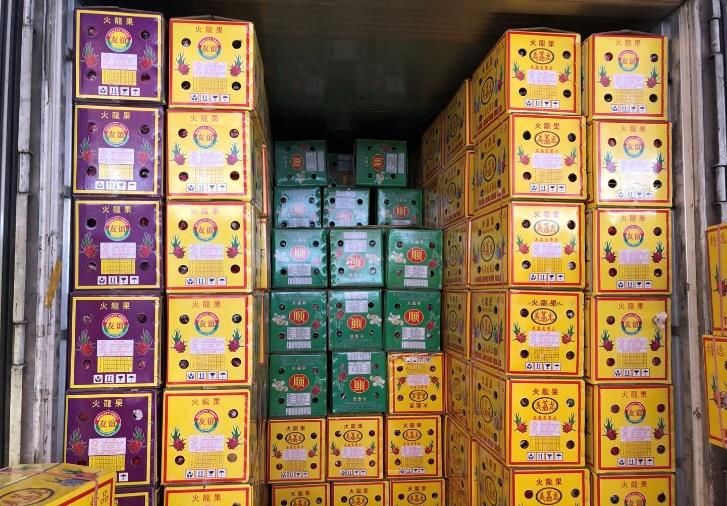
15          Recommendations .................................... 42           About the Project Support of Regional Economic
     15.1      Focus on Quality ................................... 42        Cooperation in Asia

     15.2      Achieve Market Access ......................... 43             On behalf of the Federal Ministry for Economic
                                                                              Cooperation and Development (BMZ), the
     15.3      Market Research.................................... 43
                                                                              Deutsche Gesellschaft für Internationale Zusam-
     15.4      Local Partnerships................................. 43         menarbeit (GIZ) GmbH is implementing the pro-
     15.5      Marketing and Branding ...................... 43               ject “Support of Regional Economic Cooperation
                                                                              in Asia (SRECA)”. The project works with Cambo-
     15.6      Visit China ............................................. 43   dia, Lao PDR, Vietnam, Mongolia and the PR China.
16          Conclusion................................................. 44    The latter takes on an active role as both an eco-
17          Appendix: Trade Fairs / Conferences ...... 45                     nomic and development partner to support capac-
                                                                              ity building in the four neighboring countries. The
18          Appendix: Market Contacts ...................... 45               objective is to improve conditions for regional and
19          References.................................................. 47   global agricultural trade in the four selected focus
                                                                              countries. Regarding its Southeast Asian compo-
                                                                              nent, the project focusses on private sector devel-
                                                                              opment and trade related-services in fresh fruit
                                                                              exports.
Data Note                                                                     www.connectig-asia.org
Official figures originally reported in Chinese yuan
have been converted to US dollars using the USDA
Economic Research Service (ERS) 2018 nominal                                  About MZ Marketing Communications
annual country exchange rate of $1.00 = 6.616 yuan.
                                                                              MZ Marketing Communications (MZMC) is a full-
Other figures reported during the period of this re-                          service marketing, communications, and public
search use the USDA ERS 2019 nominal monthly                                  relations firm specialized in China market devel-
exchange rate for December 2019 of $1.00 = 7.021                              opment for imported agricultural products. It is
yuan.                                                                         also the owner and operator of Produce Report,
                                                                              one of the leading trade media for fresh produce
                                                                              industry professionals with a focus on China. We
                                                                              provide expertise, resources, and talent to achieve
                                                                              highly impactful consumer and industry-targeted
                                                                              marketing campaigns. Our multilingual team of
                                                                              Chinese and international experts brings together
                                                                              insight and experience from multiple disciplines
                                                                              including marketing, trade, economics, and jour-
                                                                              nalism. This allows us to design and implement
                                                                              creative, evidence-based market strategies based
                                                                              upon      rigorous    research     and     analysis.
                                                                              www.mzmc.com.cn | www.producereport.com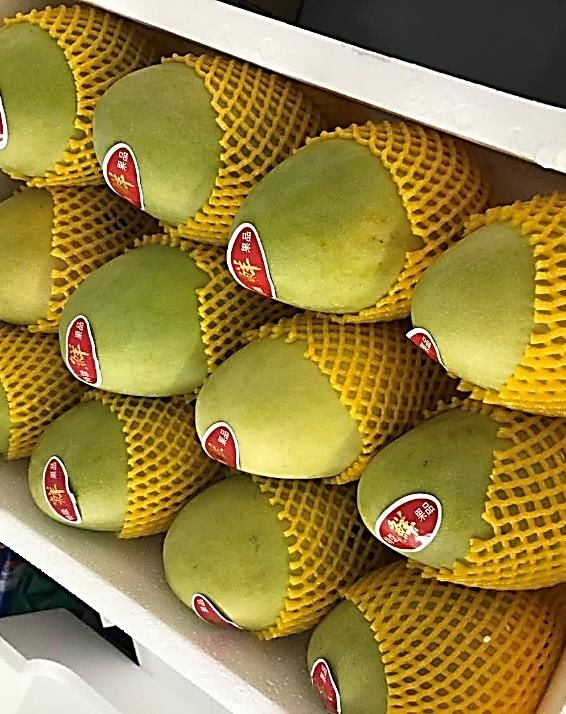
1 Executive Summary
China is the world’s largest producer, importer, and consumer of fresh fruits. Rapid economic growth in re-
cent decades has led to significant improvements in domestic fruit production, while average annual urban
wages in China have risen dramatically from just over $4,500 in 2009 to more than $11,600 in 2018. These
changes are fueling an ever-rising consumer demand for higher quality and greater varieties of fruits. In re-
sponse, the Chinese government has been expanding trade relationships with fruit producing countries, and
continuously adding to its list of fresh fruits permissible for import. As a result, over the past decade, the value
of China’s fresh fruit imports has soared from under $1.2 billion in 2009 to over $6.9 billion in 2018, with more
than 200 fruits from 24 countries permissible for import in 2019.

This report examines the competitive market conditions in China for eight fruits, with a focus on trade be-
tween China and three ASEAN-member countries: Cambodia, Lao PDR, and Vietnam. Specific fruits consid-
ered include banana, mango, watermelon, longan, lychee, dragon fruit, durian, and jackfruit. To illuminate
challenges and opportunities for these fruits and countries, market research was conducted from the period
of September through December 2019. Field research activities included interviews with more than 20 traders
and industry experts, as well as visits to wholesale markets, logistics centers, and border ports through which
the largest volumes of tropical fruits are traded. Desk research included review and analyses of existing re-
search, media reports, and official trade statistics.

Tropical fruits from Southeast Asia are among the most popular and successfully imported fruits in the Chi-
nese market. By value, durians and bananas both rank among the top five in official trade figures, with durian
imports valued at over $1 billion in 2018—second only to cherries. By volume, banana is China’s most im-
ported fruit, with imports having reached over 1.5 million tonnes in 2018. Bananas are followed by dragon
fruit, longan, and durian, accounting for four of the country’s top five fruit imports by volume. While these
figures demonstrate the significance of China’s tropical fruit imports, trade volumes for some tropical fruits
in fact are much higher than reported in official statistics due to the complex nature of trade along China’s
southern and southwestern borders.

Much of China’s tropical fruit imports from Southeast Asia enter through the country’s borders with Vietnam,
Lao PDR (Laos), and Myanmar. Special border trade regimes originally intended to bolster local economies
have in practice become utilised to import large volumes of fruits while avoiding higher VAT of standard
trade regimes. This border trade not only complicates accounting of imports, but also often leads to additional
product handling and breaks in the cold chain, which reduces product value and market prices. Upon enter-
ing China, fresh fruit shipments are generally traded through the country’s largest wholesale markets, from
where they are sold to distributors in regional wholesale markets and major retailers. While most fresh fruits
are still purchased by consumers in traditional retail markets, e-commerce and new online-to-offline shop-
ping formats are also playing an important role in promoting some tropical fruit imports.

Cambodia, Laos, and Vietnam enjoy advantageous growing conditions for most tropical fruits compared to
China. They also benefit greatly from lower costs of land and labor, logistical proximity to China, and a tariff-
free trade agreement. However, fruit producers and exporters from those countries still face multiple chal-
lenges in the Chinese market including high consumer standards, market access issues, domestic competition
for some products, and an imperfect cold chain. Individual growers often have limited ability to address these

 Tropical Fresh Fruit Exporter’s Guide to China                                                                  1
issues. In general, producers and exporters of tropical fruits can best face these challenges and optimise mar-
ket positioning by coordinating at the industry level.

 Tropical Fresh Fruit Exporter’s Guide to China                                                             2
2 Market Overview
2.1    Production
Since the mid-1980s, China has remained the world’s largest producer and consumer of fresh fruits. In 2017,
China accounted for over 43% of global fruit production, having produced almost three times the volume of
India, the second largest fruit producing country [1]. In 2018, China produced nearly 257 million tonnes of
fresh fruit [2] and imported an additional 4.9 million tonnes [3]. Historically, China has exported only small
quantities of fresh produce, meaning the aforementioned volumes are almost entirely consumed domesti-
cally. The country’s enormous appetite for fresh fruits is largely a result of cultural traditions that prize their
unique health benefits, and their important roles in celebrations and gift giving. Fresh fruits are also an im-
portant part of the typical Chinese diet.

Structurally, Chinese agriculture has shifted in recent years from primarily small-scale family farming to cur-
rently include many large-scale commercial growers with significant investments in research and growing

 Figure 1: Tropical Fruit Producing Regions

technology. This has not only improved domestic production of many fruits, but also allowed for China to
begin growing fruits that were previously only available as imports, such as dragon fruit, durian, and avocado,
among others. While large volumes of fruits are produced throughout China, tropical fruits are primarily
grown in the southernmost provinces and regions, most of which enjoy subtropical climates. Guangdong,
Guangxi, and Hainan have the greatest production volume of tropical fruits, followed by Yunnan and Fujian,
with small quantities also grown in Sichuan and Chongqing.

 Tropical Fresh Fruit Exporter’s Guide to China                                                                 3
2.2    Imports
Rising incomes and a growing middle class have played an important role in China’s ever-increasing demand
for high quality domestically produced and imported fresh fruits.

 Figure 2: Average Annual Urban Wage [2]                    Figure 3: Fresh Fruit Imports [3]

  90                                                         8
  80                                                         7
  70                                                         6
  60
                                                             5
  50
                                                             4
  40
                                                             3
  30
  20                                                         2
  10                                                         1
   0                                                         0
        2009 2010 2011 2012 2013 2014 2015 2016 2017 2018         2009 2010 2011 2012 2013 2014 2015 2016 2017 2018

 Unit: thousand RMB                                         Unit: billion USD

According to official statistics, average annual urban wages in China increased by 156% in the period of 2009
to 2018 from 32,244 yuan ($4,569) to 82,461 yuan ($11,684). During the same period, the value of China’s fresh
fruit imports grew by more than 487% from under $1.2 billion to over $6.9 billion. The Chinese government
has facilitated this rapid growth in imports by expanding trade relationships with fruit exporting countries,
including through the establishment of free trade agreements, and steadily increasing the numbers of fresh
fruits permissible for import into China. In 2019, 13 fresh fruits from 12 countries and regions were added to
China’s official market access list [4].

 Figure 4: Top Fruit Imports by Volume 2018 [5]             Figure 5: Top Fruit Imports by Value 2018 [5]

  1,600                                                      1,400
  1,400                                                      1,200
  1,200
                                                             1,000
  1,000
    800                                                          800
    600                                                          600
    400                                                          400
    200
                                                                 200
      0
            Bananas     Dragon    Longans Durians Oranges          0
                         Fruits                                        Cherries   Durians Bananas   Grapes   Oranges

 Unit: thousand tonnes                                      Unit: million USD

By volume, most of China’s fresh fruit imports are tropical fruits from Southeast Asia such as banana, dragon
fruit, longan, and durian. While dragon fruit and longan do not rank among the top-five imports by value
individually in official statistics, their combined values in 2018 of over $762 million would rank fourth after
banana, demonstrating the dominant presence of tropical Southeast Asian fruits in China’s imported fruit

 Tropical Fresh Fruit Exporter’s Guide to China                                                                        4
market. Additionally, official trade figures for some tropical fruits may significantly understate actual import
volumes and values due to the complex nature of border trade and gray channel imports (see section 12). Fruit
quality and varieties play an important role in Chinese demand. However, Southeast Asian fruit producers
also benefit greatly from logistical proximity to China, as well as the zero-tariff regime of the ASEAN-China
Free Trade Area agreement.

Figure 6: Market Access in 2019 [6]

                   Official Market Access                               Other Fruits in Market
 Cambodia          Banana                                               Watermelon**, mango,           durian,
                                                                        jackfruit, dragon fruit
 Laos              Banana, Watermelon*                                  Mango, dragon fruit
 Vietnam           Mango, longan, banana, lychee, watermelon, rambutan, Durian, passion fruit
                   jackfruit, dragon fruit, mangosteen*
*Official market access announced in November 2019 [7]. **Market access in progress.

 Tropical Fresh Fruit Exporter’s Guide to China                                                              5
3 Banana
3.1         Overview
    Production                                                     11.2 million tonnes (2018)
    Domestic Season                                                Year-round
    Imports                                                        1.5 million tonnes; $896.8 million (2018)
    Top Suppliers                                                  Philippines, Ecuador, Vietnam, Myanmar, Thailand

3.2         Production
    Figure 7: Banana Production Volume [2]                         Figure 8: Banana Production by Province [2]1

     11.4                                                          3.5%      0.4%     0.2%    0.1%
                                                                                                     Guangdong
     11.2                                                                                            Guangxi
                                                                             11.4%
     11.0                                                                                            Yunnan
                                                                                             35.4%
     10.8                                                                                            Hainan
                                                                          15.8%
                                                                                                     Fujian
     10.6
                                                                                                     Sichuan (0.4)
     10.4
                                                                                    33.3%            Guizhou (0.2)
     10.2
                                                                                                     Chongqing (0.1)
               2014        2015       2016           2017   2018

    Unit: million tonnes                                           Year: 2017 (Volume)

China is the world’s second largest banana producer after India, with most production taking place in the
country’s southernmost provinces. In 2018, China produced 11.2 million tonnes of bananas, slightly more
than the 11.2 million tonnes produced in 2017 with a total production area of over 351,000 hectares [2]2.
Guangdong, Guangxi, Yunnan, and Hainan account for over 90% of China’s banana production, although
small quantities are also produced in Fujian, Sichuan, Guizhou, and Chongqing.

China’s average yield of 31.8 tonnes per hectare in 2017 demonstrates fairly low productivity for the Caven-
dish variety, the primary banana produced and consumed in China. Nevertheless, yields vary considerably
across regions and provinces. In Guangdong province, for example, yields ranged from 16.2 to 49.3 tonnes per
hectare across all counties in 2017 [8]. In China, banana trees are typically planted between May and Septem-
ber, then harvested between July and October the following year. Because of seasonal variation between ba-
nana producing regions, domestic bananas are available year-round, but with greater abundance in the sum-
mer months.

Although China’s banana production volume has increased modestly in recent years, those increases are
largely due to improving productivity among professional growers. Over the past five years, Chinese planta-
tion areas have been shrinking as some growers shifted production to Laos, which offers a more suitable

1   2017 most recent year with complete data
2   2018 production area not yet reported for all provinces

    Tropical Fresh Fruit Exporter’s Guide to China                                                                     6
climate as well as cheaper land and labour. However, those investments have raised both environmental and
public health concerns in Laos over the heavy use of chemical pesticides and herbicides on Chinese banana
plantations [9]. More recently, Chinese banana growers are looking toward Cambodia, which has similar
growing conditions to Laos, and can serve as another production base to supply the China market. Cambodian
bananas achieved official China market access in April 2019, and in November 2019 there were nine Cambo-
dian banana plantations approved for export to China, some of which were funded by Chinese investors [10].
Table 1: China's Banana Producing Regions
Region Season in Market
Yunnan January – May
Western Guangdong and Hainan May – August
Guangxi August – December
Eastern Guangdong and Fujian August – December
3.3 Imports
HS Code: 08039000 Other bananas, fresh or dried, excl. plantains
Figure 9: Banana Import Value [5] Figure 10: Banana Import Volume [5]
1000 1.8
1.6
800 1.4
1.2
600
1
0.8
400
0.6
200 0.4
0.2
0 0
2014 2015 2016 2017 2018 2014 2015 2016 2017 2018
Unit: million USD Unit: million tonnes
Despite being the world’s second largest producer of bananas, China is also among the largest banana import-
ing countries. In 2018, China imported over 1.5 million tonnes of bananas worth nearly $897 million from 12
countries. The Philippines is the leading supplier of bananas to China with its 2018 import volume reaching
over one million tonnes worth more than $600 million—approximately two thirds of China’s total imports
by both volume and value. Ecuador, Vietnam, Myanmar, and Thailand are also among the top-five leading
banana suppliers to China. Other noteworthy suppliers of bananas to China in 2018 included Indonesia ($9.8
million) and Costa Rica ($4.6 million). According to official statistics, Laos exported small quantities of bana-
nas to China in 2015, 2017, and 2018 with annual values of $20,000 -30,000.
Tropical Fresh Fruit Exporter’s Guide to China 7Official statistics show that only small quantities of Lao bananas were imported into China in 2015, 2017,
and 2018 with annual values of $20,000-$30,000. However, it is widely reported among industry profes-
sionals that large quantities with significantly higher values enter China through the country’s southwest-
ern land border with Laos. While this trade is not new, Lao bananas only achieved official market access in
May 2018 [11], which may explain the lack of representation in official data. According to International
Trade Centre calculations, Laos exported $183.5 million worth of plantains (HS code: 080310) to China in
2016, which are not reflected in China’s official import statistics. It is also widely known that large Chinese
investments in Lao banana production over the past several years are aimed at supplying the market in
China. While not yet reflected in official statistics, Laos is likely already among China’s top five banana
supplying countries.
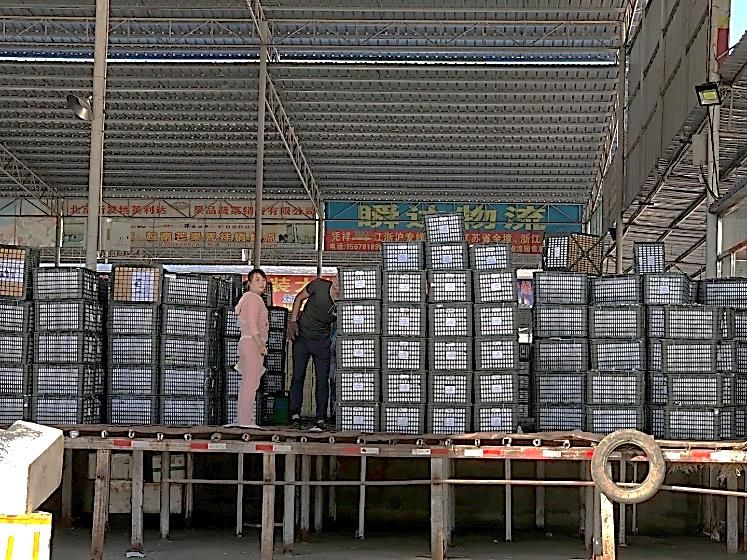
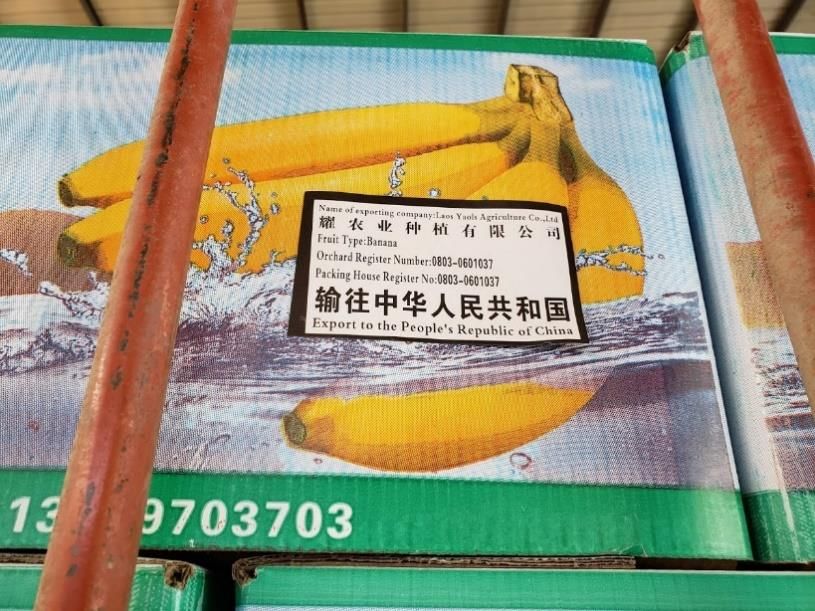
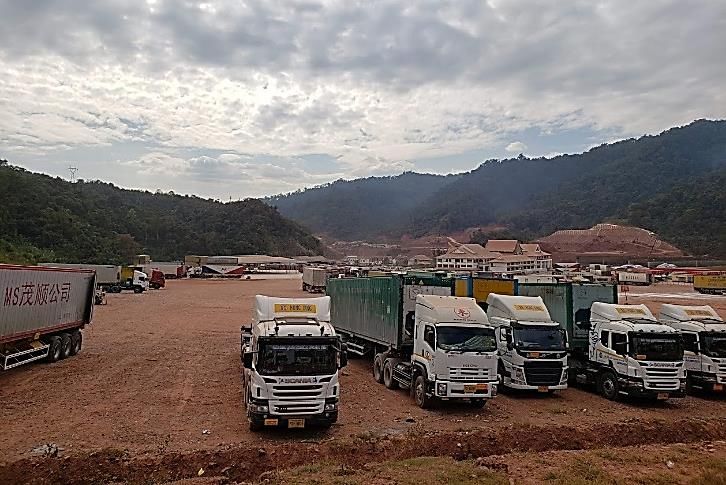
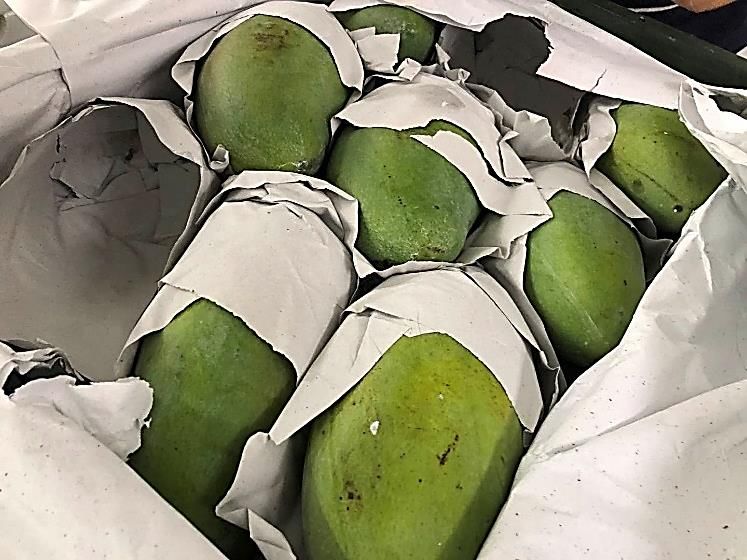
Workers transfering Lao banana shipment at a truck Lao bananas packed for shipment to China
yard in the Yunnan province border city of Mohan
Figure 11: Banana Import Value by Country [5] Figure 12: Banana Import Volume by Country [5]
700 1200
600 1000
500
2014 800 2014
400
2015 600 2015
300
2016 400 2016
200
100 2017 200 2017
0 2018 0 2018
Unit: million USD Unit: thousand tonnes
Tropical Fresh Fruit Exporter’s Guide to China 8According to official statistics, in 2018 bananas were Figure 13: Banana Imports by Province [3]
imported into 16 of China’s provinces and regions,
with five of them accounting for 93% of all banana
2.9% 3.4%
imports. Unlike the other banana importing regions, 3.4%
Shanghai
79% of Yunnan’s banana imports entered via border
7.7% Liaoning
trade with Myanmar. As explained above, this figure
Beijing
is likely to drastically understate Yunnan’s banana 46.6%
imports due to the complexity of border trade. Sim- 14.7% Yunnan*
ilarly, Guangxi imported some bananas in 2018 via Guangdong
border trade with Vietnam, however the total re- Tianjin
21.4%
ported value of those imports was only $44,365 — Others
also likely a significantly understated value. China’s
banana markets are known to experience extreme
price volatility influenced by both domestic and Year: 2018 (Volume)
Philippine supply shocks [12].
Figure 14: Average Banana Import Prices by Country [5]3 (USD/tonne)
1600
1400
1200
Thailand
1000
Ecuador
800
Philippines
600 Vietnam
400 Myanmar
200
0
2014 2015 2016 2017 2018
Over the past five years, average import prices have generally been lower for bananas from Vietnam and My-
anmar than for those from other countries. Bananas from the Philippines and Ecuador dominate retail mar-
kets in first-tier cities, and receive higher import prices due to better quality. According to industry experts,
better planting technology, soil management, orchard management, and harvesting infrastructure allow ba-
nanas from the Philippines and Ecuador to arrive in China with less damage, better appearance, and better
flavour. In particular, many plantations invested by leading banana brands have cableways to carry harvested
bananas across fields with minimal handling. In Vietnam, most bananas are harvested and carried by hand,
which causes more bruising and damage to the fruit. As a result, Vietnamese bananas are typically sold along-
side domestic fruits in China, while those from the Philippines and Ecuador are easily marketed as imported
products and receive higher prices. Since 2014, Thai bananas have consistently received import prices
3 Calculations based on aggregate data
Tropical Fresh Fruit Exporter’s Guide to China 9significantly higher than those from other countries, although import volumes are relatively low compared to the other top five suppliers. 3.4 Consumption Bananas are widely consumed across all of China’s regions and income levels. Higher income markets tend to be less price sensitive and thus consume more of imported bananas with the highest quality. Tropical Fresh Fruit Exporter’s Guide to China 10
4 Mango
4.1        Overview
    Production                                                       2.2 million tonnes (2017)
    Domestic Season                                                  February – October
    Imports                                                          11,000 tonnes; $20 million (2018)
    Top Suppliers                                                    Thailand, Taiwan China, Vietnam, Peru, Australia, the
                                                                     Philippines; Gray channel: Cambodia, Laos

4.2        Production
    Figure 15: Mango Production Volume [8]                            Figure 16: Mango Production by Province [8]4

     2.5                                                                                   0.5%
                                                                                    0.6%
                                                                                                              Guangxi
       2                                                                                9.3%
                                                                                                              Hainan
     1.5                                                                        10.8%              31.7%      Yunnan
                                                                                                              Guangdong
       1
                                                                                20.9%                         Sichuan
     0.5                                                                                                      Fujian
                                                                                               26.3%
       0                                                                                                      Guizhou
                       2014                          2017

    Unit: million tonnes                                              Year: 2017 (Volume)

In 2017, China produced nearly 2.2 million tonnes of mangoes with an area of 253,000 hectares in seven prov-
inces and regions, a 50% increase in volume and 45% increase in area compared to 2014. China’s average
mango yield was 8.5 tonnes per hectare in 2017, while yields across counties in Hainan province ranged from
6.3 to 14.1 tonnes per hectare. Hainan mangoes enter domestic markets in February and are mainly available
from April to August. Guangxi, Guangdong and Yunnan mangoes largely enter domestic markets from June
to September. Sichuan mangoes are mostly mid-maturing and late-maturing varieties that enter market from
July to October.

Table 2: China's Mango Producing Regions

    Region                                                  Season in Market
    Hainan                                                  February – August
    Guangxi, Guangdong, Yunnan                              June – September
    Sichuan                                                 July – October

4   2017 most recent year with complete data

    Tropical Fresh Fruit Exporter’s Guide to China                                                                        11
4.3 Imports
HS Code: 08045020 Mangoes, fresh or dried
Figure 17: Mango Import Value [5] Figure 18: Mango Import Volume [5]
21 12
20 10
19 8
18 6
17 4
16 2
15 0
2014 2015 2016 2017 2018 2014 2015 2016 2017 2018
Unit: million USD Unit: thousand tonnes
In 2018, China imported nearly 11,000 tonnes of mangoes worth over $20 million from nine countries and
regions, representing a 113% increase in volume but only an 8.1% increase in value compared to 2017. These
increases were primarily driven by Thailand and Vietnam, the volumes of whose mango exports to China
grew by 492% and 816%, respectively.
Figure 19: Mango Import Value by Country/Re- Figure 20: Mango Import Volume by Coun-
gion [5] try/Region [5]
10 6
9
8 5
7 4
6 2014 2014
5 3
4 2015 2015
3 2
2016 2016
2 1
1 2017 2017
0 0
2018 2018
Unit: million USD Unit: thousand tonnes
In addition to the leading suppliers, multiple other countries have exported small quantities of mangoes to
China in recent years. Most notable among these countries are Ecuador and Pakistan, from which China im-
ported 11.1 and 9.2 tonnes of mangoes in 2018, respectively. India also exported 1.8 tonnes of mangoes to
China in 2018.
Tropical Fresh Fruit Exporter’s Guide to China 12According to official statistics, mangoes were im-
ported into 16 of China’s provinces and regions in Figure 21: Mango Imports by Province [3]
2018 with Fujian, Yunnan, and Guangdong account-
ing for 93% percent of imports by volume. Thai man-
3% 4%
goes enter China primarily through Yunnan prov-
ince, while Vietnamese and Taiwanese mangoes are
Fujian
reported to enter China primarily via Fujian. Man- 16%
Yunnan
goes from the Philippines, Australia, Peru, and other 44%
countries primarily enter China via Guangdong, alt- Guangdong
hough small quantities are also imported into Shang- Shanghai
hai, Shandong, Beijing, and other regions. 33% Others
However, contrary to official statistics, industry ex-
perts have reported that as much as 90% of mango
imports from Vietnam enter via border trade that is
Year: 2018 (Volume)
not accounted for in China Customs figures [13].
Figure 22: Average Mango Import Prices [5]5 (USD/tonne)
14,000
12,000
10,000 Philippines
Australia
8,000
Peru
6,000 Taiwan
4,000 Thailand
2,000 Vietnam
0
2014 2015 2016 2017 2018
Over the past five years, mangoes from the Philippine have received average import prices significantly
higher than those from other countries—in 2018, their average value was $8,995 per tonne, more than double
the average price of Australian mangoes, those with the next highest value. Thai mangoes saw a dramatic
drop in import prices from $4,438 in 2017 down to just $1,238 in 2018. Since 2015, average import prices for
Vietnamese mangoes have remained only a fraction of those received by other top suppliers at just $423 per
tonne in 2018.
5 Calculations based on aggregate data
Tropical Fresh Fruit Exporter’s Guide to China 13Vietnamese mangoes are often packed with little or no Many Chinese domestic mangoes arrive in wholesale protection from damage and require sorting and re- markets already sorted and packed to prevent dam- packing by traders in Chinese wholesale markets. Due to age. overall lower quality, they are frequently sold as inex- pensive domestic fruits in China. 4.4 Consumption Mangoes are consumed throughout China, although consumption is the highest in the southern regions and in first- and second-tier cities. In addition to being consumed fresh, a relatively large portion of China’s do- mestic mangoes are processed into juice, preserved mango, and other products. Some of China’s most active mango producing regions have been marketing their products with geographic branding such as Sanya (the capital of Hainan province) which is a local variety of yellow mango, and Panzhihua from Sichuan province which is the larger red-blushed Kent variety. Most Vietnamese mango imports are of the green varieties, alt- hough many other varieties are also imported. Mangoes from the Philippines are generally regarded as the sweetest and highest quality among all imports. Tropical Fresh Fruit Exporter’s Guide to China 14
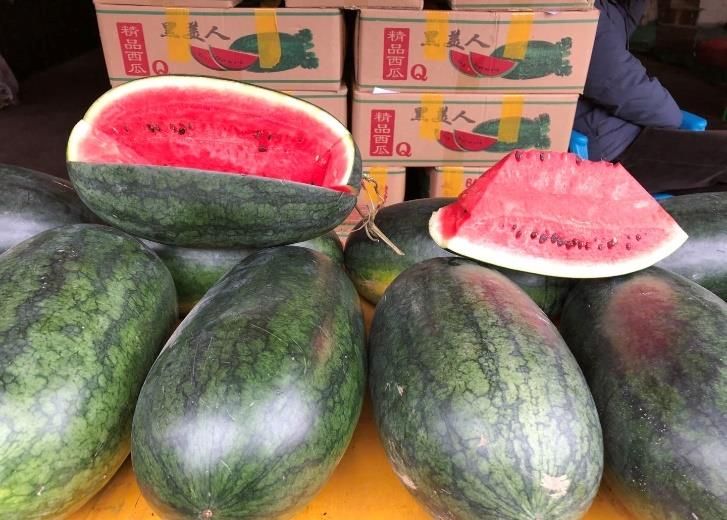
5 Watermelon
5.1         Overview
    Production                                              63 million tonnes (2017)
    Domestic Season                                         July – November
    Imports                                                 219.9 thousand tonnes; $43.7 million (2018)
    Suppliers                                               Vietnam, Myanmar, Laos; Gray channel: Cambodia

5.2         Production
    Figure 23: Watermelon Production Volume [2]             Figure 24: Watermelon Produc. by Province [8]6

     63.5

       63                                                                                         Henan

     62.5                                                                         21.6%           Shandong

       62                                                           44.8%                         Anhui

     61.5
                                                                                        14.8%     Jiangsu

       61                                                                                         Hebei

     60.5                                                                                         Others
                                                                                         7.6%
                 2014          2015           2016   2017                   5.5% 5.6%

    Unit: million tonnes                                    Year: 2016 (Volume)

China produces more watermelons than any other fruit. In 2017, China produced over 63 million tonnes of
watermelons—a volume more than double the amount produced by the entire rest of the world combined.
By contrast, the world’s second largest watermelon producer, Iran, produced 4.1 million tonnes, an amount
equivalent to only 5% of China’s production volume [1]. Every province and region in China produces water-
melons, although Henan and Shandong lead by a considerable margin. Overall, China’s average watermelon
yield is 42 tonnes per hectare, while average yields range from 24 to 59 tonnes per hectare across all provinces
and regions, with Henan achieving the highest average yield.

Domestically produced watermelons are mostly available from July to November. China’s early watermelon
varieties are typically planted in mid-March and enter domestic markets in mid-July, while late varieties are
planted in mid-to-late April to reach markets from late July to early August. Open field cultivation of water-
melons occurs in late June to mid-July and reaches markets in September to October. Greenhouse cultivation
occurs in late July to early August and the harvests reach domestic markets in October. Additionally, small
quantities of greenhouse and Hainan watermelons are often available in winter and spring.

6   2016 most recent year with complete data

    Tropical Fresh Fruit Exporter’s Guide to China                                                           15
5.3 Imports
HS Code: 08071100 Watermelons, fresh
Figure 25: Watermelon Import Value [5] Figure 26: Watermelon Import Volume [5]
50 220
40 210
30 200
20 190
10 180
0 170
2014 2015 2016 2017 2018 2014 2015 2016 2017 2018
Unit: million USD Unit: thousand tonnes
In 2018, China recorded imports of 220,000 tons of watermelons worth $43.7 million dollars. According to
official figures, over the past five years more than 98% of China’s watermelon imports have come from Vi-
etnam, with the remaining small quantities primarily coming from Myanmar, and even smaller quantities
coming from Malaysia. Official statistics also show 100% of Vietnamese watermelons enter China via border
trade with Guangxi, while imports from Myanmar were valued at just $354,000 in 20187 and all entered via
border trade with Yunnan province. However, industry experts have reported that China’s watermelon im-
ports may be significantly higher than reported as many shipments enter via border-citizen trade that is not
accounted for in official figures (see section 11), and Myanmar is likely to be the largest watermelon supplier
to China.
Average prices of watermelons imported from Vietnam in 2018 were $199 per tonne, considerably more than
Myanmar’s $127 per tonne, although less than Malaysia’s $398 per tonne8. Imported watermelons from Vi-
etnam and Myanmar help to supply the market in the winter when domestic watermelons are least available.
5.4 Consumption
Watermelon is consumed across all regions and income groups in China. It is relatively affordable compared
to other popular fruits, and is commonly served in restaurants, bars, karaoke venues, hotels, and tea rooms.
It is also frequently used as an ingredient in fresh-made juice and tea beverages. According to the production
and import figures, China had a per capita watermelon consumption of over 55 kilograms in 2018.
7 Actual volumes and values may be understated due to border trade
8 Calculations based on aggregate data
Tropical Fresh Fruit Exporter’s Guide to China 16Vietnamese watermelons at the fresh fruit wholesale Vietnamese watermaelons packed for China with
market in Kunming, the capital of Yunnan province sticker showing production location, packing house,
and exporter details
Tropical Fresh Fruit Exporter’s Guide to China 176 Longan
6.1 Overview
Production 1.9 million tonnes (2016)
Domestic Season July – October
Imports 457,000 tonnes; $365.6 million (2018)
Suppliers Vietnam, Thailand
6.2 Production
Figure 27: Longan Production Volume [8] Figure 28: Longan Production by Province [8]9
1.95 2.2% 1.9% 0.7%
2.8%
1.9 Guangdong
Guangxi
1.85
16.0% Fujian
1.8 45.2%
Hainan
1.75 Sichuan
31.2% Chongqing
1.7
Yunnan
1.65
2014 2015 2016
Unit: million tonnes Year: 2016 (Volume)
In 2016, China produced over 1.9 million tonnes of longans with an area of 310,000 hectares, representing
slow but steady increases in both volume and production area over the previous two years. Guangdong,
Guangxi, and Fujian accounted for over 92% of China’s longan production in 2016, with 2017 showing similar
figures, although data are not yet reported for all other longan producing regions. China’s average longan
yield is 6.2 tonnes per hectare, while yields across counties in Guangdong province ranged from 2.4 to 12.1
tonnes per hectare. Longan trees are usually planted in the spring and autumn and require three to four years
to begin bearing fruit. China’s longans are harvested and available in domestic markets from July through
October.
9 2016 most recent year with complete data
Tropical Fresh Fruit Exporter’s Guide to China 186.3 Imports
HS Code: 08109030 Longan, fresh
Figure 29: Longan Import Value by Country [5] Figure 30: Longan Import Volume by Country [5]
500 600
400 500
400 186
300 249 131
178 300 104
227 209 145
200 132 155
200 343 326
100 189 188 100 209 253
102 133 143 171
0 0
2014 2015 2016 2017 2018 2014 2015 2016 2017 2018
Vietnam Thailand Vietnam Thailand
Unit: million USD Unit: thousand tonnes
Official figures from 2018 show, China imported nearly 457,000 tonnes of longans worth over $365.6 million,
a slight decrease from 2017, but still representing modest increases over the previous three years. Over the
past five years, Vietnam and Thailand have been the only countries to export longans to China, except for
Laos which exported 115 tonnes of longans to China in 2017. Thai and Vietnamese longans enter China
through different channels and receive dramatically different import prices.
Figure 31: Thai Longan Imports by Province [3] Figure 32: Vietnamese Lonagn Imports by Prov-
ince [3]
2.0% 2.1% 1.8% 1.7%
Guangdong 2.3% 0.7%
2.7% Yunnan
7.0% Chongqing
Guangxi Guangxi
49.2%
14.3% Hunan Guangdong
Liaoning Others
Shandong
19.3% 97.0%
Shanghai
Others
Year: 2018 (Volume) Year: 2018 (Volume)
According to China Customs statistics, Thai longans are imported by 13 of China’s provinces and regions,
although nearly half enter through Guangdong. Vietnamese longans are imported by six provinces and re-
gions with 97% of those imports entering via border trade with Guangxi. Over the past five years, prices stayed
stable but Thai longans have received more than double the import prices of Vietnamese longans.
Tropical Fresh Fruit Exporter’s Guide to China 19Figure 33: Average Longan Import Prices 10 (USD/tonne)
1600
1400
1200
1000
800 Thailand
600 Vietnam
400
200
0
2014 2015 2016 2017 2018
6.4 Consumption
According to industry experts, longans are primarily consumed fresh, with less than 30% used for further
processing [8]. Longan consumption is reportedly greater in China’s southern regions where consumers have
better understanding of the fruit’s quality and freshness characteristics such as color, texture, flavor, and ripe-
ness.
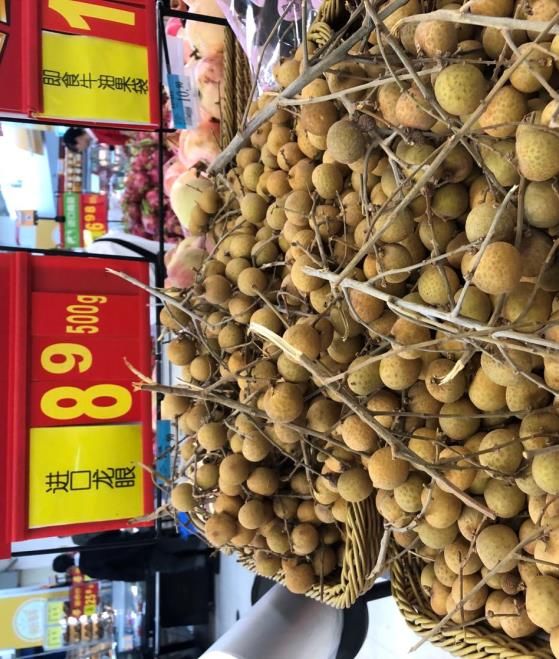
Longans at the Nanning wholesale fruit market. In- Longans for sale in a Walmart in Nanjing are de-
dustry experts report that phytosanitary rules require scribed as imported without naming the country of
all stems and leaves to be removed, and the longans origin.
should not be attached to any stems or branches—re-
quirements that Thai exporters tend to follow more
strictly than those from Vietnam.
10 Calculations based on aggregate data
Tropical Fresh Fruit Exporter’s Guide to China 207 Lychee
7.1 Overview
Production 2.3 million tonnes (2016)
Domestic Season Mid-May to mid-August
Imports 32,500 tonnes; $17.3 million (2018)
Suppliers Vietnam, Thailand
7.2 Production
Figure 34: Lychee Production Volume [8] Figure 35: Lychee Production by Province [8]11
2.32 1.2% 0.8% 0.1%
6.7%
2.31 Guangdong
2.3
Guangxi
2.29 7.9%
2.28 Fujian
2.27 Hainan
2.26 29.1% 54.3%
Yunnan
2.25
Sichuan
2.24
2.23 Other
2014 2015 2016
Unit: million tonnes Year: 2016 (Volume)
China has a long history of lychee production and remains a major grower of the fruit. Between 2014 and
2016, China’s lychee production remained steady at around 2.3 million tonnes with a growing area of approx-
imately 540,000 hectares. Guangdong province accounts for over half of China’s lychee production volume,
with yields ranging from 1.6 to 13.6 tonnes per hectare across the province’s lychee growing counties in 2017.
In 2016, China’s overall lychee yields averaged of 4.2 tonnes per hectare. Lychee trees can be planted in the
spring, summer, and autumn. A new lychee tree requires two to three years to produce fruit, and five to six
years to reach full fruit production. Domestic lychees are harvested and available in China’s markets from
mid-May to mid-August, although June through July is the main season.
7.3 Imports
HS Code: 08109010 Lychee, fresh
In 2018, China imported 32,500 tonnes of lychees worth $17.3 million. Those from Vietnam accounted for 97%
of imports by volume and 93% by value, with the remainder of imports coming from Thailand. Although
imports from Thailand have been far lower than from Vietnam over the past five years, the two countries
achieved similar import values in 2014 and 2017, as Thai lychees receive more than double the import price
of those from Vietnam. In 2018, over 93% of lychee imports entered China via border trade between Vietnam
11 2016 most recent year with complete data
Tropical Fresh Fruit Exporter’s Guide to China 21and Guangxi—an amount that is likely understated due to border citizen trade that is not accounted for by
China Customs. The remaining 7% was imported into Yunnan, Hainan, and Guangdong provinces. Vietnam-
ese lychees are reported to generally be of lower quality than domestically produced lychees. They are usually
traded along with domestic fruits in wholesale markets and help to fill seasonal gaps.
Figure 36: Lychee Import Value by Country [5] Figure 37: Lychee Import Volume by Country [5]
35 80
30
25 60
20
40
15
10 20
5
0 0
2014 2015 2016 2017 2018 2014 2015 2016 2017 2018
Viet Nam Thailand Viet Nam Thailand
Unit: million USD Unit: thousand tonnes
Figure 38: Average Lychee Import Prices [3]12 (USD/tonne)
1600
1400
1200
1000
800 Thailand
600 Vietnam
400
200
0
2014 2015 2016 2017 2018
7.4 Consumption
According to industry experts, approximately 80% of lychees are consumed as fresh fruit, while 20% are used
as raw material for further processing [8]. Due to the fresh fruit’s high value, as well as high costs of storage
and transportation, at least half of all lychees in China are consumed near the main producing areas in the
south, while the remainder is distributed to major urban areas throughout the country.
12 Calculations based on aggregate data
Tropical Fresh Fruit Exporter’s Guide to China 228 Dragon Fruit
8.1 Overview
Production 700,000 tonnes (2018)
Domestic Season May – November
Imports 511,000 tonnes; $397 million (2018)
Suppliers Vietnam; Gray channel: Laos, Cambodia
8.2 Production
In 2018, China was estimated to have produced approximately 700,000 tonnes of dragon fruits with a growing
area of approximately 40,000 hectares [14] [15] [16]. Among dragon fruit producing provinces and regions,
Guangxi has the largest growing area of approximately 13,000 hectares, followed by Guangdong with 10,000
hectares, and Hainan and Guizhou, each with approximately 6,600 hectares. Domestic dragon fruit produc-
tion has increased rapidly in the past decade, while further expansion in 2020 is expected to continue and put
downward pressure on market prices. Domestic dragon fruits are mainly available from May to December
with production peaking around July and are mostly of the red fleshed variety which generally has a less
premium appearance than imported dragon fruits.
8.3 Imports
HS Code: 08109080 Dragon fruit, fresh
Figure 39: Dragon Fruit Import Value [5] Figure 40: Dragon Fruit Import Volume [5]
700 900
600 800
700
500
600
400 500
300 400
300
200
200
100 100
0 0
2014 2015 2016 2017 2018 2014 2015 2016 2017 2018
Unit: million USD Unit: thousand tonnes
Tropical Fresh Fruit Exporter’s Guide to China 23Official figures show China’s dragon fruit imports Figure 41: Dragon Fruit Imports by Province [3]
have remained steady over the past three years at
over 500,000 tonnes worth nearly $400 million. Over Guangdong
2%
the past five years, more than 99.9% of China’s im- 5% 2%
5% Shanghai
ported dragon fruits have come from Vietnam. In
25% Guangxi
2018, imports from Taiwan China were valued at 7%
Beijing
$220,000, while small quantities were also imported
from Philippines, Malaysia, and Thailand in 2014 12% Fujian
and 2015. Liaoning
20%
Shandong
Vietnamese dragon fruits are imported into 14 prov- 22%
Tianjin
inces and regions. Those arriving in Guangdong,
Others
Shanghai, and Beijing had average values of $817,
$890, and $868 per tonne13, respectively, considera- Year: 2018 (Volume)
bly higher values than those received by other major
entry regions. Nearly 20% of all Vietnamese dragon fruits entered China via border trade with Guangxi at an
average value of $630 per tonne — the lowest value among all importing provinces and regions. However,
actual import volumes may be significantly higher than those reported in official figures, as border citizen
trade is not accounted for in China Customs statistics.
8.4 Consumption
Dragon fruits are primarily consumed fresh in China’s southern regions, as well as in first- and second-tier
cities. According to industry experts, consumer preferences have shifted in recent years from white-fleshed
dragon fruits to the red-fleshed varieties. Compared to domestic dragon fruits, Vietnamese dragon fruits typ-
ically have a better appearance and longer shelf life.
Vietnamese trucks carrying containers of dragon fruit Boxes of Vietnamese dragon fruit are reloaded and
are unloaded at the Pingxiang border in Guangxi and packed floor-to-ceiling in Chinese trucks for domestic
loaded onto smaller trucks for border crossing under shipment.
the border citizen trade regime.
13 Calculations based on aggregate data
Tropical Fresh Fruit Exporter’s Guide to China 249 Durian
9.1 Overview
Production Experimental; no commercial production
Domestic Season NA
Imports 432,000 tonnes; $1.1 billion (2018)
Suppliers Thailand; Gray channel: Vietnam
9.2 Production
China does not currently have any commercial durian production. However, due to the fruit’s popularity and
high value, farmers in China’s southernmost province Hainan have been experimenting and experiencing
some initial success with trial plantations. The Hainan Academy of Agricultural Sciences has established a
durian plantation demonstration area, while local agricultural officials are reportedly urging farmers to wait
until more research has been done before planting durian seedlings commercially [17]. As durian trees require
four to five years to bear fruit, and longer to reach commercial levels of fruit production, Chinese domestic
durians are not expected to play a significant role in the domestic market within the next several years.
9.3 Imports
HS Code: 08106000 Durian, fresh
Figure 42: Durian Import Value [5] Figure 43: Durian Import Volume [5]
1200 500
1000 400
800
300
600
200
400
200 100
0 0
2014 2015 2016 2017 2018 2014 2015 2016 2017 2018
Unit: million USD Unit: thousand tonnes
According to official statistics, 100% of China’s durian imports come from Thailand, the volume and value of
which nearly doubled in 2018 compared to 2017. In 2018, imports of Thai durians reached 432,000 tonnes
worth nearly $1.1billion. This makes durian China’s second most valuable fruit import after cherries. How-
ever, it is well known among industry professionals that Vietnamese durians have played a significant role in
the market in recent years. Vietnamese durians previously filled the seasonal winter gap when Thai durian
imports were lower. By adding competition to the market, they also helped to offset Thai durian prices. But
in 2019, China was increasingly cracking down on illegal Vietnamese durian imports, while the two countries
engaged in official market access negotiations. During the period of this research, Vietnamese durians were
Tropical Fresh Fruit Exporter’s Guide to China 25unavailable in major wholesale fruit markets around China, but could still be found in some wholesale mar-
kets near the border.
In 2018, 15 provinces and regions imported Thai du- Figure 44: Durian Import Volume by Province [3]
rians, however 96% of durians were imported by just
three provinces and regions: Guangdong, Guangxi, 1% 1%
2%
and Yunnan. Although Vietnamese durians are not
7%
represented in official statistics, they are known to Guangdong
primarily enter China via border trade with Guangxi. Guangxi
Average import prices for Thai durians have in- 48% Yunnan
creased by 35% over the past five years from $1,878 Hunan
per tonne in 2014 to $2,535 per tonne in 2018. 41% Hainan
In 2019, whole frozen durians from Malaysia gained Others
China market access. Previously, only the frozen du-
rian pulp had been permitted for import and was
used as an ingredient in a wide range of durian-fla- Year: 2018 (Volume)
vored food products. However, the whole frozen du-
rians are reported to be of high quality and optimal ripeness, and can be consumed directly in the off season
when fresh durians from Thailand are unavailable [18] [19].
9.4 Consumption
As China’s second most imported fruit by value after cherries, durian has become one of China’s favorite
imported fruits, with e-commerce playing an important role in its rising popularity. In the spring of 2018,
China’s e-commerce giant, Alibaba Group, signed an agreement with the government of Thailand to purchase
$473.6 million worth of Thai durian over a three-year period. To celebrate the agreement, a promotion on
Alibaba’s Tmall platform saw 80,000 Thai durians sold in less than one minute [20]. Shortly after, China’s other
leading e-commerce platform JD.com signed a purchase order of six million Thai durians, while another e-
commerce player, Suning, sold 200 tonnes of Thai durian in just two days [21]. In 2019, durian remained a
popular fruit and the target of many consumer promotions in both online and offline retail.
Tropical Fresh Fruit Exporter’s Guide to China 2610 Jackfruit 10.1 Overview Production 10,000+ hectares (estimated) (2018) Domestic Season June – October Imports Official figures not available, no HS code Suppliers Thailand, Vietnam 10.2 Production Although official national-level production figures are not available, China’s total jackfruit production area is estimated at a minimum of 10,000 hectares. At least 6,000 hectares of growing area is located in Hainan, while other relatively small growing areas are dispersed throughout Guangdong, Guangxi, Yunnan, Sichuan, and Fujian. Most domestic production is of the yellow fleshed varieties [22] [23] and is available in domestic markets from June to October. 10.3 Imports Although official figures for jackfruit imports are not reported by China Customs, industry experts say im- ports have been increasing rapidly in recent years in response to the growing popularity of the fruit. The Jiaxing Haiguangxing Wholesale Fruit Market in Zhejiang province near Shanghai reported a jackfruit trading volume in 2016 of only 2,349 tonnes. But in 2017, the figure had increased more than 10-fold to nearly 30,000 tonnes, and reached almost 40,000 tonnes in 2018. From September 2018 to September 2019, the market re- ports to have traded 55,000 tonnes of jackfruit. Due to the rapid growth in imports, the market established a specialized jackfruit trading area, the largest of its kind in China [24]. During a visit to the market, approxi- mately one out of 40 containers of jackfruit was reported to be domestically grown, while those from Vietnam and Thailand were far more abundant and of superior quality. Most imported jackfruits from both Thailand and Vietnam enter China over land via border trade at the Guangxi-Vietnam border. According to data from the Thai Consulate-General in Shanghai, Thai jackfruit is available year-round but production peaks in April and May. In 2018, Thailand exported nearly 40,000 tonnes of jackfruit to China worth approximately $15 million, accounting for 47% of Thai jackfruit exports by vol- ume and 56% by value. However, industry experts say that Vietnamese jackfruits are more popular and ac- count for a higher total import volume than those from Thailand. Imported Vietnamese jackfruits are mostly of the red fleshed varieties, which are considered to have better flavor than the yellow fleshed varieties from Thailand. 10.4 Consumption Due to the fruit’s relatively recent rise in popularity, most jackfruit in China is consumed fresh, as few Chinese companies have the ability to process jackfruit at scale given the fruit’s unique structure. Tropical Fresh Fruit Exporter’s Guide to China 27
Workers unloading a jackfruit shipment at the Jiaxing      Jackfruit peeling and packing workshop at the Jiaxing
Haiguangxing Wholesale Fruit Market. The Jiaxing           market. In addition to such workshops, some retailers
market has become a leading distribution center for        prefer to peel and pack the fruit on site in order to at-
jackfruit as labor costs in the area are relatively low,   tract customers and demonstrate freshness.
allowing traders to efficiently peel and pack the fruit
for sale to retailers.

Tropical Fresh Fruit Exporter’s Guide to China                                                                   28
11 Logistics
11.1 Overview
Since the establishment of the ASEAN-China Free Trade Area (ACFTA) in 2002, trade between China and
ASEAN-member countries has grown rapidly. From 2002 to 2018, China’s imports from ASEAN-members
under the 08 HS code category (edible fruit and nuts; peel of citrus fruit or melons) increased more than 16-
fold from just over $216 million to nearly $3.8 billion [5]. Sea freight to China’s largest eastern ports remains
the most common shipping method for fresh fruit exporters. However, China’s southern and southwestern
land borders with Vietnam, Laos, and Myanmar are also entry points for large volumes of fruits from those
countries, as well as from other ASEAN-member countries. While shipments from ASEAN-member countries
enter China tariff-free, they are still subject to VAT or other taxes depending on the port of entry and import
regime.

11.2 Sea Freight
Sea freight is relatively inexpensive compared to other forms of transportation, and generally enters China
through ports nearest to the largest wholesale and consumer markets for fresh fruits. Shenzhen, Shanghai,
and Tianjin are among the most common entry points for fresh fruit shipments arriving by sea due to the
large numbers of leading importers and distributors operating in nearby wholesale markets. From these mar-
kets, products can quickly be sold and distributed locally, regionally, and nationally. The primary disad-
vantage of sea freight is the transportation time, which can be considerably longer than land transport. Ad-
ditionally, fruit shipments from Southeast Asia arriving in China by sea are subject to a 9% VAT by China
Customs14, a higher rate than is applied to some shipments arriving over land (see next section).

11.3 Guangxi Border Trade
Modern cross-border trade between Vietnam and China’s Guangxi region first developed in the early 1980s
but became more active as the relationship between Vietnam and China normalized in the 1990s, and con-
tinued to grow rapidly following the establishment of the ACFTA in the early 2000s. Guangxi has an especially
advantageous geographic position for cross-border trade with ASEAN-member countries: it has a long land
border with Vietnam extending 1,020 kilometers, 12 ports of entry including both sea and land ports, as well
as 26 cooperative centers for border residents to conduct transactions with their Vietnamese counterparts.
Additionally, highway networks running through Vietnam and towards the Chinese border allow shipments
from Vietnam, Laos, Cambodia, and Thailand to reach Guangxi land ports much faster than by sea freight.

Four Guangxi land ports have been specifically designated for the import of fresh fruits: Pingxiang, Longbang,
Dongxing, and Shuikou. Additionally, fresh fruits are permitted to be imported via the sea ports of Fang-
chenggang and Qinzhou Free Trade Zone, as well as via the airport of Guilin. The Pingxiang port is the most
significant port in Guangxi for fresh fruit shipments and includes four entry points under its jurisdiction:

14   Refers to ordinary trade—not transshipments, customs warehousing, or other trade regimes.

 Tropical Fresh Fruit Exporter’s Guide to China                                                              29
Table 3: Pingxiang Port Entry Points for Fresh Fruits

 Pingxiang Railway                                                 Ordinary trade (very small volume)
 Youyiguan                                                         Ordinary trade
 Puzhai                                                            Small-volume border trade; border resident trade
 Nongyao                                                           Border resident trade

While some other Guangxi border ports only have permission to import Vietnamese fruits, the Pingxiang
port entry points are permitted to import nearly all fruits from ASEAN-member countries that have achieved
official market access, making it one of China’s most significant entry ports for ASEAN-member fresh fruit
shipments. Shipments entering China via these points are typically imported under one of the following three
regimes:

Table 4: Common Land Port Import Regimes

 Ordinary Trade                                   Small Volume Border Trade          Border Resident Trade
 Shipments imported by regis-                     Shipments imported by officially   Chinese citizens living near the
 tered Chinese importers. Fresh                   registered companies in the bor-   country’s border may import
 fruits are subject to the same 9%                der area. Subject to VAT of 3%.    products worth up to 8,000 yuan
 VAT as those entering China via                                                     ($1,139) daily VAT-free. A cus-
 sea ports as ordinary trade ship-                                                   toms clearance fee of 7,500 to
 ments.                                                                              12,000 yuan ($1,068 to $1,709) per
                                                                                     container is collected by the local
                                                                                     government rather than by China
                                                                                     Customs.

Ordinary trade is the most common trade regime for
imports at all China ports, but shipping times are of-
ten faster and overall costs may be lower for ship-
ments using land transport and entering under bor-
der trade regimes. Additionally, the cold chain is
more likely to be broken for shipments entering
China via border-resident trade, potentially putting
downward pressure on prices for fruits imported
under that regime.

                                                                  Border residents wait in line to scan their fingerprints
                                                                  and register their trades

 Tropical Fresh Fruit Exporter’s Guide to China                                                                        30
You can also read