CITY OF FREDERICKSBURG - MARKET REPORT PREPARED DECEMER 2018 - Fredericksburg, VA
←
→
Page content transcription
If your browser does not render page correctly, please read the page content below
CITY OF FREDERICKSBURG
MARKET REPORT
PREPARED DECEMER 2018
The City of Fredericksburg, adjacent to the Rappahannock River, is a historic city in Virginia
between the Washington, D.C. metropolitan area and Richmond. Fredericksburg’s established
amenities, it’s historic downtown, rail service, the University of Mary Washington, and Mary
Washington Hospital, are shared by the many people that live, work, and visit.

Cover photo courtesy McBorrough Creative Agency.
Photo courtesy Virginia Economic Development & Tourism.
The purpose of this document is to provide market information as it relates to each
of the land uses addressed in this study and to inform the ongoing work effort of the
Comprehensive Plan, as well as to act as a resource that aids the City Council’s 2036 Vision,
and the Economic Development and Tourism Strategic Plan.

                                                                                                3
CITY OF
FREDERICKSBURG
VIRGINIA Printed December, 2016
I 95
Map Of
I 95
Small Area Plan Boundaries
BAKE
RSFIE
2
RIVERSID
LD LN E DR
CH
ST
AR
WICKLO
LE
T
ROFFMAN RD
SS
E
E
ST
AV
AR
T
ES
WES
AM
ON
RB
ST
DUNES ST
W DR
FO
RD
ST
NS
ST
TON
6
VIL ER
HA
O
ST VLG
CE
BR
AT
DF
FORE LIN LA ST
LA
AG
GE W
O
LN
DE GE SS
AL
O
NO LN RE ST
G
N ID
W
W
CT
HIL
RM AV R G IA
LE B O
Y
AN E AN
PR
L
P
HW
MA
HERITAGE PARK
RM
D
DY
R
HOSP
ITALIT AV GE ST
IS
PA
Y LN E ST R
AV
TE
R
M
K
L
ND
E N
HI
FA HU
LL
SO
DR LL
1
DR
CH
AL L H
FER
BE TA ILL
AR
RT I
SP AV
JEF
DR CU
LE
N R ST
O EN HO E
SS
ST
JULIAS PL
TU B JA N RD
CK LE W
MIS OL L FO
T
VD
MAHONE ST
PL DS R HIL ST
BL
AH AY DR D R E T
AV
4
US AM NS
RT
KE
Y
BR O M LH DO
RR
IA
IS
I E D N
SC D
CA BU IN PE RN
EST
PE
O R G
ST HE
VIR T
M
T
E LS
A JILLS PL
T
C
SA
LN L R ST NA ST
EA
PRESERVE LN P UA Y CA T
ISS UR PIT
H
ST
RT
HK ST
PR
EA MA
CH
AL
ON
O
GL
TC
IN
D
EV DIS
VE
AR
HO ILL MA
CE
Y
AG
ST
LES
ED
DR
SS
R L L
BA
AN
ST
RIVER RD RY 7B
ST MA
NE
FRA
T PL
BELMON N
CA
COWAN BLVD
DE ST
ST
KE
NK
OW IER
RL
QU
N
VIDALIA SN
LIN
ST FAU
D
MO
MA ST
SIL
AN T
N IS S
ST
RE
T
VE
OR
HA LEW ST
CO
D
RP
7C
AV
R W
PO ELIA
LLE
E
SU
KW
DO
AM
SO
NK
ST
GE
CA
Y
UG
ELL
PH
7A
EN
RN
AV
RO
LA
AU
CO
IA
E
RD
S
E
LIN
RE AV
GU
ST
PR
ST
7
T
TA ES ER
E
IN
TIM
ST
IL W
ST
RO R E
AV
CE
MO
IN
D T
R NIA ES
EA
T
STA
E
T VA TT
ES
DW
SYL
TR
ES LO
VE
T
GENTHER
IDG MS AR
FFO
AD
G
LN CH
AR
CENTURY OAK DR LIA T ST
OR
NS
E
DR IL
LFE
RD
N
ST
CO
DS
W
RD
DA TO
GE
MP WO
RA
PLA
RD T
AV
LO
T
TS BRO
D
PPA
K N
E
NY
WOODLAN
E
ST
N
AN
LIT
BR
LEE
HA
KT
PL
DR
SIL
YS
RD
5 T
VE
TO ST JAC
KS
T
HA
ST
AV
LEP
N
OI
WE
R
HA
N KS
OOD
CE
5S
NO
ST TO RIC
MO
E
ON DE
OOD
YS
AG
I9
LE
ED
95 N
N
RO FRE T
MA
CK
ST ST HS
Y
N
TR
ERCE
E
ON
BET
WESTW
ST
CU
COMM
HO
ST
N
AV
RAMSEU YL
AL
OAKW
A
MA
RD
SUNK
ELIZ
R
R ST CK
ST
NE
E
ES
SS
PAR
PLANK RD SH RO
RK
CE
ST
ST
T
E PH
MALL CT
OVER IN
7E
ET
PR
KB
HIG
EN
HAN 7D
DR
PLA
ARMO
E CIR
ER
WIL
ST
LVD
HIGHLA
H
RD
DS
ND
ALTOONA
NK
RD
ST
RD
DU
LIS
K
T
COBBLESTON
BEVERLY
RY D
TO
AN
ST
N
DR
PL
MO
I95
R GREENBRI
TO APAC GREENWAY
Legend
RE ST
N HE TE ST
SR
5 RR DR
I9 LOW
3
LUD
D
HU BEVERL
N Y LN
T
LN
DO
ER DR
W
SENECA TERR
DIXON
1. Celebrate Virginia/Central Park
NM
PAWNEE DR
AN
AY PKWY
BLUE GR
ST
PL
RD
BLVD
G
2. Fall Hill ST
MYRICK ST
8
FA R IN SUMMIT
R RIS SP PALMER ST
EWAY
H UM
CENTRAL
DR AL
EVE
GAT
WHITE ST
INNIS DR
3. Plank Road/Route 3 SA RA
MP
LY
VO AR
LN
NC
IDLEWILD BLVD Y TD GLOVER ST
RAILROAD AVE
LEE DR
RD
PL R
KE
SPR ST
9
T
BRIGADIER DR
BELMAN RD
VD R
HO
IN
SA GW BL LE MCKINNEY ST
4. Hospital/Cowan Boulevard W
ILC
UN
DE
RS
OO
D KN
ES
S TY
N
AV
E
AV
E
AD
OX DR D
DR HA
R ISO FIEL D
ST
AIR
AV W Y RY R
E HO MA SBU
TT
ST
SALI
5. University/Route 1
PERR GR
Y ST AH
PICKE
A L
HA BEU
E RD
CT
HO
M
DR
DR
HT
WA
CIR
GOOD
S
IC
ES
YATE
TW
RIG
T
6. Princess Anne Street/Route 1 (north) ES
SERV
RD
IN
WALK K
W
IN
RA
ER D DU
AIRPOR
AVE
LOE
BRAEHE
R
LAK
IS
DAV
ED
DR
KINLOCH
7. Downtown SOUTH ST
T AVE
LAFAYETTE BLVD
JEFF
R
AD DR
DUNN
ING MI CANNON
LLS RD CIR NEWELL ST
N
SL
10
DR
LN
ES
8. Dixon Street/Mayfield
N
D
OY
ER
LL
ILD
W
9. Braehead/National Park JAY
IR
BE
RM C
EC
T DE
RID MO ER
W
S FA
GE RN OO
HIL W
10. Lafayette Boulevard/Route 1 ASHBY ST LC AY IN
GS
D
DR
GIN
RE ST ID
ST ED
HUD
DR R
RD
³
OAK ST FO LO NE
LEARNING LN RR NG OW
ES ST SD
TA RE N
City Boundary HU
DG
VE ET
AV
E
LA
IN
SR
Road Centerlines D FARR
ELL
LN
Railroads
0 0.125 0.25 0.5 0.75 1
Miles
4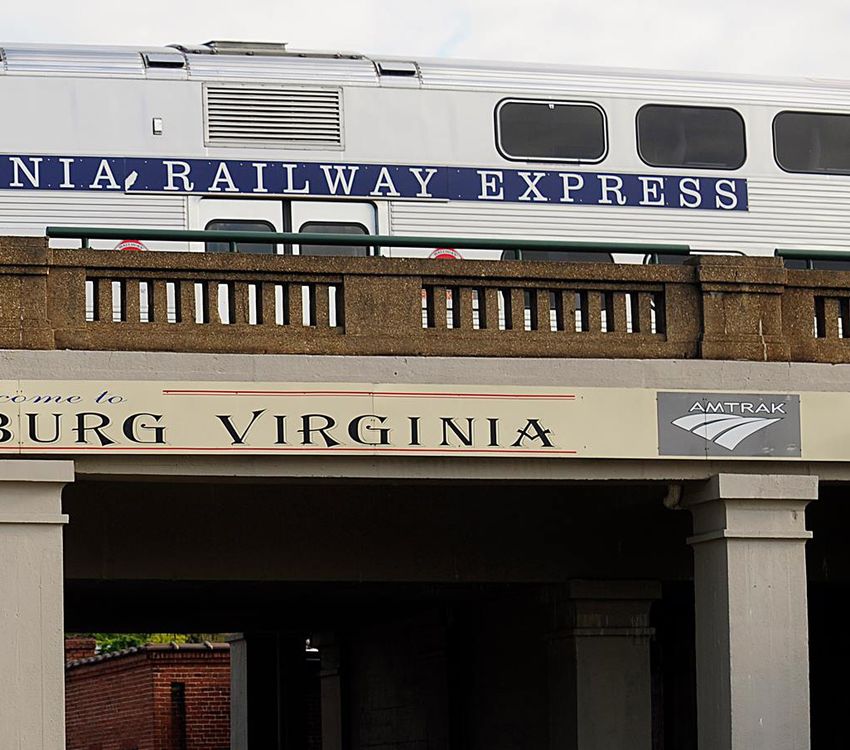
TABLE OF CONTENTS
  9     LITERATURE REVIEW

  10    RESIDENTIAL MARKET OUTLOOK

  28    OFFICE MARKET OUTLOOK

  40    HOTEL MARKET OUTLOOK

  50    RETAIL MARKET OUT LOOK

  64    TECHNICAL APPENDIX

  66    SOURCE CITATIONS

  68    DEMOGRAPHIC STATISTICS

  72    RESIDENTIAL INFORMATION

  146   OFFICE INFORMATION

  284   HOTEL INFORMATION

  290   RETAIL INFORMATION

                                     5
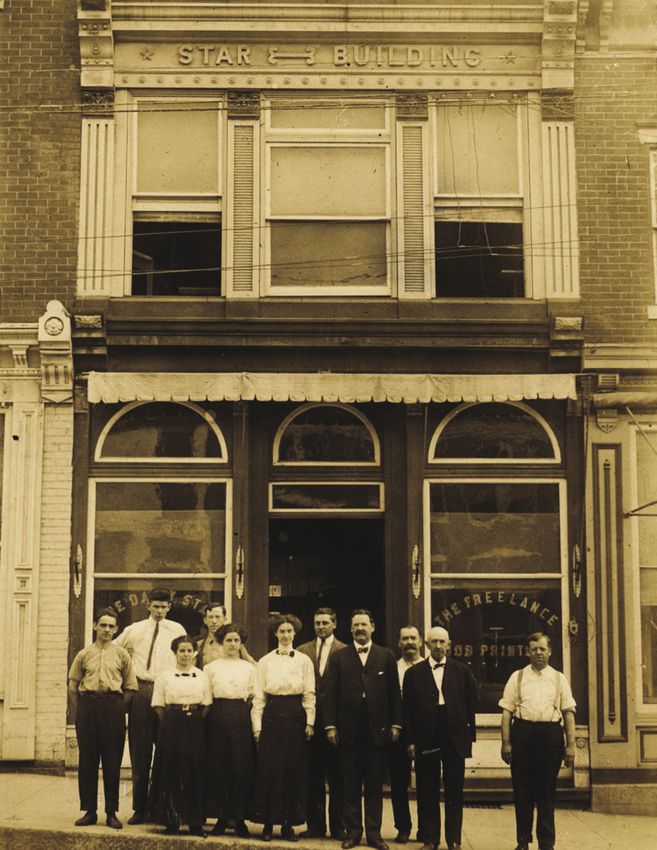
FIGURES
  PAG E   TYPE           F I GU R E

  14      CHART          YEAR HOUSING STRUCTURE BUILT
  16      MAP            SNAPSHOT OF FOR SALE ATTACHED LISTINGS
  17      MAP            SNAPSHOT OF FOR SALE DETACHED LISTINGS
  19      CHART          MULTIFAMILY SUBMARKET TRENDS
  20      CHART          VACANCY RATE BY BUILDING AGE
  22      MAP            MULTIFAMILY HOUSING
  23      CHART          AGE DISTRIBUTION OF FREDERICKSBURG POPULATION
  24      TABLE          MULTIFAMILY PIPELINE
  26      CHART          COST BURDEN BY OCCUPANT TYPE
  33      CHART          EMPLOYMENT BY INDUSTRY
  37      TABLE          OFFICE DEMAND GENERATING INDUSTRIES
  37      TABLE          ANNUAL DEMAND GROWTH FOR OFFICE
  38      TABLE          ANNUAL YEARS TO ABSORPTION BY OFFICE TYPE
  38      TABLE          ANNUAL YEARS TO ABSORPTION BY OFFICE CLASS
  44      TABLE          HOTEL INVENTORY
  45      MAP            EXISTING SUPPLY OF HOTELS
  46      CHART          HOTEL OCCUPANCY BY DAY OF WEEK
  46      CHART          HOTEL OCCUPANCY BY MONTH (5 YEAR AVERAGE)
  47      CHART          JUNE YEAR TO DATE HOTEL OCCUPANCY
  47      CHART          JUNE YEAR TO DATE AVERAGE DAILY RATE BY YEAR
  48      CHART          AVERAGE DAILY RATE BY MONTH (2017)
  48      TABLE          AVERAGE DAILY RATE NATIONAL COMPARISON
  49      TABLE          HISTORIC LODGING SUPPLY
  55      CHART          CLASS OF SPACE, OCCUPANCY, RETAIL CATEGORY
  56      MAP            RETAIL COMPETITION: LOCAL
  57      MAP            RETAIL COMPETITION: REGIONAL
  58      MAP            RETAIL TRADE AREAS: LOCAL
  59      MAP            RETAIL TRADE AREAS: REGIONAL
  60      TABLE          RETAIL CUSTOMER PROFILE ASSESSMENT
  62      TABLE          RETAIL PROJECTIONS

  Photo (right) of editorial staff in front of the Star Building from approximately 1910. The Star
  Building was the home of the Daily Star and the Free Lance. Courtesy Fredericksburg.com.

6
8

LITERATURE REVIEW
  This report acknowledges and builds on several preceding studies that have contributed to
  a library of literature and previous study about the City of Fredericksburg. Building upon
  past efforts is an essential step to create actionable strategies that position Fredericksburg
  to continue to be a wonderful place to live, work, and play. To this end, this report informs
  the ongoing effort of the Comprehensive Plan and the City’s goals of creating an accessible,
  inclusive, and vibrant place.

  Streetsense’s methodology includes collecting data through original field work, from data
  reporting agencies of the Federal and State governments, official consumer and real estate
  data provided by regional statistical trackers, and anecdotal evidence from industry experts.
  For the purposes of this study, data collection extended to other studies to create a continuum
  of aligned reports. Any deviations of original data are the result of strategic decisions to
  illuminate these nuances, slight differences in data collection, and change over time. Even with
  any adjustments, the results are closely aligned with the findings and analysis performed in
  other studies.

  Streetsense uses the Bureau of Labor Statistics for aggregating, calculating, and projecting
  labor statistics. A comparable, and popular, data set is the Virginia Employment Commission’s
  annual release of the city profile. The Bureau of Labor Statistics collects and reports
  employment data that allows calculations to be consistent and comparable with other state
  and municipal geographies. Bureau of Labor Statistics is commonly used by developers for
  decision-making and analysis.

  The data, economic, demographic, and market reports reviewed by Streetsense are provided in
  the technical appendix and cited throughout the report. In short form, these include data from
  the following list:

  •   The Virginia REALTORS 2017 Home Sales Report
  •   The 2017 Profile of Demographic, Economic, and Housing Market Conditions prepared by
      Lisa Sturtevant and Associates
  •   The National Association of Realtors Home Sales Report
  •   Zillow Research
  •   Virginia Employment Commission’s Virginia Community Profile of Fredericksburg City
  •   Original Research conducted by the Planning Staff of the City of Fredericksburg
  •   Metropolitan Washington Council of Governments
  •   Coldwell Banker Commercial Elite Office Market Vantage Point

  To the ends described in this Literature Review and using the above materials, this report
  examines residential, commercial office, and retail space. An assessment of Industrial real
  estate is not incorporated. As a core use in Area 9, Industrial real estate should be studied
  preceding the Area 9 Small Area Plan.

                                                                                                     9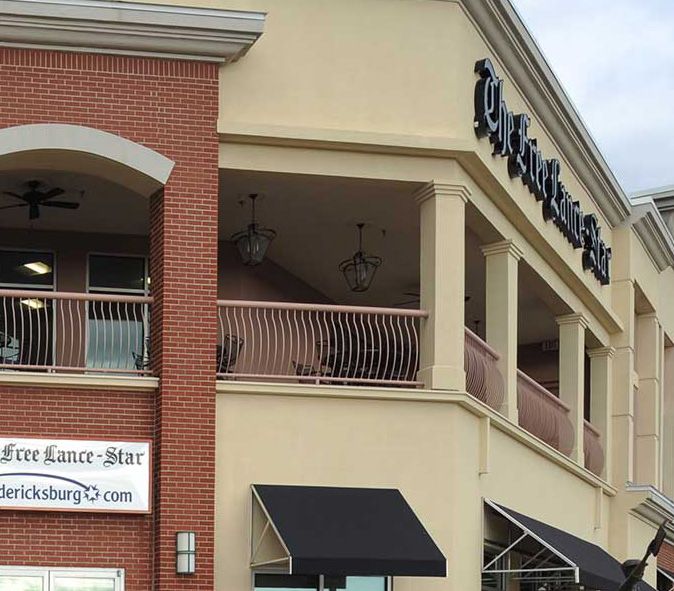
RESIDENTIAL MARKET
OUTLOOK
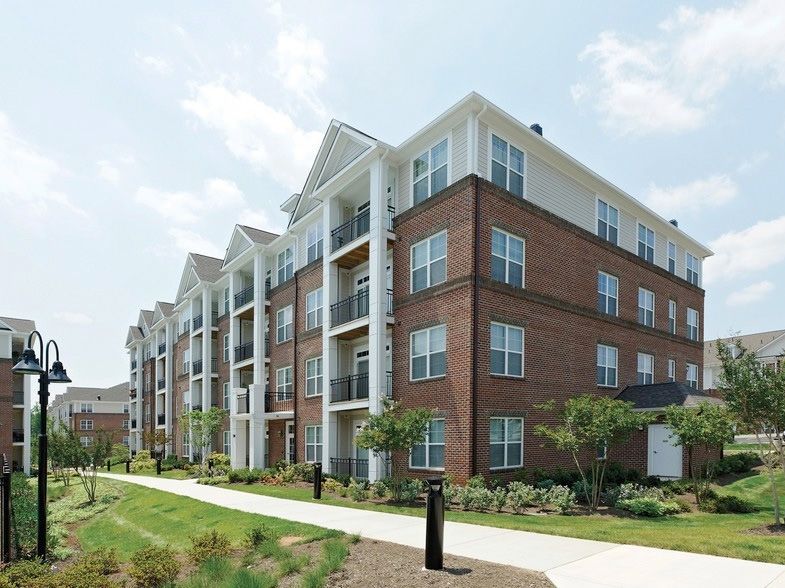
Amelia Square Townhomes.
1 011
METHODOLOGY
 To evaluate the City of Fredericksburg’s residential market, real estate conditions are examined by
 type: for-sale and multifamily residential buildings. For the purposes of this assessment, the following
 activities were undertaken to measure residential demand in the City of Fredericksburg.

           RENTAL PROPERTIES                                       FOR-SALE PROPERTIES

 SURVEY & INVENTORY                                        SURVEY & INVENTORY
 Collect data on what, where, and how much                 An assessment of local listings and recent
 of the different types of residential real estate         sales is undertaken. Data collected includes
 currently on the market. American Community               what kind of housing, housing locations,
 Survey Housing data, Census calculations                  current listings, price per square foot.
 provided by Sitewise for Streetsense, Virginia            American Community Survey Housing,
 Housing Authority Fredericksburg data sets,               U.S. Census data provided by Sitewise for
 CoStar’s Fredericksburg Market Reports                    Streetsense, MRIS Statistics, Fredericksburg
 obtained in July 2018, and combined with                  Area Association of Realtors, and Zillow
 Streetsense field research, are used as a                 Research are used as appropriate.
 baseline for this analysis.
                                                           ESTABLISH THE COMPETITION
 ESTABLISH THE COMPETITION                                 Other considerations, such as age, sales per
 Market-rate (rather than affordable, or                   square foot, days on market, home equity
 subsidized, in order to understand private-               trends, foreclosures, and the differential
 sector development potential) properties built            between average listing price and sale price
 most recently are evaluated as data sets and              are considered.
 assessed for their Classes of Space, amenities,
                                                           ANALYZE DEMOGRAPHICS
 rent rates, occupancy, and unit type.
                                                           By identifying population growth rates,
 ANALYZE DEMOGRAPHICS                                      income, employment trends, and other
 By identifying population growth rates, income,           demographic indicators, an assessment
 employment trends, and other demographic                  of potential household formation and
 indicators, an assessment of potential                    demographics are used to isolate demand
 household formation and demographics are                  potential.
 used to isolate demand potential.
                                                           IDENTIFY PROHIBITING FACTORS
 IDENTIFY PROHIBITING FACTORS                              Certain factors such as school performance,
 Certain factors such as school performance,               crime, traffic, and demographic preference
 crime, traffic, and demographic preferences               can impact competitive advantages and
 can impact the competitive advantages and                 disadvantages of one market within the
 disadvantages of one market within the context            context of other markets.
 of other markets.
                                                           ADDRESS DEMAND
 ADDRESS DEMAND                                            Demand is measured against the supply and
 Demand is measured against the supply and                 the development pipeline to establish unmet
 the development pipeline to establish unmet               demand. Price points, and product types
 demand in each category. This conclusion also             are evaluated to establish the likelihood of
 establishes the likelihood of development and             new development and sales. Other factors
 tenanting at certain price points and product             are considered, for example: single - family
 types.                                                    homes that may be leased out to renters are
                                                           considered.

1 2
TERMINOLOGY
The following terms are defined to establish a common understanding of residential terms used for the
documentation of this study.
HOUSING TYPES
SINGLE FAMILY: A standalone structure
intended for housing individual families. This can
include single family detached (stand-alone),
attached (townhomes). Single family homes are
typically measured for their sales potential, but in
some conditions, renters are attracted to single
family rental homes. Fredericksburg single family
buildings are assessed for occupancy, age, and
SINGLE FAMILY DETACHED
price.
SINGLE FAMILY ATTACHED
MULTIFAMILY: A single structure with multiple
housing units. These residential structures can
accommodate multiple, separate renters or owners.
Duplexes, courtyard-style, garden style, and mid-
rise buildings are different types of multifamily
structures. Fredericksburg multifamily buildings
are assigned a class of space and assessed for
occupancy, age, and price.
MISSING MIDDLE HOUSING: Missing Middle
is a diverse set of multifamily sub-types commonly
MULTIFAMILY APARTMENTS activated by infill strategies. This market report does
not specifically evaluate the need for Missing Middle
housing, as it is not a recognized market typology in
a traditional real estate analysis.
MULTI-FAMILY CLASS OF SPACE
Each residential building inventoried was assigned a grade according to the level of suitability for
occupancy according to finishes, and construction type. This report does not make statements
regarding the subjective qualities of current tenants or neighborhoods in determining class of
space or demand.
CLASS A SPACE: High quality space with luxury finishes. Turnkey in nature; requires little to no
immediate investment for upgrades.
CLASS B SPACE: Mid-quality, fully functional spaces with average finishes. Some investment or
maintenance required to bring up to A standard facilities.
CLASS C SPACE: Lower quality space characterized by lower end or aging interior finishes.
Requires a significant investment to build up to today’s Class A or B qualities. Class C spaces are
typically older and without renovations.
13HOUSI N G S U P P LY
An assessment of the existing housing stock was undertaken for the purposes of contextualizing the
market. The assessment examines major patterns of development over time, trends in occupancy,
and identifies the volume and type of built residential structures. Indicators of demand are
compared to the supply to illuminate nuances in the market and assist in strategizing the correction
of mismatches in supply demand.
There are approximately 12,000 housing structures in the City of Fredericksburg.1 An assessment of
the supply reveals that the current inventory is a mix of approximately 45% multifamily units, 40%
single-family detached homes, and 15% townhomes/attached units.2
O CC UPA NCY
There are approximately 11,000 occupied housing units in the City of Fredericksburg. An assessment
of tenants reveals that the dominant household tenant type is renters.3 This is an increasingly
common condition in markets across the United States that reflects the changing demographics
of the population. Renters occupy approximately 3,562 identified market-rate rental units in
multifamily buildings4 the 2,050 known affordable rental units created by the Low Income Housing
Tax Credits, and data evidence suggests that many renters occupy single-family structures.
In addition to the renter tenants, approximately 37% of occupied households are occupied by
owners. Homeowners predominantly occupy single-family homes, as opposed to condominiums or
atypical mixed-use buildings.5
A majority of the housing in Fredericksburg
is the product of a few major developmental YE AR ST RU CT U RE B U ILT
phases. The majority of housing was built
3,000
before 1980, with 14% of units existing in
2,500
buildings preceding World War II. In the
1970’s, 2,500 units came online, and the 2,000
most recent major developmental phase 1,500
was 2000-2009, where approximately 1,900 1,000
units were constructed.
500
Slightly more than a quarter of residents 0
1 939 1 9 4 0 1 95 0 1960 1 970 1980 1990 2 0 0 0 201 0
moved to their existing units in the first or - -
e a r l i e r 1 9 49 1 959
-
1 9 69
-
1 979
-
1 9 89
-
1999
- to
2 0 0 9 present
decade of the 2000’s and have remained
Source: Sitewise Reports Created for Streetsense. November 2018.
there since.6
RE SI D EN T I A L DE MAND
Between 2010 and 2017, the number of households in the city grew at a rate faster than the
United States average, by 2.2% annually, forming an additional 2,900 households. Future growth
projections of 1.5% will bring an average of 168 new household formations annually.7 In addition to
understanding population growth, other factors such as demographics, sales, and the presence of
amenities are considered when determining the potential for residential development in the city.
The residential asset class is further assessed based on the performance of the for-sale and rental
markets.
1 4FOR-SALE HOUSING
F O R- SA LE CO NDI T I O N S
At the time of construction, many single family homes were intended for sale to homeowners:
about 55% of the housing stock is single family homes, townhomes, and condominiums.8 Today,
many single-family homes are occupied by renters. The rental occupancy of these homes
points to a population that increasingly shifted demand towards rentals over time after many
of these structures were built. Macroeconomic conditions have made homeownership more
difficult nationwide, and housing development in markets around the country lags behind in
accommodating rental demand. In Fredericksburg, an employment-population that is largely
linked to the healthcare system or University often chooses renting over homeownership as a
matter of preference.
Many of the sales in the past year were existing homes rather than new construction. The number
of total home sales has been steadily increasing in the past five years; in the last full calendar
year, 2017, 335 homes were sold. In 2016, there were 327 sales. These volumes are comparable to
the peak in 2004, where home sales totaled 338 units.9
This report considers the impact of new residential development on existing homeownership. In
recent years, Fredericksburg’s home values have stabilized to pre-recession prices, ranging from
$300,000-$500,000 for a three bedroom, two bathroom home10; however, many homeowners
are underwater on mortgages, or still unable to make their money back by selling their homes.11
Contributing to this condition was the construction boom that occurred just before the 2008
recession: a significant portion of the existing housing stock was added between 2000 and 2009.
An investigation into recent sales shows that homes have a higher Days on Market average when
compared to the State of Virginia and national trends. For homes that sell, an assessment of
average listing prices to selling prices indicate that homeowners are selling homes for less than
their asking price.12 For the purposes of comparison, on average, Virginia homeowners sold homes
for 100% of the asking price for four consecutive months of the 2018 calendar year.13
RE SI D EN T I A L SA L E S
A qualitative monitoring of active listings provided a number of insights into this market. Listings
are examined in two groups: mid-$400,000s or below to accommodate the needs of would-be
home-buyers of price-conscious incomes, and luxury homes of approximately $500,000’s and
above. These range estimations represent home affordability at the varying thresholds of incomes
represented in the city (assuming a 20% down payment).
Observational data points to price-conscious homes being taken off the for sale market to
become active listings as rental properties, where a possible explanation is that conditions of
income and preference have shifted demand to rental units. This trend aligns closely with national
shifts in housing markets, where a growing demand for rentals is increasingly common.
15S NA P S H OT OF ATTAC H E D L IST INGS AS O F AUGUST 2018
1
2
Rappahannock
Fa
ll H
Ri i ll A
ve
rR ve
d
6
4
Ca
rl
D
Si
C
¨
¦
§
7
ow
¨
lve
¦
§
an
95
95
d
rP
St
B ra gg R
Bl
m
llia
k
vd
Wi
wy
Ca
Ki ng s Hw y
5
rol
ine
St
£
¤
3
3
fay
e tte
Blv
d
F er ry R
d
La
3
£
¤
11
8
9
FOR SALE ATTACHED
LISTING
£
¤
2
2
TOWNHOME
10
CONDO
d
eR
wn
do
ns
La
An assessment of available listings, as of August 10, 2018, explores current sale opportunities of
condominiums and townhomes. A wide array of price points available in for sale listings could make
townhome development feasible, with prices ranging from $310,000 and can exceed a million dollars
in Neighborhood 7. Condos can start at $130,000 and can exceed a million dollars.
Smaller housing types benefit developers who seek to maximize potential price per square foot sales,
as well as favoring prospective homeowners, for whom an overall lower price makes purchasing a
home more accessible. Townhomes and condos can deliver a larger number of housing units where
demand is shifted towards desirable areas - such as adjacency to water, institutions, downtown, transit
- but where there are constraints on land availability.
1 6SNAP S H OT OF D ETAC HED L IST INGS AS O F AUGUST 2018
1
2 Rappahannock
Fa
ll H
Ri i ll A
ve
rR ve
d
6
4
Ca
7
rl
D
Si
C
¨
¦
§
ow
¨
lve
¦
§
an
95
95
d
rP
St
B ra gg R
Bl
m
llia
k
vd
Wi
wy
Ca
Ki ng s Hw y
5
rol
ine
St
£
¤
3
3
fay
e tte
Blv
d
F er ry R
d
La
3
£
¤
11
9 8
10
SINGLE FAMILY HOME
LISTINGS
>$500K
£
¤
2
2
$400-499KF OR- SA L E DE MAND A N D U P CO MING PROJE CTS Population trending projects approximately 619 new household formations over the next ten years, assuming that rates of homeownership remain consistent. Additional units created by new projects in the pipeline are a consideration, measured for their impact on absorption against future household formations. New projects include Telegraph Hill, Highlander, and Landing at Central Park. An additional 450 homes from these projects are anticipated in the next few years. These projects will absorb some of the demand from the 619 additional household formations the City is projected to see. F OR- SA L E CO N C LU S I O NS Fredericksburg is a competitive buyers market with a variety of price ranges available to prospective homeowners. Economic forces, such as income, and macroeconomic shifts in home- buying and consumer preference, present the potential for limited development of for-sale properties in the next ten years. The following recommendation is given to allow for the absorption of new product on the market, the stabilization of the existing supply, and the consideration of the impacts on homeowners. Considering the vacancy of single-family units, the number of homes on the market, and new units in the development pipeline, minimal short-term new development of for-sale units is recommended. New units may be able to successfully capture demand, but significant development in the next ten years will create conditions of oversupply and amplify conditions that burden existing homeowners. Fredericksburg is likely to continue to see small-scale projects such as townhomes and condominium units. These new products are on the market for shorter periods of time. These units offer a competitive price per square foot that is high enough to create an impetus for new development, yet are relatively affordable to prospective homeowners who consider the packaged price. Currently, this opportunity is captured primarily in Neighborhood 7, where smaller townhomes sell at lower price points and are bolstered by adjacency to amenities and walkability. Neighborhoods 3 and 10 also offer potential to capture demand. 1 8
RENTAL HOUSING
  RE N TA L CO NDI T I O N S

  Since 2013, asking rents in Fredericksburg’s multifamily apartment buildings have increased by
  an average of $94 per unit to an average of $1,057 per unit.14 As of the first quarter of 2018, the
  multi-family rental market has posted a vacancy rate of 2.4%.15 The larger Suburban Virginia
  market’s vacancy rate posted 4.9% in this same time period, contextualizing the local demand
  for rental units. A 5% vacancy rate would indicate a statistically stabilized market, where
  Fredericksburg’s vacancy rate serves as an indicator of a stable market with growth potential.

  The vacancy rates in Fredericksburg would also typically serve as an indicator that rental rates
  would increase, if not further limited by the aging units driving rents down. It is expected
  that the aging inventory of multifamily units will inevitably decrease the asking rent, creating
  naturally occurring affordable housing. Recent trends suggest that rent reductions may have
  already started, evidenced by a decrease of 0.02% from the end of 2017 to the first quarter of
  2018.

                           M A R K E T R AT E MU LT I FAMI LY T R E NDS I N
                                F R E D E R I CKSB U R G SU B MAR K E T

            700                                                                                    8%
            600                                                                                    7%
            500                                                                                    6%

                                                                                                        VACA N CY
 U N I TS

                                                                                                   5%
            400
                                                          2.4%                                     4%
            300
                                                                                                   3%
            200                                                                                    2%
            100                                                                                    1%
            0                                                                                      0%
                  2013   2014       2015       2016      2017         2018       2019      2020

                                Construction              Planned Construction

                                Absorption                Vacancy Rate

  Compared to the Metro DC submarket, the Fredericksburg market has a lower price per
  square foot (from $1.17 to $1.90). Of Suburban Virginia’s 14 submarkets, Fredericksburg has
  the lowest average asking rents.16 Save for all other costs, lower asking rates pose an obstacle,
  where the market potential limits the rate of return for development that naturally provides an
  impetus to developers.

                                                                                                                    19
SELECTEDEX
MONTHLY
I ST I N G OWNER COSTS
B U I L DI N (SMOC)
G STO CK GROSS RENT OF OCCUPIED RENTAL UNITS
Housing units with a mortgage 3500
The existing multifamily building stock in Fredericksburg represents a wide typology range, garden-
700
style, mid-rise, courtyard, and residential-over-retail
3000 buildings.17 A majority of the rented units
600 are two-bedroom (53%), followed by one bedroom 2500 (39%), and three bedrooms or more (9%).
18
500 Three bedroom units have the lowest vacancies (2%) with two bedrooms at 3%, and one bedroom
2000
400 vacancies at 4%.19 It is likely that three bedrooms have the lowest vacancies based on the low
supply of three bedroom units when compared to 1500the other three unit types.
300
200 1000
100 500
0 0
Less than $500 to $1,000 to $1,500 to $2,000 to $2,500 to $3,000 or Less than $500 to $1,000 to $1,500 to $2,000 to $2,500 to $3,000 or
$500 $999 $1,499 $1,999 $2,499 $2,999 more $500 $999 $1,499 $1,999 $2,499 $2,999 more
For Fredericksburg renters, price point
may be more important than quality,
where Class A buildings have a higher
average vacancy rate of 3% than
Class B buildings (2.7%) and Class C
2017 Est. Households by Household VAC A N CY VACANCY
R AT E BY
buildings (2%). A similar pattern exists RATEBBY
U AGE
I L DOF
I N G AGE
Income
when examining the age of building MULTIFAMILY BUILDING
2,500 stock, in the chart to the right, where
25%
25
2,000 the 2000-2009 vacancy rate is notable,
1,500 as the last large construction boom 2 0%
20
1,000
occurred during this period.
15 %
15
500
Typically, these two factors (quality
0 and age) are considered regulators of 10%
10
price and vacancy rate. This indicates
that the largest opportunity in rental 5 %5
housing is not in creating new, Class A
0%0
rental buildings, as they are limited in Before
B efo re
1970-1979
1 970
1980-1989
1980
1990-1999
1990
2000-2009
2000
After 2009
Af ter
1970 - - - - 2 009
their ability to increase rents at a higher 1 970
1 979 1 9 89 1999 2 009
class of space, and thus construction
cost. This may create a perceived risk
for prospective developers, who may
be dissuaded from delivering new
product to the market.
300 8%
7%
250
6%
200 COM PA RA B L E S
5%
150 Of relevant new construction within Fredericksburg, the comparable
4% rent price per square foot for
new development is calculated based on the development of larger projects in the past ten years,
3%
100 at $1.53, higher per square foot than the overall average of $1.17 per square foot.20 This is still lower
than Suburban Virginia’s general asking rents. 2%
50
1%
0 0%
2013 2014 2015 2016 2017
Construction Absorbed Vacancy Rate
2 0EXAMPLES OF MULTI-FAMILY COMPARABLES
THE APARTMENTS AT COBBLESTONE SQUARE
627 COBBLESTONE CIR, FREDERICKSBURG, VA
This Class A community was built in 2012. Stainless steel
appliances, granite countertops, carpet, and in-unit washers and
dryers are provided. The community features a pool, grill deck, dog
park, club room, business center, and fitness center.
The average Effective Rate per Unit is $1,606, requiring an annual
Household Income of $64,240 to afford units at an expenditure
limit of 30% on gross income. For the Effective Rent of a One
Bedroom Apartment, an income of $58,360 is necessary.20
THE COMMON AT COWAN BLVD
2352 COWAN BLVD, FREDERICKSBURG, VA
This Class C community was built in 2001. A pool, grilling area, pet
friendly, military/student friendly, and onsite laundry are provided.
The average Effective Rate per Unit is $1,165, requiring an annual
Household Income of $46,600 to afford units at an expenditure
limit of 30% on gross income. For the Effective Rent of a One
Bedroom Apartment, an income of $42,000 is necessary.21
RESIDENCES AT BELMONT
2520 BELMONT TERRACE, FREDERICKSBURG, VA
This is a Class B community built in 1990 and recently renovated.
Amenities include a swimming pool, fitness center, sauna, volleyball
court, and conference room. Stainless steel appliances, wood
flooring, and nickel fixtures are recent upgrades.
The average Effective Rate per Unit is $1,410, requiring an annual
Household Income of $56,400 to afford units at an expenditure limit
of 30% on gross income. For the Effective Rent of a One Bedroom
Apartment, an income of $52,400 is necessary.22
WELLINGTON WOODS APARTMENTS
1704 LAFAYETTE BLVD, FREDERICKSBURG, VA
This a Class C community built in 1972. The community features a
swimming pool, sundeck, and on-site laundry facility.
The average Effective Rate per Unit is $1,165, requiring an annual
Household Income of $46,600 to afford units at an expenditure
limit of 30% on gross income. For the Effective Rent of a One
Bedroom Apartment, an income of $40,600 is necessary.23
21MARKET RATE RENTAL HOUSING
1
2
Rappahannock
Fa
ll H
Ri ill
ve Av
rR e
d
6
4
Ca
rl
D
Si
C
¨
¦
§
7
ow
¨
lve
¦
§
an
95
95
d
rP
St
B ra gg R
Bl
m
llia
k
vd
Wi
wy
Ca
Ki ng s Hw y
rol
ine
5
St
£
¤
3
3
fa ye
tt eB
lv d
F er ry R
d
La
3
£
¤
11
8
9
400+ APTS
¤
£
2
2
300-399 APTS
10
200-299 APTS
100-199 APTSN I C HE M A R K E T DE MANDS A N D S PE CIALT Y DE MO G RAPH ICS
For the purposes of planning long-term for the needs of Fredericksburg residents, consideration
is given to senior housing needs. Nationally, approximately 2% of the elderly population moves in
any given year23 due to delays in retirement age and generational preference.
AGE D I STR I BUTI O N O F F R ED ERI CKS BUR G
P O P UL ATI O N
5 ,000
While the population 4, 5 00
trends that would be
4,000
expected in a market with
strong demand for senior 3, 5 00
housing does not present
itself, a soft market for 3,000
senior housing in the
2 , 5 00
near future will grow.
By 2028, demand for a 2 ,000
share of units that are
age restricted will grow 1, 5 00
in excess of the existing
1,000
units.
5 00
0
0- 4 5- 9 10-14 15-17 18 - 20 21- 24 25-34 35- 44 45- 54 55- 6 4 6 5-74 75- 8 4 8 5+
KIDS YOUNG ADULT WORKING RETIREMENT
AGE
Of the 389 existing units designed exclusively for the senior market segment,24 only the
Evergreens at Smith Run has been constructed since the new millennium. This 2003 building is
4% vacant, higher than the average vacancy of 2.8% between all three recorded rental units for
seniors, and the only fully market-rate apartment building.
New senior housing development within five miles of the city may have a high level of impact
and should be monitored closely; however, Fredericksburg has the opportunity to provide a
competitive advantage for prospective tenants within this radius. The success of the lease up for
the 208 units in Celebrate Virginia South, currently under construction, can set the precedent for
future developments and should be considered for its level of impact for other prospective senior
housing developments in the next ten years.
23RE N TA L DE MA N D
Demand for additional multifamily units reflects Fredericksburg’s strong rental market and
projected growth. Between 2018 and 2028, approximately 106 rental households will form
annually, assuming that levels of homeownership and renters remain constant.
Total development potential is a function of the demand that is not anticipated to be absorbed
by new products entering the market. 720 apartment rental units are under construction and
slated to come online in 2020. Of these, 120 units are not built to market rate, but rather, are
created through the use of Tax Credits with the Virginia Housing and Development Authority. 208
units are senior units.
MU LT IFAMILY PIPE LINE
Units Product Typology
Princess Anne St 2217 23 Market Apartments
The Hamptons at Coleman / Hamptons Phase II 120 Affordable Apartments
/ Valor Apartments
Silver Collection Celebrate South 369 Market Apartments
Silver Collection Celebrate South 208 Market Senior Apartments
M ULT I FA MI LY CO NC LU S I O N S
The following conclusion is based on a factor of demand and referenced against future
construction and assumes household sizes and vacancy rates for market-rate apartments remain
consistent with the current market.
The rental units currently under construction (this assessment does not consider proposed units
that have not yet received permits) will absorb Fredericksburg’s available demand for the next
five years. By 2028, the market will have demand for a total of approximately 461 additional rental
units.
While the overall price per square foot is lower on average for multifamily development in
Fredericksburg, catering to demand for smaller units generally favors developers with higher
project returns per square foot. This is generally aligned with the direction that is demanded of
the market, where one-person rental households are the primary occupancy type.
Whereas the existing market-rate inventory is composed of two bedrooms (53%), followed by
one bedrooms (41%), and three bedrooms (6%), the unit mix should more closely reflect the
household sizes for renters. The current rental-mix indicates that 43% are one person households,
29% are two-person households, 13% are three-person households, and 15% are four-or-more
person households.25 Unit type flexibility for a changing population with varying demands should
be considered in the future.
2 4HOUSING AFFORDABILITY
Fredericksburg mirrors nation-wide real estate conditions in that traditional homeownership
is, in many cases, more affordable but less accessible. Recent shifts in demand towards rentals
based on sociodemographic conditions result in increasingly competitive rental landscape,
ultimately raising rents. This effect is twofold: would-be homeowners are dissuaded by the high
barriers to entry of homeownership but experience a higher cost-burden from renting.
An average household income of $80,284 and a median household income of $55,591 indicates
a disparity. This condition is evident between homeowners and renters, where the median
household income for homeowners was $97,383 in 2015 and the median household income was
$39,347 for renter households.26 These figures have not changed dramatically over the past
three years. The two groups are examined for their respective market conditions.
252 01 7 COST B U R DEN BY OCCUPA N T TYPE
60 %
50% R ENT ER S
G ro ss re n t
% OF P OP U LATI ON
as a % of
40% Household
I n co m e
30% (G R A P I )
20% HOMEOWNER S
S e l e c te d
10% monthly
ow n e r co st s
as a % of
0% Household
20% 20% 25% 30% 35% I n co m e
or - - - or (SMOCAPI)
l ess 24 . 9 % 2 9. 9 % 34.9% m o re
HOU SI NG COSTS
Source: 2012-2016 American Community Survey 5-Year Estimates
HO M EOWNE R S
For many Fredericksburg residents, ownership is currently challenging. Additionally, a sizeable
proportion of homeowners were over-mortgaged between 2000 and 2009, when 16% of
housing was built and 25% of residents moved into their current residences. In 2018, about
13.5% of homes have negative equity, compared to the US average of 10.4%.27
In the current economic climate, where renters can allocate less money to savings, the number
of prospective homeowners in the City is limited as fewer people are able to save a sufficient
amount of money to afford the down payment on a house in Fredericksburg.
REN T ER S
The chart Cost Burden by Occupant Type illustrates the overall monthly cost burden of
renting on households. While a larger percentage of owners spend less than 20% of their total
household income on housing costs, a larger proportion of renters are spending more than 35%
of their household income on rent.
Rental affordability is a significant challenge for the City of Fredericksburg, given the large
portion of the population (63%) currently renting. Fredericksburg’s population includes
“renters by choice”. Cost burdens have implications of affordability for the renter population,
who stay for an average tenure of approximately six years.
Renting is more accessible than homeownership in Fredericksburg, where the median gross
rent for occupied units is less than the median $1,856 for selected monthly owner costs
for housing units with a mortgage.28 Despite the accessibility of renting as compared to
ownership, housing costs for the population of renters are less affordable than those for
homeowners. 24% of renters are cost-burdened with 30-50% of income on rent spending, and
23% of renters are cost-burdened by 50% or more.29
2 6T HE TA R GE T
The median rent, $1,057, requires a household income that exceeds the median household
income of renter households. Estimations for “affordable” monthly rents (calculated as 30%
of gross monthly income) for the median rental income are approximately $984. Using the
same calculations, the average salary of the workforce in Fredericksburg affords them the
opportunity to spend $998 on monthly rent.30 Approximately 500 units in Fredericksburg
have effective rents of less than the median household income of renter households required
to be truly affordable.31
These trends are increasingly common in markets across the country, as the age of first-time
homebuyers is increasing, creating unprecedented shifts in demand towards rental units that
traditionally would be projected as sale product demand. The resulting effect is a burden on
the existing supply.
The median household income of renter households, as well as the workforce in
Fredericksburg, can afford approximately a $230,000 house with a standard 20% down
payment, of which there are few. The city’s employment opportunities and educational
institutions bring many new residents to the city for short-term periods. These populations
will remain “renters by choice”; however, a small amount of demand can be shifted away
from renting towards homeownership. The subsidization of up-front housing costs, such
as down-payments, can help alleviate the burden placed on the rental supply (by reducing
competition and, therefore, costs). Home-buying assistance programs can ease barriers for
those in a slightly higher income bracket, who can afford more of the available-for-sale stock.
In turn, this could catalyze demand of for-sale homes that are not currently projected for
the market that helps existing homeowners maintain housing values and may allow for the
stabilization when the development of additional for-sale units occurs.
Another consideration is lifting density maximums and updating zoning codes to provide
naturally occurring affordable housing by increasing the supply. This strategy allows the
city to activate residentially appropriate space that is vacant without relying on the limited
potential of existing subsidies or by the creation of new development.
ON G O I N G A N D F U T U R E E F F O R TS
The City should consider two additional levels of study to evaluate housing that is affordable
to the citizen and to the locality.
The first is an analysis of Missing Middle Housing on a neighborhood scale. The City should
evaluate the major types, locations, and patterns in the existing supply of housing.
Additionally, a future Housing Action Plan should examine potential planning and policy
strategies appropriate for local housing affordability issues.
27OFFICE MARKET OUTLOOK New Free Lance Star Building in Central Park Corporate Center, courtesy DLR Contracting. 2 8
This office market assessment evaluates Fredericksburg’s trending and current vacancy and
occupancy rates, annual net absorption, rental rates, leasing activity, as well as job and industry
growth to determine the strength and performance of the local office market as well as its future
ability to absorb and support additional office development without suppressing the market with
oversupply.

                                                                                                      29
METHODOLOGY
To evaluate the City of Fredericksburg’s office market and development potential, office
development is examined based on employment growth, office type, and historic trends. For the
purposes of this assessment, the following activities were undertaken to measure office demand in
the City of Fredericksburg.
SURVEY & INVENTORY
An inventory of existing office space within the Fredericksburg market was
conducted to record the address, size, vacancy, occupancy rates, class of space,
building structure, age and type of office use. Fredericksburg is a market that
contains many office options and uses, including traditional, professional, medical,
and flex office.
INTERPRET EX ISTING CONDITIONS
From the inventory data collected in the first task, vacancy rates, type of space,
and class of space were studied to determine the strength of the Fredericksburg
office submarket. Historical data is gathered from US Bureau of Labor Statistics,
Commercial Banker Commercial, Costar, and Cushman & Wakefield reports, as
appropriate. An assessment of recent trends for local office occupancy, asking
rent growth, absorption rates, and development activity provided insights into the
current stability of the Fredericksburg office market.
EMPLOYMENT PROJECTIONS
Office development potential and employment projections emulate local,
regional, and national employment growth trends as well as past development
trends. Annual employment growth rates per industry sector was gathered from
the Virginia Employment Commission, which were then applied to the existing
employment base in Fredericksburg per the US Bureau of Labor Statics, which
provided the number of employees added per industry per year.
TRANSLATE DEMAND BY OFFICE TYPE
Annual demand for office is derived from the annual employee growth within
office-generating industries. Demand for Traditional Office is created by the
Professional, Scientific, and Technical Services; Information; Management of
Companies and Enterprises; and Administrative and Support employment
industries. Demand for Medical Office is produced by the Health Care and Social
Assistance employment industry. Demand for Professional and Flex Office is
generated by Finance and Insurance; Real Estate and Rental and Leasing; and
Educational Services employment industries.
The translation into square feet of demand is calculated by multiplying annual
employee growth by the national average of office square feet per type of
employee per type of office. These figures consider the changing ratios of square
feet of space per employee. Annual demand per office type is subtracted from
the total vacancy per type which result in the year when demand for new office
development is actualized, assuming no additional development or demolition of
office occurs during that time frame.
3 0TERMINOLOGY
Existing office inventory and demand for office is measured and calculated for Traditional, Medical,
and Professional/Flex office types. The demand for office space is estimated through a calculation of
annual employment within office-generating industries per office type.
PROFESSIONAL OFFICE
Commercial space designed for commercial or industrial organization
professionals’ use to conduct business; typically seen as law, accounting, real
estate, financial, tax preparation, or insurance firms. Banks can be considered
professional office as well.
MEDICAL OFFICE
Commercial building designed with the capacity to support medical practices.
Medical office refers to any use pertaining to the medical field, such as dentist,
physical therapy, urgent care.
TRADITIONAL OFFICE
Commercial building used for creative professionals. Open space that promotes
co-working as seen in architecture, interiors, etc.
FLEX OFFICE
A commercial space with a storefront is designed to accomodate retail, office, or
commercial uses.
OFFICE CLASS OF SPACE
Each office building inventoried was assigned a grade according to the level of suitability for
occupancy and the likelihood the space will remain office use. In determining class of space or
demand, this report does not make subjective judgments on the qualities of current tenants or
neighborhoods.
CLASS A SPACE: The highest quality of office space, Class A buildings are well located,
typically professionally managed, and have high quality construction and building infrastructure.
CLASS B SPACE: Mid-quality buildings that may be a bit older but are still fully functional
spaces are considered Class B. These buildings have moderate finishes, and can be restored to
Class A classification with renovations to common areas and facade improvement.
CLASS C SPACE: Lower quality spaces that are characterized by lower end finishes or are
visibly aging (20+ years). Like the construction, building infrastructure and technology is dated.
Class C buildings command the lowest rental rates of any buildings and typically take longer to
lease, although neighborhood serving spaces and start-ups typically gravitate towards taking
advantage of Class C availability.
Although maker and creater space can be flex office, it is a tenant type, not a market typology. As such, there is no recognized
mechanism for evaluating and projecting maker space demand in a traditional real estate assessment.
31EMPLOYMENT TRENDS Unemployment rates in the City of Fredericksburg are declining. The City began 2017 with an unemployment rate of 5% and ended the year at 3.9%, below the national unemployment rate. The City of Fredericksburg labor force consists of approximately 32,900 employees and is projected to grow by 0.92% per year or 564 employees. Some industries are growing, for example, Administrative and Support and Waste Management, at a rate of 2.74%, while other industries are projected to experience a decline, for example, Information declines by a rate of -0.65% annually. By 2038, the employment-population in Fredericksburg is expected to reach 41,000 employees.32 Nationally, the Healthcare and Social Assistance industry is the largest employment industry in the United States, accounting for 12% of the labor force. The need for healthcare and related services is soaring, driving the demand for healthcare related jobs. The Bureau of Labor Statistics projects that one in three jobs created in the United States between 2016 and 2026 will be within the Healthcare and Social Assistance industry. In 2018, almost a third of Fredericksburg’s labor force is employed by Mary Washington Hospital. As a result, the largest employment industry in Fredericksburg is the Healthcare and Social Assistance industry with approximately 9,800 employees. The second largest employment industry in Fredericksburg is the Professional, Scientific, and Technical Services category with approximately 4,800 employees. This industry includes employees in Legal Services, Accounting, Architectural, Engineering, Scientific Research, and Computer Systems industries. Over half of the employees (2,914) in this industry are located in businesses within the boundaries of Neighborhood 6, which includes employers such as the Mary Washington Hospital Outreach Laboratory (scientific research and laboratory) and MD Tech Solutions (computer software company). Finally, the Retail Trade and Accommodation and Food Services are sizable industries in the City of Fredericksburg at 4,156 employees and 4,782 employees, respectively. Together, they account for 29% of the total labor force in Fredericksburg. However, they are referred to as “non-office generating” and do not impact office market potential. 3 2
201 7 EMPLOYMENT BY INDUST RY

         HEALTHCARE & SOCIAL ASSISTANCE

PROFESSIONAL, SCIENTIFIC, & TECHNICAL

                                        RETAIL TRADE

        ACCOMMODATION & FOOD SERVICES

               OTHER (EXCEPT PUBLIC ADMIN)

                         EDUCATIONAL SERVICES

            REAL ESTATE, RENTAL, & LEASING

                                        INFORMATION

                           FINANCE & INSURANCE

         TRANSPORTATION & WAREHOUSING

                 ARTS, ENTERTAINMENT, & REC

ADMIN, SUPPORT, & WASTE MANAGEMENT

                               WHOLE SALE TRADE

                                      CONSTRUCTION

          AG, FORESTRY, FISHING, & HUNTING

                                   MANUFACTURING

 MINING, QUARRYING, OIL & GAS EXTRACT

                                                       0   2,000   4,000   6,000   8,000   10,000   12,000
Source: US Bureau of Labor Statistics, July 2018.

                                                                                                             33
OFFICE MARKET TRENDS On a macro level, the potential for office development in Fredericksburg is essentially a function of its distance from a major urban hub – Washington DC and its adjacent jurisdictions. The Metropolitan Washington Council of Governments reported that 4.8 million square feet of new office space opened in 2017 in the Washington DC region,33 pushing the vacancy rate close to 20%.34 Of all new development in the Washington DC region, 83% is located within a half-mile distance of a Metrorail station.35 Among commercial developers, lenders, and brokers, the preference is for office sites within direct access of a Metrorail station and pedestrian accessibility to established retail and amenities. These preferences, coupled with the amount of vacant space within the regional employment hub, limit the amount of traditional speculative office development opportunities in the City of Fredericksburg. On a micro level, the potential for office must be considered within the context of the regional office market, which includes Spotsylvania, Stafford, Caroline, and King George Counties, and the City of Fredericksburg. Potential office uses will likely consider a number if not all of these submarkets when selecting a site. The Stafford County submarket is a fierce competitor to the City of Fredericksburg. By quantity of existing office inventory, Stafford County is by far the larger office market with almost 4 million square feet of office. The City of Fredericksburg is the next largest with 2.6 million square feet, while the Spotsylvania market is a close third with 2.3 million square feet. The Stafford submarket also commands the highest rents in the region at $23.92 price per square foot (PPSF) gross, while the City of Fredericksburg averages $20.12 PPSF. Year- over-year rent growth has been largely stagnant over the past 5 years but has shown recent flickers of life with year-over-year rent growth of $2.41 (11%) between 2017 and 2018.36 Fredericksburg has the lowest office vacancy rate in the region at 6.6%, with the regional average hovering around 12%, its lowest since 2008. The City of Fredericksburg’s existing office inventory is 2.6 million square feet and the second highest rents. As a result, it can be considered the best performing submarket in the region.37 3 4
O F F I C E CO M PA R A B L E S

1171-1440 CENTRAL PARK BOULEVARD

                               C L A S S O F S PAC E :   A
                                                             Central Park Corporate Center is a
                               O CC U PA N C Y:   61%        Class A office complex with high
                                                             accessibility by Route 3 and I 95. The
                               ASKING PPSF:       $15-$25    property was built in 2001.

701 KENMORE AVE

                                                             701 Kenmore Ave is a Class B office
                               C L A S S O F S PAC E :   B   space built in 1929 and renovated
                                                             in 2008, The 28,000 SF mix holds
                               O CC U PA N C Y:   65%
                                                             a tenant mix of professional and
                               ASKING PPSF:       $18.00     medical office. The building is
                                                             estimated at $18/PPSF.

1300 THORTON ST

                                                             The small floor plates within
                               C L A S S O F S PAC E :   B   the office building at 1300
                                                             Thorton Street building allow
                               O CC U PA N C Y:   84%
                                                             for professional businesses and
                               ASKING PPSF:       $14.84     medical office to cohabitate a
                                                             single building.

1551 JEFFERSON DAVIS HIGHWAY

                                                             Cowan Crossings is a new 15,000
                               C L A S S O F S PAC E :   A   square foot office building. 6,000 SF
                                                             is currently available on the ground
                               O CC U PA N C Y:   N/A        floor. Cowan Crossings was built
                                                             in 2018 and leases from $15-$25
                               ASKING PPSF:       $15-$25
                                                             depending on the unit selected.

                                                                                                      35
CURRENT OFFICE INVENTORY With small amounts of recent new office development, Fredericksburg’s office inventory is aging. The average age of its office structures is 66 years old. Most office properties in the market are low rise (1-2 stories), Class B/C structures occupied by multiple tenants. The average size of space occupied by a single tenant is 10,500 square feet. A large portion of the market has been designated to medical office (healthcare, education, social assistance, finance and insurance), which is expected due to the presence of the Mary Washington Hospital campus. Professional office is also a dominate office sector occupied by attorneys, accountants, realtors, banks, etc. Neighborhood 7 – Downtown Fredericksburg has the largest office supply at approximately 931,000 square feet; however, approximately 100,000 square feet of occupied office space is located within non-office appropriate space, which includes office uses occupying any structure that was not intended for office use (houses and retail storefronts). Additionally, 88,300 square feet is vacant. Traditional residential product, such as historic row houses, are commonly renovated into ground level office spaces in downtown Fredericksburg (Neighborhoods 6 and 7). The floor plates in these row houses are narrow and small, averaging around 700 to 900 square feet on one continuous floor. These buildings, for price and size, are ideal for sole proprietor businesses, such as personal law and finance offices. Office markets that have a large amount of office space in non-office appropriate buildings can indicate that there might be demand for a higher-quality, office appropriate space. Neighborhood 6 – Princess Anne Street is the second largest office supply by size at approximately 654,400 square feet. The office building at 2300 Fall Hill Ave accounts for 42% of this neighborhood’s inventory at 275,000 square feet. The surrounding office supply is 10% vacant. Neighborhood 4 – Hospital/Cowan Boulevard is the third largest office market by size at approximately 370,000 square feet. The office market in this neighborhood has the city’s most favorable vacancy rate at 6%. Approximately 90% of the office inventory is within the medical office category, greatly influenced by the presence of the Mary Washington Hospital campus. Additionally, office uses occupy 43% of the retail space within this area, approximately 12,000 square feet. The neighborhood’s low vacancy rate and office occupancy in retail spaces indicate additional demand for medical office space. Due to its location along Interstate 95 and access to retail amenities, Neighborhood 1 – should be an ideal location for Traditional Office development by standard office site selection criteria; however, its vacancy rate hovers around 40%, an indicator of an over-built office landscape with slow absorption. 3 6
You can also read