2020 System Strength and Inertia Report - A report for the National Electricity Market - Australian Energy ...
←
→
Page content transcription
If your browser does not render page correctly, please read the page content below
2020 System Strength and
                Inertia Report

                            December 2020

A report for the National Electricity Market
Important notice
PURPOSE
AEMO publishes the System Strength Report and Inertia Report under National Electricity Rules clauses 5.20.7
and 5.20.5. This publication has been prepared by AEMO using information available at December 2020.
Information made available after this date may have been included in this publication where practical.

DISCLAIMER
This document or the information in it may be subsequently updated or amended. This document does not
constitute legal or business advice, and should not be relied on as a substitute for obtaining detailed advice
about the National Electricity Law, the National Electricity Rules, or any other applicable laws, procedures or
policies. AEMO has made every effort to ensure the quality of the information in this document but cannot
guarantee its accuracy or completeness.
Accordingly, to the maximum extent permitted by law, AEMO and its officers, employees and consultants
involved in the preparation of this document:
• make no representation or warranty, express or implied, as to the currency, accuracy, reliability or
  completeness of the information in this document; and
• are not liable (whether by reason of negligence or otherwise) for any statements or representations in this
  document, or any omissions from it, or for any use or reliance on the information in it.

VERSION CONTROL
 Version          Release date                 Changes

 1.0              17/12/2020                   Nil

AEMO 2020 | 2020 System Strength and Inertia Report                                                               2
Executive summary
AEMO has assessed the outlook for system strength and inertia in the National Electricity Market (NEM) over
the coming decade. It is increasingly clear that the changing generation mix and lowering minimum demand
projections will drive the need for additional system strength and inertia services, and the electricity sector will
need to continue to innovate and adapt to maintain secure and efficient operation of the future power
system.
System strength and inertia are critical requirements for a secure power system. A minimum level of system
strength is required for the power system to remain stable, particularly for stability of the voltage waveform.
Inertia in conjunction with frequency control services are needed for maintaining the power system frequency
within limits.
In this inaugural 2020 System Strength and Inertia Report, AEMO observes increasing indications that, in the
near future, projected system strength may be insufficient in Queensland, New South Wales, and Victoria, if
certain conditions eventuate. Similarly, projected inertia may be insufficient in Queensland.
Although for a ‘traditional operations’ projection these outcomes are not considered likely to occur within the
planning horizon of five years, there is a strong risk this could occur earlier under a high renewable energy
projection, both with and without considering the potential for flexible operation of synchronous generating
units. This report also:
• Updates the minimum system strength and inertia requirements across the NEM.
• Declares the re-emergence of a system strength and inertia shortfall in Tasmania in 2024 (as well as a risk
  of larger, earlier shortfalls in Tasmania than previously declared).
• Extends an existing inertia shortfall in South Australia by one year.
• Notes that further analysis is required to confirm the scale of the Red Cliffs system strength shortfall in
  Victoria beyond 2022.

    AEMO welcomes feedback on the material provided in this report, and any related matters, no later
    than two months from the date of publication.
    Feedback should be provided to planning@aemo.com.au.

Planning for the evolution of how future system security services will be sourced in the NEM
The power system was planned and designed around large thermal and hydro synchronous generation. Most
of the power system design has historically been centred around the characteristics of a system dominated by
these power stations, and as such they are currently relied upon for provision of a range of system services
needed to keep the system secure. These power stations were located near their energy sources, which is
different to where newer renewable generators are locating. This means the efficient redesign of the power
system of the future will likely require provision of system services in new locations.
Commissioning of new utility-scale generation resources continues at a high pace; 4,074 megawatts (MW) of
new inverter-based renewable energy generation is at the committed (final) phase of development as at
November 20201, an increase of 1,138 MW since July 2020.

1
 Solar, wind, battery storage and other, as reported on AEMO’s Generation Information page, November update, at https://aemo.com.au/en/energy-
systems/electricity/national-electricity-market-nem/nem-forecasting-and-planning/forecasting-and-planning-data/generation-information.

AEMO 2020 | 2020 System Strength and Inertia Report                                                                                              3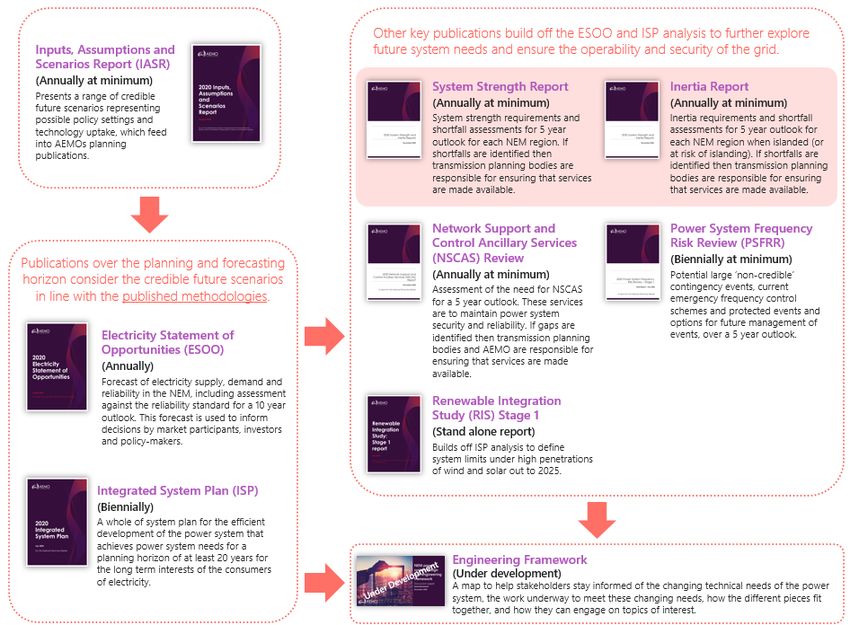
At the same time, due to increases in installations of distributed photovoltaic (PV) generation, AEMO has
observed record minimum demand in several regions of the NEM, with South Australia experiencing a
minimum demand of 270 MW (operational demand, sent out) on 7 November 2020, Victoria experiencing a
minimum operational demand of 3,073 MW on 6 September 2020, and Queensland experiencing a minimum
operational demand of 3,712 MW on 27 September 2020.
These trends have significant implications for the future operation of synchronous generation units. AEMO
and transmission network services providers (TNSPs) need to re-engineer the power system and seek new
opportunities for system service provision to ensure system security as the electricity system transitions. In
addition, the Energy Security Board (ESB) and the Australian Energy Market Commission (AEMC) are
progressing major regulatory reforms which will affect future provision of system strength and inertia – the
post-2025 NEM market design project, and the consideration of seven National Electricity Rules (NER) rule
change requests relating to the provision of system services.
AEMO is currently preparing an Engineering Framework intended to help stakeholders stay informed of the
changing technical needs of the power system2. When planning for the provision of new system strength and
inertia, AEMO and TNSPs must also account for other system needs, including thermal network capacity,
stability of DER, and voltage requirements. There will be increasing opportunities for sourcing these services
from non-energy providers, which may provide further efficiencies in the future power system design.
AEMO looks forward to working with TNSPs and the broader industry as work progresses on assessment of
the power system, and system strength and inertia in particular.

Potential for shortfalls depending on minimum demand and synchronous generator behaviour
Record minimum demands in the NEM due to the uptake of distributed PV generation, and the high pace of
commissioning of utility-scale variable renewable energy (VRE) resources, are projected to continue. There is
growing evidence that these factors will result in changes to the operation of existing large synchronous
generating units, including decommitment3, and where feasible, more flexible operations. Recently
announced energy infrastructure policies are intended to support increasing introduction of new renewable
generation, which when realised should accelerate changes in the operation of existing thermal generation,
as more renewable energy replaces energy previously produced by fossil fuel generation.
As noted above, currently the power system relies on existing large synchronous generating units to provide
the bulk of the essential power system security services. Without advance market signals to incentivise these
generators to remain online, or support investment in alternative sources of system security services, this
decommitment could have consequential impacts on power system security services – namely system
strength during normal operating conditions, and inertia requirements when a region is islanded (or at risk of
islanding). Depending on the timing, number and location of these decommitments, AEMO may be required
to declare shortfalls in system strength for fault level nodes in central New South Wales, central and northern
Queensland, and central Victoria. An inertia shortfall for the Queensland region may also arise due to these
same decommitments.
AEMO has not declared these shortfalls in this report, due to remaining uncertainty about when and to what
degree existing synchronous generating units may change their operations. However, AEMO notes that the
levels of system strength or inertia (as relevant) are projected to be near minimum limits, and evidence is
increasingly emerging that the conditions for declaring shortfalls could arise in the near future.
AEMO will continue to monitor evolving conditions and review the assessments. Should there be evidence of
acceleration of the projected reduction of synchronous generation units online, AEMO will update this notice
and may declare shortfalls. AEMO considers it prudent to prepare analysis for when any resultant shortfalls
are declared. AEMO will consider new information as it becomes available and provide updates as necessary.
This may include publishing shortfalls ahead of the 2021 System Strength and Inertia Report/s.

2
    See https://aemo.com.au/initiatives/major-programs/engineering-framework.
3
    Decommitment in this report is used in the context of machines not being available, which may include withdrawal of a machine from dispatch for
     commercial or other reasons

AEMO 2020 | 2020 System Strength and Inertia Report                                                                                                   4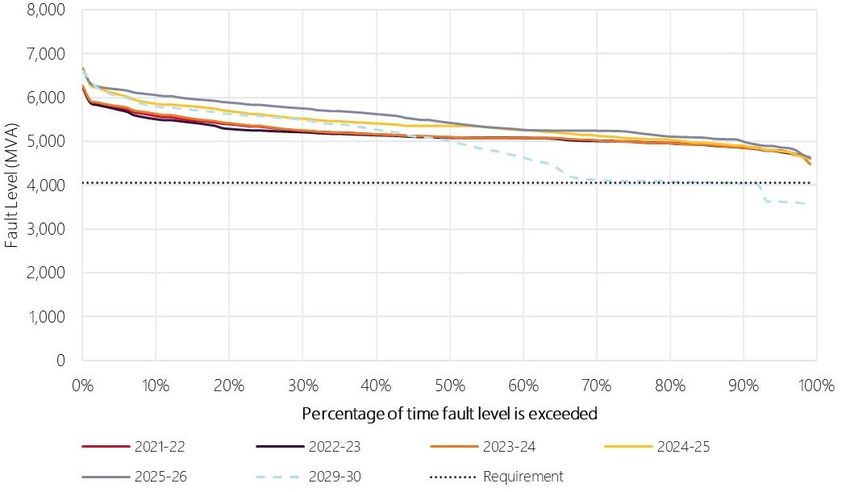
Assessment of minimum system strength and inertia requirements in the NEM and update on
previously declared system strength and inertia shortfalls
In this report, AEMO updates the system strength and inertia requirements for the NEM. The system strength
requirements cover minimum three phase fault levels at each fault level node. The inertia requirements
include the minimum threshold level of inertia for when a region is either islanded from the rest of the NEM
or at credible risk of separation, and the secure operating level of inertia for when a region is islanded.
In addition, AEMO is declaring a number of extended or amended shortfalls across the NEM.
• TasNetworks has procured system strength and inertia services to address the previously declared
  shortfalls in Tasmania. Updated projections are highlighting the risk of larger shortfalls than previously
  declared, and AEMO will work with TasNetworks in early 2021 to review the potential drivers for these
  larger shortfalls as well as assess impacts on the services previously procured. Any new declaration will be
  made by the end of March 2021. AEMO is now also re-declaring system strength and inertia shortfalls for
  the period after the current contracts expire in 2024.
• The synchronous condensers being installed in South Australia will close the system strength and
  minimum inertia threshold shortfalls declared in South Australia in 2017. Procurement by ElectraNet of fast
  frequency response (FFR) to meet the secure level of inertia shortfall declared in August 2020 for 2021-22
  is progressing, and AEMO is now declaring a new extension of that shortfall for 2022-23.
• The system strength shortfall identified at Red Cliffs in Victoria in 2019, and revised in 2020, has been met
  with system strength services procured in the local area by AEMO in its role as System Strength Service
  Provider for Victoria. Analysis is underway to confirm the scale of the system strength shortfall at Red Cliffs
  beyond 2022.
• Powerlink has proposed closing the system strength shortfall at Ross in Queensland by reducing the
  system strength requirements with inverter re-tuning of nearby generation. Studies are ongoing to
  confirm all requirements are met with this solution, and Powerlink is required to address the shortfall by
  August 2021.

Table 1      Summary of system strength and inertia outcomes for 2020

                                         Currently                                                      2025

                 System strength              Inertia                     System strength                  Inertia

 New South                                                                Potential for shortfalls at
 Wales                                                                    Newcastle and Sydney
                                                                          West

 Queensland      Shortfall at Ross                                        Potential for shortfalls at      Potential for inertia
                                                                          Gin Gin                          shortfall

 South           Synchronous condensers       Shortfall extended to
 Australia       project underway             June 2023

 Tasmania        Potential for shortfall at   Potential for inertia       Shortfall from May 2024          Shortfall from May 2024
                 several nodes                shortfall

 Victoria        Services in place at Red
                 Cliffs until 2022

 Legend:         No shortfall                 System strength or          Potential shortfall (under       Shortfall
                                              inertia services in place   review)
                                              or underway

AEMO 2020 | 2020 System Strength and Inertia Report                                                                                  5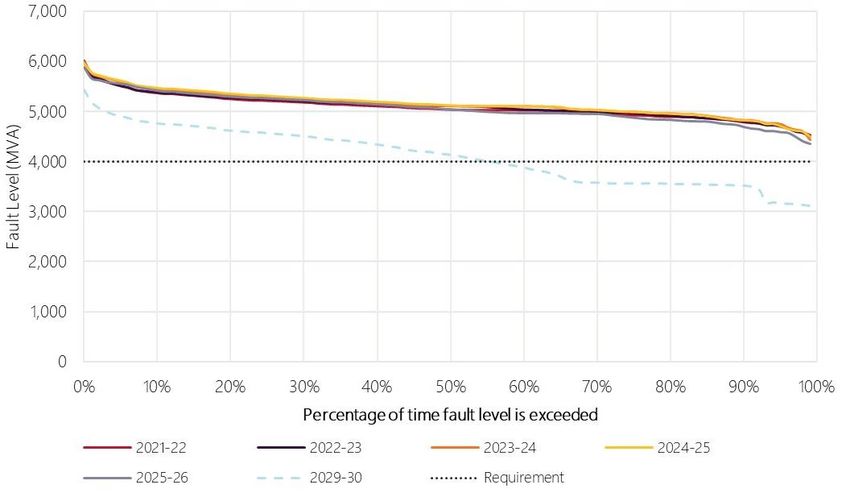
Contents
Executive summary                                                   3

1.        Introduction                                              10

2.        Regional requirements and outlooks                        13
2.1       2020 system strength requirements                         13
2.2       2020 inertia requirements                                 15
2.3       Market projections                                        15
2.4       New South Wales outlook                                   16
2.5       Queensland outlook                                        24
2.6       South Australia outlook                                   33
2.7       Tasmania outlook                                          41
2.8       Victoria outlook                                          46

3.        Next steps                                                54

A1.       Summary of shortfall projections                          56

A2.       Assessment methods and assumptions                        58
A2.1      Assessment of system strength requirements                58
A2.2      Assessment of inertia requirements                        62
A2.3      System strength and inertia shortfall projection method   68
A2.4      Shortfall declaration assessment                          69
A2.5      Market modelling methodology and assumptions              70
A2.6      Future electricity demand                                 72
A2.7      Future electricity generation                             74
A2.8      Major transmission network upgrades                       75

A3.       EMT model setup for system strength                       77
A3.1      Assessment methodology                                    77
A3.2      EMT model setup – Victoria                                78
A3.3      EMT model setup – Tasmania                                80
A3.4      EMT model setup – Queensland                              81

A4.       Steady state model setup for system strength              84
A4.1      Steady state fault level parameters setup                 84
A4.2      Contingencies considered in the studies                   85
A4.3      Prior outages modelled                                    86

A5.       EMT model setup for inertia                               87
A5.1      Assessment methodology                                    87

AEMO 2020 | 2020 System Strength and Inertia Report                  6
A5.2       EMT model setup and requirements – Queensland                                                      89
A5.3       EMT model setup and requirements – Victoria                                                        90

Tables
Table 1        Summary of system strength and inertia outcomes for 2020                                        5
Table 2        Fault level nodes and minimum three phase fault levels in the NEM for 2020                     13
Table 3        Inertia requirements in the NEM for 2020                                                       15
Table 4        New South Wales system strength outlook                                                        19
Table 5        Queensland system strength outlook                                                             29
Table 6        South Australia system strength outlook                                                        35
Table 7        Comparison of 99th percentile projected inertia after four synchronous condensers
               installed in South Australia, adjusted for inertia support activities                          40
Table 8        Inertia shortfalls at different levels of FFR for Stage 2 secure operating level of inertia,
               adjusted for inertia support activities                                                        40
Table 9        Updated requirements for Burnie node (MVA)                                                     42
Table 10       Tasmania system strength outlook                                                               42
Table 11       Summary of inertia shortfall assessment for Tasmania under traditional operations
               projection                                                                                     46
Table 12       Victoria system strength outlook                                                               50
Table 13       Summary of possible system strength and inertia shortfalls assessments under different
               projections                                                                                    56
Table 14       2020 Assessment of likelihood of islanding of each inertia sub-network in the NEM              63
Table 15       Net distributed PV disconnection (in MW) for most severe credible fault during the most
               severe period                                                                                  67
Table 16       Announced coal-fired power plant retirement dates, or technical end-of-life dates              75
Table 17       Transmission network upgrades included in analysis                                             76
Table 18       Victoria system strength successful generator combinations                                     79
Table 19       Central and Northern Queensland Synchronous Dispatches studied in EMT                          82
Table 20       Identified critical contingencies for fault level nodes in each region                         85
Table 21       Size of DER disconnection for the Queensland region                                            89
Table 22       2021 Queensland inertia requirements                                                           89
Table 23       2022 Queensland inertia requirements                                                           90
Table 24       Size of DER disconnection for the Victoria region                                              91
Table 25       2021 Victoria inertia requirements                                                             91
Table 26       2022 Victoria inertia requirements                                                             92

AEMO 2020 | 2020 System Strength and Inertia Report                                                            7
Figures
Figure 1 Regulatory frameworks for inertia in the NEM 11
Figure 2 AEMO’s planning and forecasting documents 12
Figure 3 Projections for number of synchronous machines dispatched in New South Wales 18
Figure 4 System strength outlook for Armidale under the high renewable projection 20
Figure 5 System strength outlook for Darlington Point under the high renewable projection 20
Figure 6 System strength outlook for Newcastle under the traditional operations projection 21
Figure 7 System strength outlook for Newcastle considering flexible operation 21
Figure 8 System strength outlook for Sydney West under the traditional operations projection 22
Figure 9 System strength outlook for Sydney West considering flexible operation 22
Figure 10 System strength outlook for Wellington under the high renewable projection 23
Figure 11 Inertia outlook for New South Wales under the high renewable energy projection 24
Figure 12 Central Queensland coal units online, monthly distribution September 2019 – October
2020 26
Figure 13 Number of Queensland coal units online, historical v high renewable energy with flexible
operation 27
Figure 14 Number of synchronous machines dispatched in central Queensland 27
Figure 15 System strength outlook for Gin Gin under the traditional operations projection 29
Figure 16 System strength outlook for Gin Gin considering flexible operation 30
Figure 17 System strength outlook for Greenbank under the high renewable projection 30
Figure 18 System strength outlook for Lilyvale under the high renewable projection 31
Figure 19 System strength outlook for Ross under the high renewable projection 31
Figure 20 System strength outlook for Western Downs under the high renewable projection 32
Figure 21 Inertia outlook for Queensland under the high renewable energy projection 33
Figure 22 System strength outlook for Davenport under the high renewable projection 35
Figure 23 System strength outlook for Para under the high renewable projection 36
Figure 24 System strength outlook for Robertstown under the high renewable projection 36
Figure 25 Inertia outlook for South Australia under traditional operations projection 37
Figure 26 South Australia secure operating level of inertia adjusted for inertia support activities, with
four synchronous condensers with flywheels 39
Figure 27 System strength outlook for Burnie under the traditional operations projections 43
Figure 28 System strength outlook for George Town under the traditional operations projection 43
Figure 29 System strength outlook for Risdon under the traditional operations projection 44
Figure 30 System strength outlook for Waddamana under the traditional operations projection 44
AEMO 2020 | 2020 System Strength and Inertia Report 8Figure 31 Inertia outlook for Tasmania under the traditional operations projection 45
Figure 32 Number of synchronous machines dispatched in Victoria 49
Figure 33 System strength outlook for Dederang under the high renewable projection 50
Figure 34 System strength outlook for Hazelwood under the high renewable projection 51
Figure 35 System strength outlook for Moorabool under the high renewable projection 51
Figure 36 System strength outlook for Red Cliffs under the high renewable projection 52
Figure 37 System strength outlook for Thomastown under high the renewable projection 52
Figure 38 Inertia outlook for Victoria under the high renewable projection 53
Figure 39 Categories of fault level nodes 59
Figure 40 Steps for calculating minimum three phase fault levels 60
Figure 41 Relationship between system condition and inertia levels 62
Figure 42 Relationship between minimum threshold level of inertia and secure operating level of
inertia 64
Figure 43 Comparison of 2020 and 2019 ESOO projections for distributed PV installed capacity in the
NEM 73
Figure 44 Minimum demand projections for traditional operations and high renewable energy
projections 73
AEMO 2020 | 2020 System Strength and Inertia Report 91. Introduction
System strength and inertia are two of the important power system security services that need to be carefully
planned as the Australian electricity system transitions.
As the power system transitions, AEMO is considering the impact of emerging trends on system security
services such as system strength and inertia. These trends include the ongoing uptake of both utility and
distributed inverter-based resources (IBR), lowering of minimum demands and low demand periods due to
increasing uptake of distributed energy resources (DER), and temporary or permanent changes in behaviour
of synchronous generators in the market.
The increasing penetration of IBR together with changes to operation of synchronous generators present a
need for the Australian electricity sector to implement a world-leading energy transition that takes advantage
of emerging technology as well as optimising the utility of existing assets.
This section outlines the regulatory context for this 2020 System Strength and Inertia (SSI) Report, and
clarifies where this SSI Report sits within the framework of AEMO’s planning documents.
Application of the current regulatory frameworks or the 2020 report
AEMO is required to determine the minimum system strength and inertia requirements in the National
Electricity Market (NEM) and assess whether, in AEMO’s reasonable opinion, there are or are likely to be any
shortfalls within the next five years4.
Both system strength and inertia are required for the robust and secure operation of the power system:
• A minimum level of system strength is needed for the power system to remain stable under normal
conditions and to return to a steady state condition following a system disturbance5.
• A minimum level of inertia is also required in the power system to suppress and slow frequency deviations
so that automatic controls can respond to sudden changes in the supply–demand balance6.
This report applies the current frameworks for system strength and inertia. Separately, the market institutions
in the NEM are considering broad-ranging regulatory changes for delivery of system strength and inertia
services.
AEMO applies the System Strength Requirements Methodology 7 to determine the system strength
requirements for each region of the NEM by selecting fault level nodes and then assessing the minimum
three phase fault level required at each node.
AEMO’s assessment for system strength is based on normal operating conditions8. These requirements do
not necessarily have to be met at all times operationally, for example under reduced output from distributed
photovoltaics (PV) and variable renewable energy (VRE), or for planned outages of network elements,
providing that system security can still be maintained.
4
Clauses 5.20.5 and 5.20.7 of the NER
5
For more information on system strength, see AEMO, Power System Requirements, July 2020, at https://www.aemo.com.au/-/media/Files/Electricity/NEM/
Security_and_Reliability/Power-system-requirements.pdf and AEMO, System strength explained, March 2020, at https://aemo.com.au/-/media/files/
electricity/nem/system-strength-explained.pdf.
6
For more information on inertia, see Power System Requirements, July 2020 at https://www.aemo.com.au/-/media/files/electricity/nem/security_and_
reliability/power-system-requirements.pdf?la=en&hash=04F4669E6663B1763086B291B463C0A5.
7
AEMO, System Strength Requirements Methodology, July 2018, at https://www.aemo.com.au/energy-systems/electricity/national-electricity-market-
nem/system-operations/system-security-market-frameworks-review.
8
Studies assessing ‘normal operating conditions’ consider the system with all transmission network elements in service, except for elements that are out of
service as part of the usual system configuration (for example to maintain system security). More information can be found in AEMO’s Power System
Security Guidelines, September 2019, at https://aemo.com.au/energy-systems/electricity/national-electricity-market-nem/system-operations/power-
system-operation/power-system-operating-procedures.
AEMO 2020 | 2020 System Strength and Inertia Report 10The requirements take account of the stability of the region following any credible contingency event or
protected event when determining system strength requirements (consistent with National Electricity Rules
[NER] clause 5.20.7(b)). The determination of the requirements for system strength and inertia does not
include investigation of the actions required to return the power system to a secure operating state within
thirty minutes.
AEMO’s responsibilities for system strength in the NEM
AEMO is responsible for determining system strength requirements for each region in the NEM. Under the
NER, system strength is represented by the three phase fault level at designated fault level nodes 9. For each
fault level node, the minimum three phase fault level is determined and used as a basis for assessing system
strength.
AEMO is responsible for publishing an annual report on system strength10 which includes:
• AEMO’s determination of system strength requirements for each region and its assessment of any fault
level shortfall.
• A description of the system strength requirements 11 and details of its assessment of an existing or likely
fault level shortfall over a planning horizon of at least five years.
Transmission network service providers (TNSPs) or jurisdictional planning bodies, as the system strength
service providers for each region, are responsible for making system strength services available to meet any
fault level shortfall related to decreasing supply of system strength in the region as synchronous generators
that have historically been relied on to provide system strength withdraw from the market 12. These services
must be made available by a date nominated by AEMO which is at least 12 months from the declaration of
the shortfall, unless an earlier date is agreed with the system strength service provider.
Separately, new generators being connected in the NEM must currently remediate their impact on system
strength under the remediation (or ‘do no harm’) rules arrangements 13.
Appendix A2 of this report provides information on AEMO’s assessment process for regional requirements
and projections, and Section 2 provides the updated 2020 outcomes of these assessments as well as any
previous assessments which have not been updated.
AEMO’s responsibilities for inertia in the NEM
Figure 1 describes the regulatory framework in the NEM for assessing and remediating inertia.
Figure 1 Regulatory frameworks for inertia in the NEM
9
Clause 5.20C.1 of the NER
10
Clause 5.20.7 of the NER
11
In September 2017, the AEMC introduced new Rules for managing system strength, see NER Clause 5.20C.
12
Clause 5.20C.3 of the NER
13
Clause 5.3.4B of the NER
AEMO 2020 | 2020 System Strength and Inertia Report 11This report meets AEMO’s responsibility to publish an annual report on inertia 14, which includes:
• Boundaries of inertia sub-networks and related inertia requirements.
• AEMO’s assessments of any inertia shortfall.
• AEMO forecast of any inertia shortfall arising at any time within a planning horizon of at least five years.
• Inertia requirements for each inertia sub-network together with AEMO’s assessment of level of inertia
provided by the sub-network and any inertia shortfalls15.
Appendix A2 of this report provides information on AEMO’s assessment process for requirements and
projections, and Section 2 provides the updated 2020 outcomes of these assessments, as well as any previous
assessments which have not been updated.
AEMO’s documents on planning for operability
This SSI Report uses inputs from a number of related reports and processes, and also informs and underpins
other reports and processes owned by AEMO and TNSPs. Figure 2 shows the SSI Report in the context of
other key AEMO planning and forecasting documents.
Figure 2 AEMO’s planning and forecasting documents
Note: Clicking on an image of a report will take you to that report’s location on the AEMO website.
14
Clause 5.20.5 of the NER
15
Clause 5.20B.3 of the NER
AEMO 2020 | 2020 System Strength and Inertia Report 122. Regional requirements
and outlooks
AEMO has applied the assessment methods and assumptions described in Appendix A2 to prepare regional
requirements and outlooks for system strength and inertia. In this section, the updated (or existing) system
strength and inertia requirements are provided (Sections 2.1 and 2.2) before an overview of the market
projections considered (Section 2.3). Finally, an outlook for each region is given showing market outlook,
network outlook, system strength and inertia projections, and declaration of any shortfalls (Sections 2.4 to
2.8). Appendix A1 provides a summary of the results of the projections across the NEM.
2.1 2020 system strength requirements
AEMO has applied the system strength assessment method in Section A2.1 to determine the system strength
requirements in the NEM. These requirements are prepared consistent with the acceptable minimum
synchronous machine combinations for each region of the NEM, as detailed in Appendix A3. Table 2 provides
the updated set of system strength requirements and notes where these have changed from previous
assessments.
AEMO has not formally changed the location of any fault level nodes in this report, although Section 2.2 does
consider the potential for future update of fault level nodes in the New South Wales region. For the minimum
fault level requirements which are updated in this report, Appendix A3 and Appendix A4 provide details of
the model setup for the supporting electromagnetic transient (EMT) and steady state fault level analysis
respectively.
Table 2 Fault level nodes and minimum three phase fault levels in the NEM for 2020
Region Fault level node 2020 minimum three phase fault Difference from previous
level (megavolt-amperes [MVA]) assessments
Pre- Post-
contingency contingency
New South Wales Armidale 330 kilovolt (kV) 3,300 2,800 Newly declared in this report,
reflecting reduced acceptable
Darlington Point 330 kV 1,500 600 minimum synchronous machine
combinations (Note 1).
Newcastle 330 kV 8,150 7,100
Sydney West 330 kV 8,450 8,050
Wellington 330 kV 2,900 1,800
Queensland Gin Gin 275 kV 2,800 2,250 No change from April 2020
declaration, but analysis is ongoing
Greenbank 275 kV 4,350 3,750 for Ross and Gin Gin (Note 2).
Lilyvale 132 kV 1,400 1,150
Ross 275 kV 1,350 1,175
Western Downs 275 kV 4,000 2,550
AEMO 2020 | 2020 System Strength and Inertia Report 13Region Fault level node 2020 minimum three phase fault Difference from previous
level (megavolt-amperes [MVA]) assessments
Pre- Post-
contingency contingency
South Australia Davenport 275 kV 2,400 1,800 Updated to take into account the
committed synchronous
Para 275 kV 2,250 2,000 condensers at Davenport and
Robertstown
Robertstown 275 kV 2,550 2,000
Tasmania Burnie 110 kV 850 560 Updated to take into account more
accurate models (Note 3).
George Town 220 kV 1,450 - No change from November 2019
declaration (Note 4).
Risdon 110 kV 1,330 -
Waddamana 220 kV 1,400 -
Victoria Dederang 220 kV 3,500 3,300 Updated in this report, including
updated assessment at Red Cliffs
Hazelwood 500 kV 7,700 7,150 (Note 5).
Moorabool 220 kV 4,600 4,050
Red Cliffs 220 kV 1,700 1,000
Thomastown 220 kV 4,700 4,500
Notes:
1. New South Wales system strength requirements were previously determined in the 2018 requirements report
(https://www.aemo.com.au/-/media/Files/Electricity/NEM/Security_and_Reliability/System-Security-Market-Frameworks-Review/
2018/System_Strength_Requirements_Methodology_PUBLISHED.pdf), and reported for post-contingency levels only. This 2020
SSI Report reflects agreement between AEMO and TransGrid about changes to the minimum acceptable synchronous machine
combinations for New South Wales, as well as providing the pre-contingency values.
2. Queensland system strength requirements were previously determined in the April 2020 report (https://www.aemo.com.au/-
/media/files/electricity/nem/security_and_reliability/system-security-market-frameworks-review/2020/2020-notice-of-queensland
-system-strength-requirements-and-ross-node-fault-level-shortfall.pdf?la=en#:~:text=Fault%20levels%20at%20Ross%20
are,operation%20of%20inverter%2Dconnected%20resources), including moving the Nebo node to the Ross node, and reported
for post-contingency levels only. Although these levels are not changed in this December 2020 report, AEMO expects changes
for the Ross and Gin Gin nodes at least in 2021. Analysis is ongoing.
3. AEMO has re-assessed and updated the Burnie fault level requirements to incorporate new EMT models for existing wind farms
close to the node.
4. Tasmania system strength requirements were last determined in the November 2019 report (https://www.aemo.com.au/-/media/
Files/Electricity/NEM/Security_and_Reliability/System-Security-Market-Frameworks-Review/2019/Notice-of-Inertia-Fault-Level-
Shortfalls-Tasmania-Nov-2019.pdf), and reported for pre-contingency levels only. This 2020 SSI Report updates the Burnie pre-
and post-contingency values. More analysis is required to prepare the post-contingency values for the other Tasmania fault level
nodes. AEMO and TasNetworks use the pre-contingency values to inform the operational arrangements for system strength
requirements in Tasmania.
5. Victorian system strength requirements were previously determined in the 2018 requirements report
(https://www.aemo.com.au/-/media/Files/Electricity/NEM/Security_and_Reliability/System-Security-Market-Frameworks-Review/
2018/System_Strength_Requirements_Methodology_PUBLISHED.pdf) and then the November 2019 report
(https://www.aemo.com.au/-/media/Files/Electricity/NEM/Security_and_Reliability/System-Security-Market-Frameworks-Review/
2019/Notice_of_Victorian_Fault_Level_Shortfall_at_Red_Cliffs.pdf). A notice to market was also published in August 2020 about a
change to the post-contingency level at Red Cliffs (https://www.aemo.com.au/-/media/files/electricity/nem/security_and_
reliability/system-security-market-frameworks-review/2020/notice-of-change-to-red-cliffs-220kv-minimum-fault-level-
requirement-and-shortfall.pdf?la=en&hash=5C3EDDABDF81891B3989F6FF0466C486). This report incorporates the intervening
changes to the network and provides the pre- and post-contingency values.
AEMO 2020 | 2020 System Strength and Inertia Report 142.2 2020 inertia requirements
AEMO has applied the inertia assessment method in Section A2.2 to determine the inertia requirements in
the NEM, as documented in Table 3.
In this SSI Report, AEMO has updated the minimum threshold and secure operating levels of inertia for the
Queensland and Victoria regions. The South Australia secure operating level was updated in August 2020,
and the New South Wales and Tasmania levels have not been changed but are reported here for
completeness. AEMO has also assessed the South Australia and Victoria secure operating level as a ratio of
synchronous inertia and fast frequency response, to acknowledge the growing importance of the use of fast
frequency response.
Table 3 Inertia requirements in the NEM for 2020
Region 2018 inertia requirements 2020 requirements
Secure (megawatt Minimum (MWs) Secure (MWs) Minimum (MWs)
seconds [MWs])
Queensland 16,000 12,800 14,800 11,900
Victoria (note 1) 15,400 12,600 13,900 9,500
New South Wales 12,500 10,000 12,500 10,000
(note 2)
South Australia 6,000 4,400 Combination of 4,400
(notes 3, 4) synchronous inertia and
fast frequency response
(note 3)
Tasmania (note 5) 3,800 3,200 3,800 3,200
Notes:
1. Inertia requirements have been determined for Victoria incorporating fast frequency response capability provided by the
planned Moorabool 300 megawatts (MW) battery expected for commissioning by calendar year end 2021
(https://www.neoen.com/var/fichiers/20201104-neoen-mr-vbb-announcement.pdf).
2. Consistent with AEMO’s 2018 Inertia Requirements & Shortfall publication, islanding of New South Wales is not considered to be
likely, due to the diversity and number of AC interconnectors that exist between New South Wales and the adjacent regions.
3. Inertia requirements have previously been determined for South Australia in the Notice of South Australia Inertia Requirements
and Shortfall (https://aemo.com.au/-/media/files/electricity/nem/security_and_reliability/system-security-market-frameworks-
review/2020/2020-notice-of-south-australia-inertia-requirements-and-shortfall.pdf?la=en) published in August 2020. The
requirements determined in this notice remain unchanged for 2020.
4. In the Notice of South Australia Inertia Requirements and Shortfall (https://aemo.com.au/-/media/files/electricity/nem/security_
and_reliability/system-security-market-frameworks-review/2020/2020-notice-of-south-australia-inertia-requirements-and-
shortfall.pdf?la=en) published in August 2020, secure operating levels of inertia were determined for before and after the
installation of four synchronous condensers with flywheels in South Australia, an approved contingent project
(https://www.aer.gov.au/networks-pipelines/determinations-access-arrangements/contingent-projects/electranet-main-grid-
system-strength-contingent-project) due for completion by mid-2021. The required secure operating level of inertia for each
case is represented as a combination of MW of fast frequency response (FFR) and MWs of inertial response from synchronous
generators. Refer to Section 2.66 for further details.
5. Inertia requirements have previously been determined for Tasmania in the Notice of Inertia and Fault Level Shortfalls in Tasmania
(https://www.aemo.com.au/-/media/Files/Electricity/NEM/Security_and_Reliability/System-Security-Market-Frameworks-Review/
2019/Notice-of-Inertia-Fault-Level-Shortfalls-Tasmania-Nov-2019.pdf) published in November 2019. The requirements
determined in this notice remain unchanged for 2020.
2.3 Market projections
In this assessment, AEMO has built on the 2020 ISP outcomes and undertaken further market modelling to
reflect recent trends and emerging market conditions. This was used to project generation dispatch over the
coming decade for use in assessments of potential shortfalls. While the 2020 SSI Report shares all the
AEMO 2020 | 2020 System Strength and Inertia Report 15fundamental assumptions used in the 2020 ISP, it has also incorporated the latest minimum and maximum demand projections from the 2020 ESOO. Using these updated forecasts, AEMO has leveraged a time-sequential model to simulate three different projections relevant for system strength and inertia: • A traditional operations projection, applying announced retirement dates for synchronous generators in the NEM, or technical end-of-life dates where retirement dates are not announced. Changes to unit commitment profiles of existing thermal generation units are not considered. • A high renewable energy projection, with increased uptake of both utility-scale and distributed IBR resources that also incorporates earlier-than-announced unavailability of thermal generation. • A set of high renewable energy with flexible operation sensitivities, simulated for the financial year 2025-26 and 2029-30 with additional analysis of the potential impact of low market prices incentivising seasonal withdrawal or intraday decommitment of synchronous generation units. Further information on the market methodology and assumptions is available in Appendix A2.5. For New South Wales, Queensland and Victoria, all three sets of projections were used to assess any potential shortfalls. As the flexible operation sensitivities did not include any units in South Australia or Tasmania, only the traditional operations and high renewable energy projections were used to assess shortfalls in these regions. For the purpose of this report, only some projections are shown: • Where shortfalls are identified in all projections, the chart for traditional operations is shown. • Where no shortfall is identified in any projection, the chart for high renewable energy is shown. • Where shortfalls are identified in some but not all projections, the charts for traditional operations and the flexible operations sensitivities are shown. Each chart shows the results for 2021-22 to 2025-26, as well as the outlook to 2029-30 at the end of the forecast period. In addition, sensitivities are provided for flexible operation in 2025-26 to demonstrate the projected dispatch patterns that may potentially apply by 2025-26. 2.4 New South Wales outlook System strength or inertia shortfalls are not yet considered likely for New South Wales in the next five years, but system strength shortfall risks are increasing. There is growing evidence that changes in operation of major power stations could lead to system strength shortfalls in the centre of the region. AEMO will analyse future system strength and inertia requirements to support the transition of the New South Wales energy system. The system strength and inertia outcomes are heavily influenced by the potential for changes in operational profiles of coal-fired generation and increasing levels of distributed and utility scale IBR. The announced retirement of Liddell Power Station in 2023 is not expected to lead to system strength or inertia shortfalls in New South Wales. However, future decommitment or flexible operation of large synchronous generators at times of low or minimum demand in the region may lead to system strength shortfalls at the Newcastle and Sydney West fault level nodes. Reduction in online inertia in the New South Wales region will also result from decommitment or flexible operation. The timing, magnitude and likelihood of system strength shortfalls for Newcastle and Sydney West is uncertain. Before AEMO can form an assessment that a shortfall is reasonably likely, as required by the NER, more work is required to increase: • Technical certainty about the likelihood, size and scale of the potential shortfalls and their solutions. More detailed steady state and EMT analysis is required to understand the potential shortfalls, and to consider reallocating the fault level nodes in the New South Wales region to appropriately plan for the changing market dynamics in the region as significant new generation is commissioned in new areas of the state. AEMO 2020 | 2020 System Strength and Inertia Report 16
• Certainty around imminent withdrawal of synchronous generating units from the market at times of low
  demand. As more renewable generation is commissioned, there is growing evidence that synchronous
  generators may decommit more often and operate more flexibly, reducing provision of system services.
  The recently announced New South Wales Government policies are intended to accelerate the
  introduction of new renewable generation.
Declaration of any inertia shortfall for a region must also consider the likelihood of islanding. Consistent with
AEMO’s 2018 Inertia Requirements & Shortfall publication 16, islanding of New South Wales remains unlikely.
This finding is largely driven by the diversity and number of alternating current (AC) interconnectors that exist
between New South Wales and adjacent regions.
The remainder of this section provides commentary on the market and general network outlook for New
South Wales, and then gives details for system strength and inertia projections.

2.4.1           New South Wales market and network outlook
Key drivers that could affect future system strength and inertia availability in New South Wales are:
• In the ‘traditional operations’ projection, a drop from 12 thermal units operating to 10 thermal units in
  2029 due to Vales Point retiring at the end of its technical life.
• Risk of synchronous generating unit decommitment decisions as part of increased uptake of both utility-
  scale and distributed IBR and ongoing minimum demand reductions in the region.

Projected changes to numbers of synchronous machines online in New South Wales
Under the high renewable energy projection, analysis highlights the potential for a significant reduction in the
number of synchronous units online at certain times in New South Wales. This reduction in energy and
capacity could be met by new generation. However, system strength is locational, and the replacement
generation is in different locations with different technology. There will be an increasing need to replace the
system services provided by withdrawing synchronous generation, and possibly a revision of fault level nodes
at which system strength is assessed.
Figure 3 shows the expected number of central New South Wales coal units dispatched under the traditional
operations projection, the high renewable energy projection, and high renewable energy with flexible
operation sensitivities. The minimum number of machines from the successful synchronous combinations17 is
also shown.

16
     AEMO, 2018 Inertia Requirements Methodology, July 2018, at https://www.aemo.com.au/-/media/Files/Electricity/NEM/Security_and_Reliability/System-
     Security-Market-Frameworks-Review/2018/Inertia_Requirements_Methodology_PUBLISHED.pdf.
17
     Success criteria for synchronous machine combinations are listed in the AEMO System Strength Assessment Guidelines, June 2018, at https://aemo.com.au
     /-/media/files/electricity/nem/security_and_reliability/system-security-market-frameworks-review/2018/system_strength_requirements_methodology_
     published.pdf?la=en.

AEMO 2020 | 2020 System Strength and Inertia Report                                                                                                      17
Figure 3 Projections for number of synchronous machines dispatched in New South Wales
12
10
Number of units disptatched
8
6
4
2
0
0% 10% 20% 30% 40% 50% 60% 70% 80% 90% 100%
Percentage of time unit dispatch is exceeded
Traditional operation Flexible operation (NSW 2 units, QLD 4 units)
Flexible operation (NSW 2 units) NSW min requirement
Possible augmentations to reinforce supply to greater Sydney area
The possible reduction in the number of units online, combined with new generation remote from the major
load centre at Sydney, is expected to lead to the network reaching thermal and other system security
limitations at times of peak demand. The Sydney/Newcastle/Wollongong load centre reinforcement is
included in the 2020 ISP as a Future Integrated System Plan (ISP) Project, with further information on this
available in Appendix 3 of the 2020 ISP18. Solutions to address these limitations should consider both system
security and reliability needs holistically in the best long term interests of consumers, in alignment with
AEMO’s ISP objectives.
Future fault level node allocation
The share of IBR generation in New South Wales is projected to grow rapidly over the next decade,
particularly under the high renewable energy projection where earlier-than-expected withdrawal of
synchronous generating units could occur from the mid-2020s.
In each region, there are nodes related to the four fault level node classifications defined in the
Methodology19, which for New South Wales are detailed in Table 4. Each node has been agreed with the
relevant TNSP as being suitable to ensure the maintenance of power system security and the system
standards.
The node in New South Wales representing the synchronous generation centre is Newcastle. This node is
electrically close to the metropolitan load centre node of Sydney West. The requirements for each of these
nodes is set on the basis that a number of synchronous machines are required to maintain power system
security. As synchronous machines withdraw, the requirement to maintain the power system security may be
able to be decoupled from the requirement to maintain these nodes at their existing levels.
18
2020 ISP Appendix 3, Section A3.5.3, at https://www.aemo.com.au/-/media/files/major-publications/isp/2020/appendix--3.pdf?la=en.
19
System Strength Requirements Methodology 2018 and System Strength Requirements and Shortfalls 2018, at https://www.aemo.com.au/-/media/Files/
Electricity/NEM/Security_and_Reliability/System-Security-Market-Frameworks-Review/2018/System_Strength_Requirements_Methodology_PUBLISHED.pdf.
AEMO 2020 | 2020 System Strength and Inertia Report 18In 2021, AEMO will reassess the existing fault level nodes in New South Wales and determine whether new
fault level nodes should be introduced. AEMO will also update the minimum fault level requirements across
the region over time. Steady state and EMT analysis will be undertaken based on generation mix projections
in order to ensure that changes to the fault level nodes and requirements still ensure that power system
security and the power system standards are able to be maintained.
2.4.2 New South Wales system strength outlook
The system strength outlook for New South Wales is shown in Table 4. Each node includes information on the
fault level node class, relevant duration curves, whether the requirements are met now and at the end of the
outlook period, and comments regarding the requirements.
The results in Figure 4 to Figure 10 show that there is the risk of shortfalls under the high renewable energy
projection with flexible operation sensitivities at Newcastle and Sydney West. These potential shortfalls are
due to market modelling outcomes where synchronous machines, which are needed for the provision of
system strength and inertia, are not dispatched rather than there being an insufficient number of machines to
provide these services.
The remaining existing nodes in New South Wales are shown to at least meet their minimum requirements
for the outlook period to 2025-26.
For further details regarding the system strength analysis undertaken please refer to Appendices A2 and A4.
Table 4 New South Wales system strength outlook
Fault level Fault level Duration 2020 Requirements met Comments
node node class curves minimum
three phase
fault level
(MVA)
Pre- Post- Current Up to 2025-26
contingency contingency
Armidale • High IBR Figure 4 3,300 2,800 Yes Yes
330 kV
Darlington • High IBR Figure 5 1,500 600 Yes Yes Projections lower
Point than 2020 ISP
330 kV • Remote
values due to
from
Project
synchronous
EnergyConnect
generation
connection to
Dinawan.
Newcastle • Synchronous Figure 6, 8,150 7,100 Yes Yes, but some Possible shortfalls
330 kV generation Figure 7 risk of future result of
centre shortfall of decommitment or
500 MVA to flexible operation
1,600 MVA of coal units.
Sydney • Metropolitan Figure 8, 8,450 8,050 Yes Yes, but some Possible shortfalls
West load centre Figure 9 risk of future result of
330 kV shortfall of decommitment or
200 MVA to flexible operation
1,100 MVA of coal units.
Wellington • High IBR Figure 10 2,900 1,800 Yes Yes
330 kV
AEMO 2020 | 2020 System Strength and Inertia Report 19Figure 4 System strength outlook for Armidale under the high renewable projection
4,000
3,500
3,000
Fault Level (MVA)
2,500
2,000
1,500
1,000
500
0
0% 10% 20% 30% 40% 50% 60% 70% 80% 90% 100%
Percentage of time fault level is exceeded
2021-22 2022-23 2023-24 2024-25
2025-26 2029-30 Requirement
Figure 5 System strength outlook for Darlington Point under the high renewable projection
900
800
700
600
Fault Level (MVA)
500
400
300
200
100
0
0% 10% 20% 30% 40% 50% 60% 70% 80% 90% 100%
Percentage of time fault level is exceeded
2021-22 2022-23 2023-24 2024-25
2025-26 2029-30 Requirement
AEMO 2020 | 2020 System Strength and Inertia Report 20Figure 6 System strength outlook for Newcastle under the traditional operations projection
16,000
14,000
12,000
Fault Level (MVA)
10,000
8,000
6,000
4,000
2,000
0
0% 10% 20% 30% 40% 50% 60% 70% 80% 90% 100%
Percentage of time fault level is exceeded
2021-22 2022-23 2023-24 2024-25
2025-26 2029-30 Requirement
Figure 7 System strength outlook for Newcastle considering flexible operation
14,000
12,000
10,000
Fault Level (MVA)
8,000
6,000
4,000
2,000
0
0% 10% 20% 30% 40% 50% 60% 70% 80% 90% 100%
Percentage of time fault level is exceeded
Traditional operation Flexible operation (NSW 2 units, QLD 4 units)
Flexible operation (NSW 2 units) Requirement
AEMO 2020 | 2020 System Strength and Inertia Report 21Figure 8 System strength outlook for Sydney West under the traditional operations projection
14,000
12,000
10,000
Fault Level (MVA)
8,000
6,000
4,000
2,000
0
0% 10% 20% 30% 40% 50% 60% 70% 80% 90% 100%
Percentage of time fault level is exceeded
2021-22 2022-23 2023-24 2024-25
2025-26 2029-30 Requirement
Figure 9 System strength outlook for Sydney West considering flexible operation
14,000
12,000
10,000
Fault Level (MVA)
8,000
6,000
4,000
2,000
0
0% 10% 20% 30% 40% 50% 60% 70% 80% 90% 100%
Percentage of time fault level is exceeded
Traditional operation Flexible operation (NSW 2 units, QLD 4 units)
Flexible operation (NSW 2 units) Requirement
AEMO 2020 | 2020 System Strength and Inertia Report 22Figure 10 System strength outlook for Wellington under the high renewable projection
2,200
2,150
2,100
2,050
Fault Level (MVA)
2,000
1,950
1,900
1,850
1,800
1,750
0% 10% 20% 30% 40% 50% 60% 70% 80% 90% 100%
Percentage of time fault level is exceeded
2021-22 2022-23 2023-24 2024-25
2025-26 2029-30 Requirement
2.4.3 New South Wales inertia outlook
Using the inertia requirements determined in Section 2.2 and the shortfall projection and assessment
methods described in Section A2.2 and Section A2.4, AEMO has assessed whether there is likely to be an
inertia shortfall in the New South Wales region of the NEM, consistent with clause 5.20B.2 of the NER.
AEMO’s assessment has been made by using inertia projections derived from the traditional operations and
high renewable energy projections to calculate when the expected inertia online will not meet the inertia
requirements for more than 99% of the time20. In addition, in accordance with the NER requirements, AEMO’s
assessment includes consideration of the likelihood of islanding. Consistent with AEMO’s 2018 Inertia
Requirements & Shortfall publication21, islanding of New South Wales is not considered to be likely, due to
the diversity and number of AC interconnectors that exist between New South Wales and the adjacent
regions.
Figure 11 shows the projected inertia in New South Wales for the five-year outlook under the high renewable
energy projection, against the minimum threshold level of inertia and the secure operating level of inertia
(10,000 megawatt seconds [MWs] and 12,500 MWs respectively). Although the available inertia can be seen to
dip below the secure operating level in the final year of the outlook period, it is not for more than 99% of the
time.
As such, for the five-year outlook, AEMO projects no likely shortfall in either the minimum threshold level of
inertia or the secure operating level of inertia exists.
For further details regarding the inertia analysis undertaken, please refer to Appendix A5.
20
This level has been selected considering the risks of excessive numbers of directions in real time operations against a reasonable efficient level of potential
for intervention.
21
AEMO, Inertia Requirements Methodology, July 2018, at https://www.aemo.com.au/-/media/Files/Electricity/NEM/Security_and_Reliability/System-Security-
Market-Frameworks-Review/2018/Inertia_Requirements_Methodology_PUBLISHED.pdf.
AEMO 2020 | 2020 System Strength and Inertia Report 23Figure 11 Inertia outlook for New South Wales under the high renewable energy projection
70000
60000
50000
Inertia Level (MWs)
40000
30000
20000
10000
0
0% 10% 20% 30% 40% 50% 60% 70% 80% 90% 100%
Percentage of time inertia level is exceeded
2021-22 2022-23 2023-24 2024-25
2025-26 2029-30 Minimum Threshold Secure Level
2.5 Queensland outlook
System strength or inertia shortfalls are not yet considered likely for Queensland in the next
five years, but shortfall risks are increasing. There is growing evidence that changes in
operation of major power stations could lead to system strength shortfalls in the centre
and north of the region. AEMO will analyse future system strength and inertia requirements
to support the ongoing energy transition in Queensland.
The system strength and inertia outcomes for Queensland are heavily influenced by the potential for changes
in coal-fired generation operational profiles and increasing levels of IBR. Under the high renewable energy
projection and the high renewable energy with flexible operation projection:
• A reduced number of Central Queensland units online may lead to a system strength shortfall at Gin Gin.
When considering the possibility of intra-day decommitment, these shortfalls may occur sooner as well as
increase in duration and size.
• A reduced number of Southern Queensland units online may lead to a system strength shortfall at
Greenbank and Western Downs.
• This combined reduction in number of units online may lead to an inertia shortfall for the Queensland
region within the five-year outlook period.
The timing, magnitude and likelihood of system strength shortfalls for Queensland is uncertain. Before AEMO
can form an assessment that a shortfall is reasonably likely, as required by the NER, more work is required to
increase:
• Technical certainty about the size and scale of the potential shortfalls and their solutions. More detailed
steady state and EMT analysis is required to understand the potential shortfalls.
AEMO 2020 | 2020 System Strength and Inertia Report 24You can also read