The YouTube Marketing Communication Effect on Cognitive, Affective and Behavioural Attitudes among Generation Z Consumers - MDPI
←
→
Page content transcription
If your browser does not render page correctly, please read the page content below
sustainability

Article
The YouTube Marketing Communication Effect on
Cognitive, Affective and Behavioural Attitudes
among Generation Z Consumers
Rodney Duffett
 Marketing Department, Faculty of Business and Management Sciences, Cape Peninsula University of Technology,
 Hanover and Tennant Street, Cape Town 8000, South Africa; duffetr@cput.ac.za; Tel.: +27-021-460-3072

 Received: 29 May 2020; Accepted: 15 June 2020; Published: 22 June 2020

 Abstract: YouTube (YT) is the largest online video digital channel with more than 2 billion users,
 and over a billion hours of YT videos are viewed every day, particularly among young consumers.
 YT has become a massive marketing communication platform, which serves as a medium to target the
 lucrative Generation Z cohort (first born in the late 1990s), and influence this generation’s infamously
 unpredictable purchase decision process. The main aim of this paper was to consider the effect
 of YouTube marketing communication (YMC) on the traditional and non-traditional attitudinal
 associations of response hierarchy models. A multi-stage sample technique was used and 3750 high
 school and college learners (aged 13–18 years old) were surveyed via self-administered questionnaires
 in South Africa. Structural equation modelling was utilised to consider the hypothesised attitudinal
 associations. The research determined that YMC had a positive influence on the hypothesised
 attitudinal associations, and young consumers who used YT for fewer years, logged on more
 frequently, spent shorter time periods on the platform, viewed higher numbers of commercials,
 aged 13–14 years old, and from the White population group exhibited the most positive attitudinal
 responses. Hence, organisations should review their strategies in order to develop more sustainable
 YMC owing to the heterogeneity evident among young African consumers.

 Keywords: YouTube marketing communication; social media; hierarchy-of-effects model;
 Generation Z; attitudes; usage variables; demographic variables; developing country; South Africa

1. Introduction
     The tremendous explosion of online video digital channels (OVDCs) have provided
Generation Z with uninterrupted entertainment and, consequently, these digital information and
communication technology (ICT) conduits have largely replaced traditional television across the globe.
OVDC marketing communication (MC) expenditure is forecasted to increase twofold (to $37 billion)
over the next half a decade, and will reach an estimated 4.5 billion global users. Over a billion of hours
of YouTube (YT) videos are uploaded and viewed on a daily basis, especially by young consumers [1–5].
Younger cohorts, namely Generation Y (Millennials) and Generation Z are spending longer time
periods watching OVDCs via mobile devices [5]. Hence, over 65% of retailers plan to increase their
OVDC MC budgets, especially when targeting Generation Z (digital natives), since YT is the favourite
and fastest growing OVDC among these young consumers [2,6]. The Generation Z cohort spends
in excess of $142 billion and influences more than $600 billion of household purchase decisions on
an annual basis [7,8]. Therefore, it is vital that originations implement more sustainable YouTube
marketing communication (YMC) to target and positively influence young consumer attitudes and
the purchase decision process at all levels, especially since the Generation Z cohort is infamously
known to be difficult to maintain the attention of and reach with MC [9,10]. Therefore, Generation Z’s

Sustainability 2020, 12, 5075; doi:10.3390/su12125075                     www.mdpi.com/journal/sustainability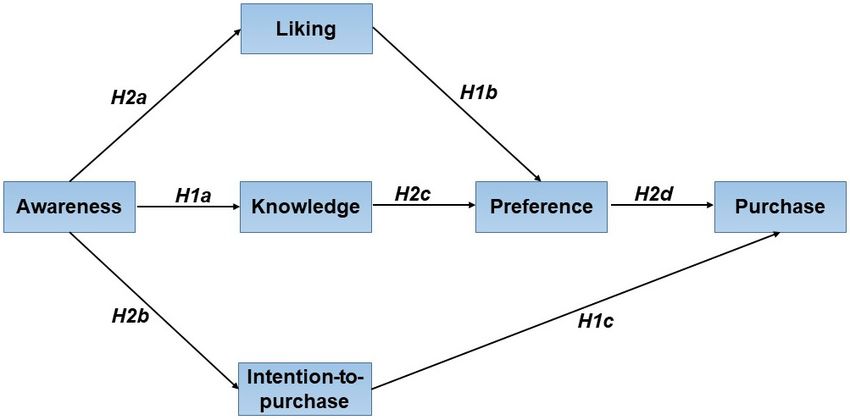
Sustainability 2020, 12, 5075                                                                       2 of 25

attitudes towards YMC are of significant interest to organisations and their brands, since a new body
of knowledge (pertaining to this cohort) will assist organisations in increasing their MC effectiveness,
as well as provide an inclination of future behavioural predispositions.
      Researchers and marketing practitioners have postulated many theories to evaluate the effect
of MC. Some maintain that MC is only successful effective if it results in sales [11], while others
believe that consumers go through several attitudinal phases prior to purchase, which may include
several of the following phases: attention, awareness, knowledge, comprehension, desire, liking,
preference, evaluation, retention, purchase intentions, acceptance, action, satisfaction, and others [12].
This investigation is in accord with the second theory, as consumers generally do not react
immediately, but take time to develop favourable predispositions towards brands prior to a behaviour
response (such as purchase). The hierarchy-of-effects model postulates that consumers go through
three attitudinal stages, viz. cognitive, affective, and conative (behavioural) in response to MC.
The hierarchy-of-effects model includes six hierarchical phases (two for each attitude stage), namely
awareness (cognitive), knowledge (cognitive), liking (affective), preference (affective), purchase
intention (behavioural), and purchase (behavioural) [13]. A number of other MC models were
developed to ascertain the attitudinal stages that consumers experience prior to purchase, but were
developed via traditional media MC [12,14–17]. Hence, there is a deficiency of theoretical evidence in
terms of the influence of OVDC (such as YT) MC on the aforementioned attitudinal associations.
      Subsequently, many recent empirical studies considered various aspects of YT usage, MC,
and consumer attitudes [18–55]. A number of research gaps were evident from these YT studies,
as well as in other digital ICT channel inquiries. Several researchers assert that there was insufficient
YMC information and research in order to use of this OVDC as an effective and sustainable MC
medium [21,22,32]. A majority of the above-mentioned inquiries only use usage and demographic
factors to describe the research, and do not examine the independent variables further. Hence, a number
of inquiries mandate that additional research should be conducted on YT usage and/or demographic
variables [20,25,30,56]. Westenberg [24], Kujur and Singh [40], Ahmad et al. [57], and Mukerjee
and Shaikh [58] indicate that increased sample sizes should be utilised in social media research.
Araújo et al. [26] and Stoilova et al. [59] assert that few studies quantitatively assess MC regarding
OVDC among young consumers (e.g., Generation Z). Viertola [4] and Westenberg [24] examined
Generation Z’s attitudes and behaviour in terms of YMC, but both of these inquiries used a qualitative
approach, which included sample sizes of 20 and 7, respectively. Several investigations also proposed
that different cohorts should be considered in terms of future social media research [46,47,54,60].
      A number of studies predominantly investigated Generation Y, which in many instances
comprised of student samples [21–23,25,27,28,30–34,38,39,41,43,44,46,47,54,55]. Several studies also
recommended that more diverse or different segments of YT users should be examined, especially
since university or college student samples diminished the possibility of generalizing the results
due to their unique situational context and life phases [22,29,35,40,46,47,54,57,61]. Additionally,
a majority of the aforementioned studies examined various YMC elements in developed countries,
especially in the United States (US) and Western Europe. Consequently, a number of researchers
maintain that there is a lack of social media and/or YT investigation in developing countries and/or
in different cultures [9,20,26,46,47,54,56,58,60,62–64]. Furthermore, a number of developing countries
are still experiencing rapid social media growth, whereas many developed countries are beginning to
reach saturation. The superior ICT infrastructure and faster Internet speeds in developed countries
may result in divergent usage and socio-cultural factors in comparison to developing countries
(especially in Africa) [1,54,65,66].
      Hence, the primary objectives of this research are to assess the effect of YMC on the several
attitudinal associations of response hierarchy models among the Generation Z cohort in South Africa
(SA), which is based on the attitude-to-advertising (Aad ) theoretical framework. The study also
seeks to determine if usage and demographic variables have an influence on the traditional response
hierarchy-of-effects model’s attitudinal associations. Furthermore, the usage and demographic variables’
Sustainability 2020, 12, 5075 3 of 25
investigation will reveal if heterogeneity exists in young cohorts, as directed by Zhang et al. [56] and
Bolton et al. [67].
2. Review of Literature and Development of Hypotheses
2.1. YouTube
YT is the largest OVDC with in excess of 2 billion users. Over a million hours of YT videos
are uploaded and viewed on a daily basis, with seven out of ten users using mobile devices to
view YT content [1,68]. This OVDC comprise of a number of user-generated content (UGC) videos
such as how-to-do, music, educational, and organisational content. YT was formerly created as an
entertainment and information video conduit, but has subsequently grown into a huge MC platform,
which includes channels, celebrity endorsers, influencers, YouTubers, promotions, advertising, product
placement, and testimonials. YT makes content available at no cost, since this video viewing channel
derives most of its income from MC, and has experienced steady growth with the rapid proliferation
of mobile devices [1,5]. YMC is a quick, targeted, controlled, and cost-effective means to sustainably
promote organisations and their brands, especially if the video content is topical. However, younger
consumers frequently find YMC to be intrusive, especially in developing countries where bandwidth
is expensive and slow, since it takes more time to stream for commercials. YT provides a number
of different MC types, which comprise of standard and display, discovery (in-search), overlay,
sponsored cards, and video bumper commercials. The video commercials are the commonly used by
organisations and their brands, which appear at the beginning and during YT videos. Many of these
commercials are skippable after five seconds, but others are not skippable, which can be 30 s in length or
longer [1,5,43,68,69]. Organisations can also use product placements, influencers, celebrity endorsers,
YouTubers, and testimonials to promote their brands, which are effective in reaching young consumers,
and assist in generating traffic and providing exposure for the organisations’ offerings [24,38,43].
Organisations can also upload their television commercials and other public relations material
via brand channels, which have changed the manner in which young consumers view commercials,
since these can be viewed at their leisure. YT brand channels have become cost-effective conduits,
since commercials can be uploaded at no cost, and could potentially be viewed by millions of young
consumers if they are sufficiently entertaining to go viral. Furthermore, YT provides comprehensive
analytics/metrics, whereby organisations can obtain detailed information regarding who is viewing
their channel content, as well as other MC content in terms of demographic, geographic, video usage,
and other consumer information [1,5,69–71]. However, many organisations have large MC budgets,
which are based on YT metrics, but lack important information about young consumers’ sequential
attitudinal responses that culminates in purchase decisions [71]. Several studies (as outlined in the
introduction) have considered the effectiveness of YMC via quantitative (surveys and analysis of
content) and qualitative (interviews and focus groups) approaches. Hence, this investigation utilised
the former approach, viz. a survey, to quantitatively assess Generation Z’s attitudinal associations
in terms of YMC in an African developing country, which will provide valuable information on the
attitudinal phases that occur prior to the ultimate purchase.
2.2. Generation Z Cohort
Generation Z was first born a couple of years prior to the turn of the century and onwards—this
cohort is the first true 21st century generation. This cohort has not known life without personal
computers, mobile devices, social media, the Internet and the omnipresent “search” (e.g., via Google).
The Generation Z cohort carry their technology with them and are continually connected, frequently
engaging in a range of activities at the same time, and have an incessant need for instant gratification
and technology dependence [72,73]. This cohort seeks to be continually connected, and Internet access is
considered to be a basic need, whereas increased speed is viewed as an effective digital conduit, which is
used to enhance efficiency and communication, particularly through mobile apps. Generation Z wantsSustainability 2020, 12, 5075 4 of 25
content to be instantaneously accessible in audio (e.g., podcasts) and video, as well as segmented
text to aid skimming, which is prevalently for online site reading (e.g., blogs and social media).
This generation is generally independent, individualistic, and ambitious, as well as exude diversity in
terms of culture, population group, gender, and sexual orientation [24,66,72,73]. Hence, organisations
should embrace these traits and incorporate this cohort’s uniqueness in developing more sustainable
MC, so as to support the diversity values that are prevalent among young consumers.
Two thirds of South African’s are younger than 36 years—Generation Z comprises 41% and
Millennials comprise 25%. Generation Z did not experience apartheid, and so are also known as the
“Born Frees”. This cohort has experienced rapid political, social, and economic change, which has
made this generation more resilient, ambitious, independent, and optimistic. A majority has the
highest education level in their households, and is pressured to succeed and make a contribution to
their families owing to better education and job prospects, notwithstanding apartheid’s long-lasting
negative socio-economic effect [74–76]. The oldest of the Generation Z cohort has recently completed
high school, and has either entered the job market or is at university. This generation has a significant
influence on household purchase decisions. The increased wealth of the “Black Middle Class” (formerly
known as “Black Diamonds”) has grown by more than 60% over the last decade (aided by Employment
Equity, Affirmative Action, and Broad-Based Black Economic Empowerment initiatives), which has
added to the purchasing power of this dynamic cohort [66,74,76,77].
South African Generation Z members are captivated by MC that enable them to co-create and
are more favourable disposed to organisations that allow them to make a decision, choose, and/or
vote. Young African consumers no longer scrutinise American or European trends on what to
purchase, but value and embrace present and future African culture, diversity, influences, intricacies,
and insights as differentiation points [66,73,76]. Stoilova et al. [59] affirm that studies are limited in
most countries, which consider the influence of YT among the Generation Z cohort. Balakrishnan and
Manickavasagam [20] assert that there is little information about demographical and usage influences
on attitudes in terms of social media MC. Furthermore, a majority of quantitative inquiries only
considered the influence of various YMC elements on Generation Y (Millennials), whereas the several
inquiries that did assess young consumers YT attitudes and behaviour, were qualitative in nature [4,24].
Hence, this study seeks to ascertain young consumer attitudes towards YMC, and to examine
the impact of YMC on usage and demographic variables on the Generation Z cohort’s attitudes in an
African developing country.
2.3. Consumer Attitudes and Hypothesis Development
As previously mentioned, a number of advertising frameworks were developed to evaluate
different attitude phases, which consumers go through before the ultimate purchase, but these
frameworks were formulated through traditional advertising. As mentioned in prior text, Lavidge
and Steiner [13] developed arguably the most famous response hierarchy frameworks, viz.
the hierarchy-of-effects model, which proposes different traditional attitudinal responses, namely:
first awareness and then knowledge (cognitive attitudinal responses); first liking and then preference
(affective attitudinal responses); and first intention-to-purchase and then purchase (behavioural
attitudinal responses). The attitude stages of the hierarchy-of-effects model are often equated to the
communications effects pyramid model, whereby consumers also go through phases, which ends
in purchase; however, it becomes incrementally more challenging to achieve the upper echelon
phases [12,78]. A number of organisations use one or more of the consumer attitudinal responses to
develop MC objectives.
Several recent studies use Ducoffe’s [79] advertising value attitude model and/or Brackett
and Carr’s [80] web advertising attitude model (or an adaption of these models) to consider
consumers’ attitudes regarding various online ICT channels, which include informativeness/knowledge
(cognitive attitudinal responses), entertainment (affective attitudinal responses), irritation, credibility,
and additional attitude elements [21,22,25,33,36,44,45,49,81]. Moreover, several other socialZ cohort.
• H1b. YMC has a favourable effect on the liking→preference association owing amid the Generation
Z cohort.
• H1c. YMC has a favourable effect on the intention-to-purchase→purchase association amid the
Sustainability 2020, 12,Z5075
Generation cohort. 5 of 25
Additionally, previous research on social media and other online ICT platforms only considered
media-related studies considered
the hierarchy-of-effects model in the various buyer
original behavioural
sequence, and wereresponses,
limitedastowell as purchase
the traditional intentions
associations
and/or purchase (behavioural attitudinal responses) [19,30,49,51,52,54,55,62,64,81–83].
between the attitudinal phases [46,47,54,84–97]. However, the attitudinal phases can be attained in a
However,
divergent a majority
sequence, of the
and several above-mentioned
other response hierarchy studies were
models, conducted
namely Wolfe in developed
et al.’s [98] AAPIS countries
model
(as
andmentioned
Aspinwall’sin[99]prior text), which
consumer acceptancehavetheory
begunhaveto reach social media
also emphasised the usage saturation,
importance whereas
of preference as
developing countries (particularly in Africa) are still experiencing steady
a mediator between cognitive and behavioural attitudinal responses [12,78]. The abovementionedsocial media usage growth,
which
theories is largely
proposedue to non-traditional
two the prolific growth of mobileresponses,
attitudinal devices [2,5,20,66]. Most of the aforementioned
namely knowledge→preference, and
studies sampled Generation Y (students), whereas few have quantitatively considered
preference→purchase. Each attitude phase of the response hierarchy frameworks should be attained, Generation Zs
A ad ainnumber
but terms ofofYT. There
phases canis theoretically
also a dearthbe ofaccomplished
quantitative research in terms
at the same time,of YMC,inwhich
and/or include
a different all
order
of
as the attitude
proposed byelements regarding
the original Lavidge andframework
hierarchy-of-effects Steiner’s [13] hierarchy-of-effects
[12,78,84,88–90]. However, modelthis among the
theory has
Generation
not yet beenZempirically
cohort. Hence, thisinstudy
tested termswill consider
of YT, so thethe traditional cognitive,
awareness→liking and affective, and behavioural
awareness→intention-to-
attitudinal associationswill
purchase associations among young
also be consumers
explored. due to
Therefore, YMC
this study(refer
willto Figure 1):
consider several non-traditional
attitudinal associations, which are outlined in the following hypotheses (refer to Figure 1):
• H1. YMC has a favourable effect on traditional attitudinal associations amid the Generation
• H2.
Z YMC has a positive effect on non-traditional attitudinal associations among the Generation Z
cohort.
• cohort.
H1a. YMC has a favourable effect on the awareness→knowledge association amid the Generation
• H2a.
Z Awareness has a positive effect on liking owing to YMC among the Generation Z cohort.
cohort.
•• H2b. Awareness has a positive
H1b. YMC has a favourable effect
effect on on
theintention-to-purchase owing to YMC
liking→preference association owingamong
amid thethe Generation
Generation
Z cohort.
Z cohort.
•• H2c. Knowledge
H1c. YMC has a positive
has a favourable effecteffect
on theonintention-to-purchase→purchase
preference owing to YMC among the Generation
association amid theZ
cohort.
Generation Z cohort.
• H2d. Preference has a positive effect on purchase owing to YMC among the Generation Z cohort.
Figure 1. Conceptual model of the proposed traditional and non-traditional attitudinal hypotheses.
Additionally, previous research on social media and other online ICT platforms only considered
the hierarchy-of-effects model in the original sequence, and were limited to the traditional
associations between the attitudinal phases [46,47,54,84–97]. However, the attitudinal phases
can be attained in a divergent sequence, and several other response hierarchy models, namely
Wolfe et al.’s [98] AAPIS model and Aspinwall’s [99] consumer acceptance theory have also
emphasised the importance of preference as a mediator between cognitive and behavioural attitudinal
responses [12,78]. The abovementioned theories propose two non-traditional attitudinal responses,
namely knowledge→preference, and preference→purchase. Each attitude phase of the response
hierarchy frameworks should be attained, but a number of phases can theoretically be accomplished
at the same time, and/or in a different order as proposed by the original hierarchy-of-effects
framework [12,78,84,88–90]. However, this theory has not yet been empirically tested in termsSustainability 2020, 12, 5075 6 of 25
of YT, so the awareness→liking and awareness→intention-to-purchase associations will also be
explored. Therefore, this study will consider several non-traditional attitudinal associations, which are
outlined in the following hypotheses (refer to Figure 1):
• H2. YMC has a positive effect on non-traditional attitudinal associations among the Generation
Z cohort.
• H2a. Awareness has a positive effect on liking owing to YMC among the Generation Z cohort.
• H2b. Awareness has a positive effect on intention-to-purchase owing to YMC among the Generation
Z cohort.
• H2c. Knowledge has a positive effect on preference owing to YMC among the Generation Z cohort.
• H2d. Preference has a positive effect on purchase owing to YMC among the Generation Z cohort.
2.3.1. Usage Variables’ Hypotheses
Many quantitative attitudinal YT inquiries only use usage variables as a means of sample
description, and did not perform cross-examine of these variables versus the attitudinal scales.
Duh and Struwig [66] and Zambodla [100] affirm that there are similarities from a worldwide viewpoint
among younger cohorts, but that there are also a number of differences, especially between the South
African and global counterparts. Bolton et al. [67] agree that further empirical investigation is required
to determine if usage variable heterogeneity exist within the younger cohorts. This study expands on
Duffett’s [88–90] MC research on social network sites and instant messaging among young consumers
(i.e., Generation Z), which considered access, number of years of usage, frequency, and durations of
log-on. Hence, several hypotheses will be outlined with regards to the influence of YT usage variables
on young consumers’ traditional attitude associations as a result of YMC.
Generation Z display the highest levels of sophistication owing to the pervasive smartphones and
other mobile multimedia devices, which are primarily used for viewing videos, posting pictures, instant
text messaging, playing online games, entertainment, social connection, seeking information, and
generally perceiving the world [10]. Smartphone ownership has steadily escalated in emerging nations,
especially among younger consumers. Two thirds of South African unique browsers coming from
mobile devices and 70% of YT views are derived from mobile devices. Young consumers are spending
longer time periods watching YT videos via the omnipresent mobile devices, but few have considered
whether computer access versus mobile device access have an influence on YMC [1,24,68,73]. A number
of studies investigated the influence of access on the cognitive, affective and/or behavioural attitudes
due to different social media conduits MC among the Generation Y and/or Z cohorts, which resulted in
divergent results. Several of these studies ascertained that access via mobile devices and/or mobile
apps gave rise to more positive attitudes [84,87–90,94–97] and other inquiries found that social media
access (i.e., computers versus mobile devices) did not have an influence on attitudes [85,86], but none
of the aforementioned investigations considered the influence of access due to YMC. Three recent
studies found that mobile devices resulted in more positive cognitive, affective and/or behavioural
attitudes among Millennials owing to YMC [46,47,54], but did not consider the Generation Z cohort.
For this reason, the study considers the following hypotheses:
• H3. The impact of traditional attitudinal associations differs based on how Generation Z
access YMC.
• H3a. The impact of the awareness→knowledge association differs based on how Generation Z
access YMC.
• H3b. The impact of the liking→preference association differs based on how Generation Z
access YMC.
• H3c. The impact of the intention-to-purchase→purchase association differs based on how
Generation Z access YMC.
Several studies only used YT experience (the number of years’ usage) to describe the research
sample [18,33,34,83]. A number of social media-related and YT investigations considered the effectSustainability 2020, 12, 5075 7 of 25
of experience on consumer attitudes among Millennials and the Generation Z cohort due to MC,
but produced mixed findings. Some studies established that less experienced consumers displayed
positive Aad [47,85,90], while some inquiries yielded the opposite result, in that more experienced
consumer displayed more positive Aad [46,54,84,88,89]. Other investigations determined that there
were no significant differences among consumer attitude due to YT and/or social media MC [86,87].
Therefore, the resulting hypotheses are as follows due to these diverse results:
• H4. The impact of traditional attitudinal associations differs according to the experience (years) of
the Generation Z cohort owing to YMC.
• H4a. The impact of the awareness→knowledge association differs according to the experience
(years) of the Generation Z cohort owing to YMC.
• H4b. The impact of the liking→preference association differs according to the experience (years)
of the Generation Z cohort owing to YMC.
• H4c. The impact of intention-to-purchase→purchase association differs according to the experience
(years) of the Generation Z cohort owing to YMC.
A number of investigations only used YT frequency of log-on to describe the research
sample [18,23,33,34,43,45]. Various social media-related and YT MC investigations found that frequency
of log-on gave rise to varied attitudes among Generation Y and Z. Several inquiries ascertained that
young consumers who logged-on more frequently displayed positive Aad [4,19,24,26,27,46,54,88],
while other studies resulted in converse findings with lower frequencies of log-on generating more
favourable Aad [46,54,84,88,89]. Some studies found no significant differences among young consumer
attitudes owing to social media and/or YT MC [86,87]. Hence, the ensuing hypotheses are as follows
owing to the mixed results:
• H5. The impact of traditional attitudinal associations differs according to the frequency of log-on
by the Generation Z cohort owing to YMC.
• H5a. The impact of the awareness→knowledge association differs according to the frequency of
log-on by the Generation Z cohort owing to YMC.
• H5b. The impact of the liking→preference association differs according to the frequency of log-on
by the Generation Z cohort owing to YMC.
• H5c. The impact of the intention-to-purchase→purchase association differs according to the
frequency of log-on by the Generation Z cohort owing to YMC.
Various studies only considered the duration of YT log-on in terms of descriptive
statistics [18,30,33,34,43,45,83]. Many social media-related and YT investigations ascertained that higher
durations led to the most positive Millennial and Generation Z attitudes [4,46,47,84–90,101]. Yet, some
inquiries determined that lower durations of log-on by the younger generations produced more
favourable Aad [21,26]. However, other research yielded no significant differences due to frequency of
log-on among young consumer attitudes due social media and/or YT MC [54]. Additionally, a study
reported that Millennials who spent between 1–3 h exhibited more positive attitudes towards YMC [20].
Therefore, the resultant hypotheses are as follows:
• H6. The impact of traditional attitudinal associations differs according to the duration of log-on
by the Generation Z cohort owing to YMC.
• H6a. The impact of the awareness→knowledge association differs according to the duration of
log-on by the Generation Z cohort owing to YMC.
• H6b. The impact of the liking→preference association differs according to the duration of log-on
by the Generation Z cohort owing to YMC.
• H6c. The impact of the intention-to-purchase→purchase association differs according to the
duration of log-on by the Generation Z cohort owing to YMC.Sustainability 2020, 12, 5075 8 of 25
Few YMC-related studies considered the number of YT commercials influence on young consumers’
attitudes. However, three recent inquiries established that a higher number of YT commercials (viewed
by the Generation Y cohort members) resulted in the most favourable cognitive, affective, and/or
behavioural attitudes due to YMC [46,47,54]. Yet, none of these studies investigated the Generation Z
cohort, so for this reason, the research considers the following hypotheses:
• H7. The impact of traditional attitudinal associations differs according to the number of YT
commercials viewed by the Generation Z cohort.
• H7a. The impact of the awareness→knowledge association differs according to the number of YT
commercials viewed by the Generation Z cohort.
• H7b. The impact of the liking→preference association differs according to the number of YT
commercials viewed by the Generation Z cohort.
• H7c. The impact of the intention-to-purchase→purchase association differs according to the
number of YT commercials viewed by the Generation Z cohort.
2.3.2. YouTube Demographic Variables’ Hypotheses
The Generation Z exhibit many analogous characteristics and traits around the world,
but developing nations generally have inferior digital ICT infrastructure compared to developed nations,
which may result in divergent attitudes owing to poorer social-economic conditions. Additionally,
there is also both a large disparity of wealth and in access to online platforms in many developing
countries. Hence, demographical variables may have an impact on the cognitive, affective and/or
behavioural attitudes due to YMC owing to heterogeneity within the Generation Z cohort in emerging
countries [20,66,67,100,102]. Furthermore, many YT studies frequently use demographic usage
variables (age, gender, population group, income and education) as a research description tool;
however, no cross-examination is performed regarding various attitudinal scales. Hence, this inquiry
endeavours to ascertain if several demographic variables effect young consumers’ traditional attitudinal
associations owing to YMC. Different investigations only used gender to describe the research
sample [4,18,19,23–25,30,33,35,44,45,48,50–52,55,103]. Males displayed more favourable attitudes
regarding social media and/or YT MC in a number of inquiries among Millennials [21,27,43,47],
whereas females were found to have more favourable in other studies [26,83–85,88–90]. Additionally,
no significant differences were determined by other research [32,46,49,54,86,87]. However, most of
these studies examined the Generation Y cohort and/or social media MC (not YMC), so the ensuing
hypotheses are as follows:
• H8. The impact of traditional attitudinal associations differs according to the gender of the
Generation Z cohort owing to YMC.
• H8a. The impact of the awareness→knowledge association differs according to the gender of the
Generation Z cohort owing to YMC.
• H8b. The impact of the liking→preference association differs according to the gender of the
Generation Z cohort owing to YMC.
• H8c. The impact of the intention-to-purchase→purchase association differs according to the
gender of the Generation Z cohort owing to YMC.
Bolton et al. [67] and Zambodla [100] posit that younger cohorts are heterogeneous, since older
cohort members are likely to exhibit divergent psychographic attributes, lifestyles, attitudes, values,
needs, interests, preferences, desires, consumption of media, and shopping tendencies in comparison
to their younger counterparts. Sharma [104] stresses that further inquiry should investigate
young cohorts Aad in terms of different MC formats across different age groups. Numerous
social media-related and/or YT studies only considered age as a descriptive research sample
factor [4,18,19,22–25,28,33–35,43–45,48,50–52,55,103,105], while other studies produced differing
findings among various age groups within the Generation Y and Z cohorts. Some social mediaSustainability 2020, 12, 5075 9 of 25
and/or YT studies established that younger age groups displayed more favourable Aad within
the Generation Y cohort [26,84], whereas older age groups exhibited more positive Aad in other
research [20,21,27,46,47,49,54]. Several studies found no significant differences between different age
groups within the Generation Y cohort [32,85–87]. Additionally, three social media MC inquiries found
that older age groups within Generation Z generational cohort showed more positive Aad [88–90],
but did not consider YMC. Hence, the subsequent hypotheses are considered by this study:
• H9. The impact of traditional attitudinal associations differs according to Generation Z’s age
owing to YMC.
• H9a. The impact of the awareness→knowledge association differs according Generation Z’s age
owing to YMC.
• H9b. The impact of the liking→preference association differs according Generation Z’s age owing
to YMC.
• H9c. The impact of the intention-to-purchase→purchase association differs according Generation
Z’s age owing to YMC.
SA is a culturally diverse country (referred to as “Rainbow Nation”), which has 11 official
languages and comprise of four main population groups, viz. Black (79.4%), Coloured (9.3%),
White (8.7%) and Asian/Indian (2.6%) [75]. However, Black South African consumers still have a
lower average income per capita compared to the other population groups due to the injustices of
apartheid era that ended a little over 25 years ago. However, as mentioned in prior text, there is
a fast growing “Black Middle Class” segment, which has captured the attention of organisations,
especially in terms of the younger cohorts, owing to their huge influence on household purchases and
growing purchasing power [7,8,66,74,76,102,106]. Several social media MC investigations used race
as a descriptive research variable among Millennials [19,23,25,44,50], while other inquiries generated
divergent findings. Black and Coloured consumers showed more positive attitudes in terms of social
media MC in several studies among the Generation Y and Z cohorts [84–86,88–90], whereas a studies
found that White consumers ethnic group displayed more positive attitudes [26]. Rodriguez [32]
found that race (Hispanic/Latinos versus Caucasians) had an influence YT advertising among US and
Dominican Republic Millennial respondents. However, none of these studies examined if race had
an impact YMC among the Generation Z cohort. Furthermore, a number of researchers suggested
that additional social media and/or YT inquiry was needed in other countries, especially owing to
cultural (or ethnic) group differences [9,20,26,56,58,60,62–64]. Therefore, the following hypotheses are
examined by this research:
• H10. The impact of traditional attitudinal associations differs according to Generation Z’s race
owing to YMC.
• H10a. The impact of the awareness→knowledge association differs according to Generation Z’s
race owing to YMC.
• H10b. The impact of the liking→preference association differs according to Generation Z’s race
owing to YMC.
• H10c. The impact of the intention-to-purchase→purchase association differs according to
Generation Z’s race owing to YMC.
3. Materials and Methods
3.1. Sampling and Data Collection
A multi-stage sample technique was utilised, which comprised of 13–18 year old college and
high school learners who used and observed YMC. Firstly, Western Cape Province was selected
in SA. Secondly, systematic sampling was used to select 25 colleges and/or high schools from the
Western Cape Education Department’s (WCED) list (ethical clearance was received from the WCED
and Cape Peninsula’s University of Technology ethics committee). Thirdly, appointments were madeSustainability 2020, 12, 5075 10 of 25
telephonically to conduct the research (the next school on the WCED list was selected if a school
declined to grant permission to perform the survey). About 160 learners from each college and high
school, who had used and observed YMC, were chosen to partake in the research on a voluntary
basis [107].
Twelve fieldworkers (roughly one per two schools/colleges) gathered the data through the
self-administered questionnaires, which resulted in a very good response rate, since the fieldworkers
waited for the respondents to fill-out and submit the completed questionnaires [108]. However, the
study was completely anonymous and confidential since no names or contact particulars were gathered,
so it was not possible to follow-up on respondents. Consequently, 50 incomplete questionnaires were
discarded. Hence, in this manner 3750 self-administered questionnaires were fully completed by
college and high school learners, which adequately represented the Western Cape’s research population
in terms of demographic variables (gender, age and race) [109]. The broad range of the research
objectives (hypotheses) necessitated the large sample size. Table 1 offers a summary of usage and
demographic descriptive statistics of the South African Generation Z respondents.
Table 1. Usage and demographic variable frequencies.
Usage Variables n %
Mobile device 1430 38.1
Access PC 428 11.4
Mobile device and PC 1892 50.5
≤1 year 512 13.7
2 years 890 23.7
Experience (years) 3 years 977 26.1
4 years 643 17.1
≥5 years 728 19.4
Daily 2428 64.7
2–4 times a week 663 17.7
Frequency of log-on Once a week 343 9.1
2–4 times a month 170 4.5
Once a month 146 3.9
≤1 h 1351 36.0
2h 962 25.7
Duration of log-on 3h 549 14.6
4h 300 8.0
≥5 h 588 15.7
None 1333 35.5
1–5 824 22.0
YT commercial viewership # 6–10 634 16.9
11–15 397 10.6
≥16 562 15.0
Demographic variables
Male 1831 48.8
Gender
Female 1919 51.2
13–14 808 21.5
Age 15–16 1370 36.5
17–18 1572 41.9
White 901 24.0
Black 1060 28.3
Race
Coloured 1519 40.5
Indian/Asian 270 7.2Sustainability 2020, 12, 5075 11 of 25
3.2. Measures
A questionnaire, which was self-administered, was suitable for this study, since no detailed written
responses were required. All of the questions were close-ended and could be physically disseminated
to a large number of respondents without much explanation [107]. The questionnaire was adapted from
Duffett’s research on social media MC among the Generation Z cohort [88–90], which included two filter
questions and three main sections. The filters questions determined if respondents had used YT and
were exposed to MC on this OVDC. Section 1 collected data regarding respondents’ YT media usage
variables (independent variables) via multiple-choice questions, which included: how YT was accessed,
YT experience (years), YT frequency of log-on, duration of log-on, and YT commercial viewership
(numbers) (refer to Table 1). Section 2 included six Likert scale constructs, namely awareness
(four-item), knowledge (four-item), liking (six-item), preference (six-item), intention-to-purchase
(four-item), and purchase (six-item) (refer to Table 2). Section 3 collected data regarding Generation
Z’s respondents’ demographic variables (independent variables) through multiple-choice questions,
which included gender, age, and race (refer to Table 1).
Table 2. Attitudinal stages (factor loadings, AVE, CR, and Cronbach’s α).
Attitude Stages Factor Loadings AVE CR Cronb.’s α
Awareness
YMC are effective in creating awareness of brands 0.734
YMC alerts me to new company offerings 0.800
0.550 0.829 0.743
I have become aware of new YMC 0.806
YMC get my attention towards certain brands 0.611
Knowledge
Ads on YT are effective in providing information about brands 0.690
YMC are a good source of knowledge 0.790
0.585 0.849 0.775
I use YMC to find new information about products 0.830
YMC provide me with valuable product knowledge 0.730
Liking
YMC has made me like the brands more 0.757
YMC adds to the enjoyment of using YT 0.818
YMC are likeable and pleasant 0.800
0.546 0.877 0.851
YMC are entertaining and fun 0.806
YT has a positive influence on me liking advertised products 0.644
YMC has made me like the products more 0.574
Preference
I look for products that are advertised on YT 0.660
YMC are relevant to me and my interests 0.680
Ads on YT are effective in stimulating my preference in brands 0.790
0.536 0.874 0.838
YMC are effective in gaining my interest in products 0.790
I prefer brands that are promoted on YT 0.760
YMC have a positive effect on my preference for brands 0.707
Intention-to-purchase
I will buy products that are advertised on YT in the near future 0.819
I desire to buy products that are promoted on YT 0.861
0.541 0.821 0.725
YMC increase purchase intent of featured brands 0.626
I would buy products that are advertised on YT if I had the money 0.599
Purchase
I purchase products that are featured on YT 0.634
YMC positively affect my purchase behaviour 0.755
Ads on YT help to make me loyal to the promoted products 0.810
0.565 0.885 0.848
YMC favourably affect my purchase actions 0.840
I purchase products that are promoted on YT 0.780
YMC positively affect my buying actions 0.660Sustainability 2020, 12, 5075 12 of 25
4. Results and Data Analysis
4.1. Measurement Model
Confirmatory factor analysis (CFA) was used to assess to the various validity and reliability factors
of the measurement model via IBM’s SPSS and AMOS. The appropriateness of the principle component
factor analysis was assessed via a sampling adequacy test, namely the Kaiser-Meyer-Olkin (KMO) test.
The KMO value was 0.865, which is indicative of good reliability of the factors. The Bartlett’s Test of
Sphericity was significant at 0.000, which is also indicative of robust factor analysis [110]. The reliability
of the attitudinal constructs was evaluated by means of Cronbach’s Alpha (α) and composite reliability
(CR) measurement values. Table 2 shows that Cronbach’s α values were between 0.725 and 0.851
and the CR values ranged from 0.821 to 0.885, which all exceeded the universally accepted reliability
measure score of 0.70 as suggested by Bagozzi and Yi [111]. Hence, all six attitudinal constructs
exhibited acceptable reliability. Next, the attitudinal constructs’ convergent validity was considered by
assessing factor loadings and the average variance extracted (AVE). The scores of the factor loadings
were 0.574–0.861, and the AVE scores were 0.536–0.585, which is suggestive of convergent validity as
the scores were all above 0.5 as suggested Bagozzi and Yi [111].
Discriminatory validity was assessed by comparing the square root of AVE values for each attitude
construct against the other construct correlations. Table 3 shows that all construct AVE square root
values were larger than correlation values, which is indicative of discriminant validity [112].
Table 3. Correlations between attitude constructs and square root of AVE.
Awareness 0.742
Knowledge 0.430 0.765
Liking 0.119 0.548 0.739
Preference 0.329 0.163 0.448 0.732
Intention-to-purchase 0.035 0.141 0.048 0.429 0.736
Purchase 0.047 0.110 0.113 0.327 0.244 0.751
The hypothesised relationships between the attitude constructs were investigated through
structural equation modelling (SEM), and multi-group SEM, which was used to consider the influence of
the usage and demographic variables on the traditional response hierarchy-of-effects model attitudinal
associations. The goodness-of-fit statistics was assessed via seven model-fit measures, and all the indices
produced a very good fit, according to Hooper’s [113] minimum acceptable thresholds, in terms of the
hypothesised SEM model indices (χ2 /df = 1.199, RMSEA = 0.007, NFI = 0.992, TLI = 0.998, CFI = 0.999,
GFI = 0.994, and SRMR = 0.014). A configural invariance test obtained adequate goodness-of-fit statistics
(χ2 /df = 1.199, RMSEA = 0.007, NFI = 0.992, TLI = 0.998, CFI = 0.999, GFI = 0.994, and SRMR = 0.018)
via the analysis of the freely estimated model over multi-groups.
A metric invariance test was used to constrain the two models to be equal and the chi-square
difference test between the fully constrained and unconstrained models showed them to be invariant
(p = 0.932). The data for the research was gathered from the self-reported responses of the Generation
Z sample. Therefore, a bias test (common method) was executed to compare the common method
factor (CMF) (unconstrained) model to the zero CMF (constrained) model. The chi-square test showed
that there was a significant different at p < 0.05; hence, the unconstrained CMF model was used,
as there was significant variance that was shared. The Cook’s Distance measure was used to establish if
outliers were evident regarding Generation Z’s attitudinal responses, however there were no responses
that exhibited abnormal Cook’s Distance. A multi-collinearity test was conducted to assess if the
attitude constructs were overly correlated with each other, which would adversely influence the reliable
estimates of the regression coefficients [114]. The tolerance was greater than 0.1 (0.545–0.994) and the
variation inflation factors were less than 3 (1.006–1.834) for the all of attitude constructs, which showed
that the attitude constructs were not overly correlated with each other.Sustainability 2020, 12, 5075 13 of 25
4.2. Hypothesis Testing
The path coefficients for the SEM and multi-group SEM, in considering the hypotheses,
are evaluated below.
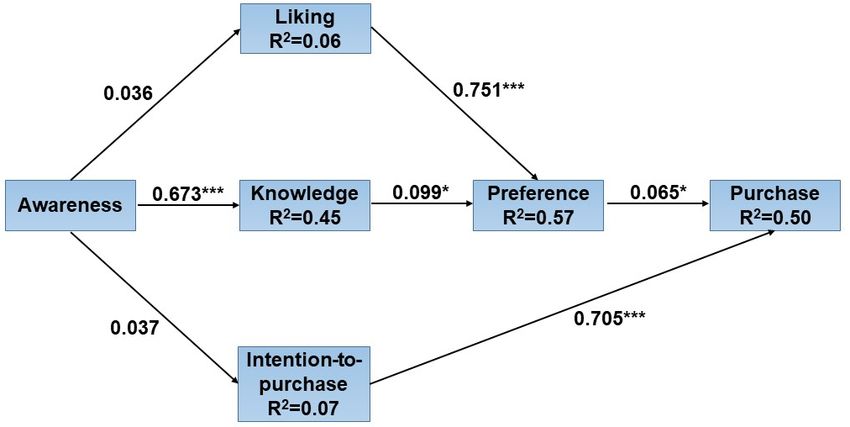
• H1: Traditional attitudinal associations. Figure 2 exhibits the SEM analysis in terms
of significance, standardised path coefficients, and variance for the attitudinal association
Sustainability 2020, 12, x FOR PEER REVIEW 14 of 25
hypotheses. The standardised path coefficients showed significant positive influences for:
awareness→knowledge
standardised path coefficients (β = 0.673, p < 0.001),
also revealed liking→preference had
that intention-to-purchase (β = a positive < 0.001),
0.751, pinfluence
andonintention-to-purchase→purchase
purchase for White (β = 0.733, p < (β = 0.705,
0.05) < 0.001)
versuspBlack (β =traditional attitudinal
0.674, p < 0.05) associations.
young consumers.
Therefore,H1a,
Therefore, H10aH1b,and H10c werewere
and H1c supported, while(refer
supported H10b to
was not supported.
Figure 2). Additionally, 45% of the
variance due to knowledge was elucidated by awareness amid Generation Z owing to YMC.
Refer to Table 4 for an overview of the significance and standardised beta coefficients of YT
Knowledge
demographic variablesand liking onwere found attitudinal
traditional to explain 57% of preference’s
associations variance,
and Table 5 for anand preference
overview and
of the
intention-to-purchase
hypothesis testing results.explained 50% of a purchase’s variance.
Figure
Figure 2. 2. Significant
Significant standardisedcoefficients.
standardised Notes:* *==significant
coefficients.Notes: significantatat0.05, ** == significant
0.05,*** significant at 0.001.
0.01
(N/A), *** = significant at 0.001.
• H2: Non-traditional attitudinal associations. No significant influences were found for the
Table 4. Significance(β
awareness→liking and= standardized (β = 0.037)variables
beta coefficients of YouTube usage and demographic
0.036) and awareness→intention-to-purchase standardised
on the traditional cognitive, affective, and behavioural attitudinal associations.
path coefficients. However, the standardised path coefficients revealed significant positive
influences for: knowledge→preference (βAwareness→ = 0.099, p < 0.05), and preference→purchase
Liking→ (β = 0.065,
Intention-to-
Independent Variables
p < 0.05) non-traditional attitudinal associations. Accordingly, H2a and H2b were not supported,
Knowledge Preference Purchase→Purchase
β
Usage Variables
whereas H2c and H2d were supported (refer Sig
to Figure 2). β Sig β Sig
Mobile device (1) 0.655 0.740 0.694
• Access
H3: Access. The standardised path coefficients
PC (2) 0.647 indicated
- that the devices
0.766 - used to access
0.738 - YT did
not have a significant
Mobile deviceinfluence
and PC (3) on the0.694
traditional cognitive 0.756(awareness→knowledge),
0.708 affective
≤1 year (1) 0.694 p < 0.05 0.747
(liking→preference), and behavioural (intention-to-purchase→purchase) attitudinal associations 0.725
2 years (2) 0.691 (1)–(3) 0.740 0.700
Experience
due to YMC. Hence,3 years (3)H3a, H3b, and H3c were not supported.
0.647 0.731 - 0.704 -
(years)
• H4: Experience (years).
4 years (4) The standardised
0.682 ppath coefficient
< 0.001 0.761 indicated that 0.691 awareness had a
≥5 years (5)
favourable effect on knowledge amid0.660 (1)–(5)
young consumers 0.783
who used YT for 0.709
≤1 year (β = 0.694,
Daily (1) 0.687 0.757 0.707
p < 0.05 and p2–4 < 0.001) versus
times a week (2) those who
0.641 used YT for 3 years
0.757 (β = 0647, p <
0.6780.05) and ≥5 years
Frequency of p < 0.05 p < 0.05 p < 0.05
(β = 0.660, pSustainability 2020, 12, 5075 14 of 25
YT once a week (β = 0.717, p < 0.05). Additionally, the standardised path coefficients revealed that
intention-to-purchase had a positive influence on purchase for young consumers who logged-on
2–4 times a month (β = 0.765, p < 0.05) versus those who logged-on 2–4 times a week (β = 0.678,
p < 0.05). Consequently, H5a, H5b, and H5c were supported.
• H6: Duration of log-on. The standardised path coefficient revealed that the awareness→knowledge
association was more positive amid young consumers who spent ≤1 h (β = 0.710, p < 0.05) versus
those who spent 3 (β = 0618, p < 0.05) and 4 (β = 0.593, p < 0.05) h logged-on to YT. So, H6a was
supported, whereas H6b and H6c were not supported.
• H7: Number of YT commercials viewed. The standardised path coefficient indicated the
liking→preference association was more positive for young consumers who viewed 1–5 (β = 0.766,
p < 0.05), 6–10 (β = 0.763, p < 0.05), and ≥16 (β = 0.775, p < 0.05) versus those who viewed
no (β = 0.689, p < 0.05) YT commercials. The standardised path coefficients also revealed that
intention-to-purchase had positive influence on purchase for young consumers who viewed 11–15
(β = 0.733, p < 0.05) versus those who viewed no (β = 0.730, p < 0.05) YT commercials. Accordingly,
H7a was not supported, while H7b and H7c were supported.
Refer to Table 4 for an overview of the significance of YT usage variables on traditional attitudinal
associations and Table 5 for an overview of the hypothesis testing results.
Table 4. Significance and standardized beta coefficients of YouTube usage and demographic variables
on the traditional cognitive, affective, and behavioural attitudinal associations.
Awareness→ Liking→ Intention-to-
Independent Variables
Knowledge Preference Purchase→Purchase
Usage Variables β Sig β Sig β Sig
Mobile device (1) 0.655 0.740 0.694
Access PC (2) 0.647 - 0.766 - 0.738 -
Mobile device and PC (3) 0.694 0.756 0.708
≤1 year (1) 0.694 p < 0.05 0.747 0.725
2 years (2) 0.691 (1)–(3) 0.740 0.700
Experience
3 years (3) 0.647 0.731 - 0.704 -
(years)
4 years (4) 0.682 p < 0.001 0.761 0.691
≥5 years (5) 0.660 (1)–(5) 0.783 0.709
Daily (1) 0.687 0.757 0.707
2–4 times a week (2) 0.641 0.757 0.678
Frequency of p < 0.05 p < 0.05 p < 0.05
Once a week (3) 0.531 0.717 0.736
log-on (1)–(3) (4)–(3) (4)–(2)
2–4 times a month (4) 0.682 0.820 0.765
Once a month (5) 0.665 0.778 0.633
≤1 h (1) 0.710 0.759 0.723
2 h (2) 0.657 0.732 0.702
Duration of p < 0.05 - -
3 h (3) 0.618 0.741 0.686
log-on (1)–(3 & 4)
4 h (4) 0.593 0.751 0.667
≥5 h (5) 0.698 0.766 0.711
None (1) 0.689 0.730 0.689
1–5 (2) 0.643 0.766 p < 0.05 0.702
YT commercial
- p < 0.05
6–10 (3) 0.718 0.763 (2, 3 & 0.731
viewership # (4)–(1)
11–15 (4) 0.647 0.733 5)–(1) 0.733
≥16 (5) 0.646 0.775 0.699
Demographic variables
Male (1) 0.669 - 0.754 - 0.717 -
Gender
Female (2) 0.677 0.748 0.694
13–14 (1) 0.717 0.724 0.742
p < 0.05 - p < 0.05
Age 15–16 (2) 0.675 0.757 0.691
(1)–(2 & 3) (1)–(2)
17–18 (3) 0.649 0.756 0.694
White (1) 0.717 0.726 0.733
p < 0.05
Black (2) 0.646 0.765 - 0.674 p < 0.05
Race (1)–(2, 3 &
Coloured (3) 0.658 0.752 0.710 (1)–(2)
4)
Indian/Asian (4) 0.639 0.756 0.693Sustainability 2020, 12, 5075 15 of 25
Table 5. Hypothesis testing.
Hypothesis Sub-Hypothesis Significance Support
H1a p < 0.001 Yes
H1 H1b p < 0.001 Yes
H1c p < 0.001 Yes
H2a - No
H2b - No
H2
H2c p < 0.05 Yes
H2d p < 0.05 Yes
H3a - No
H3 H3b - No
H3c - No
H4a p < 0.001 Yes
H4 H4b - No
H4c - No
H5a p < 0.05 Yes
H5 H5b p < 0.05 Yes
H5c p < 0.05 Yes
H6a p < 0.05 Yes
H6 H6b - No
H6c - No
H7a - No
H7 H7b p < 0.05 Yes
H7c p < 0.05 Yes
H8a - No
H8 H8b - No
H8c - No
H9a p < 0.05 Yes
H9 H9b - No
H9c p < 0.05 Yes
H10a p < 0.05 Yes
H10 H10b - No
H10c p < 0.05 Yes
• H8: Gender. The standardised path coefficients indicated that gender did not result in a significant
effect on the cognitive, affective and behavioural attitudinal associations of young consumers due
to YMC. Hence, H8a, H8b, and H8c were not supported.
• H9: Age. The standardised path coefficient indicated that the awareness →knowledge was more
favourable for young consumers who were aged 13–14 (β = 0.717, p < 0.05) versus those who
were aged 15–16 (β = 0.675, p < 0.05) and 17–18 (β = 0.649, p < 0.05) years. The standardised
path coefficients also revealed that intention-to-purchase had a positive influence on purchase
for young consumers who were aged 13–14 (β = 0.742, p < 0.05) versus those who were aged
15–16 (β = 0.691, p < 0.05) years. Consequently, H9a and H9c were supported, whereas H9b was
not supported.
• H10: Race. The standardised path coefficient indicated that the awareness→knowledge association
was more favourable for young White consumers (β = 0.717, p < 0.05) versus young Black
(β = 0.646, p < 0.05), Coloured (β = 0.658, p < 0.05), and Indian/Asian (β = 0.639, p < 0.05)
consumers. The standardised path coefficients also revealed that intention-to-purchase had a
positive influence on purchase for White (β = 0.733, p < 0.05) versus Black (β = 0.674, p < 0.05)
young consumers. Therefore, H10a and H10c were supported, while H10b was not supported.You can also read