A comparative study of Bot Detection techniques methods with an application related to Covid-19 discourse on Twitter.
←
→
Page content transcription
If your browser does not render page correctly, please read the page content below
A comparative study of Bot Detection techniques
                                        methods with an application related to Covid-19
                                                     discourse on Twitter.
arXiv:2102.01148v1 [cs.SI] 1 Feb 2021

                                               Marzia Antenore∗1 , José M. Camacho-Rodrı́guez                           †2
                                                                                                                               ,
                                                             Emanuele Panizzi‡2

                                         1
                                             Department of Communication and Social Research, Sapienza University of
                                                                            Rome
                                                 2
                                                   Department of Computer Science, Sapienza University of Rome

                                                                                Abstract
                                                    Bot Detection is an essential asset in a period where Online Social
                                                Networks(OSN) is a part of our lives. This task becomes more relevant
                                                in crises, as the Covid-19 pandemic, where there is an incipient risk of
                                                proliferation of social bots, producing a possible source of misinformation.
                                                In order to address this issue, it has been compared different methods to
                                                detect automatically social bots on Twitter using Data Selection. The
                                                techniques utilized to elaborate the bot detection models include the
                                                utilization of features as the tweets’ metadata or the Digital Fingerprint
                                                of the Twitter accounts. In addition, it was analyzed the presence of
                                                bots in tweets from different periods of the first months of the Covid-19
                                                pandemic, using the bot detection technique which best fits the scope of
                                                the task. Moreover, this work includes also analysis over aspects regarding
                                                the discourse of bots and humans, such as sentiment or hashtag utilization.

                                        1       Introduction
                                           According to [47], a bot is a socio-technical entity based on a software program
                                        whose aim is to simulate human behavior in Online Social Networks(OSN) such
                                        as Facebook, Twitter, or Instagram. Bots are configured to resemblance as
                                        humans not just to other human users, but also to the OSN platform [28].
                                        Through different methods such as Artificial Intelligence (AI), bots interpret
                                        the situation and react accordingly [28]. These entities can cause malicious
                                             ∗ marzia.antenore@uniroma1.it
                                             † camachorodriguez.1848773@studenti.uniroma1.it
                                             ‡ panizzi@uniroma1.it

                                                                                     1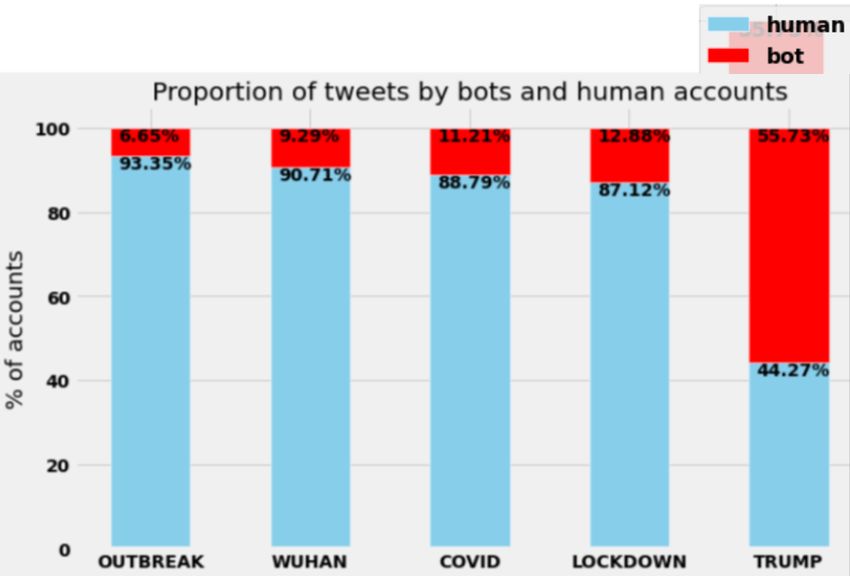
effects as influencing in changing the online practices of human users and their
practices in Social Networks[47], producing a detrimental impact on politics.
There is proof that social bots are crucial in the propagation of fake news and
misinformation [26] [45][42] [66]. Moreover, as the bots improve how to simulate
the human behavior, the line between the human user and this socio-technical
entity becomes less clear [28], causing concern in the participation of bots in
political events because of the negative effect on the quality of democracy [63].
This fact has motivated the development of many bot detection techniques
during the last few years[27], not always being successful in completely solving
the problem [28].
    This work focuses on Twitter. Some studies estimated that around 15%
of the accounts on Twitter operates automatically or semi-automatically[44].
One reason which might have stimulated the rise of the number of bots is the
characteristics of Twitter[28]. Moreover, it is worth mentioning that a bot in
Twitter is regarded as a credible source of information [40]. In addition to
this, bot operated accounts can be more 2.5 times more influential than human-
operated accounts [69]. The two previous facts combined with the capacity of
bots to impersonate themselves as humans might produce events that impact
politics negatively influencing public opinion, and thus, affecting drastically
democratic processes [31]. In particular, a significant amount of bots has been
used as fake followers of politicians to generate a false impression of popularity
[45] or utilized by regimes to spread propaganda [51]. Other studies show that
social bots influenced discourse in social media during Brexit Referendum [30],
2017 French presidential election campaign[42], 2016 US Presidential Election
[51], or 2014 Venezuelan protest [45]. Another research also displays that bots
influenced the public discourse regarding climate change [70].
    This research is developed in the context of Covid-19 pandemic, a situation
which have concluded in social and economic disruption, apart from the worst
economic downturn since the Great Depression [12]. In addition, work, public
events, sports, conferences and education system have been greatly affected by
social distancing measures who forced people out of their comfort daily routines
and face-to-face interactions. Social Networks such as Twitter have become
fundamental to allows people to stay connected and to share information, opinions
and reactions around COVID-19. As social interaction moves more and more
online, it becomes crucial to study the activity of automated accounts that could
alter public debate on central issues such as government policy, public health and
individual decision-making in an undesirable fashion. Furthermore, many studies
show that bots accounts play a crucial role in the spread of misinformation in
Twitter[12]. As a consequence, spotting the bots is the first step in order to
implement measures to protect the quality of democratic processes.
    At the time of this writing, there are already many studies that have analyzed
the public discourse on the Covid-19 pandemic on social network sites [33]. Some
of them looked at emotional and sentiment dynamics on social media conversation
around pandemic related topics[53][46]. Others have focused primarily on bot
accounts detection aiming to describe their behavior, in contrast with human
activity, and their focal topics of discussion [43].

                                        2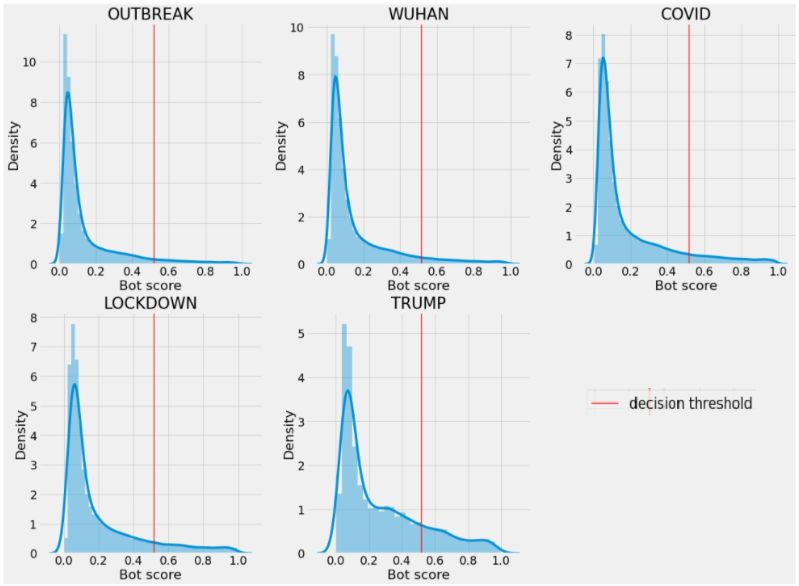
In this work, we provide the following contributions: First and foremost, it is
made a comparison between supervised bot detection methods from literature,
using the metadata of a Twitter account as well as extracting information from
the Social Fingerprint of the accounts using compression statistics. Besides, these
methods has been implemented using the data selection technique, in which it
will be found a subset of training data which provides a consistent model with
the best balance for cross validation and cross-domain generalization[65]. The
methods implemented will be compared with Botometer v3, which was available
until September 2020 and it was used in several studies [67]. In addition, it was
analysed the presence of bots in tweets from different periods of the first months
of the Covid-19 pandemic, using the bot detection technique which best fits the
scope of the task. Moreover, this work includes also analysis over other aspects
as the distribution of bots and differences on the discourse between bots and
humans based on the sentiment and hashtags.
    Roadmap. In Chapter 2, we comment on the literature reviewed to
develop this work and summarize its contributions. In Chapter 3, we make a
comparison between the approaches presented in [75] and [65], implementing
a data selection technique for both of them and using several classification
algorithms. Moreover, the bots and human accounts are depicted utilizing some
of the features computed for prediction. Eventually, the models implemented are
compared with Botometer version 3. In Chapter 4, we analyze the presence
of bots in specific periods of the first months of the pandemic. Then, we study
differences in the sentiment between bots and humans in the periods studied.
In Chapter 5, we discuss some points about the research and draw some
conclusions.

2    Literature review
   Political manipulation for social bots has occurred worldwide, provoking
an increasing interest in bot detection in the last decade [34]. Along this
time, both supervised and unsupervised techniques have been implemented to
overcome this task. Unsupervised methods are more robust than supervised ones
because they do not rely on ground truth quality. Research in [52] introduces
CATCHSYN, an unsupervised bot detection algorithm based on a Graph mining
approach. This technique allows capturing bots through measures of normality
and synchronicity, which allows detecting rare and synchronized behaviors. The
advantages of this algorithm are scalability and no need for parameters or labeled
data. CATCHSYN presents linear-complexity regarding the graph size and only
makes use of topology features for the detection. The research in [62] also
presents an unsupervised method. It uses features extracted from the retweeting
patterns of the accounts. These features are used with a clustering algorithm
to distinguish between bots and humans. Besides, they introduce RTT plots,
an informative visualization to observe suspicious behaviors in the retweeting
patterns of Twitter accounts. These visualizations need less information than
others proposed in literature like [52] and [48].

                                        3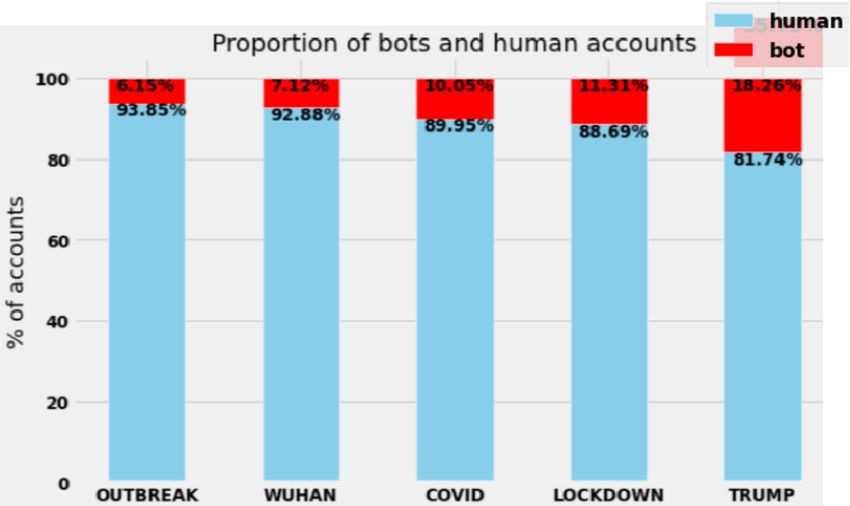
Supervised methods, though they might have generalization issues, are exten-
sively used for bot detection [34]. In [72], it is presented a supervised method
with more than 1000 features related to user metadata, friends, network, tem-
poral, content, and sentiment. This research concluded in the first version of
Botometer, a bot detection service available online. [74] presents an update of
that version. This update added new features to the model and included new
training datasets containing other types of bots. In this way, the researchers
were able to cope, at least temporally, with the paradigm shift of bots[35] and
the effort of bot developers to evade detection techniques[34]. This improvement
corresponded to the third version of Botometer, available through its API until
the end of August 2020. This version, highly used through its API by users
[74], was included in several studies [67] and considered as a state-of-art method
for bot detection [74]. We use this tool in part of our experiments. Then,
[71] introduces Botometer version 4. This research proposes an Ensemble of
Specialised Classifiers. This approach consists of generating specific models for
bot-operated accounts with different behaviors and then combine them through
an ensemble and a voting system. It aims to deal with performance decrease
when the training data present accounts with different behaviors. This alterna-
tive avoids retraining the model with a vast amount of data, which would be
costly. Another problem that supervised methods may have is the lack of labeled
data. [56] presents a way to deal with this possible lack of data. This research
uses data generation to create training data to feed a model that combines
tweets’ metadata with its content through an LTSM neural network. Using
language-related features may provoke performance reduction when the models
evaluate accounts interacting on other languages. Models in [54] and [61] address
this issue, focusing on building language-independent models. The model in
[54] used the tweets ’ metadata to determine if an account is a bot or human.
The research in [61] also introduces one method that is language-independent,
which uses expressive account-based and content-based features. Others setbacks
that can face supervised models are interpretability and noisy training data.
Interpretability is an issue in ML algorithms, which may fall in the black-box
metaphor, not letting humans understand the intermediate processes between
an input and an output. The study in [59] approaches this issue extracting
the features applying the contrast-pattern technique on aspects of the accounts
such as usage, information, content-sentiment, or tweet content. Through this
method, the model implemented is interpretable, enabling humans to understand
why an account is classified as bot or human. Data noise in training data is a
problem that may provoke a reduction of performance in a bot detector. [75]
uses a data selection technique to tackle this. This technique consists of choosing
a subset of training data to optimize the performance of the model. It is an
excellent method to maximize the existing available resources giving optimal
results. Besides, in this research, it is presented a scalable classifier with 20
features. Scalability is essential when analyzing OSN because of the high volume
of data. For our experiments, we make use of this method. Research in [64]
also introduces a scalable supervised model. It utilizes partial information of
an account and its corresponding tweet history to detect content polluters in

                                        4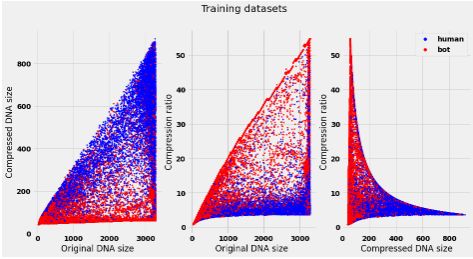
real-time.
    As previously mentioned, bot detection is an evolving field because as soon
as a new method appears, malicious bot developers work to beat it. Intending
to detect the evolving trend of bots exposed in [35], research in [36] introduces
the Social Fingerprinting technique. Social Fingerprinting models the online
behavior of an account using the Digital DNA. Digital DNA is a string that
encodes the different types of account interactions. Research in [36] presents how
to exploit Social Fingerprinting in both a supervised and unsupervised fashion
using Lowest Common Substring(LCS) as a similarity measure between DNA
strings. [38] utilizes the former method to overcome a bot detection analysis
over stock microblogs on Twitter. [55] and [65] present supervised models that
uses Digital DNA. [55] employs Statistical Measures for Text Richness and
Diversity to extract the features from the Digital DNA. [65] applies a lossless
compression algorithm to the DNA string to obtain compression statistics as
features. These features allow separating bot accounts and human-operated
accounts, even permitting to visualize the division. Part of our work aims to
combine this method with the data selection technique to build a robust method
to detect bots across several domains.
    Existing literature studied bot presence during the Covid-19 pandemic, such
as [43]. The study described and compared the behavior and discussion topics of
bots and humans. Alternatively, other works analyzed the discourse during the
Covid-19 pandemic on Online Social Networks(OSN). For instance, [53] and [46]
studied emotional and sentiment dynamics on social media conversation around
pandemic related topics.

3     Implementation of bot detection models and
      comparison
    In this section, all the details about bot detection are explained. First, it is
exposed how the features for bot detection were obtained and the different sets
of features used. Then, the datasets used for training and test are presented.
Moreover, the accounts from all the datasets are represented regarding a set of
the features computed for bot detection. Finally, a comparison is made between
the results of the different models implemented using a data selection technique
and Botometer.

3.1    Feature engineering
    The features that we use for bot detection model can be split into two groups:
those obtained and derived from the metadata of each account and the variables
obtained through the Social Fingerprint technique using compression statistics.
    The first approach consists of using as features for detection the metadata of
each account, and new variables derived from the raw metadata. The metadata
is retrieved from the User Object related to each account. The features retrieved
directly from the User Object are:

                                         5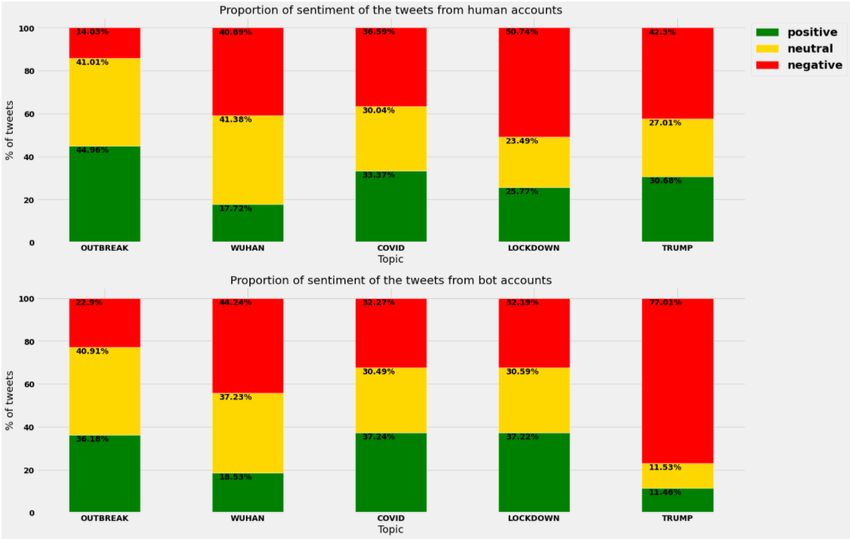
• statuses count: number of tweets posted, including retweets.
   • followers count: number of followers.
   • friends count: number of accounts followed.
   • favourites count: number of tweets liked by the account.

   • listed count: number of public lists in which the account is involved.
   • default profile: boolean indicating if the profile’s theme or background has
     been altered.
   • verified : boolean indicating that the user has a verified account.

    To compute some derived features from the metadata, the variable user age is
used. user age corresponds to the difference in hours between the creation time
of the last tweet accessible (probe time) and the creation time of the user[75].
The features derived from the metadata of the User Object are:
   • screen name length: length of screen name string.
   • num digits in screen name: number of digits in screen name string.

   • name length: length of name string.
   • num digits in name: number of digits in name.
   • description length: length of description string.
   • friend growth rate: friends count/user age

   • listed growth rate: listed count/user age
   • favourites growth rate: favourites count/user age
   • tweet freq: statuses count/user age

   • followers growth rate: followers count/user age
   • followers friend ratio: followers count/friend count
   • screen name likelihood : It corresponds to the geometric mean of the likeli-
     hood of all bigrams in a screen name. More than 2 million unique screen
     names from random accounts of Twitter were retrieved to compute the
     likelihood of each one of the 3969 bigrams which can be created using
     the characters allowed in the screen name (Upper and lower cases letters,
     digits and underscore).

                                       6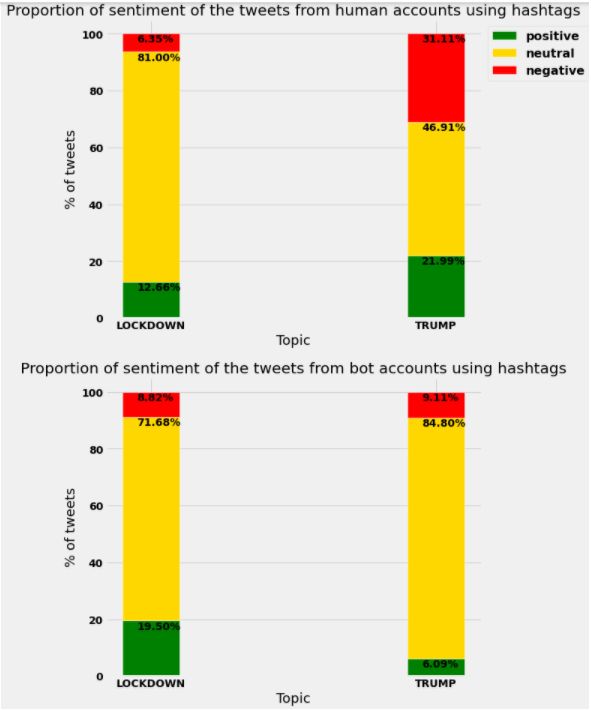
The intuition behind screen name likelihood is that the screen name of bot
operated accounts sometimes are constituted by a random string [75], being this
a distinctive characteristic from humans.
The second approach, Social Fingerprinting, is a technique that consists of
modeling the behaviour of an account through the Digital DNA, which is a
string of characters based on the sequence of actions of a Twitter account. This
string is produced encoding the behaviour through a mapping between the sort
of interactions and characters or bases producing a DNA string. These bases
form a set of unique characters called the alphabet. The alphabet is used to
generate a sequence represented by a row vector or string which encodes a user
behaviour [36]. More formally, an alphabet B is defined as [65]
B = {B1 , B2 , . . . , BN } Bi 6= Bj ∀i, j = 1, . . . , N ∧ i 6= j
which is utilised to generate a sequence whose expression is
s = (b1 , b2 , . . . , bn ) = b1 b2 . . . bn bi ∈ B ∀i = 1, . . . , n
For our experiments, the following alphabet is used to encode a Twitter user
behaviour:
A ← tweet
B3type = C ← reply = {A, C, T}
T ← retweet
The behaviour of a Twitter account is captured through its timeline and it
is utilised to generate the DNA sequence. For instance, if an account x first
did a retweet, then two tweets and finally a retweet, its sequence utilising B3type
is T AAT . From here, it is implied that the length of the sequence depends
on the number of tweets which are considered. In our case, we retrieved the
maximum possible number of tweets(including retweets and replies) for each
account, having the 3200 most recent tweets as a limit because of Twitter API
restrictions[21]. The accounts which are protected or not possess any timeline
cannot be analysed with this methodology.
The DNA sequences generated from the timelines are compressed using
a lossless compression algorithm. Then, we compute the following features
original size of DNA string, compressed size of DNA string and compression
ratio (original DNA size/compressed DNA size).
For our experiments we use the set of features listed below:
• The features extracted and derived from the User Object previously intro-
duced. This set of features is denoted as Light.
• The original size of the DNA string and the compressed size of the DNA
string. This set of features is referred as A.
• The original size of the DNA string and the compression ratio. This set is
denoted as B.
• The compressed size of the DNA string and the compression ratio. This
set is referred as C.
7• The original size of the DNA string, the compressed size of the DNA string
and the compression ratio. This set is denoted as D.
The set light corresponds to the features used for bot detection in [75] with
the exception that it is not included the feature profile use background image
since it has been deprecated from the Twitter API [23]. This set of features
allows implementing a scalable bot detection technique since each tweet retrieved
with the Twitter API (versions 1.1 and Gnip 2.0)[39] contains the User Object
of the corresponding account, with no need of obtaining extra data.[75] However,
this sort of approach can be vulnerable to adversarial attacks [34]. The set
of features A, B, C and D are based on the research in [65]. This technique
provides a detection model which is more resistant against adversarial attacks
[65], but scales worse.
3.2 Datasets
In this section, the datasets used for the implementation of the bot detection
model are presented. Following the procedure in [75], we used some datasets
for train and other datasets are set aside for testing. In this way, we expect to
build a bot detection model that not just performs properly in cross-validation
on the data used for training, but also generalises well when it is used for
accounts displaying new behaviours, obtaining cross-domain validation. Most
of the datasets have been obtained from https://botometer.iuni.iu.edu/
bot-repository or in other public repositories online.
The datasets used for training are:
• Caverlee: To form this dataset, honeypots accounts were used to attract
bot-operated accounts, mainly consisting of spammers, malicious, promot-
ers, and friend infiltrators. This dataset was presented in [58].
• Cresci-17 : The dataset was constructed using human annotators, labeled
accounts from other datasets, and bot accounts purchased in online markets.
The bots in this dataset include retweets spammers for political campaigns,
hashtags spammers, URL spammers, job promoting bots, fake followers,
and URL scammers. The dataset is used in [35].
• Varol : The dataset was built annotating several accounts manually from
different deciles of Botometer scores. It was first used in [72].
• Pronbots: The dataset was first shared in GitHub by a researcher in May
2018. The bots are Twitter advertising scam sites. It was used in [74].
• Political : It consists of politics-oriented bots that were shared by Twitter
user @john emerson. It was extracted from [74].
• Botometer-feedback : It is made of those accounts which were annotated
manually after been reported by Botometer users. It is used in [74].
8• Vendor-purchased: It is uniquely composed of bots that play the role of
fake followers. These accounts were bought by researchers from several
companies. This dataset is used in [74].
• Celebrity: This dataset, composed uniquely by human accounts, was
extracted from [75]. It was created by selecting Twitter accounts from
celebrities.
Social
User Object
Fingerprinting
Training datasets
Human Bot Human Bot
botometer feed 347 108 337 107
varol 1525 690 1331 668
political 0 13 0 13
cresci 17 2907 5925 2440 5607
celebrity 5814 0 5763 0
vendor 0 731 0 718
pronbots 0 1899 0 1723
caverlee 15211 14619 12824 14156
Table 1: Number of bot and human accounts in each training dataset. It is
displayed the number of accounts for the cases where we use the features from
the User Object and the Social Fingerprint.
The datasets used for test are:
• Botwiki : This dataset consists of 704 bot operated accounts. It is formed
from active Twitter bots from botwiki.org. On this website, internet
users can find an archive with self-identified bots. It is utilised in the
research conducted in [75].
• verified : It is composed of human-verified user accounts extracted through
the Twitter streaming API. It is utilised in [75].
• Rtbust: The dataset was created manually annotating the retweets retrieved
from the last 12 days of June 2018. It was extracted from [62].
• Stock : The bot operated accounts were detected through similarities in
timelines of accounts that contain tweets with specific cashtags in a five
months period in 2017. In [37] and [38], it is found the study through
which the bot-operated accounts were detected and details about these
accounts. The bots in this dataset present a coordinated behaviour.
• Gilani : The dataset was formed retrieving accounts with the Twitter
Streaming API and splitting them into four groups regarding its followers.
Then, accounts from each group were extracted and annotated manually.
The dataset was used in [49].
9• Midterm: The dataset is composed of accounts that interacted during 2018
U.S. Midterm elections. The accounts were manually annotated as bot
and human through the correlation between the tweeting timestamp and
creation timestamp. The dataset is utilised in the research conducted in
[75].
• Kaiser : The accounts labeled as human correspond to those belonging to
American and German politicians under the assumption that all are human-
operated. On the other hand, the bot operated accounts are manually
annotated for German accounts and extracted from botwiki.org in the
case of English bots. This dataset was used in [67].
The botwiki and verified datasets are considered together during the test as
the botwiki-verified. It is worth to mention that the datasets used for training are
the same that in [75], whilst for testing, the datasets stock and kaiser are added
to the datasets already used in [75]. Including two more datasets for testing, we
want to test the models with other bots with different natures.
In Table 1 and Table 2 the number of bot and human accounts which
constitutes each dataset for the train and test is displayed . The tables are
divided between user object and Social Fingerprinting because, as mentioned
before, it is not possible to use DNA methods with those accounts which are
protected or do not have timeline. Even though there are differences in the
number of accounts in most of the datasets, these differences are thought not
to be big enough to be misleading when the user object and Social Fingerprint
approaches are compared.
Social
User Object
Fingerprinting
Test Dataset
Human Bot Human Bot
Rtbust 332 321 317 314
Gilani 1418 1043 1293 997
Kaiser 1007 290 959 232
Botwiki-verified 1985 685 1974 610
Midterm 7416 37 7290 32
Stock 6132 6964 5333 6246
Table 2: Number of bot and human accounts in each training dataset. It is
displayed the number of accounts for the cases where we use the features from
the User Object and the Social Fingerprinting.
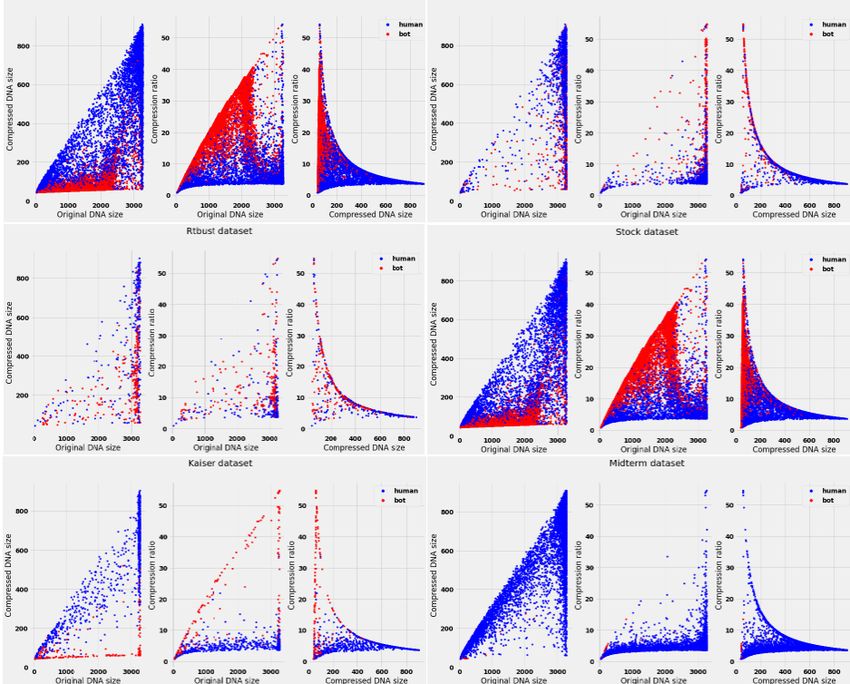
3.2.1 Visualizing the datasets through compression statistics
Following the approach of [65], we elaborate 2-D scatterplots representing
the accounts in the datasets used in our work through the compression statistics.
Figure 1 displays all the datasets used for training represented by the three
10combinations of compression statistics. Figure 2 conveys the same with each one
of the test datasets.
Figure 1: Scatterplot representing accounts in train datasets through compression
statistics.
Figure 2: Scatterplot representing accounts in test datasets through compression
statistics.
These plots intend to show that these features are not just useful to separate
humans from the bots from a specific dataset, but it can be generalised to more
cases. In fact, in most of the datasets, it is observed that there is a division
between the bot and human-operated accounts.
Besides, it is worth to mention the case of stock dataset. In this dataset, the
bots have a coordinated nature that makes inconvenient feature-based classifiers
11to detect them[75]. However, looking at the scatterplot it seems that compression
statistics achieve to separate both types of accounts. These plots can give us
hints about the predictive power of models using these features for detection.
3.3 Comparison between different Bot detection models
using Data Selection
According to learning theory, using as much data as possible to train a model
will provide the best models if the following conditions are met [75]:
• The labels of the train data are correct.
• The data considered is independent and identically distributed in the
feature space.
In case these conditions are not met, a data selection method can be employed.
This method aims to encounter a subset of training data that will optimise the
cross-validation performance on the training data and the ability of generalization
on unseen data[75]. Data selection techniques have shown satisfactory results
in different domains with data with noise and contradictory labels[73] [41] [76].
The data selection technique will be used over the training data. Specifically,
all the different combinations of train datasets are used, which supposes 247
different combinations.
Then, for each combination of datasets, each one of the sets in section 3.1 is
used with the following classification algorithms: Logistic Regression, AdaBoost,
Support Vector Machine with Linear Kernel, Random Forest, Gradient Boosting,
K Nearest Neighbors (KNN), Naive Bayes, Multilayer Perceptron (MLP). Each
possible combination is evaluated in all the test datasets using the AUC score.
Using several classification algorithms, we intend to make a more intensive search
to find the best performing model in [75], not just using combinations of datasets
but also adding classification algorithms to the equation.
The MLP is composed by one hidden layer in the case of the set of features
A,B,C (120 neurons) and D(150 neurons), and two hidden layers in the case of
Light(300 and 200 neurons). We use the default hyperparameters of the library
sklearn for the other algorithms.
For the rest of the section, we will denote model as the vector of the form
(x, y, z); x ∈ X, y ∈ Y, z ∈ Z
where X corresponds to the set composed by the 247 possible combinations of
training datasets, Y is the set formed by all the classification algorithms and Z
is the set formed by the set of features Light, A, B, C, D.
We created 9880 different models, based on 247 train datasets, 8 algorithms,
and 5 sets of features. Through our heuristic process, we selected 5 of them, i.e.
the best model for each set of features. The process is the following:
1. We group the models by feature set (obtaining 5 groups), and in each
group we validate each of the 247×8=1976 models against all the 6 test
sets (AUC score).
122. We create a ranking for each test set in each group (6 rankings per group;
in each one every model gets a value in the range 1..1976 based on its AUC
score), and then we compute the sum of the 6 ranking values obtained by
each model (1976 sums per group)
3. For each algorithm in each group, we take the model which has the lowest
sum of the rankings (8 models per group)
4. In each group we select manually the best performing model out of the
8 lowest-sum-models based on the AUC scores on the test sets and on
its 5-fold cross-validation value. We based our selection primarily on the
results of the test, always looking that the model performs well overall.
However, in the case of similar results on the test datasets and considerable
difference in the cross-validation (around 8%) or slight signs of overfitting,
we prioritize the cross-validation.
This heuristic will provide a model that is not the best in every single test
but works properly in all the test datasets. In this way, stability in applications
is ensured.[75]
AUC Scores
Feature Training
Model Botwiki-
set dataset Rtbust Gilani Kaiser Midterm Stock 5-fold
verified
botometer feed,
Gradient varol,
Light 0.613 0.631 0.944 0.991 0.964 0.631 0.961
Boosting cresci 17,
celebrity
Logistic political,
A 0.700 0.719 0.943 0.991 0.962 0.922 0.957
Regression cresci 17
botometer feed,
Gradient
B political, 0.720 0.726 0.938 0.991 0.961 0.858 0.968
Boosting
cresci 17
Random political,
C 0.660 0.691 0.927 0.980 0.944 0.863 0.968
Forest cresci 17
Logistic botometer feed,
D 0.699 0.719 0.944 0.991 0.962 0.924 0.945
Regression cresci 17
Table 3: Best model for each set of features with their 5-fold cross validation
and their performance in each test set.
In Table 3, the best models according to our heuristic for each set of features
are shown, along with the AUC score of the models in each test dataset and 5-fold
cross-validation. We observe that the models with the features obtained through
Social Fingerprint outperform or obtain similar results that the Light model in all
the cases. The stock dataset is where the DNA models outperform more evidently
the Light model, with the model with the set of features D obtaining the best
result. This is because the bots in the stock dataset showed a coordinated
behaviour that makes a feature-based model as Light not convenient for their
detection [75], while as evidence shows the Social Fingerprint together with
13compression statistics is an effective method to detect bots with a coordinated
behaviour. Besides, we observe that the data selection technique is efficacious
since none of the best models for each set of features used all the train datasets.
3.3.1 Comparison with Botometer
We made a performance comparison of the best models with the sets of
features Light and D with Botometer. Botometer is an online social tool for
bot detection. For the experiments, Botometer version 3 was used, which was
available until the end of August 2020 through its API. Botometer version 3
has been used in several studies in literature and it has even been contemplated
as the state-of-the-art tool for the detection of bots in Twitter [71]. It is
a supervised model, specifically, it uses a Random Forest as a classification
algorithm. Botometer v3 uses more than 1000 features from each account
related to different fields such as the content of the tweets, its sentiment, the
network of the account, or the user metadata [72]. This model has been trained
in the following datasets: caverlee, varol,cresci-17,pronbots,vendor,botometer-
feed,celebrity and political [72].
The three models present some significant differences. Both Botometer v3
and the model Light use features extracted from the account, whereas the model
with D needs to construct the Digital DNA from the timeline of an account for
prediction. Another difference is the number of features that use each model
to classify an account. While Botometer v3 uses more than 1000 features, the
model with Light utilises 19 features and D uses 3. However, the main difference
between all the models comes with scalability: while the model with Light allows
to analyse accounts at the same pace that the tweets are retrieved, the other
models need to cope with Twitter API rate limits since they need to retrieve
the timeline of each account for classification, making them not scalable for the
Twitter streaming. In this experiment, apart from the AUC score, the following
metrics are used to measure the performance of each model: F1, Accuracy, Recall,
Precision, and Specificity. To compute the previous metrics is necessary to set a
classification threshold. In the case of the Botometer v3, following research [60],
0.3 is used as the threshold to separate humans from bots. That is to say, if the
probability of an account to be a bot is greater than 0.3, then it is classified as a
bot. This probability will also be referred as bot score. In the case of the model
with the set of features D and Light, as done in [75], it is used as threshold
the bot score that maximizes the F1 metric, maximizing precision and recall
simultaneously.
In Table 4, the performance of the three models is displayed. We observe
that the model with the set of features D performs consistently well overall,
outperforming or obtaining similar results to the other two models. It is worth
to mention the good performance of the model with D in the stock dataset,
where it performs the best. This gives evidence that the compression statistics
extracted from the Digital DNA can detect bots that behave coordinately as
happens in stock. Moreover, by combining D with data selection is possible to
build a classifier that can generalise properly in different domains. Alternatively,
14Test Evaluation metrics
Model
Dataset AUC F1 Accuracy Recall Precision Specifity
Light 0.990 0.916 0.960 0.857 0.985 0.995
Botwiki-
D 0.991 0.917 0.960 0.936 0.899 0.968
verified
Botometer 0.922 0.785 0.905 0.685 0.920 0.980
Light 0.631 0.274 0.615 0.172 0.681 0.941
Gilani D 0.718 0.508 0.670 0.390 0.726 0.886
Botometer 0.689 0.456 0.644 0.341 0.687 0.880
Light 0.944 0.817 0.919 0.807 0.827 0.951
Kaiser D 0.944 0.683 0.837 0.901 0.550 0.822
Botometer 0.829 0.594 0.827 0.572 0.617 0.899
Light 0.964 0.176 0.964 0.784 0.099 0.964
Midterm D 0.962 0.051 0.859 0.875 0.027 0.859
Botometer 0.958 0.101 0.912 0.905 0.054 0.912
Light 0.613 0.217 0.536 0.131 0.636 0.928
Rtbust D 0.699 0.451 0.567 0.357 0.612 0.776
Botometer 0.625 0.473 0.584 0.377 0.636 0.788
Light 0.631 0.375 0.495 0.285 0.548 0.732
Stock D 0.924 0.819 0.771 0.960 0.714 0.549
Botometer 0.756 0.780 0.719 0.927 0.673 0.480
Table 4: Comparison in performance of Botometer v3 and the best models with
the set of features Light and D.
the model with Light, except for the stock dataset, produces similar results that
the other models, on some occasions outperforming them. Besides, it shows
the best specificity in all cases and it is scalable. As expected the model with
Light does not perform properly in stock because of the coordinated behaviour
of the accounts[75]. In contrast, Botometer seems to be more robust against
the bots in stocks, probably because its features cover more aspects apart from
the user metadata. Results also confirm that is possible to obtain competitive
performance using just a small set of features, as models with Light and D,
rather than a bigger one as Botometer.
4 Case study: High scale bot detection over the
Covid-19 pandemic
Many studies suggest how bots would manipulate public debate. This
behaviour would be particularly dangerous in the context of global health
emergency. We then posit a main research question:
To what extent bots try to push disturbing action during the Covid-19 pan-
demic, in general and in relation to specific topics?
More specifically,
15What is their prevalence and volume of posts activity compared to that of
human accounts?
Does they exhibit any difference in the sentiment of the posts they share
compared to ones shared by humans?
To answer these questions, we study the bot presence on specific topics
during periods of the first months of the pandemic. Then, after the bot detection
analysis, we present the differences in the discourse between humans and bots,
focusing on sentiment and hashtags. Through sentiment analysis we estimate
the public opinion on a certain topics and would also track COVID-19-related
exposure to negative content in online social systems caused by bots activities.
As regards procedure, we used hashtags to identify the tweets which were
related to the same topic. We considered that two tweets belong to the same
topic if they contain the same hashtags or a subvariant of them. For instance,
the tweets with hashtags COVID19, covid, Covid19, CovidPandemic belongs to
the topic COVID.
The tweets used for the experiments of this section were extracted from
public datasets in [33][57][29] or Kaggle datasets. These datasets are composed
of extracting tweets through the Twitter Streaming API. The tweets extracted
contain specific hashtags or keywords with their variants related to COVID-19,
or belong to specific accounts such as the World Health Organization (WHO).
Even though most of the datasets contained tweets in several languages, they
are mostly composed of English tweets since the hashtags or keywords used to
extract the tweets refer to English terms. This fact implies that the tweets are
mostly related to events in English-speaking countries such as U.S. or U.K. These
datasets, due to Twitter regulations, contain the IDs of the tweets. Therefore, it
was necessary to hydrate those IDs using the twarc library [7] to obtain the full
tweet object. We only consider English tweets for our experiments.
The topics and periods that we consider in our experiments are listed below:
• Topic WUHAN on 25th and 26th January 2020.
• Topic OUTBREAK on 25th and 26th January 2020.
• Topic COVID on 28th and 29th March 2020.
• Topic LOCKDOWN on 10th May 2020.
• Topic TRUMP from 4th February to 21th February 2020.
As studies suggest that social media discourses mirror offline events dynamics,
these topics and periods were studied as they were considered as prone for the
presence of bots as they reflect some controversial issues in people’s conversations.
WUHAN and OUTBREAK refer to the pandemic beginning where the virus
had rapidly spread in China and received names such as ”Wuhan virus” or
”Wuhan coronavirus”. In this context, authorities canceled large-scale events
such as the Spring Festival, and there were traveling restrictions for more than 30
million people. These facts constituted an unprecedented event [13]. Moreover,
16Topic Accounts Tweets
OUTBREAK 64602 82030
WUHAN 103916 163723
COVID 312034 414097
LOCKDOWN 26813 31052
TRUMP 10144 26865
Table 5: Number of accounts and tweets for each one of the cases studied.
15 Chinese cities suffered partial or full lockdowns to attempt to limit the spread
of the coronavirus [10].
The COVID topic on 28th and 29th March coincides with Trump considering
quarantining New York [5] as there was a shortage of equipment for health
workers and hospitals were overloaded [15][16]. Moreover, the milestone of 2000
deaths in the US was overcome in these days [15].
In the scope of LOCKDOWN on 10th May, there was a high criticism raised
from the first steps out of the lockdown proposed by UK Prime Minister, Boris
Johnson.[3]
Finally, the TRUMP case refers to the management of the start of the
pandemic by President Trump, which was highly-criticized. In this period, there
were problems with the COVID testing in the U.S.[22], making it difficult to stop
the spread of the virus. Besides, little attention was given to the coronavirus in
the State of Union on 4th February, where President Trump spent less than 30
seconds referring to the COVID-19 situation[14]. Moreover, during this time,
the US government had to manage the Diamond Princess cruise situation, where
it was criticized the conditions around the Americans in the ship during the
month of February[24].
Table 5 displays the number of unique tweets and accounts considered by
each topic after hydrating the tweets. We use these tweets for our experiments.
4.1 Bot analysis: Proportion of bots and distribution of
bot score
For the bot detection analysis, we use the model Light as it displayed good
results in section 3.3 and scalability. First, we study the distribution of the
bot score in each one of the cases. The distributions are displayed in Figure
3. The decision threshold corresponds to the one computed in 3.3. All the
distributions are positively skewed, indicating a bigger presence of the human
than bots. Moreover, except for the TRUMP distribution, it is observed a clear
tail.
Then, we study if the distributions are similar between them. We run the
Anderson-Darling statistical test to analyze if the samples of bot scores come from
the same distribution. After running the test for all the pairs of distributions,
we reject the null hypothesis at a 1% significance level. We conclude that there
is statistically significant evidence to state that the samples for each case do not
17Figure 3: Bot score distribution for each of the cases studied.
come from the same distribution.
Figure 4: Proportion of bot and human accounts that interacted in each case.
Besides, we classify each account as a bot or human using the decision
threshold computed in 3.3. Figure 4 displays the proportion of bots and human
accounts identified in each case. We notice that OUTBREAK and WUHAN
cases have the smallest amount of bots, with only around 7% bot-operated
accounts. In COVID and LOCKDOWN, about 10% and 12% of the accounts
18are bots. The TRUMP case has the maximum proportion of bots with more
than 18%.
Figure 5: Proportion of tweets which were produced by bots and humans in each
of the cases studied.
Then, we compute the number of tweets produced by bots and humans in
each case. Figure 5 displays a comparative bar chart with the proportion of
tweets created by bots and humans in each topic. We observe that in all the
cases, except for TRUMP, the proportions of each type of account and tweets
made by those accounts are analogous, not differing in more than 3%. This fact
indicates that bots and humans as a group present the same rate of activity in
these cases. By contrast, in the TRUMP case, we see that bots are more active
than humans. The bots, only 18.26% of the accounts, produce the 55.73% of
total tweets in this case.
4.2 Differences on the discourse: sentiment and hashtag
analysis
In order to understand whether bots would increase exposure to negative
and inflammatory content in online social systems, we analyze tweets’ content
differences regarding bots and humans in each case. Sentiment analysis allows us
to monitor social media to extract an overview of the opinion of Twitter users.
First, we implement sentiment analysis in each one of the situations using
VADER. We analyze the sentiment to learn about the reactions of users in each
one of the situations studied. Then, the sentiment analysis was extended for
the LOCKDOWN and TRUMP cases, using only the hashtags in the tweets to
predict tweets’ sentiment. Eventually, we examine the most common hashtags
for bots and humans and discuss differences between each group.
194.2.1 Sentiment Analysis using VADER
We use VADER[11] to implement the sentiment analysis for all the cases.
VADER is a sentiment model specifically designed to analyze microblog-like
contents as tweets. To predict the sentiment, VADER uses a list of lexical
features with their corresponding gold-standard sentiment intensities, combined
using a set of five grammatical rules. According to the study in [68], where it
has been benchmarked more than 20 techniques using 18 datasets, VADER is
one of the best sentiment analysis methods for Social Media messages. Apart
from its performance, we choose VADER because of its scalability and its simple
utilization. There is a VADER implementation available in the NLTK library[32].
Besides, it needs little preprocessing compared to other methods. We apply
the following preprocessing steps to the tweet content before using the VADER
sentiment analyzer:
1. Remove extra white spaces.
2. Remove links and/or URLs.
3. Remove username.
4. Remove RT symbol.
5. Remove HTML elements.
6. Remove # symbol.
7. Remove non-ASCII elements.
We based our experiment on the output of VADER, denoted as compound
score. This metric corresponds to a single unidimensional measure for the
sentiment. It is the result of summing the score of each word in the lexicon,
then adjusting this value regarding the grammatical rules and normalizing it. It
ranges between -1, the most negative value, and 1, the most positive.
We use this compound score to label a tweet as positive, neutral or negative.
Specifically, as recommended by VADER documentation [50], we use the following
thresholds:
• Positive: compound score ≥ 0.05
• Neutral: -0.05 ≤ compound score ≤ 0.05
• Negative: compound score ≤ -0.05
Figure 6 displays the proportions of tweets for each case after using the
sentiment thresholds above.
We observe that the case OUTBREAK show similar proportions for bots
and human. There is a greater presence of positive and neutral tweets (around
80%), being the negative tweets the minority.
20Figure 6: Sentiment of the tweets for each of the cases studied for human and
bot operated accounts.
Regarding WUHAN, we also notice similar proportions between humans and
bots. In contrast to OUTBREAK, there is a bigger proportion of negative and
neutral tweets, being the positive tweets the minority with only around 18%
for bots and humans. It is worth mentioning that even though WUHAN and
OUTBREAK are highly related and it is considered the same period, they show
inverse behaviors.
Regarding COVID, we notice that both humans and bots produced similar
proportions for negative, neutral, and positive tweets. The former fact might
indicate a division of users’ opinion into the measure of quarantining New York.
Alternatively to the previous cases, we see that the humans and bots accounts
show different proportions in the LOCKDOWN and TRUMP cases.
In LOCKDOWN, bots show similar amounts of positive, neutral, and negative
tweets. However, humans mainly display a negative tendency (50.74% of the
total tweets), while the positive and neutral correspond to half of the tweets in
a balanced way. This value might indicate public opinion disagreement with the
first steps out of the Lockdown proposed by the UK Prime minister.
In the TRUMP case, we observe a more evident difference between the
sentiment proportions of tweets produced by bots and humans. We notice that
humans present a balance between the three classes with a little dominance of
negative tweets (42% negative-27% neutral - 31% positive). We interpret this
result as a light dissent of users with President Trump’s political performance
during that period. On the other hand, negative-sentiment tweets correspond to
the majority for bots, with almost 80% of the tweets. These values represent a
21drastic difference, showing that tweets generated by bots have a predominantly
negative attitude.
So far, we have used thresholds and discrete labels to measure the sentiment.
However, one setback of this approach is the inability to count on intensities.
For instance, we cannot differentiate between an extremely and slightly negative
tweet since both are considered negative. To overcome this limitation and make
a more extensive study, we complemented the previous analysis by studying the
sentiment with a continuous metric, .i.e. the compound score. This analysis
allows us to comment also about the intensity of the tweet content.
Figure 7 displays the distributions of compound scores regarding bots and
human accounts for each case. We observe that for OUTBREAK, WUHAN, and
COVID, the location of the peaks of the distributions for human and bots are
similar. Moreover, most of the scores are around 0 in these cases, the samples
not presenting extreme scores. In the human distribution in the LOCKDOWN
case, we observe that the negative tweets display a more extreme score (peak
between -0.6 and -0.8) than those positive (less than 0.5). This fact explains that
human users were more drastic when they refer negatively to Lockdown than
when they referred positively. Besides this case, it is the only distribution where
we can notice two peaks, one in the neutral interval and one in the negative
scores. Alternatively, regarding bots in the LOCKDOWN case, we observe that
the positive tweets are close to the central scores, while we notice negative scores
along the spectrum, from more neutral to more extreme scores. Concerning
the TRUMP case, bots distribution only displays a peak which shows that
most tweets have a slightly negative sentiment. In the case of humans, all the
compound scores are located in the center of the distribution. This fact implies
that positive and negative tweets do not show extreme positions.
Furthermore, we run an Anderson-Darling test to see if the samples of the
compound scores between humans and bots present the same distribution for
each case. After running the test for all the pairs of distributions, we reject the
null hypothesis at a 1% significance level. Therefore, we conclude that there
is statistically significant evidence to state that samples do not come from the
same distribution.
The experiments in this subsection have some limitations. First, even though
VADER presents the previously described advantages, it is not attuned for
tweets that regard politics. This fact can reduce the performance of VADER
on occasions. Besides, using hashtags to extract the tweets of the same topic
might be sensitive to spam. Twitter users can use hashtags to gain popularity or
attention, though it is not related to the tweet content. Moreover, our hashtag-
based method for extraction can retrieve some tweets which are not fully-related
to the topic we are studying. That being said, the limitations are not thought
to be significant enough to not able to grasp valuable insights about the overall
opinion displayed by the Twitter community about specific topics and analyze
differences in sentiment between humans and bots.
22Figure 7: Distribution of sentiment compound score for each case regarding
human and bot accounts.
4.2.2 Sentiment Analysis using hashtags
We evaluate the sentiment through the hashtags in the tweets. By doing so,
we expect to overcome some of the limitations exposed in the previous section and
make a more extensive analysis. Previously, manually labeling all the hashtags
in the tweets as positive, negative, and neutral, we follow the following approach
to obtain the sentiment of the tweets:
• If a tweet contains at least one positive hashtag, the tweet is labeled as
positive.
• If a tweet contains at least one negative hashtag, the tweet is labeled as
negative.
• If a tweet contain does not contain positive nor negative hashtag, the tweet
is labeled as neutral.
• If a tweet contain at least a positive hashtag and a negative hashtag, the
tweet is labelled as inconclusive.
It is worth mentioning that all the tweets evaluated contain at least one
hashtag because of the extraction method. Moreover, as results will convey,
inconclusive tweets are a minority since a user will refer to negative or positive
hashtags regarding a topic, not with both.
23In particular, we only evaluated the topics LOCKDOWN and TRUMP since
they show a higher polarity. We expect to gain insights into the opinion of users
regarding Trump’s political performance and Lockdown measures. The hashtags
were manually labeled following specific guidelines for each one of the cases.
We followed the rules below to label the hashtags in the LOCKDOWN tweets:
• It is assigned +1 (positive) to all hashtags which display a favourable
attitude towards the lockdown and individual protection measures.
• It is assigned -1 (negative) to those hashtags against the lockdown and
individual protection measures.
• The rest of the cases are labelled as 0 (neutral).
We followed the guidelines below to label the hashtags in the TRUMP tweets:
• It is assigned +1 (positive) to those hashtags in favour of Trump or its
campaign, the GOP, or conspiracies theories who support the figure of
Trump. Hashtags containing slogans pro-Trump are also labeled as 1.
• It is assigned -1 (negative) to those hashtags which shows an offensive
attitude towards Trump, including nicknames. It is also given -1 to those
hashtags which were against GOP, constitutes sarcastic slogans, or are in
favour of the democratic party.
• It is given 0 to the rest of the hashtags.
Using the previous instructions, in the LOCKDOWN case, we labeled 221
negative hashtags and 241 positive hashtags out of the 14376 in the LOCKDOWN
tweets. Otherwise, in the TRUMP case, we obtained 938 negative hashtags and
367 positives out of 9678 total hashtags. Moreover, there were less than 1% of
inconclusive tweets for both cases.
The results using the hashtag-based method are shown in Figure 8. We
observe a predominant proportion of neutral tweets in all cases. This result
matches with the nature of hashtags: they usually label tweets in a topic,
expressing an opinion being less frequent. However, when they express opinion
they give us evidence of the position of the user. This fact allows us to gain more
accurate insights into the opinion of the topics studied. In the LOCKDOWN
case, we observe twice as many tweets with positive sentiment (12.66%) than
tweets with negative sentiment (6.35%). From these results, we could say that
more people agree with the need for measures in favor of the lockdown than
people who do not. We observe the same tendency regarding the bots in the
LOCKDOWN case; it is bigger the proportion of positive tweets than negative.
In both cases, the proportion of neutral tweets supposes the majority of tweets
with 81% for humans and 71.68% for bots. For the TRUMP case, humans and
bots display a bigger proportion of negative tweets than positive. However, the
differences in proportions between one and the other differ significantly. For
bots, the difference between positive and negative is 3%, while neutral tweets
24Figure 8: Sentiment of the tweets using hashtags for human and bots for the
LOCKDOWN and TRUMP case.
constitute almost 85% of the tweets. Concerning humans, we observe that less
than 50% of the tweets are neutral. We notice a bigger proportion of negative
sentiment tweets than positive; 31% against 22%. This fact display that public
opinion has a more negative attitude towards Donald Trump in that period.
4.2.3 Hashtags analysis
In this section, we explore the differences in the discourse regarding the
hashtags in bots and humans. This analysis aims to see if bots and humans
tweet about different things even in the same context. Significant differences in
the hashtags between bots and humans would imply that conversations between
humans and bots differ. To implement this analysis, we plot, for each case, the
20 most frequent hashtags used by humans and bots.
Figure 9 displays the most frequent hashtags that used humans and bots for
the OUTBREAK, WUHAN, COVID cases. We observe in all three cases that
humans and bots use similar hashtags, indicating very homogeneous discourse.
We list below few differences that we can spot between the hashtags in each case:
• In contrast to bots, #infographic or #Ebola are between the most common
hashtags used by humans in OUTBREAK. The former might be because
25Figure 9: Most frequent hashtags for the OUTBREAK,WUHAN and COVID
cases.
human users are sharing pieces of information based on infographics. The
latter could mean that human users find similarities between the Ebola
outbreak in Europe and U.S. in 2014 and the Covid-19 situation.
• In the WUHAN case, bots utilize the term #WuhanFlu to refer to COVID-
19 in contrast to humans.
• In the COVID case, we can see support by human users to the U.S. Navy
with the hashtags #USNavyAlwaysThere. This hashtag probably refer
when the U.S. Navy sent a hospital ship to help the area of New York.[19].
Conversely to bots, we observe that humans use #PMcaresfund. PM
CARES Fund was created in India on 27th March to fight against Covid-19
and analogous pandemic situations in the future [1]. On the other hand,
bots in COVID share the message #WashYourHands as a prevention
measure for Covid.
Figure 10 displays the most frequent hashtags that used humans and bots
for the LOCKDOWN and TRUMP cases. We observe in LOCKDOWN that
the most frequent hashtags are equal for bots and humans. In general terms,
we can see hashtags referring to U.K., India, or South Africa events in both
cases. For instance, #lockdownuk refers to the U.K. lockdown, and hashtags
such as #HappyMothersDay are related to India. In India, Mother’s Day is
the second Sunday of May, which fell on 10th May in 2020 [17]. Otherwise,
#day44oflockdown regards South Africa, since the 10th May was the 44th day of
26You can also read