A Large-scale Behavioural Analysis of Bots and Humans on Twitter
←
→
Page content transcription
If your browser does not render page correctly, please read the page content below
A Large-scale Behavioural Analysis of Bots
and Humans on Twitter

ZAFAR GILANI, Department of Computer Science and Technology, University of Cambridge, UK
REZA FARAHBAKHSH, Institut Mines-Télécom, Télécom SudParis, CNRS Lab UMR5157, France
GARETH TYSON, Queen Mary University of London, UK
JON CROWCROFT, Department of Computer Science and Technology, University of Cambridge, UK

Recent research has shown a substantial active presence of bots in online social networks (OSNs). In this
article, we perform a comparative analysis of the usage and impact of bots and humans on Twitter—one of
the largest OSNs in the world. We collect a large-scale Twitter dataset and define various metrics based on
tweet metadata. Using a human annotation task, we assign “bot” and “human” ground-truth labels to the
dataset and compare the annotations against an online bot detection tool for evaluation. We then ask a series
of questions to discern important behavioural characteristics of bots and humans using metrics within and
among four popularity groups. From the comparative analysis, we draw clear differences and interesting
similarities between the two entities.
CCS Concepts: • Information systems → Social networks; • Networks → Network measurement;
Additional Key Words and Phrases: Bot characterisation, behavioural analysis, bot network traffic, bot gen-
erated content
ACM Reference format:
Zafar Gilani, Reza Farahbakhsh, Gareth Tyson, and Jon Crowcroft. 2019. A Large-scale Behavioural Analysis
of Bots and Humans on Twitter. ACM Trans. Web 13, 1, Article 7 (February 2019), 23 pages.
https://doi.org/10.1145/3298789

1    INTRODUCTION
Bots (automated agents) exist in vast quantities in online social networks. They are created for a
number of different purposes, e.g., news, marketing [16], link farming,1 political infiltration [5, 22]
spamming, and spreading malicious content. The rise of bots on Twitter is evidenced by a number
of studies [21, 34], and articles.2 This constitutes a radial shift in the nature of content production,
which has traditionally been the realm of human creativity (or at least intervention). Although

1 Link   farming, http://observer.com/2014/01/fake-traffic-means-real-paydays/.
2 Bots   in press and blogs, https://www.cl.cam.ac.uk/∼szuhg2/docs/papers/bots-discussions.txt.

Authors’ addresses: Z. Gilani and J. Crowcroft, Department of Computer Science and Technology, University of Cam-
bridge, Williams Gates Building, 15 JJ Thomson Ave, Cambridge, CB3 0FD, UK; emails: {szuhg2, jac22}@cam.ac.uk; R.
Farahbakhsh, Institut Mines-Télécom, Télécom SudParis, CNRS Lab UMR5157, 9 rue Charles Fourier, Evry, 91011, France;
email: reza.farahbakhsh@it-sudparis.eu; G. Tyson, Queen Mary University of London, Mile End Road, London, E1 4NS,
UK; email: g.tyson@qmul.ac.uk.
Permission to make digital or hard copies of all or part of this work for personal or classroom use is granted without fee
provided that copies are not made or distributed for profit or commercial advantage and that copies bear this notice and
                                                                                                                                  7
the full citation on the first page. Copyrights for components of this work owned by others than ACM must be honored.
Abstracting with credit is permitted. To copy otherwise, or republish, to post on servers or to redistribute to lists, requires
prior specific permission and/or a fee. Request permissions from permissions@acm.org.
© 2019 Association for Computing Machinery.
1559-1131/2019/02-ART7 $15.00
https://doi.org/10.1145/3298789

                                   ACM Transactions on the Web, Vol. 13, No. 1, Article 7. Publication date: February 2019.
7:2                                                                                         Z. Gilani et al.

there have been past studies on various aspects of bots (Section 2), we are particularly interested
in exploring their role in the wider social ecosystem, and how their behavioural characteristics dif-
fer from humans. This is driven by many factors. The limited cognitive ability of bots clearly plays
a major role; however, it is also driven by their diverse range of purposes, ranging from curating
news to answering customer queries. This raises a number of interesting questions regarding how
these bots operate, interact, and affect online content production: What are the typical behaviours
of humans and bots, in terms of their own activities as well as the reactions of others to them?
What interactions between humans and bots occur? How do bots affect the overall social activi-
ties? These questions have implications for many fields such as social media analysis and systems
engineering.
    Beyond the social implications, the combined popularity of social media and online bots may
mean that a significant portion of network traffic can be attributed to bots. This conjecture is not
without support: According to one estimate, 51.8% of all Web traffic is generated by bots.3 This,
again, constitutes a radical shift from traditional views on Web traffic bringing about both new re-
search questions and engineering opportunities. Can we adapt our network and content delivery
infrastructure to better meet their needs and mitigate overheads? The latter is of particular impor-
tance, as the above preliminary evidence seems to suggest that much of our network congestion
is created by bots (that perform low priority work).
    To answer the above questions, we build on our previous work [24] to perform a large-scale
measurement and analysis campaign of Twitter (Section 3). We focus on bots in Twitter because
it largely exposes public content, and past studies indicate a substantial presence of bots [11]. Ad-
dressing existing limitations of automated bot detection algorithms, we utilise a human annotation
task to manually identify bots, providing us with a large ground truth for statistical analysis. We
offer a new and fundamental understanding of the characteristics of bots vs. humans, observing
a number of clear differences (Section 4). For example, we find that humans generate far more
novel content, while bots rely more on retweeting. We also observe less-intuitive trends, such as
the propensity of bots to tweet more URLs and upload bulkier media (e.g., images). We also see
divergent trends between different popularity groups (based on follower counts), with, for exam-
ple, popular celebrities utilising botlike tools to manage their fanbase. We then move on to explore
the types of network traffic that bots may induce by sharing content and links (URLs) via Twitter.
Specifically, this involves inspecting (i) the amount of data traffic bots generate on Twitter and
(ii) the nature of this traffic in terms of media type, i.e., URL, photo (JPG/JPEG), animated image
(GIF), and video (MP4). We briefly touch upon on the possibilities of how this ever-increasing bot
traffic might affect networked systems and their properties. Finally, we analyse the social inter-
connectedness of bots and humans to characterise how they influence the wider Twittersphere
(Section 5). We observe that, although human contributions are considered more important via
typical metrics (e.g., number of likes, retweets), bots still sustain significant influence over con-
tent production and propagation. Our experiments confirm that the removal of bots from Twitter
could have serious ramifications for information dissemination and content production on the so-
cial network. As well as providing a powerful underpinning for future bot detection methods, our
work makes contributions to the wider field of social content automation. Such understanding is
critical for future studies of social media, which are often skewed by the presence of bots.

2 RELATED WORK
In this study, we focus on characterising and comparing bots vs. humans to understand their key
behavioural traits. Hence, we do not distinguish based on factors such as spam or fake information,

3 Bot   traffic report 2016; https://www.incapsula.com/blog/bot-traffic-report-2016.html.

ACM Transactions on the Web, Vol. 13, No. 1, Article 7. Publication date: February 2019.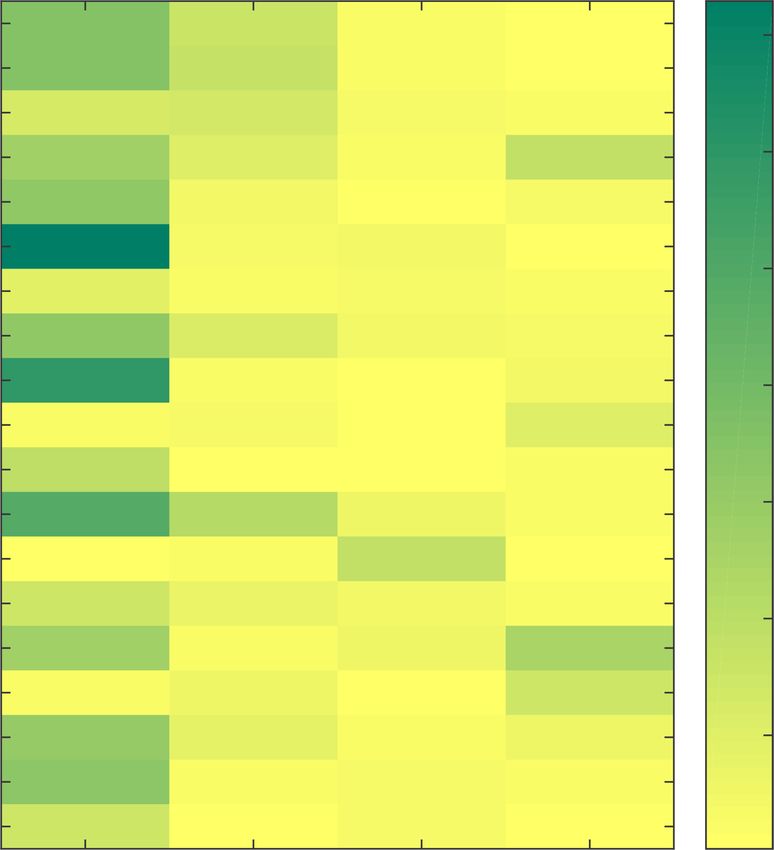
A Large-scale Behavioural Analysis of Bots and Humans on Twitter                                                7:3

because bots could belong to credible organisations and human accounts could be linked with spam
or fake content. Similarly, we do not focus on bot detection technologies as, for us, the detection
step is a precursor to our analysis rather than our core focus. Our intent is to provide a generic
analysis by discerning the operating nature of the user account and not its intent. Consequently,
two main streams of research are relevant this article: (i) social, demographical, and behavioural
analyses of either bots or humans and (ii) impact analyses of bots in social environments.
   Social analysis of bots or humans. The first step when performing an analysis of bots is
to devise mechanisms to effectively detect their presence. There are various techniques for this.
Chavoshi et al. propose a technique to detect Twitter bots by cross-correlating user activities [9].
Their work is based on the premise that accounts that are unlikely to be human operated have
abnormal activities, such as repeated behaviour, discords, and bursts [10]. Their technique uses
lag-sensitive hashing and a correlation measure for detection and does not require labelled data.
The authors implement their technique into Debot [8] and BotWalk [27], both of which use an
unsupervised ensemble anomaly detection method. The authors achieve a precision of 94% in de-
tecting unique bots, as well as helping to identify 6,000 bots a day. In our own evaluation (see
Section 3.4.1), we found a lower accuracy with Debot, although we posit that this may be due to
changes in bot behaviour since its creation. Another tool by Chavoshi et al. collects, detects, and
maintains a list of cross-correlated accounts during certain time periods. This is effective in many
settings, although is not applicable to our data, as it depends on maintaining statistics on a much
wider set of accounts.
   Cresci et al. explored social behaviours of Twitter users by employing DNA-based behavioural
modelling in Reference [13], although they found little to no similarities among Twitter users.
They concluded that Twitter users cannot be considered uniformly random. Using the DNA-based
social fingerprinting technique, the authors in another piece of work [15] posit that more accurate
spambot detection can be achieved via an in-depth analysis of collective behaviours. In another
study, Cresci et al. used a similarity measure for social fingerprints to distinguish genuine users
and spambots [19]. While we also study user behaviour, we do not distinguish between bots and
spambots, nor is our focus on bot detection. Instead, we perform an in-depth analysis by using a
range of attributes across a popularity-based partitioned dataset.
   Lee et al. performed a long-term study of general content polluters on Twitter [26]. The re-
searchers accomplished this by deploying 60 social bot-driven honeypots for seven months. They
provide a detailed examination of 36,000 harvested content polluters including analysis of link pay-
loads, user behaviour, and follower-following network dynamics. Four main categories of content
producers were discovered: (i) duplicate spammers (that post near identical tweets); (ii) duplicate
@ spammers (post near identical content and misuse Twitter’s @username system); (iii) malicious
promoters (which use more sophisticated language for posting tweets about online business, mar-
keting and finance); (iv) friend infiltrators (they engage in spam once they have acquired a large
mass of legitimate Twitter users). Our work differs in that we do not focus on the content of the
tweets but, rather, the features of the bots that tweet them.
   A similar work, but along the lines of human-bot interaction, was carried out by Murgia et al.
[29]. In this work the authors used a bot emulating an ordinary user to answer user questions
on Stack Overflow. They carried out two experiments, one in which the bot was impersonating
a human and the other in which the bot revealed its machine identity. Answers from human-
impersonating bot were accepted 8% (4 of 50), up-voted 28% (14 of 50), and down-voted 14% (7 of
50) times. Comparatively, answers from the bot revealing its machine identity were accepted 8%
(1 of 13), never up-voted, and down-voted 23% (3 of 13) times. Despite being functionally identical,
the two identities elicited different reactions. This is a fascinating line of study, although one that
is orthogonal to our own. Researchers have also inspected bot or human behaviour. For example,

                            ACM Transactions on the Web, Vol. 13, No. 1, Article 7. Publication date: February 2019.
7:4 Z. Gilani et al. Reference [6] examined the retweet behaviour of people, focussing on how people tweet, as well as why and what people retweet. The authors found that participants retweet using different styles, and for diverse reasons (e.g., for others or for social action). This is relevant to our own work, as we also study retweets although our focus is on comparing bots vs. humans (rather than focussing on just one). Our work therefore provides further insights on important differences and striking similarities between bots and humans in terms of retweet patterns, account lifetime, content cre- ation, content popularity, entity interaction, content consumption, account reciprocity, and content propagation. There has also been work on the human perception of bots. For instance, Cresci et al. tested known bots on Twitter to see if they are perceived differently than humans [14]. The researchers employed 240 human participants and divided them into two treatment groups, i.e., one for view- ing mock Twitter pages with tweets by bots, and the other for viewing mock Twitter pages with tweets by humans. After viewing the Twitter page each participant would then score credibility, interpersonal interaction, and demographics among other things. The bots scored closely to hu- mans for competence, character, social attraction, and communication. The experimental study concluded that bots were perceived as a credible source of information in most cases by human participants. In our study, we also show the similarities that exist between bots and humans and highlight features where bots have outperformed humans, but we do not create fake or bot pro- files4 and instead rely on the data collected from Twitter. Social influence of bots. The above studies primarily inspect the characteristics of bots. There has also been work inspecting the social influence of bots, i.e., how other users react to them and how they impact the surrounding Twittersphere. In Reference [2], the authors use a bot on aNobii, a social networking site aimed at readers, to explore the trust, popularity, and influence of bots. They show that gaining popularity does not require individualistic user features or actions but rather simple social probing (i.e., bots following and sending messages to users randomly). The authors also found that an account can circumvent trust if it is popular (since popularity translates into influence). The results confirm that bots can have a profound effect on online social media environments. Closely related is Reference [33], which developed models to identify users who are susceptible to social bots, i.e., likely to follow and interact with bots. The authors use a dataset from the Social Bot Challenge 2011, and make a number of interesting observations, e.g., that users who employ more negation words have a higher susceptibility level. Recent work [23] has also shown the impact of bots on Twitter activity using a non-infiltrating honeypot experiment. In this article, we do not use honeypots or create bots ourselves; instead, we perform a wider-scale analysis of existing bots. These two complementary approaches yield different results; for example, whereas Reference [2] reveals how popular bots can gain influence, we provide a wider viewpoint across many different popularity groups. There have also been several interesting studies looking at domain-specific bot activities. For instance, Cresci et al. [17] focused on Twitter bot activities in stock markets and observed mali- cious practices perpetrated by coordinated groups. These aim at promoting low-value stocks by exploiting the popularity of high-value ones. A similar study in Reference [28] explored the im- pact of Twitter bots on diffusion of information. Authors coordinated a set of 39 Twitter bots to monitor the behaviour of popular target users based on the interactions that they generated. More disturbingly, bots have been found to influence political scenes and democratic procedures; several studies have demonstrated the influence [7] and impact [5] of bots when attempting to proliferate an opinion. In another study [4], the authors employed a set of social bots in a hybrid crowdsourc- ing fashion for humanitarian purposes. These important studies have offered key insights into 4 This was considered unethical by the Institutional Review Board at the University of Cambridge. ACM Transactions on the Web, Vol. 13, No. 1, Article 7. Publication date: February 2019.
A Large-scale Behavioural Analysis of Bots and Humans on Twitter                                                        7:5

particular domains, although we emphasise that our goal is to offer a more generalisable insight
into the bounds of bot activities rather than the specifics of individual bot behaviours. That said,
we do take inspiration from the feature-sets used within these past works, e.g., tweeting behaviour
and follower-friend circles. In our work, we study the characteristics of existing bots in detail and
argue that this provides far broader vantage into real bot activities. Hence, unlike studies that fo-
cus on the influence of individual bots (e.g., the Syrian Civil War [1]), we gain perspective on the
wider spectrum of how bots and humans operate and interact.
   To the best of our knowledge, we are the first to perform a methodical comparison of repre-
sentative metrics across the two main types of Twitter accounts, offering a thorough comparison
between bots and humans. We focus on similar features to that used by existing bot detection tools;
however, rather than utilising these for bot classification, we collect and analyse these features to
build up a comprehensive understanding on bot vs. human behavioural characteristics.

3   METHODOLOGY
We use and build upon our previous work Stweeler5 [25] for data collection, pre-processing, feature
extraction, bot classification through human annotation, and analysis. We define a “bot” as any
account that consistently involves automation over the observed period, e.g., use of the Twitter
API or other third-party tools, performing actions such as automated likes, tweets, retweets, and
so on. Note that a tweet is an original status and not a retweet (we differentiate original tweets and
retweets using the tweet metadata returned from the Streaming API) and a status is either a tweet
or a retweet. Also note that content on Twitter is limited to whatever is contained within a tweet:
text, URL, image, and video.

3.1 Data Collection
To collect a representative OSN dataset, we have selected Twitter because it is open and large-scale
and is known to contain a wide breath of bot activity. We collect data on bot and human behaviour
for 30 days in April 2016 from the Streaming API. Note that every single action is recorded as a
tweet (status) on Twitter, whether a tweet, retweet, reply, or mention. Since we collect all tweets
offered by the Streaming API (we do not mention any topics as filtering criterion) within a time
period T , where t 1Apr ≤ T ≤ t 30Apr , we have good approximate insights within T . Note, however,
that the Streaming API only reports 1% of all tweets and, thus, we can only offer a lower bound on
activity. This campaign resulted in 65 million tweets, with approximately 2 to 2.5 million recorded
per day. In total, we recorded information on 2.9 million unique accounts.

3.2 Data Pre-Processing
Our data6 contains a range of accounts in terms of their popularity (i.e., number of followers).
Hence, we partition profiles into four popularity groups to enable a deeper understanding of how
each group behaves. The intuition behind this partitioning is that popularity might intrinsically
reveal profile and network attributes. For instance, the most credible accounts will have high num-
bers of followers, whereas it is much more likely that spam or dark accounts will have lower pop-
ularity. To this end, we select four popularity groups, ranging from low popularity (around 1K
followers) to high popularity (over 10M followers). From these groups, we then extract a random
subset of accounts for later manual annotation, i.e., to classify them as either bot vs. human (see
Section 3.4). Figure 1 presents the density distribution of both the overall population and the sam-
pled population. Broadly speaking, the trends are similar; however, it is necessary to oversample

5 Stweeler,   https://github.com/zafargilani/stcs.
6 Researchers    may contact the authors to acquire datasets for further study.

                                    ACM Transactions on the Web, Vol. 13, No. 1, Article 7. Publication date: February 2019.
7:6 Z. Gilani et al.
Fig. 1. Twitter user account normalised distribution—all vs. annotated.
high popularity accounts, because they make-up only a small fraction of the overall population.
For example, only 0.003% of accounts have over 10M followers in our non-sampled dataset, but
this constitutes 1.414% of our annotated dataset. To gain statistically representative populations,
it is therefore important we oversample these groups. We do this because popular accounts exert
far greater influence on the Twittersphere, and therefore we wish to have statistically significant
vantage on their activities.
The popularity groups are as follows.
G10M+ – celebrity status: This is the subset of Twitter users with the highest number of follow-
ers, i.e., >9M followers. These are the most popular users, who hold celebrity status and are globally
renowned. Popular and credible organisations (e.g., CNN, NetGeo) use these accounts for various
purposes, which makes them free of spam, thus having high credibility and trustworthiness.
G1M – very popular: This subset of Twitter users is amongst the most popular on the platform,
i.e., 900K to 1.1M followers. These users are close to celebrity status and global recognition (e.g.,
nytfood, pcgamer).
G100k – mid-level recognition: This subset represents popular accounts with mid-level recog-
nition (e.g., CBSPhilly, DomusWeb), i.e., 90k to 110k followers.
G1k – lower popularity: This subset represents more ordinary users, i.e., 0.9k to 1.1k follow-
ers. These users (e.g., hope_bot, Taiwan_Agent) form a large base and, though they show lower
individual and accumulated activity, they do form the all-important tail of the distribution.
3.3 Feature Extraction
After randomly selecting user accounts to populate these four groups, we extract all associated
metadata and compute values for a range of features (e.g., number of tweets). We then use Principal
Component Analysis from the scikit-learn machine learning library7 to test the relevance and
importance of the selected features. A set of 22 features across account profile, network and activity
reveals σ 2 of almost 100%. This means that our feature-set is representative of most of the variance
found in the dataset. The final feature set along with the correlation among different popularity
groups is shown in Figure 2.
In this study, in addition to known metrics (age, tweets, retweets, favourites, replies and men-
tions, URL count, follower-friend ratio, etc.), we also analyse a set of six novel metrics not explored
in past bot research. These are likes per tweet, retweets per tweet, user replies and mentions, activity
source count, type of activity sources, and size of content uploaded. The selection of these features is
7 PCA, scikit-learn.org/stable/modules/generated/sklearn.decomposition.PCA.html.
ACM Transactions on the Web, Vol. 13, No. 1, Article 7. Publication date: February 2019.A Large-scale Behavioural Analysis of Bots and Humans on Twitter 7:7
Table 1. Confusion Matrix of BotOrNot Predictions and Human Annotations
n = 3535 Predicted bot Predicted human Total annotated
Annotated bot 707 818 1,525
Annotated human 943 1,067 2,010
Total predicted 1,650 1,885 n = 3,535
mainly driven by Dugué et al. [20]. Although there are existing studies that focus on using features
(and their associated values) [18] for things like fake follower detection (see Section 2), here we
use these features to explore the general differences between bots and humans.
3.4 Bot Classification
To compare bots with humans, it is next necessary to identify which accounts are operated by
bots. This is not a trivial problem, as bots many not exhibit properties that allow them to be easily
classified. Even many automated tools rely on existing human annotations, which are naturally
also susceptible to bias. Here, we describe our approach to bot classification.
3.4.1 Bot Detection Tools. We started by experimented with existing bot detection tools. We
have found two research tools available: BotOrNot (now rebranded as Botometer8 ) [31] and
Debot9 [8]. Using their APIs, we can provide a set of Twitter accounts and receive classifications
(human vs. bot) in return. We next outline the results from these experiments.
BotOrNot: We first experimented with the updated release of BotOrNot, a state-of-the-art bot
detection tool. To confirm its efficacy, we compared the outcomes against human annotators (see
Section 3.4.2) using two confidence thresholds (40% and 60%). In both cases, the overlap is limited:
BotOrNot reports an overall accuracy (48%). Table 1 illustrates the differences in a confusion ma-
trix. These findings show both the difficulty of accurately detecting bots, and the potential failures
due to the amassing of unnecessarily large number of features (as opposed to a few most rele-
vant features). The reason appears to be that BotOrNot is trained on rather different bot accounts,
therefore challenging the accuracy of the classifier.
Debot: We also experimented with the Debot tool, using its db.check_user(’@screen_name’)
method.10 This returns an empty response for the accounts we tested. To circumvent this problem,
we extracted the list of Debot detected bots for the month of April 2016 (when we collected our
dataset) to compare the outcomes against our manual annotations (Section 3.4.2). We only found a
very small overlap with the bots detected by Debot, i.e., 4 of 3,535 accounts in our dataset (0.11%).
We found that out of these four accounts, two are misclassified as bots by Debot according to
our own ground truth. We also found that Debot collects, detects, and maintains a list of cross-
correlated accounts during certain time periods; hence, it is limited to detecting accounts it has
already collected data on. Again, we do not comment on the accuracy of Debot overall, only that
its coverage is not sufficient for our dataset.
3.4.2 Human Labelling. The above experiments indicate that using existing automated bot de-
tection tools, trained on alternative accounts, is not sufficient for our dataset. The agreement
levels between BotOrNot and Debot are extremely low, making it impossible to conclude defini-
tively which is correct without additional manual inspection. Hence, we choose to supplement this
8 Botometer,https://botometer.iuni.iu.edu/#/.
9 Debot,http://www.cs.unm.edu/∼chavoshi/Debot/index.html.
10 Debot API, https://github.com/nchavoshi/Debot_api.
ACM Transactions on the Web, Vol. 13, No. 1, Article 7. Publication date: February 2019.7:8 Z. Gilani et al.
Table 2. Summary of Twitter Dataset Post-annotation
Group #Bot accts #Human accts #Bot statuses #Human statuses
G10M+ 24 26 71,303 79,033
G1M 295 450 145,568 157,949
G100k 707 740 148,015 82,562
G1k 499 794 24,328 13,351
Total 1,525 2,010 389,214 332,895
strategy with a manual approach. We employed human participants to perform a human annota-
tion task11 to identify bots and humans.
Human labelling or annotations is a standard and common practice followed in labelling unla-
belled data, such as for the purposes of manual classification, or for training supervised machine
learning algorithms. We recruited four undergraduate students for the purposes of annotation.
Each account was reviewed by all recruits independently before being aggregated into a final
judgement using a final collective review (via discussion if needed).
As well as providing the recruits with the Twitter profile, we also presented summary data to
streamline the task. This included account creation date, average tweet frequency, content posted
on user Twitter page, account description, whether the user replies to tweets, likes or favourites
received and the follower-friend ratio. We further provide participants with a list of the “sources”
used by the account over the month, e.g., Twitter app, browser, and so on. The human workers
consider both the number of sources used, and the types of sources used. This is because sources
can reveal traces of automation, e.g., use of the Twitter API. Additionally, the human worker
would also visit a user’s Twitter page and verify the content and URLs posted. That said, we
emphasise that annotators were not simply asked to look at the Twitter page to make a decision—they
were given a range of pertinent metadata. Overall, we presented participants with randomised lists
that fell into the four popularity groups containing roughly 25k accounts each. Human annotators
were instructed to filter out any account that matched the following criteria: an account that does
not exhibit activity (i.e., no tweet, retweet, reply, and mention), or an account that is suspended. In
total, the volunteers successfully annotated 3,535 active accounts; 1,525 were classified as bots and
2,010 as humans. Table 2 provides a summary of the data. Some sample annotated bot accounts per
popularity group is as follows: G10M+ (AlArabiya, CNN, FoxNews, MTV), G1M (AlArabiya_EGY,
ActualidadRT, CaptainAmerica, ExpressNewsPK), G100k (263Chat, AnimeVoice, AutoSportsArt,
candangaNoticia), and G1k (BeerAlien, BietenOnline, CeritaHitam, NPRandBplaylist).
For context, we can cross validate by comparing the agreement of final annotations by the hu-
man workers to the BotOrNot annotation.12 The average inter-annotator agreement compares the
pairs of labels by each human annotator to capture the percentage of accounts for which all four an-
notators unanimously agree. The average agreement is measured as a percentage of agreement: 0%
shows lack of agreement and 100% shows perfect agreement. Our human annotation task shows
very high unanimous agreement between human annotators for each popularity group: G10M+
(96.00%), G1M (86.32%), G100k (80.66%), and G1k (93.35%), whereas BotOrNot shows lower-than-
average agreement with the final labels assigned by the human annotators: G10M+ (46.00%), G1M
(58.58%), G100k (42.98%), and G1k (44.00%). In fact, BotOrNot exhibits negative Cohen’s kappa [12],
thus showing less agreement than exists by chance. Unfortunately, Debot only produced four
11 Human annotation task details, https://www.cl.cam.ac.uk/∼szuhg2/docs/papers/human-annotation-task.txt.
12 We do not compare against Debot because the recall was only 0.11%.
ACM Transactions on the Web, Vol. 13, No. 1, Article 7. Publication date: February 2019.A Large-scale Behavioural Analysis of Bots and Humans on Twitter 7:9
Table 3. Types of Bot Traffic Uploaded by Twitter Users
Type Description
URL & URL hosts and URI schemes (4,849 http and 289,074 https instances). These are extracted
schemes from the [text] tweet attribute. 162,492 URLs by bots and 131,431 by humans.
photos A photo is extracted from the URL in [media_url_https] attribute. In total 23.31GB of
(JPG/JPEG) photo data is uploaded by 3,535 bots and humans in 1 month.
animated Though these are animated photos, Twitter saves the first image in the sequence as a
images (GIF) photo, and the animated sequence as a video under the [video_info] attribute. In total
2.92GB of animated image data is uploaded.
videos Video files accompany a photo that is extracted by Twitter from one of the frames of the
(MP4) video. A video is pointed to by the URL in [video_info][url] attribute. In total 16.08GB
of video data is uploaded.
account labels, and therefore we cannot use it to say anything conclusive. Since BotOrNot yields
a lower accuracy and Debot does not produce any labels, we restricted ourselves to the dataset of
accounts that were manually annotated.
3.5 Media Extraction and Processing
Finally, we note that users are allowed to tweet content such as video and images. These are iden-
tified by metadata within our Twitter data. Table 3 summarises the types of media content we ob-
serve from the annotated data. For each tweet, we also extracted all media and URLs. Importantly,
Twitter automatically creates different resolutions of photos and videos, as well as generating im-
ages from animated sequences or videos to accompany static displays: We are only considering
the media originally uploaded by users.
3.6 Data Limitations
Before beginning our analysis, it is important to discuss key limitations of our dataset, as well
as considerations that should be included when interpreting results. First, we emphasise that our
bot detection process is underpinned by human annotators. Thus, just like any other study, our
results are contingent on correct annotations. By the very nature of some bots, we acknowledge
that this is a challenge and may result in errors as there is no clear ground truth that can be used
to validate results. A perfectly disguised bot will be classified as human. To mitigate its impact,
we have experimented with multiple classifiers and empirically shown that a manually classified
dataset provides more accurate outcomes. For example, the human annotators have high levels of
agreement and our secondary manual validation revealed high accuracy. That said, we temper our
later analysis with this consideration.
Second, as we chose to use a manual classification approach, we also note that our dataset is
smaller than possible with more automated techniques. In total, we evaluate 3,535 accounts, which,
inevitably, means that we are only inspecting a subset of the total Twittersphere. Our dataset also
only covers a single month, so it is difficult to identify large-scale emerging events that may exceed
this period. Overall, this smaller dataset is necessary, as scaling up manual annotations beyond this
level is challenging. A similar issue is the sampling we perform amongst popularity groups, which
means that we do not present data relevant to users who are not within the popularity groups
defined. We took this step to ensure coverage of different types of accounts. However, naturally,
this results in over-sampling of high popularity bot/human accounts and under-sampling of low
popularity bot/human accounts. As such, we emphasise that our results cannot be generalised
across the entire Twitter population—they only represent Twitter users who fall into the popularity
groups we discuss.
ACM Transactions on the Web, Vol. 13, No. 1, Article 7. Publication date: February 2019.7:10 Z. Gilani et al. Fig. 2. Spearman’s rank correlation coefficient (ρ) between bots and humans per measured metric. The figure shows none (0.0) to weak correlation (0.35) across all metrics, indicating clear distinction between the two entities. 4 DISSECTING THE CHARACTERISTICS OF TWITTER BOTS The purpose of this study is to discover the key account characteristics that are typical (or atypical) of bots and humans. Recall that we take a broad perspective on what a “bot” is, i.e., any account that consistently involves automation over the observed period but may involve human interven- tion. This definition is justified by the purpose of automation, i.e., humans act as bot managers, whereas bots are workers. To explore this, we use our data (Section 3) to empirically characterise bots (dashed lines in figures) and humans (solid lines in figures). To begin, we simply compute the correlation between each feature for bots and humans; Figure 2 presents the results as a heatmap (where perfect correlation is 1.0). Notice that most features exhibit very poor correlations (0.0 to 0.35), indicating significant discrepancies between bot and human behaviour—we therefore spend the remainder of this article exploring these differences in depth. 4.1 Content Generation We begin by asking if bots generate more content on Twitter than humans? We initially consider two forms of content creation: a tweet, which is an original status written by the account, and a retweet, which is to repost an existing status. When using the term status, we are referring to the sum of both tweets and retweets. First, we inspect the amount of content shared by computing the number of statuses (i.e., tweets + retweets) generated by each account across the 30 days. As anticipated, humans post statuses less frequently than bots (monthly average of 192 for humans vs. 303 for bots), in all popularity groups except G10M+ , where surprisingly humans post slightly more than bots. The sheer bulk of statuses generated by G10M+ (on average 2,852 for bots, 3,161 for humans in a month) is likely to acquire popularity and new followers. Overall, bots constitute 51.85% of all statuses in our dataset, even though they are only 43.14% of the accounts. ACM Transactions on the Web, Vol. 13, No. 1, Article 7. Publication date: February 2019.
A Large-scale Behavioural Analysis of Bots and Humans on Twitter                                                 7:11

Fig. 3. Content creation: Tweets issued, retweets issued, replies, and mentions; account reciprocity: follower-
friend ratio.

   An obvious follow-up is what do accounts tweet? This is particularly pertinent as bots are often
reputed to lack original content. To explore this, we inspect the number of tweets vs. retweets
performed by each account. Figure 3(a) and (b) presents the empirical distributions of tweets and
retweets, respectively, over the 30 days. We see that the retweet distribution is rather different
to tweets. Bots in G1M , G100k , and G1k are far more aggressive in their retweeting; on average,
bots generate 2.20× more retweets than humans. The only exception to this trend is G10M+ , where
humans retweet 1.54× more often than bots. This is likely driven by the large number of tweets
generated by celebrity users. Typically, humans do generate new tweets more often, while bots rely
more heavily on retweeting existing content. Generally, humans post 18 tweets for every retweet,
whereas bots post 13 tweets for every retweet in all popularity groups except G10M+ (where both
entities show similar trends).
   While tweets and retweets do not require one-to-one interaction, a further type of messaging
on Twitter, via replies, does require one-to-one interaction. These are tweets that are created in re-
sponse to a prior tweet (using the @ notation). Figure 3(c) presents the distribution of the number
of replies issued by each account. We anticipate that bots post more replies and mentions given
their automated capacity to do so. However, in G10M+ both bots and humans post a high number
of replies, and bots post only marginally more than celebrities. While bot-masters in G10M+ de-
ploy chatbots to address simple user queries, celebrities reply to engage with their fanbase. It also
possible that celebrities employ managers as well as automation and scheduling tools (Section 4.5)
for such a purpose. Bots in the remaining popularity groups respond twice as frequently as their

                              ACM Transactions on the Web, Vol. 13, No. 1, Article 7. Publication date: February 2019.
7:12 Z. Gilani et al.
Fig. 4. Content popularity: Likes per tweet and retweets per tweet.
human counterparts. Again, this is driven by the ease by which bots can automatically generate
replies: only the most dedicated human users can compete.
4.2 Content Popularity
The previous section has explored the amount of content generated by accounts; however, this does
not preclude such content from being of a low quality. To investigate this, we compute standard
popularity metrics for each user group.
First, we inspect the number of favourites or likes received for tweets generated by the accounts.
This is a reasonable proxy for tweet quality. These features are retrieved from [favorite_count]
and [retweet_count] attributes within the tweet structure. These attributes can then be accumu-
lated for the observed time period. Recall that we collect all available data from the Streaming API
for April 2016. The Streaming API is a live stream and does not present an option for gathering
historical data. However, we do not require historical data because our observation is set within
a certain timeframe. In fact, historical data in this instance will pollute our dataset and bias the
consequent results.
Figure 4(a) presents the empirical distribution of the number of favourites or likes received for
all the tweets generated by the profiles in each group. A significant discrepancy can be observed.
Humans receive far more favourites per tweet than bots across all popularity groups except G1k .
Close inspection revealed that bots in G1k are typically part of larger social botnets that try to pro-
mote each other systematically for purposes as outlined in Section 1. In contrast, human accounts
are limited to their social peers and do not usually indulge in the “influence” race. For G10M+ , G1M
and G100k popularity groups, humans receive an average of 27×, 3×, and 2× more favourites per
tweet than bots, respectively. G1k bots are an exception that receive 1.5× more favourites per tweet
than humans. These findings suggest that: (i) the term popularity may not be ideally defined by the
number of followers and (ii) human content gathers greater engagement due to its personalised
attributes.
A further stronger sign of content quality is another user retweeting content. Humans con-
sistently receive more retweets for all popularity groups G10M+ : 24-to-1, G1M and G100k : 2-to-1,
except G1k : 1-to-1. This difference, shown in Figure 4(b), is indicative of the fanbase loyalty,
which is vastly higher for individual celebrities than reputable organisations. In other words, the
quality of human content appears to be much higher. We then inspect who performs the retweets,
i.e., do bots tend to retweet other bots or humans? We find that bots retweeting bots is over 3×
greater than bots retweeting humans. Similarly, humans retweeting humans is over 2× greater
ACM Transactions on the Web, Vol. 13, No. 1, Article 7. Publication date: February 2019.A Large-scale Behavioural Analysis of Bots and Humans on Twitter 7:13
Fig. 5. Content consumption: Likes performed, favouriting behaviour.
than humans retweeting bots. Overall, bots are retweeted 1.5× more often than humans. This
indicates a form of homophily and assortativity.
4.3 Content Consumption
Whereas the previous metrics have been based on content produced by the accounts under study,
our dataset also includes the consumption preferences of the accounts themselves. Hence, we ask
how often do bots “favourite” content from other users and how do they compare to humans? Intu-
itively, bots would be able to perform far more likes than humans (who are physically constrained).
Figure 5(a) shows the empirical distribution of the number of likes performed by each account. It
can be seen that, actually, for most popularity groups (G1M , G100k , G1k ), humans favourite tweets
more often than bots (on average 8,251 for humans vs. 5,445 for bots across the entire account
lifetimes). Linking into the previous discussion, it therefore seems that bots rely more heavily on
retweeting to interact with content. In some cases, the difference is significant; e.g., humans in
G1M and G100k place twice as many likes as bots do. G10M+ , however, has an average of 1,816 by
humans compared to 2,921 by bots. We conjecture that there are several reasons for this trend:
(i) humans “appreciate” content more than bots, and demonstrate this via likes; (ii) bots are work-
ers for their human managers and serve a purpose, which may not require them to like other
tweets; and (iii) humans have a social incentive to like other tweets, potentially as a social practice
(with friends) or in the hope of receiving likes in return [30].
We also noted that these consumption patterns are impacted by the age of the bots. For example,
Figure 5(b) plots the number of favourites performed by an account vs. the age of the account.
It can be seen that more recent (i.e., modern) bots are significantly more aggressive in liking
other tweets. Older bots, instead, use this feature less frequently; deeper inspection suggests this
is driven by the trustworthy nature of older bots, which are largely run by major organisations
Figure 6 presents the relationship between the age of the accounts and number of retweets
performed, replies and mentions, sources used, and URLs posted during the measurement period.
This reveals trends similar to Figure 5(b), where younger bots more aggressively retweet content
(Figure 6(a)), perform replies and mentions more often (Figure 6(b)), and post URLs with tweets
more frequently (Figure 6(d)). Again, this appears to be driven by the nature of these newer
bots, which are exploiting retweets, replies, mentions, and URLs for easy content generation
and dissemination vs. older bots, which carry out less spamlike activity. This, however, does not
hold across all metrics and, indeed, we find cases where account behaviour remains consistent
regardless of age. For example, Figure 6(c) plots the number of sources used by account based on
ACM Transactions on the Web, Vol. 13, No. 1, Article 7. Publication date: February 2019.7:14 Z. Gilani et al.
Fig. 6. Young aggressive bots: Retweets, replies and mentions, sources, URLs.
age; it can be seen that trends are hardly any different across age (i.e., young or old) or type of
account (i.e., bot or human).
4.4 Account Reciprocity
As well as content popularity, we can also measure reciprocity (i.e., friendship). Twitter classifies
two kinds of relationships: reciprocal follower-relationship, i.e., when two accounts follow each
other, and non-reciprocal relationship, i.e., an account has many followers who are not followed
in return (this is often the case for celebrities). We measure this via the Follower-Friend Ratio.
Figure 3(d) shows empirical distribution of the Follower-Friend Ratio for each group of accounts.
Humans display higher levels of friendship (G10M+ : 4.4×, G1M and G100k : 1.33×, G1k : 15×) and thus
a lower Follower-Friend Ratio than bots.
Previous research [11] argues that humans typically have a ratio close to 1; however, our
analysis contradicts this assumption. For celebrities, very popular and mid-level recognition
accounts this ratio is in the order of thousands-to-one, irrespective of whether an account is a
bot or a human (G10M+ : 629,011-to-1 for bots vs. 144,612-to-1 for humans, G1M : 33,062-to-1 for
bots vs. 24,623-to-1 for humans, G100k : 2,906-to-1 for bots vs. 2,328-to-1 for humans). In fact,
even the ratios for low popularity accounts are not 1, but consistently greater (G1k : 30-to-1 for
bots vs. 2-to-1 for humans). This is caused by the human propensity to follow celebrity accounts
(who may not follow in return), as well as the propensity of bots to indiscriminately follow large
numbers of other accounts (largely in the hope of being followed in return).
ACM Transactions on the Web, Vol. 13, No. 1, Article 7. Publication date: February 2019.A Large-scale Behavioural Analysis of Bots and Humans on Twitter 7:15
Fig. 7. Tweet sources: Count of activity sources and type of activity sources.
4.5 Tweet Generation Sources
Finally, we inspect the tools used by bots and humans to interact with Twitter. This is possible
because each tweet is tagged with the source that generated it; this might be the website, a third-
party app or tools that employ the Twitter API. Figure 7(a) presents the number of sources used by
human and bot accounts of varying popularities. Bots migt be expected to use a single source (i.e.,
an API or tool) for tweeting, yet bots actually inject tweets using far more sources than humans
(cf. Table 4).
To explore this further, Figure 7(b) presents the number of accounts that use each source ob-
served. It can be seen that bots use a multitude of third-party tools. Bot news services (especially
from G10M+ ) are found to be the heaviest users of social media automation management and
scheduling services (SocialFlow, Hootsuite, Sprinklr, Spredfast), as well as a Cloud-based service
that helps live video editing and sharing (SnappyTV). Some simpler bots (from G100k and G1k
groups) use basic automation services (Dlvr.it, Twittbot), as well as services that post tweets
by detecting activity on other platforms (IFTTT). A social media dashboard management tool
seems to be popular across most groups except G1k (TweetDeck). Interestingly, it can also be
seen that bot accounts regularly tweet using Web/mobile clients—pointing to the possibility of
a mix of automated and human operation. In contrast, 91.77% of humans rely exclusively on the
Web/mobile clients. That said, a small number (3.67%) also use a popular social media dashboard
management tool (TweetDeck), and automated scheduling services (Buffer, Sprinklr). This is
particularly the case for celebrities, who likely use the tools to maintain high activity and follower
interaction—this helps explain the capacity of celebrities to so regularly reply to fans (Section 4.1).
4.6 Media Upload
Finally, we inspect the actual content of the tweets being generated by the accounts. We do this
using two metrics: number of URLs posted by accounts and the size of media uploaded. Figure 8(a)
presents the scatter plot of the number of URLs (y-axis) and content uploaded in KB (x-axis). Bots
place far more external URLs in their tweets than humans (see Table 4): 162% in G10M+ , 206% more
in G1M , 333% more in G100k , and 485% more in G1k .
Bots are therefore a clear driving force for generating traffic to third-party sites, and upload
far more content on Twitter than humans. Figure 8(b) presents the distribution of the amount
of content uploaded by accounts (e.g., photos). Account popularity has a major impact on this
metric. Bots in G10M+ have a 102× lead over bots in other popularity groups; and humans in G10M+
ACM Transactions on the Web, Vol. 13, No. 1, Article 7. Publication date: February 2019.7:16 Z. Gilani et al.
Fig. 8. Content creation: URLs in tweets, content uploaded on Twitter.
Fig. 9. Media (photos, animated images, videos) uploaded by bots and humans on Twitter.
have a 366× lead over humans in other popularity groups. Overall, bots upload substantially more
bytes than humans do (see Table 4): 141% in G10M+ , 975% more in G1M , 376% more in G100k , and
328% more in G1k . This is due to their ability to automate tasks, while humans are limited by
their physical capacity. It is also worth noting that both content upload and URL inclusion trends
are quite similar, suggesting that both are used with the same intention, i.e., spreading content.
Since bots in G10M+ mostly belong to news media, sharing news headlines is clearly a means of
operating their business. This potentially has a big impact on the network traffic produced as well
as the required network capacity. As the amount of traffic is correlated to the cost and energy [32],
identifying the content produced by a bot is a key step to reshaping or optimising the way that
service providers should deal with this type of traffic and content.
We can also inspect the specific types of the media uploaded. Our data reveal a significant pres-
ence of media content generated by bots. Figure 9 presents a scatter plot comparing the number
of media types uploaded per URI (one URI is a single object). It can be seen that both bots and hu-
mans upload significant quantities; however, it is clear that bots contribute the most. In total, bots
account for 55.35% (12.90GB) of the total photo traffic uploaded in our dataset; 53.58% (1.56 GB) of
the total animated image traffic uploaded; and 40.32% (6.48GB) of the total video traffic uploaded.
This is despite the fact that they only constitute 43.16% of the accounts under study and 53.90%
of the tweets generated. When combined, bots account for a total of 49.52% (20.95GB) of traffic
uploaded.
ACM Transactions on the Web, Vol. 13, No. 1, Article 7. Publication date: February 2019.A Large-scale Behavioural Analysis of Bots and Humans on Twitter 7:17
Fig. 10. Visiting trends to popular URLs by bots and humans.
Briefly, it is also worth noting that many bot accounts post URLs. In fact, 55.28% of all URLs are
posted by bots, despite the fact that bots only make up 43.16% of the accounts. This is important
because these have the potential to trigger further traffic generated amongst the accounts that
view the tweets. To explore this, Figure 10 presents the most popular domains posted by bots
and humans. Significant differences can be observed. For example, whereas humans tend to post
mobile sites (e.g., m.youtube.com and m.facebook.com), bots rather post the desktop version
(e.g., youtube.com and facebook.com). We also see a range of websites exclusively posted by
humans, e.g., espn.com and oprah.com. One can also see a few URLs only posted by bots, but
never by humans. These differences highlighted the differing goals of bots and humans when
posting content, with more well-known websites dominating the human dataset. For example,
the most regularly posted URL in our bot dataset is sunfrogshirt.com, which is actually a website
for purchasing bespoke t-shirts. This highlights a common purpose of media posting on Twitter:
spam and marketing. Note that bots infiltrate human popular URLs more often than humans
infiltrate bot popular URLs. This shows that bots can reach further due to their automated ability
and can considerably impact systems in unusual ways.
5 A WORLD WITHOUT BOTS?
The previous section has discussed the characteristics that make bots and humans different. How-
ever, one of the most important things on Twitter is its social graph, i.e., the interconnections
between users. Hence, in this section, we will briefly inspect the social impact or influence that
bots have on Twitter, as well as the impact of removing them. In this context, we define influence
as the capacity or the ability to drive an action, e.g., sharing an item (whether text, photo or video)
on social media that induces or generates a response.
5.1 How Influential Are Bots?
We begin by inspecting the social influence that bots and humans exercise on Twitter. Influence
(sometimes referred to as induction) is the phenomenon where actions of an individual are af-
fected by other individuals through social interaction. Social interaction can be of two main types:
(i) passive direct interaction (i.e., following); and (ii) active (direct or indirect) interaction (i.e.,
retweeting). The former covers follower relationships, where two users are connected (and seeing
each others’ tweets), but not necessarily directly engaging, e.g., replying or retweeting. The latter
covers retweet, mention and reply activities, where users are directly or indirectly engaging in an
active sense. In this section, we focus only on active interactions as this is a more direct measure
of influence. We therefore construct a graph of these direct/indirect interactions, whereby vertices
are Twitter users (bots or humans), and edges represent active interactions, i.e., retweeted sta-
tuses, quoted statuses, replies, or mentions. As previous research shows [3], influence in OSNs is
ACM Transactions on the Web, Vol. 13, No. 1, Article 7. Publication date: February 2019.7:18 Z. Gilani et al. Fig. 11. Bots vs. humans: Graphs for retweets and quotes of 10M popularity group. Black dots are Twit- ter users, edges represent an interaction. Red edges represent retweeting by bots and Blue edges represent retweeting by humans. directional and position-dependent (i.e., the position in the social graph). Therefore, the influence of a user (vertex) in this context is the sum of direct/indirect but active interactions (edges) it has been engaged in by other users (vertices). To answer how influential bots are, we present interaction graphs that depict retweeted statuses, quoted statuses, replies, and mentions of bots and humans by their followers, in Figures 11, 12, and 13. We use two popularity groups: users with 10M and 100k followers. Each graph includes all other users who are involved in the direct interaction, e.g., all accounts that retweet content generated by the users. For brevity, we do not present results for the 1M and 1k popularity groups as they show similar graphs and properties to 10M and 100k groups, respectively. We use directed edges for our interaction graphs, where an edge is directed from the influencer to the influenced. The mean degree for the 10M popularity group is very similar for both bots (1.18) and humans (1.176). This shows that both humans and bots are tightly intra-connected within their respective assortative neighbourhoods: The assortative intra-connectedness is stronger than diversified inter-connectedness. We also find that bots have almost 2× the mean degree than humans (4.025 vs. 2.164) for the 100k popularity group. This shows that bots have accumulated a large influence both within their assortative as well as diversified neighbourhoods. This is partly driven by the more aggressive tweeting activity of the bots under-study. 5.2 What Happens If Bots Disappear? The above confirms that bots have significant influence in Twitter. Thus, an obvious question is what would happen if all bots were blocked or removed from Twitter? This may shed light on the overall impact (positive or negative) that bots have. If bots produce high amounts of content (tweets, URLs, content size), then their existence should be critical for intermediary connections (or form centrality vertices that sit on critical paths). Figure 11 presents the influence graph for the 10M group for retweets and quotes, as well as the graph after removing bots. The density of edges (due to retweeting and quoting) for both bots (Red) and humans (Blue) emphasises the influence of these vertices within their network. We also notice two separate sub-graphs appearing for bots and humans that confirms most of the connections are between similar entities, i.e., bots following other bots, and humans following other humans. ACM Transactions on the Web, Vol. 13, No. 1, Article 7. Publication date: February 2019.
You can also read