Reliability assessment of existing structures using results of nondestructive testing
←
→
Page content transcription
If your browser does not render page correctly, please read the page content below
Received: 6 April 2021     Revised: 29 June 2021     Accepted: 6 July 2021
DOI: 10.1002/suco.202100226

TECHNICAL PAPER

Reliability assessment of existing structures using results
of nondestructive testing

Stefan Küttenbaum1    | Thomas Braml2 | Alexander Taffe3 |
Sylvia Keßler4  | Stefan Maack1

1
 Bundesanstalt für Materialforschung und
-prüfung (BAM), Division 8.2: Non-
                                                      Abstract
destructive Testing Methods for Civil                 Making optimal decisions about the reliability of existing structures requires
Engineering, Berlin, Germany                          that the information used in assessment adequately represents the properties
2
 Universität der Bundeswehr München,
                                                      and the condition of the structures. The knowledge gap regarding a structure
Institute for Structural Engineering,
Neubiberg, Germany                                    to be assessed can be successively filled by individually purposeful observations
3
 HTW Berlin — University of Applied                   on site. This paper gives an overview of an approach for utilizing nondestruc-
Sciences Department 2: Engineering—                   tively gathered measurement results in reliability assessment of existing struc-
Technology and Life, Berlin, Germany
4
                                                      tures. An essential part of measurement-based stochastic modeling of basic
 Helmut Schmidt University/University of
the Federal Armed Forces Hamburg,                     variables is the calculation of measurement uncertainties, which serves to
Chair of Engineering Materials and                    establish confidence in measurement, to ensure the comparability of unambig-
Building Preservation, Hamburg,
                                                      uously expressed measurement results, and to quantify the quality of the mea-
Germany
                                                      sured information. Regarding the current discourse on how to treat
Correspondence                                        information collected on-site in the context of assessment, the authors recom-
Stefan Küttenbaum, Bundesanstalt für
Materialforschung und -prüfung (BAM),
                                                      mend that measurement uncertainty becomes an uncertainty component man-
Division 8.2: Non-destructive Testing                 datorily to be represented in measurement-based stochastic models. The main
Methods for Civil Engineering, Unter den              steps of the proposed concept are presented, and the advantages of its applica-
Eichen 87, 12205 Berlin, Germany.
Email: stefan.kuettenbaum@bam.de
                                                      tion are emphasized by means of a prestressed concrete bridge as case study.
                                                      The bridge is assessed regarding the serviceability limit state decompression
                                                      using ultrasonic and radar data measured at the structure.

                                                      KEYWORDS
                                                      bridge, existing structures, FORM, measurement, NDT, nondestructive testing, prestressed
                                                      concrete, probabilistic methods, reassessment, reliability, stochastic modeling, uncertainty

                                                                                      1 | INTRODUCTION

                                                                                      The aging of structures, deteriorating conditions, and
                                                                                      changing loads only represent a variety of reasons for
                                                                                      which the reliability assessment of existing structures is
Discussion on this paper must be submitted within two months of the
print publication. The discussion will then be published in print, along
                                                                                      an ongoing key challenge both nationally and interna-
with the authors’ closure, if any, approximately nine months after the                tionally, and a highly topical issue in standardization
print publication.                                                                    (cf.1). Calculated values of reliability measures such as

This is an open access article under the terms of the Creative Commons Attribution License, which permits use, distribution and reproduction in any medium, provided
the original work is properly cited.
© 2021 The Authors. Structural Concrete published by John Wiley & Sons Ltd on behalf of International Federation for Structural Concrete.

Structural Concrete. 2021;1–21.                                                                                         wileyonlinelibrary.com/journal/suco            1
2                                                                                                              KÜTTENBAUM ET AL.

the failure probability are not to be understood as struc-     developments in the past decades leveraged to establish
tural properties. They depend on the incorporated knowl-       NDT as reliable and valuable source of information for
edge about the considered system, and can be interpreted       reliability assessments.
as a measure of the quality of the information available           Compared to the rather scientific case study of a box
about the parameters considered important for a deci-          girder bridge presented in Küttenbaum et al.9,10 which
sion.2 Appreciating measurement data in assessment of          has been verified in the ultimate limit states shear and
existing structures has the potential to extend remaining      bending using measured geometrical quantities, this
lifetimes of structures, to avoid closures or use restric-     paper deals with decompression, that is, a serviceability
tions, and to save resources, since initially insufficient     limit state that frequently appears decisive for prestressed
computation models used for the assessment can be              concrete bridge assessment in practice. Another improve-
refined purposefully by individual and quality-assessed        ment is the calculation of measurement uncertainties
observations made on site. This way, both the covered          attributed to the nondestructively measured mounting
uncertainty in and the bias of stochastic models of basic      depths of tendons in relation to the measuring surface.
variables can be reduced, and the level of approximation3
increased.
     Besides the established regular inspections, additional   2 | CONCEPT AND SIGNIFICANCE
advanced measurements on structures have been proven           OF MEASUREMENT U NCERTAINTY
to be suitable and useful in condition assessment.4,5          IN STO CH AS TIC MO DEL IN G
Information on monitoring-supported reliability analyses
can be found, for example, in Frangopol et al.6,7 The pur-     The concept for the reliability assessment of existing
pose of this contribution is to propose an approach for        structures using measured data is outlined in Figure 2.
using measurement data collected nondestructively on           The strategy consists of four steps, on which the structure
site in stochastic modeling of characteristics to be appre-    of the case study in Section 3 is based. The definition of
ciated as basic variables in reliability assessment of exis-   the limit state(s) and the modeling of the initial basic var-
ting structures (see Section 2). The concept is                iables (initial, as they are based on the information avail-
demonstrated by means of a case study (Section 3). The         able prior to testing) serve as the starting point. Based on
investigated prestressed concrete bridge and the structure     this, the preliminary investigations are performed and
scanner system mounted to conduct ultrasonic and gro-          analyzed. This involves an extended, distribution
und penetrating radar measurements automatically are           parameter-specific sensitivity analysis. The result of the
shown in Figure 1. The use of nondestructive testing           first step (Section 3.1) is the reliability-based, that is, indi-
(NDT) results is emphasized because inspections are per-       vidually purposeful definition of crucial basic variables to
formed in many cases when knowledge about a structure          be measured since they significantly influence reliability.
to be assessed is qualitatively or quantitatively insuffi-     In addition, requirements on the measurements, such as
cient, when doubts have arisen about the available infor-      a maximum permissible measurement uncertainty or
mation, or, for example, when visual damage becomes            limits of structural properties, can be derived from the
apparent. Additionally, and in terms of bridge assess-         preliminary reliability analysis. The provision of evidence
ment, traffic loads are continually increasing, and chang-     that the application of a specific measurement procedure
ing climatic actions trigger material degradation. Thus,       meets such specified requirements can be referred to as
further damage (due to testing) should be avoided as far       validation12 and is demonstrated in Section 3.5.
as possible. The utility of NDT in reliability assessment          The inspections to be performed to measure the quan-
should be quantified and the potential of the technical        tity of interest (measurand) defined in the first step with

                                                                                                F I G U R E 1 Photos of the
                                                                                                investigated bridge (left) and of
                                                                                                the mounted structure scanner
                                                                                                equipped with a GPR antenna
                                                                                                (right; extracted from (Maack,
                                                                                                Küttenbaum, Epple, &
                                                                                                Aligholizadeh, 2021)8)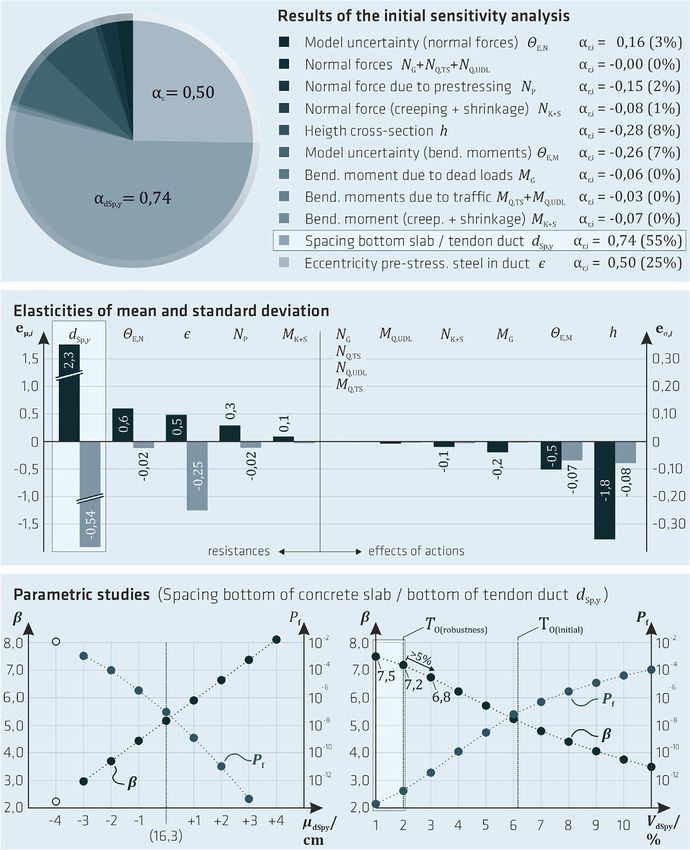
KÜTTENBAUM ET AL.                                                                                                                  3

FIGURE 2      Concept for the reliability assessment of existing structures using measurement data; extracted from Küttenbaum11,
translated

the specified accuracy is planned, conducted, and ana-                basic variables? Which types of uncertainty have to be
lyzed in the second step. An essential component of the               covered in addition to the measurement uncertainty?
measurement evaluation is the measurement uncertainty                 How to ensure the comparability of the measurement
calculation, which will be discussed in more detail below             data-based basic variables? The associated considerations
and is based on the internationally harmonized and                    can be found in this chapter and in Section 3.3. The mea-
accepted Guide to the Expression of Uncertainty in Mea-               surement data-based basic variable is then incorporated
surement (GUM)-framework.13–15 The objective is to                    into the reliability analysis instead of the corresponding
compute a measurement result consisting of a (represen-               initial stochastic model (fourth step acc. to Figure 2, Sec-
tative) measured value and an uncertainty attributed to               tion 3.4). The assessment of an existing structure using
this value (Section 3.2). With regard to the ultrasonic and           measured data can in turn be the starting point for the
ground penetrating radar (GPR) inspections emphasized                 definition of further measurands. The First Order Reli-
in this paper, it should be noted that the quantification of          ability Method (FORM) is applied both in the prelimi-
accuracy in locating construction elements inside the                 nary investigations and in reliability analysis using
concrete such as reinforcement or tendons implies that                measured data.
the objects of interest could be reliably detected objec-                 Stochastic modeling is considered a main issue in reli-
tively. The development of probability of detection                   ability assessment. The standardization of a measure-
(POD)-curves can yield valuable conclusions in this con-              ment data-based stochastic modeling procedure appears
text.16–18 POD is delimited in the present article.                   necessary in order to provide the basis for a consistent
    In a third step, the NDT-supported basic variable is              and homogeneous modeling and decision-making pro-
modeled using the measurement result(s). Principle chal-              cess incorporating information measured on site. Up to
lenges in stochastic modeling such as the choice of a suit-           this point, measurement uncertainty has not been deci-
able distribution family, the tail-sensitivity-problem,               sively integrated into the probabilistic modeling
competing models, statistical uncertainties and correla-              recommendations.
tion have to be appreciated. Furthermore, a consistent                    From the metrological point of view, a measured
interface between metrology and reliability analysis is               value to which no measurement uncertainty has been
needed. How can we link measured values and measure-                  assigned is useless. The calculation of measurement
ment uncertainties to the distribution parameters of the              uncertainty serves to establish confidence in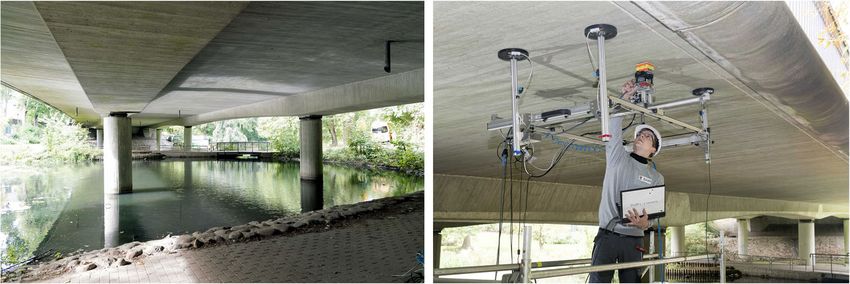
4                                                                                                                            KÜTTENBAUM ET AL.

measurement, to ensure the comparability of measure-            can take on significant values,26 the number of observa-
ment results and to express the quality, that is, trueness      tions in NDT is large in various cases. Thus, the statistical
and precision, of the information measured about a char-        uncertainty may be considered negligible. This finding is
acteristic. In the context of modeling basic variables to be    consistent with the metrological view that statistical
used in assessment, two central requirements on stochas-        uncertainty is commonly insignificant. Further, in rela-
tic models can be met by adequate measurement uncer-            tion to the other uncertainty contributions captured in
tainty considerations: verifiability and comparability.         the model of a measurement, the definitional uncertainty
Moreover, a measurement result is required to be unam-          arising from the limited level of detail of the measurand
biguously expressed and transparently documented.               definition (corresponds as type of modeling uncertainty
Thus, the objectivity is assured in the sense that the cal-     to the lower limit of measurement uncertainty) is consid-
culated results as well as the models, input quantities,        ered negligible according to the GUM-framework.12
and assumptions underlying the measurement uncer-                   It should be conclusively mentioned that a good or
tainty considerations are deniable.                             rather useful measured data-based probabilistic model
    With the Guide to the Expression of Uncertainty in          should cover the uncertainty associated with information
Measurement,13 its supplements, and further recommen-           acquisition and processing besides the uncertainty quan-
dations, such as those recently given in Joint Committee        tifying the inherent natural variability of the considered
for Guides in Metrology,19 metrology provides an interna-       characteristic. The measurement uncertainty describes
tionally harmonized, flexibly applicable, and broadly           the limits of an interval containing the (generally
accepted framework for measurement uncertainty calcu-           unknown) true value of the measurand with a certain
lation. The metrological terms are defined in the interna-      probability, and is epistemic, provided that an alternative
tional vocabulary of metrology (VIM).12 In principle, a         exists to obtain the information (different testing
model of the measurement has to be formulated, which            methods, etc.). A stochastic model that has been created
consists of different input quantities that influence the       based on observations on site and that does not cover the
outcome of the measurement or are necessary for calcu-          uncertainty to be attributed to the information acquisi-
lating the measurement result. These (in most cases ran-        tion and processing appears to be equally useless as a
dom) variables can be mathematically related to each            measurement value to which no measurement uncer-
other in the form of an explicit model equation. Inserting      tainty has been attributed to.
the best estimates of the input quantities into the model           The reliability analyses in the present research work
equation leads to the measured quantity value (of the           were performed using the First Order Reliability Method
measurand). The application of the error propagation law        (FORM) proposed in Hasofer and Lind27 and refined by
to the model equation yields the measurement uncer-             i. a. Rackwitz and Fiessler,28 Hohenbichler and
tainty. The concept is discussed in more detail and             Rackwitz.29 The requirements for the application of this
applied to the specific case study in Section 3.2.              approximation method and information about the trans-
    The calculation (and appreciation) of measurement           formation between the original (x-)space and the stan-
uncertainty should become an integral part in measured          dard (u-)space can be taken from Spaethe30 Rackwitz and
data-based stochastic modeling of basic variables. On the       Zilch31 Michael Hohenbichler and Rackwitz29 Der
one hand, probabilistic models are required to cover all        Kiureghian and Liu.32 The procedure for probabilistic
types of uncertainty relevant for the assessment.20 In gen-     reliability analyses of cross-sections can be found, for
eral, coverage of different types of uncertainties in basic     example, in Faber.22,33,34 The right-hand term in Equa-
variables may be necessary. These include aleatoric             tion (1) describes the approximation solution of the prob-
uncertainty, that is, the inherent natural variability of the   ability of failure Pf according to FORM.
characteristic,21 and epistemic uncertainty. Their differ-
                                                                                ð                       ð
entiation is not necessarily straightforward. However,
                                                                         Pf ¼            f X ðx Þdx ¼            φU ðuÞdu ≈ ΦðβÞ         ð1Þ
model uncertainties, measurement uncertainties, as well                             Vx                      Vu              |fflfflffl{zfflfflffl}
                                                                                                                               FORM
as statistical uncertainties may be characterized episte-
mic.22 More detailed information on uncertainties to be
conceivably covered can be found, for example, in               The solution is based on the search of the value of the
Kiureghian and Ditlevsen,23 Kiureghian,24 Faber.25 On           (geometrical) reliability index β. Since the joint probabil-
the other hand, it has been found that the measurement          ity density function f X ðx Þ of the random vector X (and
uncertainty contributes significantly to the uncertainty to     also the limit state function) cannot be known exactly in
be represented in stochastic models of measured charac-         practice, the measures of structural reliability should be
teristics, at least in NDT on concrete with ultrasonic and      considered as estimators whose values depend on the
GPR methods.11 Even though the statistical uncertainty          accuracy of the parameters incorporated into the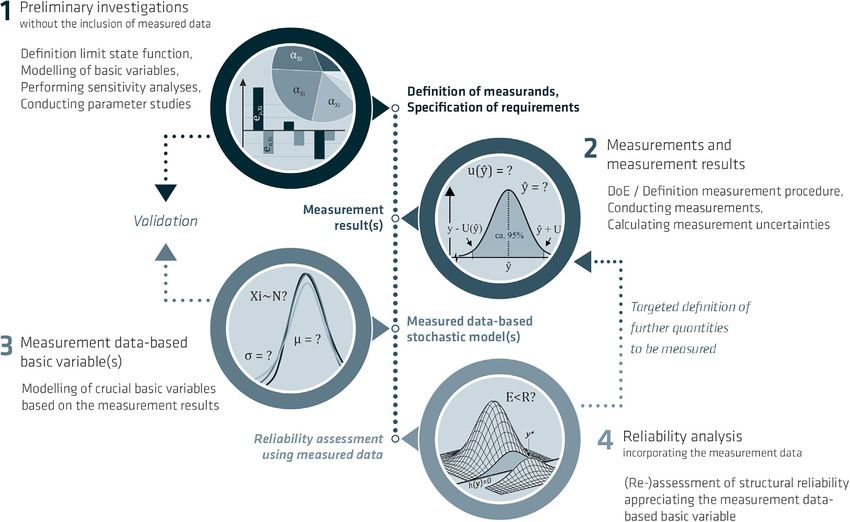
KÜTTENBAUM ET AL.                                                                                                           5

reliability analysis. Roughly speaking, both the result and      relation to the gauge of the bridge and the height of the
the validity (in terms of trueness and precision) of a reli-     beams (approx. 1.20 m up to 1.60 m in the pier area), the
ability analysis depend on the quantity and quality of the       cross-section was constructed comparatively flat. The slab
included relevant information about the analyzed system.         height is reported to be less than 50 cm in most areas. The
Methods for calculating a predictive reliability index that      length of the bridge is 95.80 m. The views and cross-section
incorporates the uncertainties attributed to the parame-         of the bridge shown in Figure 1 can be found in Figure 3.
ters of stochastic or physical models are presented in Der       The structure was built in 1980.
Kiureghian,35 where the inclusion of additional informa-             During the assessment, the serviceability limit state
tion has been found to more likely increase than decrease        (SLS) decompression was found to be decisive in trans-
the value of the predictive reliability index. Furthermore,      verse direction. The decompression proof serves in a
the uncertainties associated with the estimated values of        broader sense to ensure the durability of the structure.
Pf or β can be reduced by reducing the uncertainties in          The main objective is to protect the tendons against cor-
the parameters of the input quantities,35 that is, also by       rosion47 and stress corrosion cracking, respectively, by
incorporating relevant and accurate measurement                  excluding concrete cracking due to tensile stresses in a
results. The values reported in the present paper quantify       certain area around the tendons, at least mathematically.
the reliability index according to Hasofer and Lind27:           It should be noted that the decompression proof is occa-
                                                                 sionally performed very precisely in design for economic
         β ¼ ku k ¼ minfkukg for fu : gðuÞ ≤ 0g          ð2Þ    reasons, since in practice the calculation results often
                                                                 determine the number of tendons to be installed.
In Equation (2), u is the most likely failure point                 Initially, the semi-probabilistic assessment in SLS
(β-point) and kuk the corresponding Euclidean norm.              decompression was attempted using a girder grillage
Search algorithms have been developed to determine this          model. Based on this, the proof could not be successfully
point, which can be found in, among others,.28,36 The            performed in transverse bridge direction. For this reason,
sensitivity coefficients and the elasticities discussed in       a three-dimensional finite element (FE) model consisting
Sections 3.1 and 3.4 have been calculated computer-              of shell elements was developed (see Figure 4a,b). The
aided.37 The sensitivity coefficients allow conclusions to       main advantage of the shell model, that is, that the areal
be drawn about the stochastic significance of the consid-        load-bearing behavior is accounted for, yields lower
ered basic variables. Further information can be found,          values for the internal forces in transverse direction com-
for example, in Rackwitz and Zilch,31 Hohenbichler and           pared to the grillage model. The semi-probabilistically
Rackwitz,38 Ditlevsen and Madsen.2 The elasticities facili-      determined tensile stresses are plotted in Figure 4c for
tate distribution parameter-specific conclusions.                the decisive cross-section in bridge center within the rep-
    European guidelines that mention the use of probabilis-      resentative 1-m-strip on which the assessment is concen-
tic methods in assessment include but are not limited39 to       trated. Due to inconsistencies in the information
the     German         assessment    guideline40   with    its   available prior to any inspections, it could not be decided
               41,42              43          44
supplements,         the Austrian, the Swiss, and the Dan-       sufficiently certain whether the transverse tendons are
ish45 sets of regulations. An example for a level four assess-   located above or below the vertical center of the cross-
ment according to the German guideline including a               section. The tensile stresses calculated on the basis of the
probabilistic assessment can be found in Morgen et al.46         two conceivable model variants differ noticeably
                                                                 according to Figure 4c (cf. stress flows for options 1 and
                                                                 2). Although the first variant results in tensile stresses
3 | P R O B A B I L I S T I C AS S E S S M E N T                 occurring on the upper slab surface, the position of the
OF A P RESTR ESSED C ONCRETE                                     transverse tendons below the cross-section center implies
BRIDGE USING NDT-RESULTS                                         that the simplified decompression proof would have to be
                                                                 performed on the slab undersurface, where no tensile
3.1 | Bridge, limit state, initial stochastic                    stresses have been identified. In the second model vari-
models, and pre-investigation                                    ant, the tendon is located above the center of the cross-
                                                                 section. Tensile stresses do not occur in this case (option
The investigated bridge is a longitudinally and transversely     2 in Figure 4c). In order to evaluate the validity of the
prestressed concrete structure with four spans, is located in    competing prior information about the tendons and vali-
Northern Germany and carries a four-lane federal highway         date the results, the vertical position of the transverse
over a park. The slab-and-beam cross-section with its two        tendons was to be measured nondestructively in crucial
longitudinally haunched main girders is broader than 23 m        cross-sections. The shell model shown in Figure 4a,b was
and widens to the west towards the adjacent junction. In         used to calculate the internal forces for the probabilistic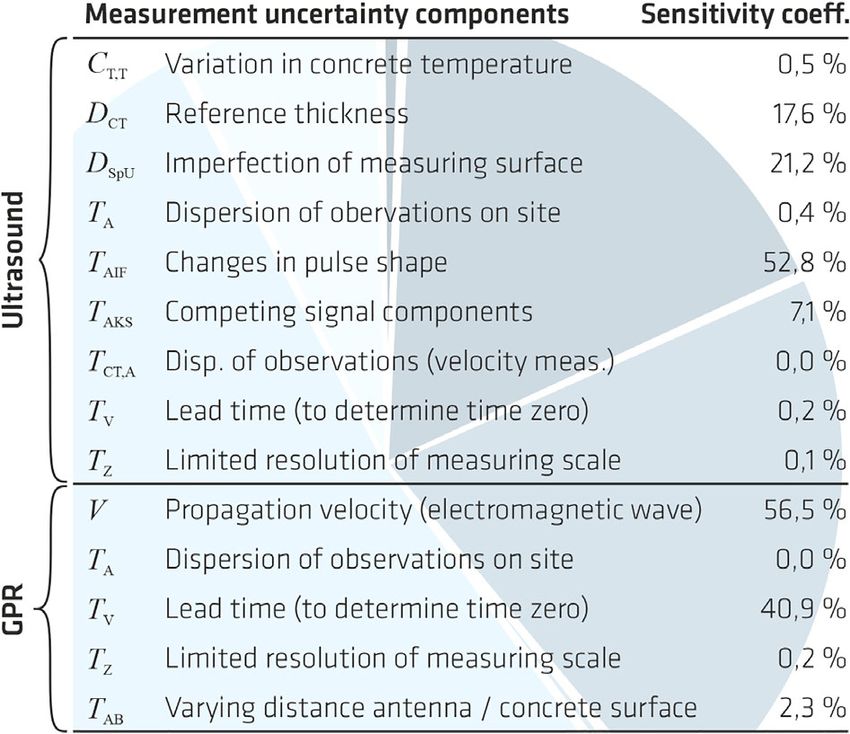
6                                                                                                                               KÜTTENBAUM ET AL.

FIGURE 3      Views on and standard cross-section of the investigated bridge (dimensions stated in meters); extracted from Küttenbaum11, translated

assessment in SLS decompression linear-elastically                             In this case study, the limit state function is developed fol-
assuming the tendon position according to option 2 in                      lowing the design equations given in Eurocode 2.51–53 The
Figure 4c.                                                                 standardized equations provide the basis for the probabilistic
    The calculated characteristic values of the internal                   reliability assessment with regard to single cross-sections. The
forces and moments were converted into probabilistic                       stress analysis is performed time-invariantly. Partial safety
models using common approaches. Since the shell model                      factors were not intended to be modified on the basis of the
was developed to perform the assessment according to                       conducted probabilistic calculations. Creep and shrinkage are
level 2 of the German assessment guideline (see Sec-                       considered finished (t ! ∞). The limit state function is:
tion 2), the loading assumptions provided in Eurocode

149,73,75 are considered. The traffic loads are represented                gðσ c Þ ¼ 0
                                                                                        N M
                                                                                           þ      ¼0
                                                                                                           N M
                                                                                                             þ  zz
using load model 1 (LM 1). With respect to the return                                   A W                A Iy
period of once per 1000 years, the quantile values corre-                        ΘE,N ðN G þ N Q,TS þ N Q,UDL þ N P þ N KþS þ N SE þ N T Þ
                                                                            ¼0
spond to 99.9%-fractiles. This reference was considered                                                    hb
too conservative in Germany, so that the adjustment                           ΘE,M M G þ M Q,TS þ M Q,UDL þ N P  zp þ M KþS þ M SE þ M T h
                                                                                                          h3 b

                                                                                                                                               2
factors were modified and the tandem load acting on                                                           12

the third lane has been delimited within the national                                 h
                                                                           with zp ¼  þ dSp,y þ ε
application document.50 For this reason, the LM 1 con-                                2
sidered in the present assessment corresponds to a                                                                                              ð3Þ
return period of one time in 50 years and yields approx.
98%-quantile values. The associated reference period                       where N and M are the sums of the normal forces and of
has been implicitly modeled using extreme value distri-                    the bending moments calculated using the FE shell
butions representing the internal forces due to traffic                    model, A is the cross-section area, W the section modu-
stochastically.                                                            lus, zp is the lever arm between the vertical center of the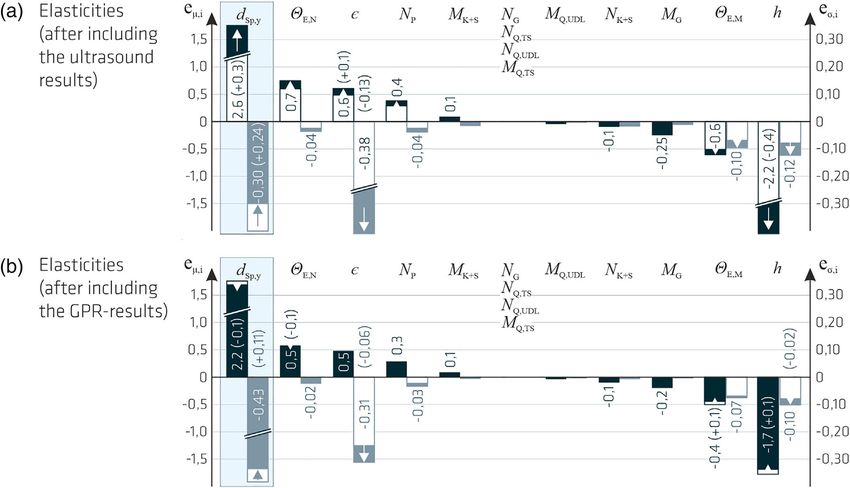
KÜTTENBAUM ET AL.                                                                                                                            7

F I G U R E 4 View of the finite element shell model; a) isometric drawing; b) modelled longitudinal and transversal tendons; c) computed
tensile stresses in transverse direction sy =MPa for the same investigated cross-section based on the competing information available prior to
testing; geometrical dimensions stated in cm; background in c) visualizes the maximum tensile stresses at the upper slab surface regarding
option 1; 4a, 4b extracted from (Internal report, 2016)48; crosssections and stress flows based on (Thierling, 2020)

investigated cross-section and the tendon axis, dSp,y is the             the upper edge of the slab is Pf ≈ 107 . The target reliabil-
spacing between the bottom of the slab and the tendon                    ity value chosen in this case was basically defined for
duct, ϵ the eccentricity of the strands inside the duct, and             new structure design. Approaches for the optimization of
h is the height of the cross-section. Both the detailed                  target reliability levels considering the expected costs
descriptions of the quantities used in Equation (3) and                  over the numerical lifetime of a structure, with respect to
the initial stochastic models are given in Table 1. Their                deviating reference periods, and with regard to the conse-
modeling is based on the information available prior to                  quence classes are presented in Holicky et al.60
any measurements on site.                                                     The vertical position of the tendons significantly
    The results of the preliminary investigations based on               influences reliability. Both the eccentricity of the strands
Equation (3) and on the models provided in Table 1 are                   inside the ducts ϵ and the distance between the bottoms
plotted in Figure 5. The reliability index is β ≈ 5:2 (FORM              of the slab and of the tendon ducts dSp,y can be assigned
result equals to SORM result), which is significantly                    sensitivity coefficients with comparatively large values
larger than the target value βtarget ¼ 1:5 (reference period             αr,ϵ ¼ 0:5 and αr,dspy ¼ 0:74, respectively (cf. initial sensi-
T ¼ 50 a) acc. to EN 1990.59 This finding is consistent                  tivity analysis in Figure 5). The elasticity of the mean of
with the results of the comparative deterministic analysis               dSp,y is noticeably larger than the corresponding value of
in which the concrete around the tendons was obtained                    ϵ because the calculated values are related to a 1% change
to be entirely under compressive stresses (cf. Figure 4c),               in the considered distribution parameter and the mean
option 2). The computed stress in transverse direction on                value of dSp,y is larger (cf. Table 1). The crucial internal
the upper slab surface was found to be σ y,up ¼ 6:96 MPa.               force is the normal force due to prestressing N P . The elas-
The probability of concrete tensile stresses occurring at                ticities of the standard deviations eσ,i indicate that the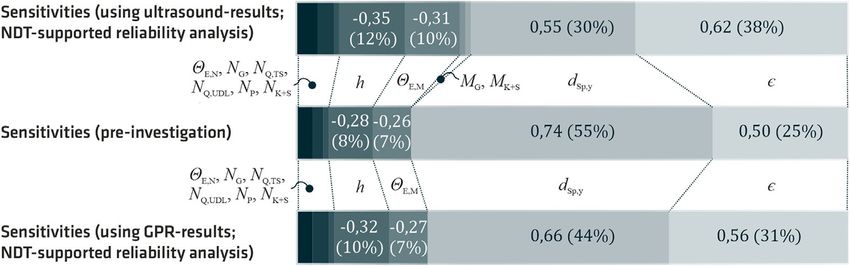
8                                                                                                                             KÜTTENBAUM ET AL.

TABLE 1         Initial stochastic models based on the information available prior to testing; according to11

                                                          Distribution         Mean         Standard deviation and
    Abbr.     Description                                 type                 value        coefficient of variation                 Unit
    ΘE,N      Model uncertainty of the effects of         N (normal            1:0          σ ¼ 0:05
                actions (normal forces)                    distribution)                    CoV ¼ 5:0%
              (values based on Braml54)
    NG        Normal force due to dead loads              N                    1:1 55      σ ≈ 0:07                                 kN=m
                                                                                            CoV ¼ 6:0% (based on Bachmann
                                                                                              et al.56)
    N Q,TS    Normal force due to traffic loads (TS,      GUMBEL               1:23        σ ≈ 0:18 CoV ¼ 15:0%54                   kN=m
               load model 1 acc. to EN 1991–199273)
    N Q,UDL   Normal force due to traffic loads (UDL,     GUMBEL               1:01         σ ≈ 0:15 CoV ¼ 15:0%54                   kN=m
               LM 1 acc. to EN 1991–1992)
    NP        Normal force due to prestressing            N                    2036 55     σ ¼ 203:6 CoV ¼ 10:0% (based on          kN=m
                                                                                              Eichinger57)58)
    N KþS     Normal force due to creep and               N                    270 55       σ ¼ 40:5 CoV ¼ 15:0% (based on           kN=m
               shrinkage                                                                      Eichinger57 Strauss58)
    N SE      Normal force due to load case:              const:               0:63 55                                             kN=m
               subsidence
    NT        Normal force due to load case:              const:               12:80                                                kN=m
               temperature
    hy¼0      Height of the cross-section                 N                    0:327        σ ¼ 0:0134CoV ≈ 3:1%                     m
    ΘE,M      Model uncertainty of the effects            N                    1:0          σ ¼ 0:10 CoV ¼ 10:0%
               of actions (moments)
               (values based on54)
    MG        Bending moment due to dead loads            N                    25:98 55     σ ≈ 1:56 CoV ¼ 6:0% 56                   kNm=m
    M Q,TS    Bending moment due to traffic loads         GUMBEL               0.98         σ ≈ 0:15 CoV ¼ 15:0% 54                  kNm=m
                (TS, LM 1 acc. to EN 1991–1992)
    M Q,UDL   Bending moment due to traffic loads         GUMBEL               4:87         σ ¼ 0:73 CoV ¼ 15:0% 54                  kNm=m
                (UDL, LM 1 acc. to EN 1991–1992)
    M KþS     Bending moment due to creep and             N                    12:0 55     σ ¼ 1:8                                  kNm=m
                shrinkage                                                                   CoV ¼ 15:0% 57,58
    M SE      Bending moment due to load case:            const:               0:37 55                                              kNm=m
                subsidence
    MT        Bending moment due to load case:            const:               0:58                                                kNm=m
                temperature
    dSp,y     Distance between bottom of the slab         N                    0:163 55     σ ¼ 0:0134                               m
                and the bottom of the tendon duct                                           CoV ≈ 6:1%
    ϵ         Eccentricity of the strands inside the      N                    0:03455      σ ¼ 0:0068 34CoV ¼ 20:0%                 m
                tendon duct

reduction of uncertainties represented in the geometric                     position. Such parameter studies, that is, the successive
quantities dSp,y and ϵ leads to a significant increase in                   variation of individual distribution parameters, facilitate
reliability (see elasticities in Figure 5). The functions of                more global conclusions than the sensitivity analyses
the reliability and the failure probability, respectively,                  based on alpha values. They are feasible at least for nor-
against the coefficient of variation V and the mean value                   mally distributed basic variables since both distribution
μ of the vertical tendon duct position, that is, dSp,y , plot-              parameters are independent of each other.
ted at the bottom of Figure 5 are consistent with the find-                     The stochastic significance of the vertical transverse
ings mentioned above. The parameter study of the mean                       tendon position and the large range of variation in reli-
indicates that the values of β and Pf still change signifi-                 ability due to a (without testing possibly undetected and
cantly even with a larger shift in the tendon                               mathematically perhaps unfavorable) deviation of the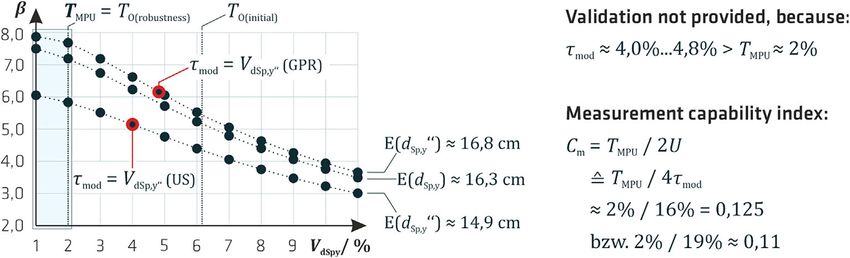
KÜTTENBAUM ET AL.                                                                                                           9

F I G U R E 5 Results of the
individual pre-investigation,
comprising the sensitivity
coefficients (top), the elasticities
of the mean and of the standard
deviation of the basic variables,
and the functions of reliability
against the distribution
parameters of the spacing
between the bottom of the slab
and of the tendon duct (bottom);
extracted from Küttenbaum11,
translated

actual position from the initially assumed one yields the       when the calculated measurement uncertainty is arbi-
definition of dSp,y as measurand. The functions plotted at      trarily small. In this paper, two other validation criteria
the bottom of Figure 5 facilitate the specification of          are used to specify the requirements. First, minor errors
requirements on the measurements based on the results           in the calculation of measurement uncertainty should
of the preliminary reliability analysis. In this specific       not have a disproportionate impact on reliability. That is
case, the objective is to quantify a maximum permissible        why a robustness criterion (in the sense of stability of the
uncertainty T MPU to be represented in the stochastic           results to small errors in the models of the input quanti-
model of the measurement-based basic variable d00Sp,y . The     ties) has been defined. In this specific case, a 1% change
validation in Section 3.5 consists of the comparison of         in the uncertainty covered in dSp,y should not lead to reli-
this upper limit value T MPU with the uncertainty               ability variations greater than 5%. In principle, this limit
achieved. The quantification of the value of T MPU can be       value can be defined individually considering the investi-
based on flexible criteria, for example, on a minimum           gated structure and limit state, respectively, and depends
value requirement for the numerical reliability after           on the risk awareness of the assessing engineer. The suit-
including the measured information. It is evident that          ability of the value chosen in this specific case study is to
validation using this criterion is likely to fail in the case   be proven in view of the comparatively high structural
of an adverse bias in the initial stochastic model even         reliability in SLS decompression by evaluating a number

10 KÜTTENBAUM ET AL.
of other assessment scenarios in subsequent works. Sec- measuring point distance is two centimeters in both lat-
ond, it is required that the uncertainty covered in the eral directions. Commercially available bistatic array
measurement-based basic variable has to be smaller than transducers, each consisting of 12 parallel-connected
or equal to the initially modeled uncertainty. In this indi- transmitting and receiving dry point contact probes,65 and
vidual case, the robustness criterion has been found to be structural scanners developed at BAM (see Figure 1, right)
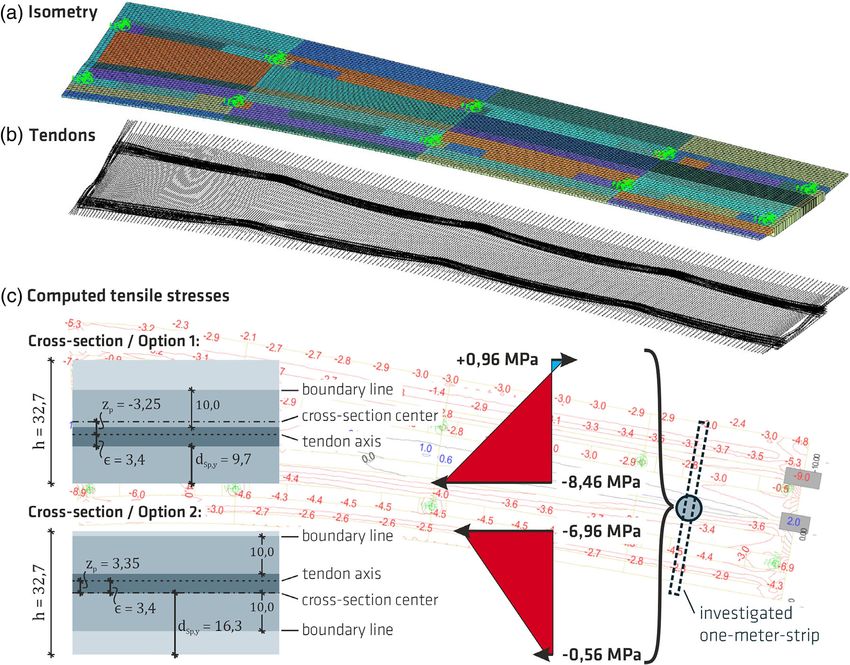
decisive in determining T MPU . Since the gradient of the were applied. The imaging of the data measured over half
reliability index against the coefficient of variation of the cross-section width is shown in Figure 6 including
dSp,y is greater than 5% when V dspy ≥ 2%, it follows that indications of four transverse tendons inside the slab and
T MPU ¼ T OðrobustnessÞ ¼ 2% (cf. Figure 5, bottom right). It various longitudinal tendons inside the main girder.
should be noted that such low values of measurement uncer- In the following, it will be shown how a (quantitative)
tainty are rarely calculated when applying ultrasound or measurement result, whose quality is evaluated and
GPR to localize the (relative to the measuring surface) axial whose comparability is ensured, can be derived from
position of a single construction element inside the concrete. such (qualitatively) imaged, nondestructively measured
findings. For this purpose, the concept of calculating
measurement uncertainties according to GUM13 will first
3.2 | Measurements and measurement be briefly outlined.
results The objective is to stochastically model the measurand Y
by computing the measurement result. One part is the
The vertical position of the transverse tendons is measured calculation of the best estimate of the measurand by rep-
using both the ground penetrating radar (GPR) and the resenting the measurement result (measured quantity
ultrasonic pulse echo method. Since the measuring surface value). Because of a certainly existing lack of knowledge,
is spanned on the undersurface of the slab, the quantities this value is generally considered as approximation of the
dS,i,y (GPR) and dSp,i,y (ultrasound), which are referred to purely theoretical true value of the investigated charac-
as sampling points in this paper, describe the distance teristic. Thus, there is basically an uncertainty associated
between the lower edges of the tendons and the concrete with the measured value by, which we can refer to as mea-
undersurface. The time signals recorded in a certainly small surement uncertainty. By definition, the measurement
area (biaxial a few centimeters) around an analyzed mea- uncertainty quantifies the dispersion of the values
suring position are appreciated to calculate these sampling assigned to the measurand based on the incorporated
points. The reason is that localization first requires the reli- information.12
able detection of a reflector. For this, in turn, data must be The key part in GUM-framework and the prerequisite
recorded and evaluated at equidistant measuring points for the calculation of the measurement result consisting
around the decisive cross-section in reliability assessment. of the measured value by and the attributed measurement
A sampling point is calculated for the ith tendon at location uncertainty, is the modeling of the measurement. Since a
y in transverse bridge direction. It should be noted that, variety of components may contribute appreciably to the
for example, the measured spacing between the trans- measurement uncertainty, the measurement model is
verse tendons can also be incorporated into the FE model composed of a number of input quantities. These quanti-
and the reliability analysis, respectively. General informa- ties are usually treated as random variables and charac-
tion on nondestructive testing methods for civil engineer- terized by certain probability distribution functions.66
ing, on the ultrasonic technique, and on GPR on concrete The input quantities can be denoted by X i . The func-
can be found in ACI 228.2R-1361, IAEA62 and Gucunski tional relationship of these input quantities X i can be for-
et al.63. The individually performed GPR measurements mulated in the form of an explicit model equation:
are described in Küttenbaum et al.64 and taken up in this
paper for comparative purposes. The following discussion Y ¼ f ðX 1 , …, X n Þ ð4Þ
focuses on the ultrasonic measurements exemplarily. The
measurement models used to derive the individual mea- The GUM provides two types of evaluation for the quanti-
surement uncertainties were developed in Küttenbaum11, fication, that is, the stochastic modeling, of the identified
where detailed information about the individual testing and relevant input quantities X i . The evaluation of mea-
on site, further measurement models suitable to provide surement series using statistical methods is termed Type
orientation for future and comparable measurement sce- A evaluation and presupposes that the included observa-
narios, and a comprehensive discussion of the calcula- tions are independent, identically distributed (iid). This
tions can also be found. requirement can be at least approximately met for ultra-
The measurements were performed at a center frequency sonic and GPR measurements by considering time signals
of f ¼ 55 kHz. The sampling rate is f s ¼ 1 MHz and the recorded in a certainly small area around the measuringKÜTTENBAUM ET AL. 11
F I G U R E 6 Imaging of the
ultrasonic measurement data
with indications of four
transverse tendon ducts inside
the slab, of various longitudinal
tendon ducts inside the beam,
and of the upper concrete edge;
extracted from Küttenbaum11,
translated
point of interest (sampling point). The Type B evaluation of Regarding Type A evaluation, the sample mean x is consid-
the input quantity is based on nonstatistical methods. Scien- ered the best estimate b
x of a (directly measurable) input
tific judgments are permissible, which may be founded on quantity in many cases, provided that systematic mea-
subjective information. Accordingly, knowledge available surement errors b have been corrected.
prior to testing can be processed and the requirement for-
!
mulated in ISO 239420 that the incorporation of subjective 1X n
information in uncertainty quantification shall be feasible b
x ¼ x b ¼ xi b ð5Þ
n i¼1
is fulfilled. Regarding the choice of a distribution type in
Type B evaluation, reference to the principle of maximum
entropy67 may be useful. Especially if the number of obser- The standard measurement uncertainty uðb x Þ is to be
vations is limited, the application of statistical methods may attributed to the best estimate b
x of an input quantity, can
lead to less reliable results compared to Type B evaluation. be interpreted as standard deviation of this mean σ X and
Overall, both evaluation types A and B count as equal. is calculated by dividing the sample standard deviation S12 KÜTTENBAUM ET AL.
vffiffiffiffiffiffiffiffiffiffiffiffiffiffiffiffiffiffiffiffiffiffiffiffiffiffiffiffiffiffiffiffiffiffiffiffiffiffiffiffiffiffiffiffiffiffiffiffiffiffiffiffiffiffiffiffiffiffiffiffiffiffiffiffiffiffiffiffiffiffi
and the square root of the number n of independently u n
uX Xn1 X n
observed measured values: uðbyÞ ¼ t c2i u2 ðb xi Þ þ 2 ci cj u b x i ,b
xj ð8Þ
i¼1 i¼1 j¼iþ1
sffiffiffiffiffiffiffiffiffiffiffiffiffiffiffiffiffiffiffiffiffiffiffiffiffiffiffiffiffiffiffiffiffiffiffiffiffiffiffiffiffiffi
S 1 X n
uðb
x Þ ¼ pffiffiffi ¼ ðx i x Þ2 ð6Þ In Equation (8), the empirical
n nðn 1Þ i¼1 covariance of two input
quantities is denoted by u b x j , and the sensitivity coef-
x i ,b
A standard deviation of a parameter generally expresses ficient associated with the input quantity X i by ci . These
the expected uncertainty in the estimate of that parameter coefficients correspond to the slope of the linearized
.2 Thus, the standard measurement uncertainty in Equa- model equation at the operating point and are calculated
tion (6) may be taken as a measure of how well the mean from the partial derivatives of the model equation with
of the observed values approximates the expected value of respect to the individual input quantities at the coordi-
a (normally distributed) measurand.13 It characterizes the nates of the best estimates b
xi.
dispersion of an estimator68 or, more specifically, the accu- The combined standard uncertainty uðbyÞ expresses
racy of the best estimate of the measurand. The standard the measurement uncertainty as an estimated standard
deviation of the mean σ X appreciates the convergence deviation of the measured quantity value by. In metrology,
behavior of the mean against a theoretically exact value. the central limit theorem is often cited as a justification
It can be interpreted in such a way that the true value for the choice of the normal distribution as representa-
falls into an interval x σ X ; x þ σ X at a level of confi- tion of Y. As already provided within the GUM-frame-
dence of, for example, 68%. Thus, σ X characterizes the work14, additional Monte-Carlo-Simulation results were
scattering behavior of the characteristic of interest, that used in the present case study to verify this choice. The
is, of the directly measurable quantity. The “more com- introduction of the expanded measurement uncertainty
mon” standard deviation σ X , on the other hand, describes is delimited in this paper. Further information can be
the dispersion of observations (in the case of normal distri- found in Joint Committee for Guides in Metrology.13
bution around the mean) and can be interpreted such The individual model function applied for calculating
that, for example, approximately 68 values out of the vertical position of a transverse tendon using the
100 future individual observations will be included in an ultrasonic echo technique is given in Equation (9). The
interval ðx σ X ;x þ σ X Þ. Consequently, future individual measurand, that is, the vertical position dSp,i,y of the ith
observations are predicted. Basically, when modeling an tendon in direction of the transverse bridge axis y, is
input quantity, the objective is not to predict future observa- modeled as a function of the travel time T of the pulse
tions, but to describe the quantity to be measured, that is, a and of the propagation velocity C T of the elastic wave
characteristic. This is also the purpose in modeling basic vari- inside the measuring object:
ables. A distribution characterized by σ X facilitates the pre-
diction of what values the characteristic to be measured CT T
dSp,i,y ¼ DSp,U ð9Þ
will take on a given level of confidence based on the incor- 2
porated information provided the characteristic relates to
the mean. Thus, the choice of the standard deviation of where CT ¼ T C ,A T2D CT
A,IF T V T Z
CT,T and T ¼ T A T A,KS
T
the mean is consistent to the purpose in this paper. T A,IF T V T Z:
The choice of a normal distribution for Type A evalu- The symbols used in Equation (9) are explained in
ated input quantities can be justified by the central limit Table 2. The underlying evaluation types and the devel-
theorem. In this specific case, the number of observations oped stochastic models representing the input quantities
is comparatively large, since NDT was applied. In other can be found in Table 2 as well. The relevance of the con-
cases, it is conceivable that the t-distribution is better tributing uncertainty components are shown for both the
suited to describe a directly measured quantity. individual ultrasonic and the GPR measurements in
The best estimate of the measurand — the measured Figure 7.
quantity value by— is calculated by inserting the best esti- The formulation of a stochastic model representing
mates of the input quantities b x i into the model function an input quantity is illustrated subsequently using one
expressed explicitly in Equation (4). example each for the Type A and the Type B evaluation.
The aim of a time-of-flight measurement is to determine
by ¼ f ðb
x 1 , …,b
xnÞ ð7Þ the time span needed for a pulse to travel a certain dis-
tance within the measuring object. A recorded time sig-
Conclusively, the error propagation law is applied to the nal contains (at least partly) in addition the time span
model equation to derive the combined standard mea- required to generate, transmit, and sample the signal—
surement uncertainty uðbyÞ: the so-called lead time T V . The systematic error due toKÜTTENBAUM ET AL. 13
T A B L E 2 Stochastic models of the input quantities in Equation (9) used to determine the vertical position of a transverse tendon in the
decisive cross-section in the center of the bridge11
Distribution Mean Standard
Abbr. Description Evaluation type type value uncertainty
DCT Reference thickness B U (uniform) 32.7 cm 0.58 cm
T CT ,A Dispersion of observations (for velocity A (on site; 7 N (normal) 225.429 μs 0.202 μs
measurement in cross-section center) observations)
T A,IF Changes in pulse shape B U 4.1 μsa 5.77 μs
TV Lead time (to determine time zero) A (3.330 N 27.83 μsa 0.33 μs
observations)
TZ Limited resolution of measuring scale B U 0 μs 0.289 μs
1
C T,T Variation in concrete temperature B U 0ms 8.66 m s1
TA Travel time observed on site (cross-section A (on site; 7 N 104 714 μs 0.286 μs
center) observations)
T A,KS Competing signal components B U 2 μs 1.16 μs
DSp,U Imperfection of measuring surface B U 0 cm 0.289 cm
a
The systematic measurement errors marked with an asterisk were corrected during the reconstruction of the measurement data, that is performed to derive
spatially resolved volume information as well as the imaging shown in Figure 6 in excerpts, as they influence the quality of the focused indications.
observations,
ME respectively.
Calculating the difference
T V ¼ T 2 2T 1 ME
yields the best estimate bt V ¼
27:83 μs and
applying Equation (8) the standard uncer-
tainty u btV ¼ 0:33 μs assuming T V N. In this way, the
lead time is modeled using statistical methods (Type A)
for the individually used equipment and considered
material.
Another input quantity can be traced back to the
circumstance, that the spring-mounted probe is pressed
onto the concrete surface during ultrasonic testing. In
principle, the measuring surface is considered as a flat
reference to specify a perpendicular depth position.
Although surface irregularities might be recorded in the
measuring series ðT A Þ, the indicated depth positions of
the reflectors would shift when incorrectly assuming a
flat reference surface. In the present case, the modeling
of the imperfections of the measuring surface DSp,U based
F I G U R E 7 Uncertainty balance – sensitivity coefficients on standardized tolerances as limit values seems too con-
attributed to the single uncertainty components
servative, since no irregularity has been visually observed
on site. Instead, a deviation compared with an ideal refer-
the recorded lead time was estimated and corrected based ence surface of ΔD ¼ 5 mm is estimated. Since only two
on a Type A evaluation, that is, laboratory measure- boundary values can be derived from this estimation,
ments. Areal measurements were carried out on a uniform distribution
pffiffiffi with E D Sp,U ¼ 0 cm and
reinforced concrete specimen whose properties are repre- u bdSp, U ¼ 2ΔD=ð2 3Þ ≈ 0:29 cm is chosen based on the
sentative for the investigated bridge. The idea was to esti- principle of maximum entropy. In the case that such a
mate the lead time on the basis of the time marks of the simply via Type B evaluation determined model should
backwall echo T ME 1 and the time marks of the multiple be insufficient for the individual purpose, it can generally
reflection of the backwall T ME 2 . Bandpass filtered raw be refined by, for example, measuring the irregularities
data were evaluated and the maximums of the envelope on site.
(ME) according to Hilbert picked. The measuring series The computation of the individual ultrasonic mea-
1 N ð337:38 μs; 0:119 μs) and T 2 N ð646:93 μs;0:221 μsÞ
ME
T ME surement results is based on the GUM concept outlined
were derived from n1 ¼ 1:938 and n2 ¼ 1:392 above, the input quantities provided in Table 2, and14 KÜTTENBAUM ET AL.
T A B
L E 3 Ultrasound
and GPR results for the tendon position
dN μ¼b d, σ ¼ u b d at y ¼ 0 cm computed using the common
GUM-approach acc. to the main document Joint Committee for
Guides in Metrology13 and comparison with Monte-Carlo-
simulation results (M-C-S; 107 runs); results extracted from
Küttenbaum11
Combined
Measured standard
Measurement Evaluation value uncertainty
method method b (cm)
d u db (cm)
Ultrasound GUM 14.889 0.628
M-C-S 14.89 0.63
F I G U R E 8 Measured quantity values for the sampling points GPR GUM 16.791 0.806
expressing the vertical position of a transverse tendon referring to M-C-S 16.79 0.81
the concrete undersurface based on the ultrasonic and GPR
measurements11, excerpt, translated
Equation (9). The plot in Figure 8 shows the calculated antenna and measuring surface then tends to zero. How-
measured quantity values b dS,i,y (GPR) and b
dSp,i,y (ultra- ever, without additional knowledge it can only be
sound), each quantifying the vertical position of the decided arbitrarily which measured value is to be attest a
lower edge of the ith tendon duct related to the slab greater validity. Thus, the GPR result competes in the
undersurface. The values correspond to sampling points cross-section center with the ultrasound result. One
spaced Δy ¼ 50 cm between the center of the cross-section option for processing the competing models in assess-
and one of the main girders. The position y ¼ 0 cm (cross- ment is to apply the principle of imprecise probabilities69
section center) is investigated for the subsequent use in as outlined in section 5.4.
reliability assessment (Section 3.4). In this paper, the sec- The measurement results for the position to be
ond tendon shown in Figure 6 (areal perspective) from assessed in y-direction can be found in Table 3. Both
above is discussed representatively. The combined stan- quantities can be adequately represented using a nor-
dard uncertainties of the sampling points were deter- mal distribution as verified by the slight difference
mined to be u b dSp,i,y ¼ 6 mm…7 mm depending on the between the results based on simulation and on the
conventional GUM-method. Conclusively, it should
position in y-direction, that is, on the mounting depth.
be mentioned that the correlations between the Type
The ultrasound and GPR results are largely consistent A evaluated input quantities estimated by the empiri-
with each other. A significant difference has been found cal covariance have no discernible influence on
for the tendon position at the center of the cross-section the values of measurement uncertainty in this
(y ¼ 0 cm in Figure 8). In Küttenbaum11 it is shown that particular case.
the values measured over a range of 30 cm in y-direction
are not covered by the overlap of the coverage intervals
spanned vertically around the radar and ultrasonic mea- 3.3 | NDT-supported basic variables
surement values. These intervals are assumed to contain
the value of the measured characteristic in this specific In order to facilitate the utilization of on-site measure-
case with a probability of approx. 95%. A conceivable rea- ment results in reliability reassessment, two research
son for the difference is the relatively large spacing domains, that is, assessment of structures and metrology
between the GPR antenna and the measuring surface on needs to be brought together. The starting point for the
site of locally (especially in the cross-section center) sev- NDT-supported modeling of basic variables as proposed
eral centimeters. The bias of the GPR result referring to in Figure 2 is the measurement result expressed
the values based on the ultrasonic measurements can be according to GUM (cf. Table 3). Although the tabulated
traced back to the robustness in ultrasound testing with results in this case study correspond to the NDT-based
respect to the “roof-shaped” edge in the cross-section cen- models of the basic variables, some general consider-
ter, as the transducers are applied directly onto the con- ations should be made. The GUM provides a universally
crete surface. The measured values can be verified by applicable method whose application yields comparable
manual GPR measurements because the spacing between and revisable results that can guide comparable futureKÜTTENBAUM ET AL. 15
measurement uncertainty considerations. The calculated basic variables, as required, for example, in Ditlevsen and
values are rather realistic than conservative in the sense Madsen,2 and the distribution types, respectively, would
of disproportionately large. 13 This is advantageous be meaningful in order to prevent arbitrary decisions
because realistic values should run through the assess- in modeling that may significantly influence reliability.
ment process and not increasingly conservative Another issue is the appreciation of prior knowl-
values. Additional safeties can still be conclusively edge. In this specific case, all information available
captured in decision-making regarding the structural prior to testing has been incorporated into the measure-
reliability. Another argument in favor of the GUM- ment uncertainty calculation. Further prior knowledge
application is that the evaluation of measuring series does not have to be processed, because time-invariant
with common statistical methods does not expect to quantities are considered, and the sample size is com-
lead to workable solutions, 70 since the determined dis- paratively large (due to the composition of the
tribution then does not allow any inferences to be measurand from a number of uncertainty components
drawn about those realizations which have not been and nondestructive testing). Further, the measured data
observed. In Thoft-Christensen and Baker70 it is con- comprehensively describe the characteristic of interest,
cluded that the reasonable approach is to synthesize that is, the vertical tendon position. A different situa-
the distribution of a random variable (as in GUM- tion may occur with composite measurands such as the
framework) from all available information on uncer- center of a tendon bundle. The incorporation of prior
tainty components. knowledge (e.g., using the Bayes' theorem) may also be
GUM and FORM are not methodically merged, among necessary if the information available does not facilitate
others because an impracticable number of basic variables a reasonable decision on which of many models is best
in assessment may arise, because the measurement results suited to represent a characteristic. Competing models
could no longer be verified intermediately and since the may exist in practice, for example, when two different
operating points in linearization of the limit state function measuring methods are applied, and different measure-
and the model equation differ. The combined standard ment results obtained (as shown in this case study). In
uncertainty uðbyÞ corresponds to the square root of the var- this paper, the different variants of the models are
iance of the distribution of the measurand. The expanded processed via the principle of imprecise probabilities.69
uncertainty U ðbyÞ, in turn, is an interval estimator and a Both NDT-based models are entered successively, and
multiple of uðbyÞ. Computing such intervals may be use- the effects of choosing one out of two apparently
ful. However, its calculation does not affect the shape of equally suitable models are estimated by calculating
the distribution of the measurand. Thus, both the mea- reliability twice.
surement uncertainty and the inherent variability of the Regarding the specific modeling of the ultrasound-
characteristic, that is also captured in the measuring based basic variable it should be added that the measured
series, are covered by using uðbyÞ as starting point for quantity value which is required to be corrected for
modeling the scattering behavior of the measurement- systematic errors corresponds to the mean value of the
supported basic variable. Moreover, the measured quan- normally distributed basic variable. The standard uncer-
tity value by is suitable to determine the expected value of tainty uðbyÞ covers the inherent variability and the
the basic variable—especially if the assumption of a nor- measurement uncertainty as a standard deviation.
mal distribution is justified. Since a basic variable should The statistical uncertainty has been found to be less than
cover all types of uncertainty relevant to describe a 0.1 mm.11 The additional coverage does not reveal any
characteristic,20 the additional incorporation of uncer- noticeable impact on structural reliability. In view of
tainties related to modeling random variables or physical the tail-sensitivity-problem, an additional justification
phenomena, human factors, and competing models, and of the normal distribution (besides the central limit the-
also statistical uncertainty may be necessary in order to orem and modeling recommendations34 for geometrical
obtain an adequate representation of the characteristic dimensions) may be based on the finding, that the
being modeled.22–24 Fundamental challenges in stochastic design value of the vertical tendon position in cross
modeling for the calculation of very small probabilities section center dSp,y in original space is enclosed by an
such as the quantification of correlation and the tail-sensi- interval bounded by three times the standard uncertainty
tivity-problem23 should also be noted. The latter does not uðbyÞ around the measured value by. There are no excessive
affect the present case study, since both the modeling rec- doubts about the suitability of the distribution of the
ommendations (and thus the initial stochastic model) as measurand to describe the characteristic of interest in
well as the NDT-based model are represented by normal a certain (physically meaningful) area around the best
distributions. Nevertheless, guidance regarding the tails of estimate by.You can also read