Deep Learning for Walking Behaviour Detection in Elderly People Using Smart Footwear - MDPI
←
→
Page content transcription
If your browser does not render page correctly, please read the page content below
entropy
Article
Deep Learning for Walking Behaviour Detection in Elderly
People Using Smart Footwear
Rocío Aznar-Gimeno * , Gorka Labata-Lezaun, Ana Adell-Lamora, David Abadía-Gallego                                           ,
Rafael del-Hoyo-Alonso and Carlos González-Muñoz

                                          Department of BigData and Cognitive Systems, Instituto Tecnológico de Aragón, ITAINNOVA,
                                          María de Luna 7-8, 50018 Zaragoza, Spain; glabata@itainnova.es (G.L.-L.); adell@itainnova.es (A.A.-L.);
                                          dabadia@itainnova.es (D.A.-G.); rdelhoyo@itainnova.es (R.d.-H.-A.); cgonzalez@itainnova.es (C.G.-M.)
                                          * Correspondence: raznar@itainnova.es

                                          Abstract: The increase in the proportion of elderly in Europe brings with it certain challenges that
                                          society needs to address, such as custodial care. We propose a scalable, easily modulated and live
                                          assistive technology system, based on a comfortable smart footwear capable of detecting walking
                                          behaviour, in order to prevent possible health problems in the elderly, facilitating their urban life as
                                          independently and safety as possible. This brings with it the challenge of handling the large amounts
                                          of data generated, transmitting and pre-processing that information and analysing it with the aim of
                                          obtaining useful information in real/near-real time. This is the basis of information theory. This work
                                          presents a complete system aiming at elderly people that can detect different user behaviours/events
                                          (sitting, standing without imbalance, standing with imbalance, walking, running, tripping) through

                                   information acquired from 20 types of sensor measurements (16 piezoelectric pressure sensors, one
Citation: Aznar-Gimeno, R.;
                                          accelerometer returning reading for the 3 axis and one temperature sensor) and warn the relatives
Labata-Lezaun, G.; Adell-Lamora, A.;      about possible risks in near-real time. For the detection of these events, a hierarchical structure of
Abadía-Gallego, D.; del-Hoyo-Alonso,      cascading binary models is designed and applied using artificial neural network (ANN) algorithms
R.; González-Muñoz, C. Deep               and deep learning techniques. The best models are achieved with convolutional layered ANN and
Learning for Walking Behaviour            multilayer perceptrons. The overall event detection performance achieves an average accuracy and
Detection in Elderly People Using         area under the ROC curve of 0.84 and 0.96, respectively.
Smart Footwear. Entropy 2021, 23, 777.
https://doi.org/10.3390/e23060777         Keywords: assistive technology; elderly people; wearable devices; smart footwear; deep learning;
                                          artificial neural networks
Academic Editors: Felipe Ortega and
Emilio López Cano

Received: 10 May 2021
                                          1. Introduction
Accepted: 15 June 2021
                                          1.1. Context
Published: 19 June 2021
                                                The proportion of elderly people in Europe has been increasing in recent years and
Publisher’s Note: MDPI stays neutral
                                          is expected to follow a clear upward trend in the coming years, reaching 29.4% of the
with regard to jurisdictional claims in
                                          total population in 2050 [1]. This ageing population is due to falling fertility rates and
published maps and institutional affil-   increasing life expectancy, the latter due to numerous advances in science, technology,
iations.                                  medicine and public health, combined with increased awareness of nutrition and personal
                                          hygiene [2,3]. Although the increase in demographic longevity can be seen as one of
                                          history’s great success stories, it has social consequences and challenges that need to be
                                          addressed, such as custodial care. One third of people over 75 have physical, mental or
Copyright: © 2021 by the authors.
                                          sensory impairments [4] and therefore need long-term custodial care. This care can be
Licensee MDPI, Basel, Switzerland.
                                          provided in institutional care or at home. Studies have shown that older people living in
This article is an open access article
                                          institutional care experience a higher level of dependency, loneliness and decreased life
distributed under the terms and           satisfaction and that they prefer to live in their own homes [5–7]. Living in their own home
conditions of the Creative Commons        provides them with greater independence, reduces social isolation with a positive effect on
Attribution (CC BY) license (https://     the elderly [8]. However, ageing at home implies addressing certain aspects of home care.
creativecommons.org/licenses/by/                The use of approaches and techniques for the care of the elderly has become an emerg-
4.0/).                                    ing challenge that needs to be addressed in a way that supports, facilitates and enables

Entropy 2021, 23, 777. https://doi.org/10.3390/e23060777                                                      https://www.mdpi.com/journal/entropy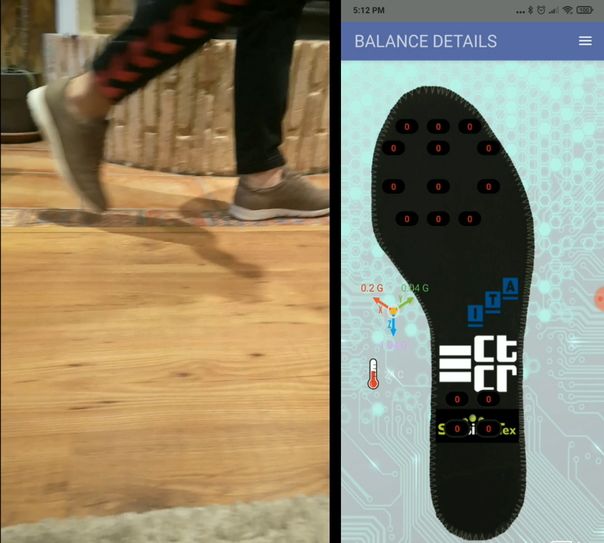
Entropy 2021, 23, 777                                                                                           2 of 19

                        them to age with a better quality of life and as independently as possible. To this end,
                        smart home systems [2,9–12] and assistive technologies (AT) [13,14] have been developed.
                        They are based on the implementation of different sensors and devices (Internet of Things,
                        IoT). However, their adoption may raise certain barriers [15] and concerns on the part of
                        older adults related to how they perceive these technologies [16], such as privacy, ease
                        of use, lack of training or suitability for everyday use [17]. This leads to high rates of
                        dissatisfaction and abandonment of assistive technology and its use. Another aspect of
                        abandonment is related to the design, aesthetics or unobtrusiveness of the device [18].
                              The integration of sensors and devices generates large amounts of real data and in-
                        formation, which brings with it the challenge of handling this data, pre-processing and
                        analysing it in order to obtain useful information in real time. This is the basis of the
                        fundamentals of information theory, which was conceived by Claude Shannon in 1948 [19].
                        Information theory is a subfield of mathematics that deals with the quantification of in-
                        formation, the representation of information and the ability of communication systems to
                        transmit and process information. The need for this theoretical basis arose in the face of the
                        increase in complexity and the massification of communication channels in the mid-20th
                        century. Extrapolating it to the 21st century, with the development of concepts such as
                        IoT, Artificial Intelligence, Big Data, Machine Learning, Deep Learning, the fundamentals
                        of information theory remain basic foundations today. One of the important concepts of
                        information theory is the quantification of the amount of information through the use of
                        probabilities (“entropy”). This concept of information theory has had great contributions
                        in areas such as machine learning and neural networks. In particular, the computation
                        of information and entropy is a useful tool in machine learning and is used as a basis for
                        techniques such as feature selection, decision tree construction, imbalance calculations in
                        the target class distribution and, in general, when optimising classification models (e.g.,
                        artificial neural networks) considering cross-entropy as a loss function. The application of
                        models based on artificial neural networks and particularly Deep Learning has become
                        widespread in recent years due to its ability to automatically detect the most particular
                        features of data, which has led to promising performance in many areas such as, in particu-
                        lar, sensor-based activity recognition [20–23] and in the application of smart homes and
                        wearable devices [24–26].
                              Thanks to the fundamentals related to information theory, the miniaturisation of
                        sensors and the improvement of data storage and transmission systems have been possible
                        and is one of the reasons for the success of monitoring and pattern detection through
                        IoT devices and sensors, particularly in the integration of fabrics and textiles (“smart
                        fabrics/wearable”) [27–30]. Particularly, the data retrieved by sensors can be used to
                        monitor the elderly in real time and predict their behaviour, preventing potential health
                        problems, while providing them with independence and facilitating them urban living.
                        Furthermore, ensuring that the electronics are fully integrated into the fabric ensures truly
                        wearable products without discomfort.
                              The research problem of this article is based on the detection of walking behaviour of
                        elderly people using wearable AT prototype for everyday use by using deep learning algo-
                        rithms. This work is result of the European project MATUROLIFE (Metallisation of Textiles
                        to make Urban living for Older people more Independent Fashionable) [31], which has
                        been carried out within the framework of the Horizon 2020 (The EU-Horizon2020 (H2020-
                        EU.2.1.3. Leadership in enabling and Leadership in enabling and industrial technologies—
                        Advanced materials)). The project aim was to research, innovate and develop a more
                        integrated assistive technology in textiles and fabrics through the use of advanced materi-
                        als, allowing sensors and electronic devices to be fully integrated into intelligent fabrics in
                        a discreet, fashionable and comfortable way [32–36]. The project studied the incorporation
                        of sensors in three prototypes of AT for everyday use: clothing, furniture and footwear,
                        that will make urban living for older adults easier, more independent, fashionable and
                        comfortable. In the article we focus on the smart footwear prototype.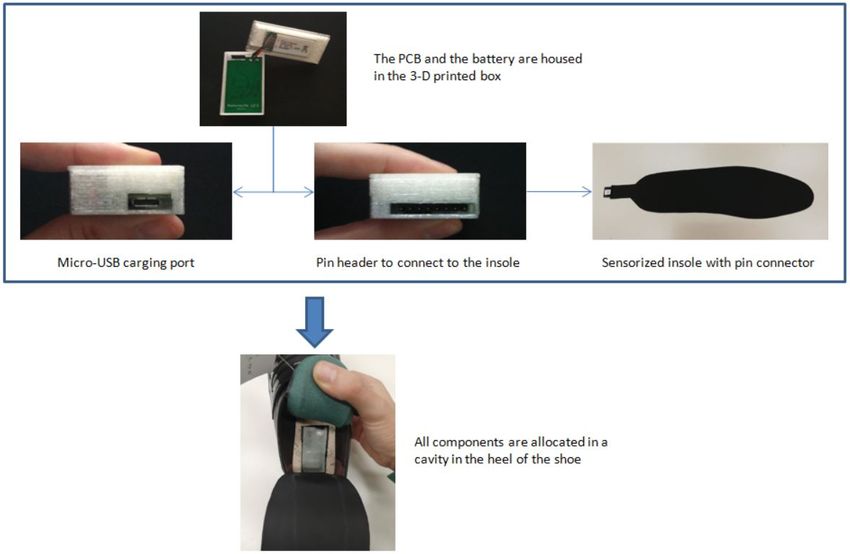
Entropy 2021, 23, 777                                                                                            3 of 19

                        1.2. Related Work
                              Research and study of the walking behaviour detection through the use of footwear
                        incorporating sensors (smart footwear) has been widely explored in last years [37]. Abnor-
                        mal walking behaviour can indicate danger and detecting it can prevent potential health
                        problems, such as injuries that can be caused by falls [38–42]. This is of great interest to the
                        elderly population, as it allows them to lead a comfortable, more independent and safer
                        urban life by monitoring their activity.
                              De Pinho et al. [43] presented the results of an experiment aimed at detecting 6 types
                        of activities (walking straight, walking slope up, walking slope down, ascending stairs,
                        descending stairs and sitting) from information retrieved from smart shoes. The exper-
                        iment involved 11 participants, 2 of whom were elders. The classifier used a Random
                        Forest algorithm with leave-one-out cross validation, achieving good average accuracy.
                        A set of 12 features were considered as model inputs: 2 axis of the gyroscope, 2 axis of the
                        magnetometer, 1 axis of the accelerometer, 4 force-sensitive resistors (FSRs), 2 Euler angles
                        and the cumulative difference between samples of the barometer. el Achkar et al. [44]
                        studied also the recognition of daily activities (level walking, sitting, standing, up/down
                        stairs, up/down hill, elevator use) of older people. For this purpose, ten elderly people
                        wearing the instrumented footwear system carried out the activities in a semi-structured
                        protocol. The smart footwear included inertial and barometric pressure sensors, a sen-
                        sorised insole to measure foot pressure and a box with electronics that strapped to the ankle.
                        A decision tree incorporating rules inspired by movement biomechanics was applied as
                        activity classification algorithm, achiving a high overall accuracy.
                              Zitouni et al. [45] designed a discreet, comfortable and highly effective device that
                        is housed in the insole and a fall detection algorithm based on acceleration and time
                        thresholds. Six subjects between 25 and 30 years of age were tested for possible falls
                        that an elderly person may have while performing daily activities of daily living. They
                        validated the proposed prototype and algorithm in real time (in a real public demonstration)
                        confirming satisfactory performance. Montanini et al. [46] presented a low complexity and
                        threshold-based methodology capable of detecting a fall and notifying a monitoring system.
                        The smart shoes were equipped with 3 FSRs and a tri-axial accelerometer and tied to a belt
                        an external processing unit box. These devices enabled the analysis of the subject’s motion
                        and foot orientation, recognizing abnormal configurations. Laboratory tests involved 17
                        healthy subjects (aged between 21 and 55 years) and provided satisfactory performances in
                        falls detection. The proposed method was also validated with two elderly users in a real-life
                        scenario. Light et al. [47] mentioned the need for the use of monitoring systems for older
                        people because of their high risk of falls and other mobility problems. They developed
                        an optimized layout of pressure sensors for a smart- shoe fall monitoring application by
                        analysing various machine learning algorithms with 10-fold cross validation that classify
                        fall types. Subjects between the ages of 20 and 45 years participated in the data collection.
                        The activities carried out in this experiment were falling-left, falling right, falling-forward,
                        falling-backward, standing, walking, and kneeling down. Sim et al. [48] attached an
                        accelerometer on the shoes (tongue) to detect fall in the elderly. 3 axis- acceleration signals
                        were measured in three young subjects (2 young males, 1 young female, aged between
                        24 and 28). The fall types used in this study were the most common fall types in elderly
                        people. The results of the fall detection algorithm showed that this shoe-based fall detection
                        system had relatively high sensitivity.

                        1.3. Limitations of Existing Practices
                              The related studies have some limitations related to different aspects such as the com-
                        fort and usability of the smart footwear, the set of events capable of detection, the provision
                        of a real-time detection and notification system, and the modularity and scalability of
                        the system.
                              For greater comfort and ease of use of the footwear, it is desirable that sensors and
                        electronic devices are fully integrated into the shoe without direct contact with the rest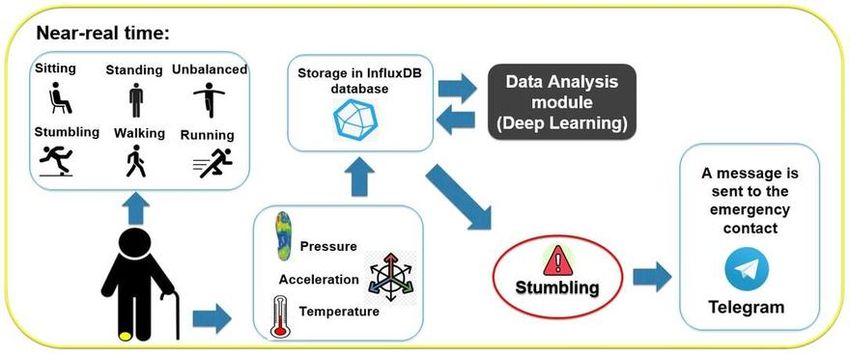
Entropy 2021, 23, 777                                                                                             4 of 19

                        of the person’s body. This aspect is not fully addressed by some of the related works.
                        The prototype of el Achkar et al. [44] housed an electronic box strapped directly to the ankle.
                        Montanini et al. [46] did not fully integrate everything into the shoe either. Light et al. [47]
                        mentioned that the insole was tied to the user’s leg using paper tapes, which could cause
                        some discomfort, especially when removing these tapes from the subject’s leg. The design
                        of the prototype of Sim et al. [48] also had some limitations. The accelerometer module
                        of the prototype could easily detached because it was attached to the outside of shoes,
                        as well as encumbering some activities, and the battery was slightly heavy. The authors
                        suggested reducing the size of the module and embedding it under the insole, as well as
                        incorporating piezoelectric elements to solve the problem with energy harvesting. All these
                        factors represent a clear limitation, as they are less comfortable and intrusive devices that
                        prevent certain activities from being carried out with complete normality.
                              Regarding the considered events, some of the studies focus on detecting more common
                        events related to the user daily activity (sitting, walking, going up/down stairs, etc.) [43,44],
                        while other studies focus only on immediate risk events such as falls [45–48]. However,
                        there is a lack of studies proposing a system capable of detecting a broader spectrum of
                        events, both hazard events and daily activity events.
                              Concerning the detection algorithms used, most studies proposed simple rule-based
                        Machine Learning algorithms (decision tree [44], random forest [43]) or threshold-based
                        methodologies [45,46]. Although in all cases the authors reported achieving good perfor-
                        mance, they did not mention guarantees of modularity and scalability for the detection of
                        new events or new functionalities and models. In addition, rule-based algorithms may be
                        not very robust and have a higher risk of overfitting, with the risk of not generalising well
                        to a different population.
                              There are also limitations in the related studies in terms of the provision of a sys-
                        tem with practical real-time applicability. Most papers studied the scope of the system
                        (algorithm and smart footwear) in terms of event detection but either did not validate
                        it in real-time or did not provide a complete real-time detection and notification system.
                        Montanini et al. [46] foreseed as future work the integration of a notification service for
                        caregivers and Sim et al. [48] to develop a better smart-shoes system that shows the fall
                        information on a smartphone and is therefore able to detect falls only with shoes and
                        a smartphone.

                        1.4. Proposed Solution
                             We propose a system based on smart footwear capable of detecting different walk-
                        ing behaviours and warning the person responsible for the elderly person of possible
                        risks in near-real time via a Telegram message. Figure 1 shows a general outline of the
                        proposed system.

                        Figure 1. General outline of the proposed system.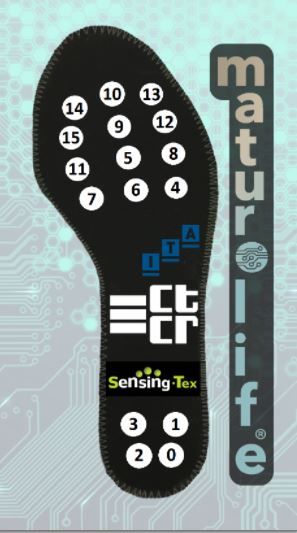
Entropy 2021, 23, 777                                                                                            5 of 19

                             The system is able to detect 6 events (sitting, standing still without imbalance, standing
                        with imbalance, walking, running and stumbling) from the information retrieved from
                        the pressure, acceleration and temperature sensors incorporated in the smart footwear.
                        For this purpose, Deep Learning techniques and neural networks algorithms are applied,
                        following an architecture that allows the system to be easily modulated, scalable and robust.
                        In addition, advanced materials were used in the design of the smart footwear, so that
                        the sensors and electronic devices are fully integrated into the shoe in a discreet, elegant
                        and comfortable way. This is important to encourage their use because, as mentioned
                        above, suitability for everyday use, design, aesthetics, discretion and comfort are important
                        aspects to their adoption. Many of the related studies introduced in the previous section
                        do not fully address this aspect.
                             In conclusion, the system we propose includes a smart footwear, comfortable for
                        daily use, that retrieves real-time information of the elderly person walking and is able to
                        detect a wide set of events and warn the responsible person of possible dangers, allowing
                        to act quickly to avoid potential health problems. Therefore, unlike most related works,
                        in addition to studying the retrieved data and generating classification models based on
                        deep learning, we developed a system useful for real practice that allows act and send
                        notifications to the mobile phone in near real time. Furthermore, our system detects both
                        events of possible immediate risk (imbalance, stumbling) and more common events in
                        daily activity (walking, for example), making it a more complete behaviour detection
                        system with greater practical interest. Another of the differential aspects that our proposal
                        addresses is to ensure a scalable and easily modular system (it allows to be recreated
                        with new functionalities) and alive, external to possible errors or failures in the sensors,
                        for example.
                             To realise this whole system, the fundamentals of information theory were elementary
                        and data analytics played a key role. Our work considered the methodological frame-
                        work related to data analytics CRISP-DM (Cross-Industry Process for Data Mining) [49]
                        which is based on an agile and iterative methodology whose approach consists of sev-
                        eral interrelated phases: Business Understanding (understanding the context from the
                        business perspective), Data Understanding (acquisition and exploration of the data), Data
                        Preparation (pre-processing of the corresponding data for the subsequent use of models),
                        Modelling (generation of Machine Learning and Artificial Intelligence models), Evaluation
                        (evaluation of the results of the models related to the definition of the business objec-
                        tives) and Deployment (deployment of the application). Specifically, the article focuses
                        on the analysis and modelling of data from smart footwear sensors using Deep Learning
                        techniques and artificial neural networks algorithms with cross-entropy loss function.
                        The following sections present the proposed system in more detail, explaining the different
                        modules it integrates, such as the data analysis module carried out, as well as the results
                        and scopes obtained in the project.

                        2. Materials and Methods
                        2.1. System Architecture
                              The final objective of the designed prototype is to be able to use the information
                        retrieved by the sensors implemented in the shoe in order to control the walking and
                        movement behaviour of the user so that the relative responsible for the user or professional
                        health carers can be alerted if a possible risk is detected. The system architecture achieving
                        this is presented in Figure 2. The system architecture has been designed taking into account
                        the potential scalability of the system with a possible growth potential. Kubernetes [50] is
                        the platform used to manage the different components of the architecture.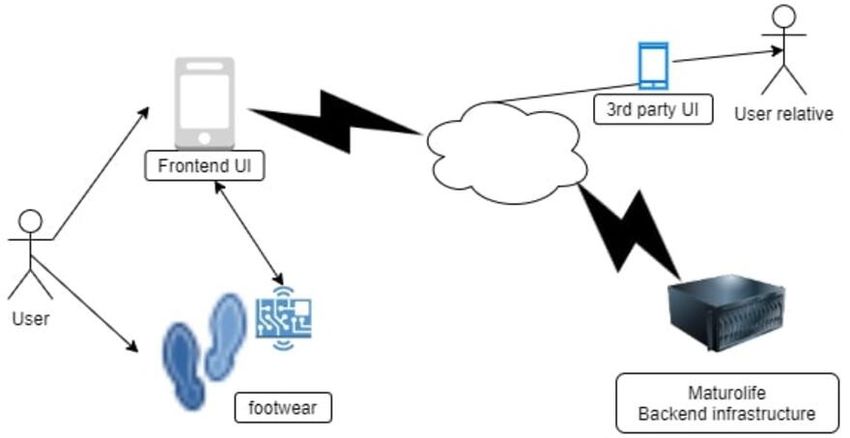
Entropy 2021, 23, 777                                                                                                                          6 of 19

                                     Figure 2. Scheme of system architecture.

                                         The components involved in the architecture and therefore necessary to guarantee the
                                    information flow are: smart shoe, an Android smartphone for the user (in particular, having
                                    installed the MaturoApp application available on the PlayStore), mobile phone for the
                                    responsible person (contact person) with the Telegram application [51], internet connection
                                    (4G–5G) and an infrastructure (server) that supports the management, preprocessing and
                                    modelling of the data. The system is mainly composed of two information transmission
                                    processes: information retrieval flow from the user’s smart footwear to the database and
                                    information exploitation flow from the database to the end user (user relative).
                                         The information retrieval process involves the following components: the smart
                                    footwear, the Android smartphone for the user (MaturoApp), a cloud data manager
                                    (MQTT [52]) and a database for storage. The process is as follows. The smart shoe
                                    generates information about the user gait through the measurements of the implemented
                                    sensors retrieved with an average frequency of 4 Hz. The raw data is coded by the PCB
                                    using scientific notation fixed-point coding. It is then transferred via Bluetooth to the user’s
                                    mobile phone (MaturoApp application), where the values of the pressure sensors can be
                                    displayed in real time. The mobile application transforms the received data chunks and
                                    transmits them via an MQTT message as follows:

     {“timestamp”:“2020-10-25T17:12:24:6847”,“data”:[X1 , X2 , X3 , X4 , X5 , X6 , X7 , X8 , X9 , X10 , X11 , X12 , X13 , X14 , X15 , X16 ]}      (1)

                                    where the timestamp and the values of the 16 pressure sensors (Xi ) are displayed. These
                                    messages are grouped and inserted into an InfluxDB time series database [53].
                                          Simultaneously, the information exploitation process is carried out. It involves the
                                    following components: the database with the retrieved information stored, the Data
                                    Analysis and Modelling module and the mobile phone of the contact person with the
                                    Telegram application. The process is as follows. The latest data stored in the database are
                                    retrieved with an appropriate frequency from the data Analysis module and preprocessed
                                    and prepared in a suitable way for the subsequent application of the artificial neural
                                    networks and Deep Learning models. The model output, as well as its timestamp, are
                                    stored in a table in the InfluxDB database. If the outcome indicates a risky event for the
                                    user, a Telegram message is sent to the emergency contact via the Telegram bot so an action
                                    can be taken. The information retrieval and exploitation system ensures near real-time
                                    event detection.
                                          The following sections explain in detail the sensors implemented in the smart shoe,
                                    the experimental setup and data collection process necessary for the generation of the
                                    models and the data analysis module including sections on data pre-processing, model
                                    architecture and trained artificial neural networks.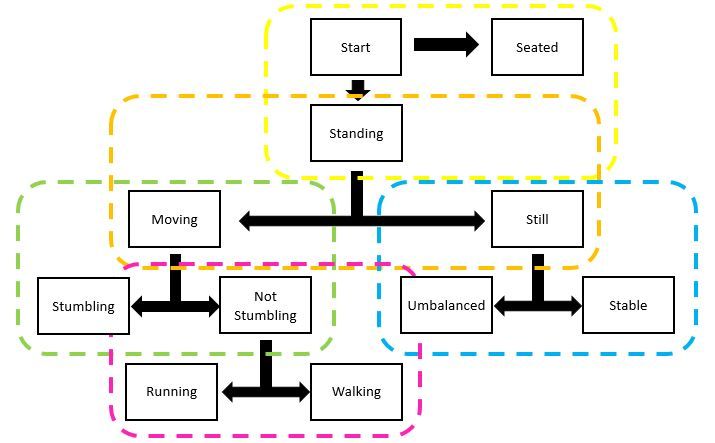
Entropy 2021, 23, 777                                                                                           7 of 19

                        2.2. Smart Footwear Design
                             Prototyped shoes were designed in 2 different models (male and female) and include
                        sensorization and electronics in one shoe of each pair (right foot). In particular, the sen-
                        sorized pairs of shoes that were made available for data collection and analysis were
                        an European size 38 of the women’s shoe model and an European size 41 of the men’s
                        shoe model.
                             The sensors implemented in the shoe retrieve information from three physical mag-
                        nitudes: pressure (16 sensors), temperature (1) and acceleration (one measurement for
                        each axis). The pressure sensors are piezoelectric sensors that are housed along the insole
                        (designed with metallised textile) as presented in Figure 3. In particular, the material used
                        for the produced insoles followed a coating process called electroless copper plating used
                        for the selective metallization of textiles for electro-magnetic interference shielding [33].
                        The printed materials were used on a multilayer solution in which pressure sensors based
                        on Printed Electronic technology are sandwiched between two layers with printed elec-
                        trodes. The temperature sensor and the accelerometer are embedded in a printed circuit
                        board (PCB). In addition to retrieving the temperature and acceleration measurements,
                        the PCB is designed to connect and pre-process the data retrieved from the smart insole
                        (pressure sensors), after a signal conditioning to convert pressure sensors signals into
                        required values for the Analog Digital converters.

                        Figure 3. Location of the piezoelectric sensors on the insole.

                             Besides the sensors, the shoes have a Bluetooth antenna, a battery and a micro-usb
                        connector for charging. All these components and the PCB are housed in a 3D printed box
                        incorporated in the heel area, for which it was necessary to drill a cavity. As it can be seen
                        in Figure 4, the box is divided into two parts: one to hold the battery and the other to hold
                        the PCB. The box has access to charging port and insole connector from outside.
                             Being the insole independent of the PCB allows the insoles to be easily removed and
                        substituted with newer ones by simply unplugging them from the connector. Thus, users
                        can easily replace the insoles if damaged or if newer versions arrive to market.
Entropy 2021, 23, 777 8 of 19
Figure 4. Components of the sensorised shoe.
In order to check that no interactions with other signals occur that could affect the
proper functioning of other surrounding devices, laboratory tests of the implemented
sensorics were performed. The tests performed compared insoles produced with commer-
cial textile sets (made with a flexible substrate circuit) and the ones produced with the
metallized textiles with no variations detected regarding electro-magnetic interferences
and resistance variations for the different forces applied. In addition, the communication
system was designed and verified in such a way that it transmits information correctly and
without error. Specifically, data transmission error rate is near null at the average distance
a potential user could keep the mobile while walking (a pocket, on the hand, etc.), besides,
the PCB is able to store several data chunks at an internal buffer and retransmit them on
error till properly received by the mobile device.
2.3. Experimental Setup. Data Collection
2.3.1. Events
In order to detect possible risks based on the user behaviour, a set of representative
events of the gait to be modeled (supervised learning) was defined. The final classification
models will allow the user behaviour to be related to one of the defined events. The events
considered are the following:
• Sitting: sitting on a chair. May also include movements of the feet or the crossing of
the legs.
• Standing still without imbalance: standing without moving forwards, backwards or
sideways. May also include small foot taps.
• Standing with imbalance: includes lateral, frontal and random imbalances.
• Walking: includes different walking speeds, from slower to more normal.
• Running: running with a higher gait than walking.
• Stumbling: stumbling with the right foot. Includes both more violent and softer stumbles.
The selection criteria for the events was to consider a wide heterogeneous range of
possible user behaviours including both more immediate hazard events and more common
events of daily activity, in order to monitor and prevent possible health problems of the user.
The stumbling and imbalance detection is important as these events indicate a possible
risk of a fall and lack of body control by any user that may lead to a dangerous fall and
negatively affect the user health. On the other hand, although the other events may relate toEntropy 2021, 23, 777 9 of 19
more common and less dangerous events in principle, their detection can also help to inform
us of certain abnormal user behaviours in specific time periods. For example, the detection
of the event “sitting” in a certain time period where the user usually walks may be an
indication that the user has suffered a health problem (e.g., stroke), or the detection of the
event “standing” without movement for a long period of time could indicate disorientation.
As the data retrieval and exploitation system, discussed above, allows the detection of
these events in a small time period (near real time), it enables emergency contacts to act
rather quickly in order to avoid these potential health-related problems.
2.3.2. Data Collection
For the application of the final classification models to detect the events presented
above, it was necessary to generate and retrieve data (temporal information from the sen-
sors) for each event. At the beginning the project activities were scheduled and addressed
to a testing group of elderly participants at the village of Arnedo -La Rioja-. However,
due to the COVID19 pandemic in 2020 that brought an initial lockdown across all Europe
followed by mobility restrictions, they could only participate in the identification of needs
and contribution of ideas to the product design and interaction teams. Therefore, as a con-
sequence of these pandemic limitations, the generation or retrieval of (anonymised) data
from the different defined events had to be finally performed by a group of participants
from the project technical team. The group consisted of 3 people (2 women and 1 man),
aged 26, 27 and 26 years, respectively, and weighting approximately 70 kg each, which
remained stable throughout the study period. As they had different foot sizes, two of the
subjects wore the same pair of shoes (male model) and one of the women wore the other
pair (female model) throughout the study period.
The data collection process was as follows. The subject put the shoe on his right foot,
logged into the MaturoApp application on his mobile phone and performed one of the
events mentioned for a time. While this action lasted, the sensors implemented in the
shoes were capturing acceleration, pressure and temperature values with the frequency
mentioned above. This information was sent via Bluetooth to the Maturoapp application
on the user’s mobile phone where the values of the pressure sensors could be visualised in
real time. This data was stored in InfluxDB as described above with a manually defined
tag identifying the subject, the event to which the data corresponded and the timestamp,
in order to have complete traceability. This process was carried out multiple times by the 3
subjects and for the 6 events.
The database stored a total of 2.5 h of captured data. The first few minutes corre-
sponded to initial recording tests in order to test and become familiar with the data capture
system. Also, as explained later in the article, the models use as input the historical infor-
mation for each time instant. Therefore, the first data captured in each recording were also
not used in the generation of the model because they did not have sufficient historical in-
formation. Finally, the labelled dataset used for the generation of the models corresponded
to a total of approximately 2 h of recording. The number of samples corresponding to each
of the events is shown in Table 1.
Table 1. Number of observations for each event.
Events No of Observations
Sitting 3020
Standing still without imbalance 6920
Standing with imbalance 5230
Walking 9620
Running 3480
Stumbling 820
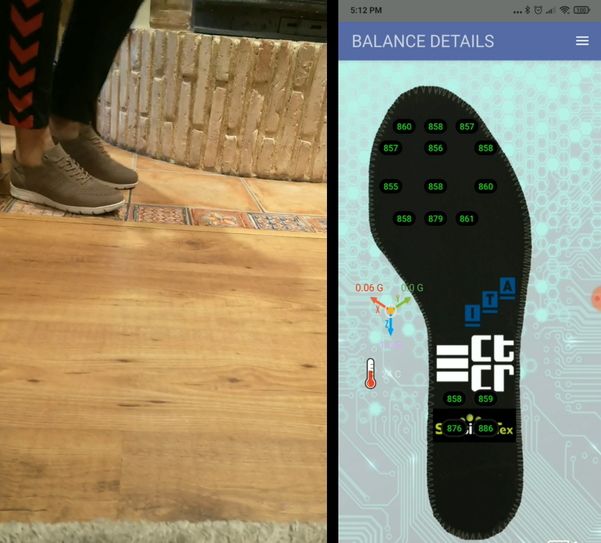
Figure 5 shows an example of data generation for the event “walking”. The figure
displays the person with the sensorized shoe and the image of the insole (shown in theEntropy 2021, 23, 777 10 of 19
MaturoApp) with the measurement information from the pressure sensors in real time.
On the left of the figure is the person with the foot resting on the floor (active sensors with
measurements in green) and on the right with the foot lifted (inactive sensors in red).
Figure 5. Recording data from sensorized shoe. Left: Shoe resting on the floor. Right: Shoe lifted.
2.4. Data Analysis Module
Data Preprocessing
Once the data are captured and stored, a pre-processing of the data is carried out in
order to unify the temporal information retrieved from the sensors before applying models.
Firstly, given that the acceleration sensors and the temperature sensor sent the data
with a certain delay with respect to the pressure sensors, the times recorded by the ac-
celerometer were assigned to the times of the pressure sensors. Thus all sensor readings
ended up having the same time stamp each time a measurement was taken. Secondly,
the maximum number of previous values that the model would use to predict the event
was defined. After testing for computational speed and after having discussed and verified
the time window to detect the event, a maximum of 32 previous values was chosen.
Therefore, the final data structure for each event was as follows (number of samples,
32, 20), the last component being the total number of sensor measurements. That is, each
sample corresponded to a matrix of dimensions 32 × 20 of the form:
Pt0−1 Pt1−1 Pt15 Tt0−1 A0t−1 A2t−1
... −1 ...
P0 Pt1−2 ... Pt15 Tt0−2 A0t−2 ... A2t−2
t −2 −2 (2)
... ... ... ... ... ... ... ...
Pt0−32 Pt1−32 ... Pt15
−32 Tt0−32 A0t−32 ... A2t−32
where “P” refers to the pressure sensor measurements, “A” to the acceleration and “T” to
the temperature, the superscript corresponds, for each type, the sensor number and the
subscript to the instant in time, being “t” the actual instant. Therefore, for each sample,
historical information in the form of the Equation (2) was obtained.
Finally, the data associated with each of the events were divided into three separate
data sets: training (60%), validation (20%) and test (20%), ensuring the same proportion
of samples of each class (event) in each set. The training data was used for model train-
ing/tuning, the validation data was used for selection of the best model configuration
(hyperparameter set) and the test data was used to provide unbiased evaluation metrics to
give a generalized value of the performance of the chosen fitted model.
2.5. Model Architecture
For the prediction of the user state (defined events), different binary models were
generated. The final outcome is the consequence of the application of these binary modelsEntropy 2021, 23, 777 11 of 19
in cascade following the hierarchical structure shown in Figure 6. The underlying idea was
to start from more general binary models of behaviour that include more particular groups
of events and, depending on their outcomes, to continue in the tree with more specific
models, following a hierarchy.
Figure 6. Hierarchical structure of models.
A total of 5 types of binary models were generated: (1) binary model generated from
recorded event information that determines whether the user remains seated or stand-
ing (standing still without imbalance, standing still with imbalance, stumbling, walking,
running); (2) binary model generated from recorded standing event information that de-
termines whether the user remains still (standing still without imbalance, standing still
with imbalance) or moving (stumbling, walking, running); (3) binary model generated
from the information of the recorded non-moving standing events that determines whether
the user is unbalanced or not (standing still stable); (4) binary model generated from the
information of the recorded moving events that determines whether the user stumbles or
does not stumble (walking, running); (5) binary model generated from the information of
the recorded non-stumbling moving events that determines whether the user is walking
or running.
The training and validation of the different binary models is explained in the follow-
ing section.
Artificial Neural Networks
Artificial neural networks architectures with different types of layers including dense
layers, time-distributed dense layers, convolutional layers and long and short term memory
(LSTM) layers were used to train the models.
The dense layer is the regular layer of the deep-connected neural network and the time-
distributed dense layer applies the same dense layer to every temporal slice of an input.
The structure of the convolutional layers has a connection between neurons that is not fully
complete but parameters are shared between different neurons. This particular structure
implies, on the one hand, the ability to learn general and invariant representations of the
data and, on the other hand, the training of complex architectures with less computational
time. The convolution structure used also allowed the use of pooling layers. The LSTM
layers allow for a recurrence and learning of dependencies not only in the short term but
also in the long term.Entropy 2021, 23, 777 12 of 19
For the fitting of the models, the concept of “entropy” from information theory was
used. In particular, cross-entropy was used as a loss function:
N
1
E=−
N ∑ yi · log( p(yi )) + (1 − yi ) · log(1 − p(yi )) (3)
i =1
where yi is the class (1 or 0), and p(yi ) the predicted probability of belonging class 1 for
observation i out of N observations.
In order to avoid overfitting, regularisation techniques such as dropout and EarlyStop-
ping were used so that the model would stop training if it did not improve within a certain
number of iterations.
In the training of each binary event detection model, a hyperparameter search was
performed, allowing to select the number of dense layers to be introduced, whether an
LSTM layer or a convolutional layer was included as well as the value of the hyperpa-
rameters defining each of these neural network layers. The search space is presented in
Table 2. The possibility to select or not the different sensors as inputs was also allowed.
This implies a selection of features that may differ depending on the event to be modelled.
Another parameter to choose was the number of previous timestamps for each event, this
value being a maximum of 32 and a minimum of 4.
Table 2. Search space for each of the parameters when training the model.
Parameters Search Space
No. of hidden Dense/Time Distr. Dense layers [1, 11]
No. of units of each layer [1, 64]
Activation function of each layer {tanh,selu}
Use of Conv. layer {True,False}
No. of filters in Conv. [1, 50]
Size window in Conv. [2, 32]
Activation function of Conv layer {selu,sigmoid}
Use of pooling layers [True,False]
Use of LSTM layer [True,False]
No. of units of LSTM [1, 50]
Learning rate {0.1, 0.01, 0.001}
Optimizer {sgd,adam,rmsprop}
Batch size [1, 50]
This hyperparameter search was carried out automatically using the framework called
Optuna [54]. Optuna is a define-by-run API that allows users to construct the parameter
search space dynamically and implements both searching and pruning strategies. Particu-
larly, the Tree-structured Parzen Estimator (TPE) algorithm [55] was used. Thus, Optuna
allowed training different models considering multiple combinations of hyperparameters.
The selection of the best model configuration was carried out by the validation set. The met-
ric considered was the area under the receiver operating characteristics curve (AUC).
The discrimination ability of the final chosen models was calculated with the test set.
All data analysis and implementation of the models were performed using the Python
programming language v. 3.8. [56].
3. Results
Table 3 shows the neural network architecture configuration of the best models for the
5 classification problems considered. Two of the models (stumble model and unbalanced
model) selected a neural network with a convolutional layer and depth of 11 hidden layers
as the best network configuration. For the stumbling problem 21 filters were chosen and
6 for the imbalance problem. For the rest of the problems, simpler architectures were
chosen, namely multilayer perceptrons with one layer and 3 hidden layers (running vs.Entropy 2021, 23, 777 13 of 19
walking model). The model that discerns between running and walking and the one that
discerns between standing with movement and standing still consider the 32 previous
timestamps of each sensor as input; the model that discerns between sitting and standing
and the unbalance model consider the previous 16 and the stumbling model the previous
4. Regarding the inputs of the best models, the Table shows the pressure sensors (P) and
acceleration measurements (A) selected. Temperature was not selected in any of the models
as an explanatory variable. In the case of the pressure sensors, the superscript indicates
the sensor number, whose corresponding distribution along the insole is displayed in
the Figure 3. The superscript in the acceleration indicates each of the three axes of the
coordinate system. It is observed that the model that discerns between moving and still
and the one that discerns between running and walking includes information from two
acceleration axes as input to the model, while the rest of the models are fed with information
from a single acceleration axis. Regarding the pressure sensors, in general the models
considered as inputs a subset of pressure sensors housed along the entire insole. It could
be noted that the model that discerns between standing and sitting considers more sensors
from the bottom of the foot insole (heel) as inputs than the rest of the models. This result
seems reasonable since the heel is the part of the foot that tends to bear a greater difference
in load when standing compared to sitting.
Table 3. Best models configuration.
Model Standing Model Moving Model Stumbling Model Unbalanced Model Running
vs. Seated vs. Still vs. Not Stumbling vs. Stable vs. Walking
No. of hidden Dense/
1 1 11 11 3
Time Distr. Dense layers
[26,54,16,38, [32,4,38,50
No. of units of each layer 32 42 46,54,18,38, 34,38,22,6 [46,6,9]
36,54,1] 24,58,58]
[tanh,selu,selu,selu, [tanh,tanh,selu,tanh,
Activation function of each layer selu tanh selu,tanh,selu,selu, tanh,tanh,selu,tanh, [selu,tanh,tanh]
selu,tanh,selu] selu,tanh,selu]
Use of Conv. layer False False True True False
No. of filters in Conv. - - 21 6 -
Size window in Conv. - - 10 4 -
Activation function of Conv layer - - selu sigmoid -
Use of pooling layers False False False True False
Use of LSTM layer False False False False False
No. of units of LSTM - - - - -
Learning rate 0.01 0.01 0.01 0.001 0.01
Optimizer adam sgd sgd adam adam
Batch size 33 48 21 19 47
Previous timestamps 16 32 4 16 32
Selected sensors {P0 , P1 , P2 , P5 , P6 , {P3 , P4 , P6 , P8 , P10 , {P0 , P1 , P4 , P7 , P10 , {P0 , P6 , P9 , P11 , P12 , {P1 , P3 , P4 , P6 , P8 ,
P7 , P15 , A0 } P12 , P13 , A0 , A2 } P11 , P12 , P14 , A1 } P13 , P15 , A0 } P11 , P12 , A0 , A2 }
This difference in the complexity of the neural networks between the problems ad-
dressed is sensible, as a stumble or an imbalance are more difficult to detect with the
information provided by the wearable sensorised device than the other behaviours (sitting,
standing without imbalance, walking, running), possibly due to their greater heterogeneity.
The difference in the prior information needed may lie in the type of activity, some of them
involving more continuous events over time (e.g., walking and running) and others shorter
ones, such as stumbles.Entropy 2021, 23, 777 14 of 19
The evaluation metrics of the best binary models are shown in Table 4. The metrics
represented are accuracy, AUC, precision or positive predictive value (PPV), recall or
sensitivity, f1-score, specificity and negative predictive value (NPV):
tp + tn
Accuracy = (4)
tp + tn + f p + f n
tp
Precision = (5)
tp + f p
tp
Recall = (6)
tp + f n
tn
Speci f icity = (7)
tn + f p
tn
NPV = (8)
tn + f n
precision · recall
F1 − score = 2 · (9)
precision + recall
where tp, tn, f p and f n are the number of true positives, true negatives, false positives
and false negatives, respectively. The metric AUC is the area under ROC curve, being
ROC curve a graphic representation of sensibility against 1-specificity depending on the
discrimination threshold.
Table 4. Metrics obtained by the best models.
Model Standing vs. Seated Model Moving vs. Still Model Stumbling vs. Not Stumbling Model Unbalanced vs. Stable Model Running vs. Walking
Accuracy 0.99 0.98 0.78 0.91 0.96
AUC 0.98 0.98 0.77 0.91 0.95
Precision 1 0.98 0.64 0.91 0.95
Recall 1 0.99 0.75 0.89 0.91
F1-score 1 0.98 0.69 0.9 0.93
Specificity 0.97 0.98 0.79 0.93 0.98
NPV 0.97 0.99 0.86 0.91 0.97
The model that discerns between sitting (class 0) and standing (class 1) and the one
that discerns between standing without movement (class 0) and with movement (class
1) obtain a high performance close to 1. Although slightly lower, the model discerning
between walking (class 0) or running (class 1) also achieves a high discriminative ability.
However, the model discerning between no stumbling (class 0) and stumbling (class 1) and
the one discerning between no unbalance (class 0) and unbalance (class 1) perform worse,
with an AUC of 0.77 and 0.91 respectively. Consequently, the metrics show that problems
dealing with stumble and imbalance detection are more difficult to model. As noted above,
both problems were modeled with more complex network architectures.
In general, the metrics show that the binary models achieve a good discriminative
ability. However, to calculate an evaluation metric for the general problem (detection of
several events) it is necessary to apply the hierarchical structure (Figure 6) of the binary
models. The average result achieved is an accuracy of 0.84 and an AUC of 0.96, which also
indicates a remarkable overall performance.
4. Discussion and Conclusions
Although the increase in life expectancy could be considered one of history’s great
success stories, it brings with it certain societal challenges that need to be addressed, such
as the care of the elderly. Thanks to the advancement of technology (IoT, Big Data, Artificial
Intelligence, etc.), highly innovative and attractive assistive technology (AT) products can
be developed to enable a more independent, comfortable and safe life for the elderly.
The work presented is part of the result of the European project MATUROLIFE whose
ultimate goal is to enable the elderly to age with the highest possible quality of life andEntropy 2021, 23, 777 15 of 19
independence through the implementation and development of an assistive technology
integrated in wearable devices (clothing, furniture and footwear) in a discreet, fashionable
and comfortable way. This sensorisation allows the remote monitoring of elderly people
and the analysis of the large amount of data generated in order to prevent certain health
problems. This article presents the prototype of the footwear (smart insole) that incorpo-
rates a total of 20 sensors that measure physical magnitudes such as temperature, pressure
and acceleration. A scalable and easily modular system architecture was designed and
implemented. Such architecture manages and updates the data retrieved from the smart
shoes through an Android application (MaturoApp) via Bluetooth protocol, stores the
information in a database on which the generated models are fed and sends a warning
message via Telegram to the user’s contact person (responsible person) in the event of an
indication of risk or anomalous behaviour. The fundamentals of information theory were
essential to enable the system of consistent communication to transmit, process, analyse
data and obtain useful information in near real time. The paper focuses especially on
the part of detecting different walking behaviours by analysing and modelling the data
retrieved from the smart footwear using deep learning techniques.
There are several studies that have explored algorithms that achieved good perfor-
mance for human activity recognition based on smart footwear and focused on providing
greater independence to elderly people. De Pinho Andre et al. [43] showed an average
accuracy of 93.34%, el Achkar et al. [44] achieved a total algorithm precision of 97.41%,
Montanini et al. [46] achieved an accuracy of 97.1%, Zitouni et al. [45] reached 100%
sensibility and more than 93% sensitivity, Light et al. [47] achieved a 88% of accuracy
approximately and Sim et al. [48] a 81.5% sensitivity. However, many of the studies
focused on a single event such as falling [45–48] and others detected more common events
related to the user daily activity but they do not include events of inmediate risk such as
unbalancing,stumbling or falling [43,44].
Our proposal allows for the identification of 6 types of representative gait events
that include events of immediate interest such as stumbling and imbalance and other
more common events such as sitting, standing, walking or running. In the data collection
process, some flexibility was allowed for in the conduct of these events. The criterion to
consider these events was motivated in order to monitor and prevent possible user health
problems by considering a wide range of possible user behaviours, both more immediate
hazard events and more common everyday activity events that may also indicate abnormal
behaviour depending on the patient and even the time of day. For example, although the
event “walking” may be a completely normal event during the day, the detection of such an
event at night may indicate abnormal behaviour of the patient at that time of the day when
he should be sleeping. This may indicate disorientation and possible danger if prolonged
over time.
Artificial neural network techniques and algorithms capable of detecting these events,
which may be related to health problems such as disorientation, loss of control, among oth-
ers, were explored and applied. In particular, 5 binary models were generated for the
detection of such events through a hierarchical cascade structure. This cascade structure
was designed so that the system could be easily modulated, allowing, for example, to be
re-created with new binary models for the detection of more particular events, keeping the
rest of the models or substituting only some of them. Optimisation in the training of the
models allowed a choice of built-in sensors as inputs. The best models, which included
different sensors as inputs, were stored sorted by performance. The aim of this was to
ensure that the event detection system was always kept alive even in circumstances where
a certain sensor stopped working, which may be possible in practice. Thus, if a sensor fails,
the system uses the best model that does not use information from that sensor as input.
The results showed a high overall discrimination ability, reaching an average accuracy
and AUC of 0.84 and 0.96, respectively. The worst performing binary models were those
detecting stumble and imbalance with an AUC value of 0.77 and 0.91, respectively. This
may be due to the fact that they are more difficult events to model than the others, as theyEntropy 2021, 23, 777 16 of 19
are less constant and possibly more heterogeneous walking behaviours. This complexity is
also reflected in the selected network architecture, where these models follow a network
architecture with convolutional layers and considerable depth (11 hidden layers), while
the rest of the models are multilayer perceptrons with 1 or 3 hidden layers.
Thanks to the fundamentals of information theory and the combination of different
technologies such as sensing techniques, data acquisition and analytics, machine learning
and deep learning, it is possible to improve the state of the art and develop new sensors and
smarter systems. This is achieved by integrating intelligence techniques and deployment in
wearables and related edge computing, where all related phases take place inside the sen-
sorised device. This is the case of the work we present, which focuses on a wearable smart
footwear comprising a scalable, easily modulated and live system that allows, through
artificial neural network modelling, to detect with high accuracy a wide heterogeneity of
walking behaviours and to warn the relatives or healthcare professionals about anomalous
user behaviours so that they can act quickly. This system was designed in such a way that
it can be implemented on any current embedded system with a lower CPU.
However, this work has some limitations and future work to consider. Due to the
COVID19 pandemic in which we are immersed and the timelines set in the project, data
collection by the end users (elderly population) was not possible. Consequently, data
collection had to be carried out by the technical team with only 3 subjects of approximately
the same age and weight. Other related studies included more heterogeneity in this regard
and some involved elderly population in their experiments. De Pinho Andre et al. [43] used
data from 11 subjects, two of whom were elders, el Alchkar et al. [44] involved ten elderly
subjects (8 men, 2 women, age 65–75 years, weight 62–114 kg, height 162–184 cm), and Mon-
tanini et al. [46] conducted laboratory tests with 17 healthy subjects and demonstrated the
effectiveness of their method with two older users in a real-life setting. Zitouni et al. [45]
involved six subjects between 25 and 30 years of age, Light et al. [47] collected data from
subjects aged between 20 and 45 years and Sim et al. [48] three young subjects (2 young
males, 1 young female, aged between 24 and 28 years).
As future work, we propose to validate our system by including greater heterogeneity
in the data, incorporating information from elderly population of different ages, weights
and physical shape and in different environments where humidity, external temperature or
the relief of the terrain may have an effect on the measurements. Thanks to the scalability
and modularity that the designed system allows, another of the future lines of work to be
explored could be to include clustering modules with the aim of grouping behaviours and
applying specific models to each group. The application of modules for detecting changes
in user behaviour (trend models) or the inclusion of more specific event models such as fall
detection could also be studied.
Author Contributions: Conceptualization: R.A.-G., G.L.-L., A.A.-L. and D.A.-G.; Data Curation:
R.A.-G., G.L.-L. , A.A.-L. and D.A.-G.; Formal analysis: R.A.-G., G.L.-L. and A.A.-L.; Investigation:
R.A.-G., G.L.-L. and A.A.-L.; Methodology: R.A.-G., G.L.-L. and A.A.-L.; Software: R.A.-G., G.L.-L.,
A.A.-L. and C.G.-M.; Supervision: C.G.-M., D.A.-G. and R.d.-H.-A.; Validation: R.A.-G., G.L.-L. and
A.A.-L.; Writing—original draft: R.A.-G., G.L.-L., A.A.-L., D.A.-G. and C.G.-M.; Writing—review &
editing: R.A.-G., G.L.-L., A.A.-L., D.A.-G., R.d.-H.-A. and C.G.-M. All authors have read and agreed
to the published version of the manuscript.
Funding: This publication is based on work performed in MATUROLIFE (Metallisation of Textiles
to make Urban Living for Older People more Independent and Fashionable), which has received
funding from the European Union’s Horizon 2020 research and innovation programme under Grant
Agreement No. 760789. The work has also been partially funded by the European Social Fund.
Institutional Review Board Statement: Not applicable.
Informed Consent Statement: Informed consent was obtained from all subjects involved in the study.
Acknowledgments: The authors wish to sincerely thank all the consortium members of european
MATUROLIFE project who provided the technology and the support to enable the hereby described
experiments, specially the ones directly involved in the development of the shoe prototypes:Entropy 2021, 23, 777 17 of 19
- Coventry University -https://www.coventry.ac.uk/- (accessed on 10 May 2021) for the Matur-
olife project leadership and the aplication of the state of the art technologies for Selective
Catalysation and Metallisation of Fabrics and Textiles.
- CTCR -https://www.ctcr.es/en- (accessed on 10 May 2021) for their work in the integration of
the hardware and software components needed to seamlessly transfer information from the
sensorized devices and specially for their support during the experiments.
- Sensing Tex -http://sensingtex.com- (accessed on 10 May 2021) for the integration of their inno-
vative Pressure Sensing Mat solutions in the field of smart textiles based on printed electronics.
- Printed Electronics -https://www.printedelectronics.com/- (accessed on 10 May 2021) for their
work in the analysis and implementation of printing methods and the selection of compatible
material to interconnect with the SensingTex sensing mat solutions.
- Pitillos(r) -https://www.calzadospitillos.com/en/- (accessed on 10 May 2021) for the manufac-
turing of the shoes and their knowledge and experience in the design of usable models to house
the above described technologies.
Any dissemination reflects the authors’ view only and the European Commission is not respon-
sible for any use that may be made of the information it contains. The views and opinions expressed
in this paper are those of the authors and are not intended to represent the position or opinions of the
MATUROLIFE consortium or any of the individual partner organisations.
Conflicts of Interest: The authors declare no conflict of interest.
References
1. Eurostat. Ageing Europe. Looking at the Lives of Older People in the EU. 2020. Available online: https://ec.europa.eu/eurostat/
web/products-statistical-books/-/ks-02-20-655 (accessed on 3 May 2021).
2. Majumder, S.; Aghayi, E.; Noferesti, M.; Memarzadeh-Tehran, H.; Mondal, T.; Pang, Z.; Deen, M.J. Smart homes for elderly
healthcare—Recent advances and research challenges. Sensors 2017, 17, 2496. [CrossRef]
3. Deen, M.J. Information and communications technologies for elderly ubiquitous healthcare in a smart home. Pers. Ubiquitous
Comput. 2015, 19, 573–599. [CrossRef]
4. Communication from the Commission to the European Parliament, the Council, the European Economic and Social Committee
and the Committee of the Regions, European Disability Strategy 2010–2020: A Renewed Commitment to a Barrier-Free Europe.
Available online: https://eur-lex.europa.eu/legal-content/EN/TXT/?uri=celex%3A52010DC0636 (accessed on 3 May 2021).
5. Canjuga, I.; Železnik, D.; Neuberg, M.; Božicevic, M.; Cikac, T. Does an impaired capacity for self-care impact the prevalence of
social and emotional loneliness among elderly people? Work. Older People 2018, 22, 211–223. [CrossRef]
6. Borg, C.; Hallberg, I.R.; Blomqvist, K. Life satisfaction among older people (65+) with reduced self-care capacity: The relationship
to social, health and financial aspects. J. Clin. Nurs. 2006, 15, 607–618. [CrossRef] [PubMed]
7. Kahya, N.C.; Zorlu, T.; Ozgen, S.; Sari, R.M.; Sen, D.E.; Sagsoz, A. Psychological effects of physical deficiencies in the residences
on elderly persons: A case study in Trabzon Old Person’s Home in Turkey. Appl. Ergon. 2009, 40, 840–851. [CrossRef] [PubMed]
8. Brookes, N.; Palmer, S.; Callaghan, L. I live with other people and not alone: A survey of the views and experiences of older
people using Shared Lives (adult placement). Work. Older People 2016, 20, 179–186. [CrossRef]
9. Balta-Ozkan, N.; Davidson, R.; Bicket, M.; Whitmarsh, L. Social barriers to the adoption of smart homes. Energy Policy 2013, 63,
363–374. [CrossRef]
10. De Silva, L.C.; Morikawa, C.; Petra, I.M. State of the art of smart homes. Eng. Appl. Artif. Intell. 2012, 25, 1313–1321. [CrossRef]
11. Lutolf, R. Smart Home Concept and the Integration of Energy Meters into a Home Based System. In Proceedings of the
Seventh International Conference on Metering Apparatus and Tariffs for Electricity Supply, Glasgow, UK, 17–19 November 1992;
pp. 277–278.
12. Aldrich, F.K. Smart Homes: Past, Present and Future. In Inside the Smart Home; Springer: London, UK, 2006; pp. 17–39.
13. Shi, W.V. A survey on assistive technologies for elderly and disabled people. J. Mechatron. 2015, 3, 121–125. [CrossRef]
14. Troncone, A.; Saturno, R.; Buonanno, M.; Pugliese, L.; Cordasco, G.; Vogel, C.; Esposito, A. Advanced Assistive Technologies for
Elderly People: A Psychological Perspective on Older Users’ Needs and Preferences (Part B). Acta Polytech. Hung. 2021, 18, 29–44.
[CrossRef]
15. Peek, S.T.M.; Wouters, E.J.M.; van Hoof, J.; Luijkx, K.G.; Boeije, H.R.; Vrijhoef, H.J.M. Factors influencing acceptance of technology
for aging in place: A systematic review. Int. J. Med. Inform. 2014, 83, 235–248. [CrossRef]
16. Jo, T.H.; Ma, J.H.; Cha, S.H. Elderly Perception on the Internet of Things-Based Integrated Smart-Home System. Sensors 2021, 21,
1284. [CrossRef] [PubMed]
17. Yusif, S.; Soar, J.; Hafeez-Baig, A. Older people, assistive technologies, and the barriers to adoption: A systematic review. Int. J.
Med. Inform. 2016, 94, 112–116. [CrossRef]
18. Davies, K.N.; Mulley, G.P. The views of elderly people on emergency alarm use. Clin. Rehabil. 1993, 7, 278–282. [CrossRef]
19. Shannon, C.E. A mathematical theory of communication. Bell Syst. Tech. J. 1948, 27, 379–423. [CrossRef]You can also read