Predicting TV programme audience by using twitter based metrics - FloRe
←
→
Page content transcription
If your browser does not render page correctly, please read the page content below
Multimed Tools Appl
DOI 10.1007/s11042-017-4880-x

Predicting TV programme audience by using twitter
based metrics

Alfonso Crisci 1 & Valentina Grasso 2,1 & Paolo Nesi 3          &
Gianni Pantaleo 3 & Irene Paoli 3 & Imad Zaza 3

Received: 20 September 2016 / Revised: 18 April 2017 / Accepted: 29 May 2017
# The Author(s) 2017. This article is an open access publication

Abstract The predictive capabilities of metrics based on Twitter data have been stressed in
different fields: business, health, market, politics, etc. In specific cases, a deeper
analysis is required to create useful metrics and models with predicting capabilities.
In this paper, a set of metrics based on Twitter data have been identified and
presented in order to predict the audience of scheduled television programmes, where
the audience is highly involved such as it occurs with reality shows (i.e., X Factor
and Pechino Express, in Italy). Identified suitable metrics are based on the volume of
tweets, the distribution of linguistic elements, the volume of distinct users involved in
tweeting, and the sentiment analysis of tweets. On this ground a number of predictive
models have been identified and compared. The resulting method has been selected in
the context of a validation and assessment by using real data, with the aim of
building a flexible framework able to exploit the predicting capabilities of social
media data. Further details are reported about the method adopted to build models
which focus on the identification of predictors by their statistical significance. Exper-
iments have been based on the collected Twitter data by using Twitter Vigilance
platform, which is presented in this paper, as well.

* Paolo Nesi
  paolo.nesi@unifi.it; http://www.disit.dinfo.unifi.it; http://www.disit.org/tv

    Alfonso Crisci
    a.crisci@ibimet.cnr.it; http://www.ibimet.cnr.it
    Valentina Grasso
    grasso@lamma.rete.toscana.it; v.grasso@ibimet.cnr.it; http://www.lamma.rete.toscana.it

1
    CNR IBIMET National Research Council, Florence, Italy
2
    LAMMA Consortium, Tuscany Region-CNR, Sesto Fiorentino, Italy
3
    DISIT Lab, Distributed [Systems and internet | Data Intelligence and] Technologies Lab, Department
    of Information Engineering (DINFO), University of Florence, Florence, Italy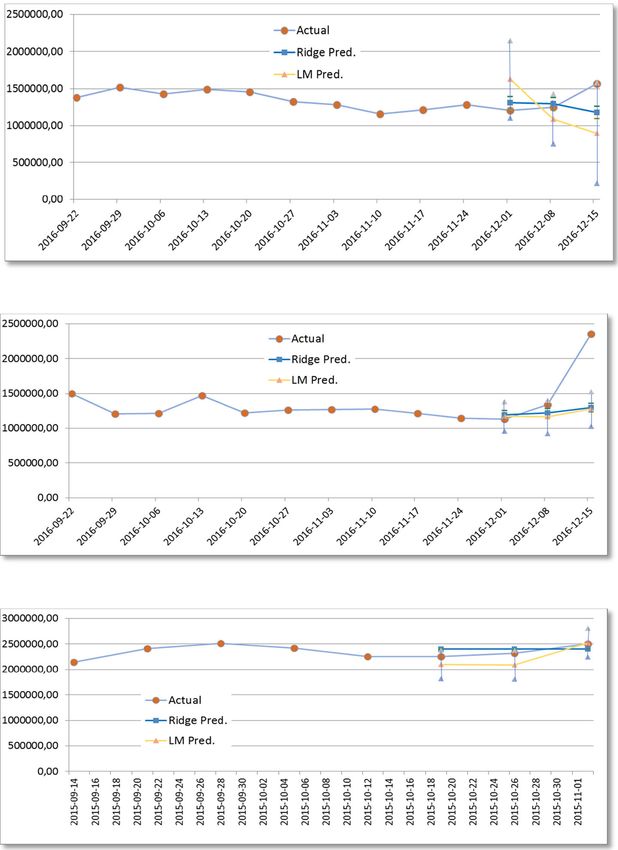
Multimed Tools Appl

Keywords Twitter monitoring . Social media monitoring . Predicting audience . Twitter data
analysis

1 Introduction

Social media analysis is becoming a very important instrument to monitor communities, users’
preferences, and to make predictions. Among the social media solutions, Twitter is one of the
most widespread microblogs allowing users to have a personal news feed and followers
attached to it. Followers receive some notification connected to the actions performed by the
users they follow. Typical actions of users can be: posting a message (tweet), commenting,
expressing like/favourite, retweeting (the echo of some tweet messages by some other
users to the followers of the retweeting user). Therefore, tweets and retweets are
shown (exposed) to other Twitter users, thus making more likely the chance of
provoking their interests and reactions: retweets, comments, likes, etc. Some of these
mechanisms can provoke viral processes that may lead to massive propagation of
tweets in the user community. Twitter users are formally identified by B@^ preceding
their nickname as B@paolonesi^, one of the paper authors. Any user may appeal to
the attention of other users by including the @Twitter-username in the tweet. For
example, BNice post @paolonesi! give me your opinion on XXX^, is a citation of
B@paolonesi^. In the tweet text, every user can stress the attention to specific
keywords called hashtags that are marked with B#^ as first character. For example,
hashtag: B#houseofcards^ can be used to remark that the tweet is about the TV serial
House of Cards (hashtags can be suggested to the audience by the TV producers, or
spontaneously created by some users as well). Citations and hashtags are well indexed
in Twitter.com and can be searched as main vehicles of involvement and remark, and
thus are used by Twitter.com to propagate information to cited users and communities
interested on following users or the hashtags, respectively.
    Thanks to the above described social engagement mechanisms, a lot of users join and use
Twitter every day; not only single users, but also news agencies, public institutions, producers,
VIPs, teams, schools, municipalities, governments, etc., with the aim of sharing, promoting
and communicating. On such grounds, Twitter is used as a source of information to deliver
news, events, and innovations, and thus, it can be exploited as a tool for the prediction of
different kinds of events and occurrences.
    As described in the following, the research reported in this paper is about the usage of
Twitter data to predict the attendance to TV shows by (i) computing metrics based on twitter
data (volume of messages/posts including keywords (citation, hashtags) and/or mentions,
volume of messages containing specific elements extracted from natural language processing
(verbs, adjectives, words), and sentiment analysis by weighting each single text element on the
basis of positive and/or negative moods), (ii) setting up and making in place predictive models
also addressing feature selection. Thus, before passing to describe the solution proposed, the
following subsection presents the related work.

1.1 Related work

As previously stated, Twitter data have been used for setting up several kinds of predictive
models in different domains according to the differences in the events and phenomena.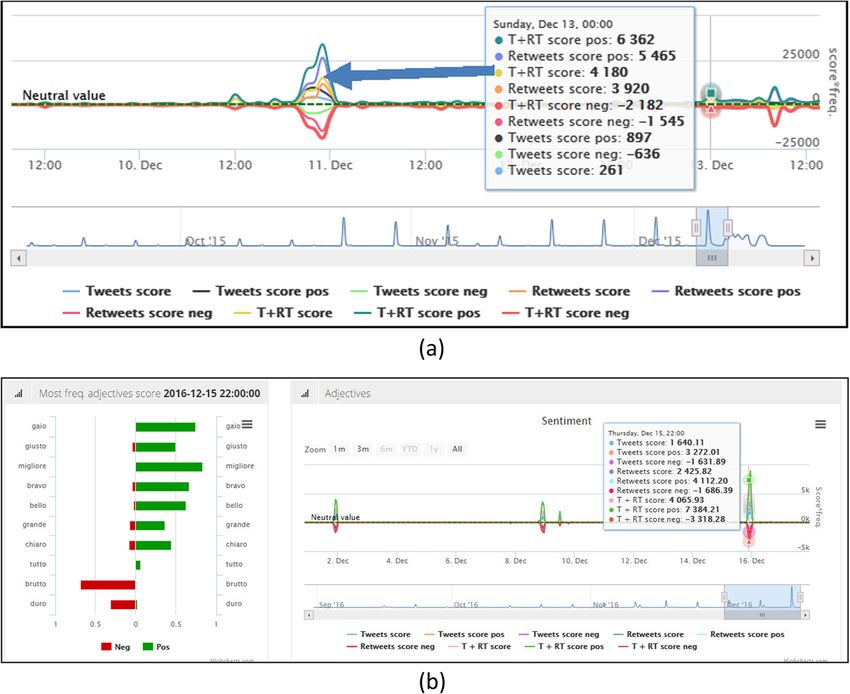
Multimed Tools Appl

    In [48], a solution to predict football game results has been proposed by considering the
volume of tweets. In more details the approach adopted defined a function for putting in
correlation the delta changes in the volume of tweets with respect to a fixed number of
categories, thus the obtained prediction rate was in the range of 68%. Opinion polls and
predictions of political elections have been interrelated to the volume of tweets by using
Sentiment Analysis techniques in [37]. In this case, the sentiment analysis has been performed
by counting words and assigning to them negative or positive weights according to Opinion
Finder lexicon based on only 2800 words, obtaining a highest correlation value of about 80%
with respect to measures of public opinion derived from polls in the case of Obama elections.
Voting results have been correlated with tweets in the 2009 German elections [53], addressing
the counting of the tweets citing the different parties without providing a predictive model,
another example can be found in [4]. In [15], sentiment analysis and volume approaches has
been used for electoral prediction in the Senate competition which is 1:1, still obtaining
correlations in the range of 40–60%.
    Different models, based on both the volume of tweets and other means, have been also used
for other predicting purposes: spread of contagious diseases [39] observing the inception over
time of the adoption of terms which can be related to problems and symptoms that can be
connected to specific illnesses. Other cases in the health domain have been studied for
detecting the inception of public health seasonal flu [1, 27, 46], [7].
    In economics, sentiment analysis has been adopted by employing Self-Organizing Fuzzy
Neural Network, since long time series are present, predicting the direction of the stock market
with a highest accuracy of over 86% [5]. Other cases in the market and business domains are
described in [9, 43], for marketability of consumer goods in [45], and for book sales in [19].
    With the aim of predicting box-office for movies, in [3] a model has been proposed
adopting the average tweet rate, the presence of URLs in tweets and the volume of retweets
as features. Also in this case, the time series are long (several days), and the model obtained an
adjusted R squared of 0.94 via a linear model addressing sentiment analysis. Other cases in the
same domain are: [28, 30, 32, 49], in which the combination of volume and sentiment analysis
for long terms series has been proposed in a tool without proposing specific models. For
example, in [24] the sentiment analysis is introduced by using the ratio from positive and
negative score estimation of the tweets, obtaining accuracy of 64%. In [13], Twitter data have
been used for predicting the performance of movies at the box office. To this end, a fuzzy
inference system has been set up exploiting metrics such as the counting of tweets, followers,
sentiment analysis metrics, and also additional information about the actors’ rating according
to the model proposed in [42]. The results presented on specific cases provide large mean
square errors from 6% up to 27%.
   Other applications highlighting Twitter data capabilities can be on: detecting crimes with
the capability of identifying the inception of certain critical cases (such as micro discussions on
crashes, fire, etc.) [56], places to be visited observing the most frequently attended places in a
given location [8]. In addition, Twitter data has been used for assessing weather forecast
information in [17], and in [18].
   Twitter-based metrics have been used to estimate the number of people in specific locations
like airports (the so called crowd size estimation) [6]. In this case, a simple linear model on the
basis of volume metrics (i.e., number of tweets) has been proposed. In [16], the averaged value
of past audience and Twitter data (contributions per minute) have been used for predicting
audience (TV rating) on long series of political TV shows (from 14 to 280 shows), by using
mainly volume metrics during broadcast time, and the rate of twitting people, obtaining an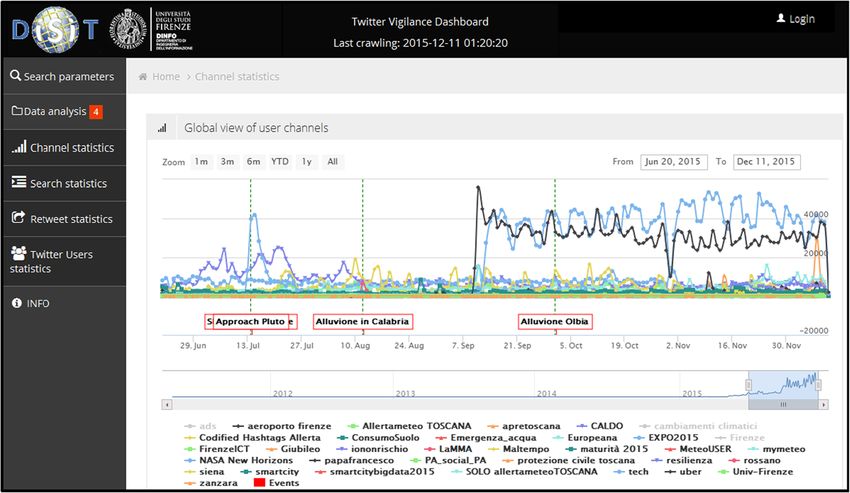
Multimed Tools Appl

adjusted R squared of 0.95. On this regard, Nielsen Media Research discussed the capability of
Twitter data to explain the variance of 2/3 of the difference in premiere audience sizes [36]. TV
rating is usually estimated sampling the audience with specific meters such as those installed
by Auditel or more precise measures as those of Sky via set top box/decoders. In [22], a neural
network approach has been used for predicting audience on the basis of Facebook data,
obtaining a prediction accuracy in terms of Mean Absolute Percentage Error (MAPE) from
about 6% to 24% on different TV shows. In [33], a number of TV shows have been analysed,
clustering them for similarity, with the aim of identifying a predictive model for each cluster
taking into account the Twitter data of previous days. The proposed predictive model is based
on a linear regression (using volume and sentiment analysis metrics) that produced an R
squared in range of 0.73–0.94 depending on the cluster. Typically, clusters with smaller
amount of tweets in total per series are better ranked. A cross validation was not proposed
to verify the robustness of the model. In those cases, very stable data and long series have been
addressed. These series have a very different behaviour with respect to Breality TV shows^, in
which there is a strong involvement of the audience in many phase of the show, and
thus the number of tweets is much higher in the days before and massive in the day
of the show. In [50], the authors discovered relevant correlations between the number
of tweets passed 30 min before and after the show and in successive episodes without
proposing a predictive model. In [55], a functional comparison of classical solutions
for estimating TV show rating with respect to the TV data usage is proposed, together
with an early solution for the estimation of TV rating based on textual, spatial, and
temporal relevance, without proposing a predictive model.
    According to the state of the art analysis, the predictive capabilities of Twitter data have
been explained by using volume metrics on tweets (i.e., the total number of tweets and/or
retweets associated with a Twitter user or having a given hashtag). However, in some cases a
deeper semantic understanding of tweets has been required to create useful predictive capa-
bilities. For these reasons, algorithms for sentiment analysis computation have been proposed
to take into account the meaning of tweets via natural language processing algorithms (e.g.,
[37]). The adoption of techniques for segmenting, filtering or clustering by context (e.g., using
natural language processing so as to avoid the misclassification of tweets related to the flu), or
by users’ profiles (e.g., age, location, language, and genre) may help in getting more precise
results in terms of predictability. Overviews of predictive methods exploiting tweets
have been proposed in [47], and in [31]. Moreover, [31] have criticised the predictive
capabilities of some proposed models based on Twitter data. In fact, some approaches
proposed general models adopting specific filtering and/or classifications based on
human assessors, thus reducing the replicability of the solution. Twitter data also
present some problems due to the way they are ingested and collected. In particular,
the access to the twitter API has some limitations such as: the maximum number of
request calls in a period, the huge amount of tweets that can be produced for certain
cases, the complexity of social relationships among users, the limited size of tweets
(140 characters), and the fact that historical Twitter data are not accessible via the
Twitter API, etc. These facts force the developers to set up specific architectures for
collecting tweets, while attempting to get them with a sufficient reliability [38].
    In [26], the trend of the dissemination information via Twitter has been analysed, observing
the issues regarding the retweets cascade effect and the show count. Please note that the
number of shows of a tweet is not easily accessible from Twitter data, but it is a well know
observable metric exposed by internal Twitter analytic. The paper has demonstrated that the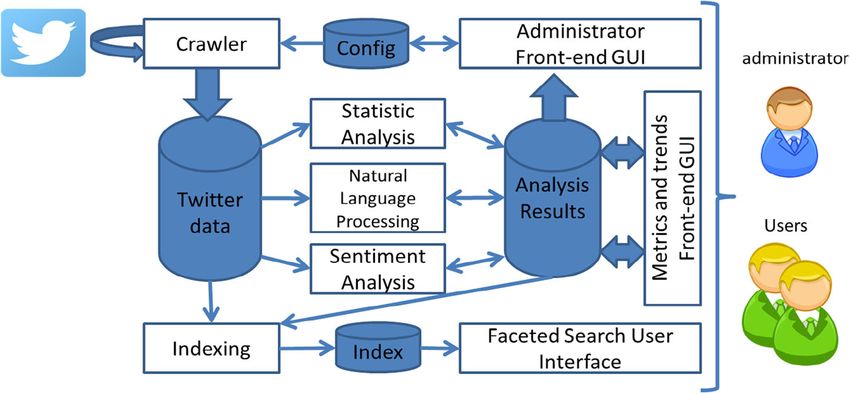
Multimed Tools Appl

counting of retweets and the number of shows do not have a strong correlation. With the aim of
predicting the number of shows, a number of predictive metrics have been proposed, and in
particular: number of followers, friends, favourites; number of times the user has been listed;
number of posts; number of active days, etc.

1.2 Article overview

The paper is focused on presenting how Twitter data and derived metrics can be used for
predicting the audience of reality TV shows. They are very attractive and addicting shows
creating relevant effects of retweeting. In reality shows, the prediction of event attendance (TV
rating) can be very useful for service tuning – e.g., catering, cleaning, security, and for selling
advertising. The prediction of the audience to TV programmes is mainly relevant to adapt the
value of advertising and to attract more advertisers. In such cases, the adoption of Twitter and
the related collected metrics have been used to study and define a model able to predict the
audience of TV shows. The proposed prediction model is based on the data collected during
the days before the events. Such data demonstrated to have predictive capabilities thanks to the
identification of a relevant number of feature/metrics, including: volume (counting of tweets,
retweets, etc.), natural language processing (counting nouns, adjectives, etc.), network (e.g.,
number of unique users), and sentiment analysis (assessing positive and negative orientation of
tweets). The identified metrics have been used to derive a model obtaining high significance
and predicting capabilities on the basis of a comparison among four methods: multilinear
regression, ridge, lasso and elastic net, as described in the paper. The approach and results have
been validated, thus demonstrating that it is possible to obtain some specific excellent metrics
with predictive skills from Twitter data also for those cases. The model validation has been
performed by using data related to X Factor season 9 (XF9), X Factor season 10 (XF10), and
Pechino Express 2015, which are reality shows broadcasted in Italy, in 2015 and 2016
summer-fall period. They are reality shows where people are highly involved through a
participative support of media actors by using Twitter posts. The above described predictive
models have been applied by exploiting Twitter data and computed metrics collected by using
Twitter Vigilance solution, which is a tool for multiuser collection of tweets for research and
analysis (http://www.disit.org/tv). Twitter Vigilance has been partially developed in the context
of RESOLUTE H2020 (http://www.resolute-eu.org) and used in REPLICATE H2020 projects,
and in Sii-Mobility smart city national project (http://www.sii-mobility.org). Presently, Twitter
Vigilance is adopted by a number of institutions to collect and exploit Twitter data for research
and analysis purposes.
    The paper is organized as follows. Section 2 describes the general architecture of the
TwitterVigilance solution (http://www.disit.org/tv) adopted to collect Twitter data and perform
the estimation of a number of metrics. Section 3 provides a description of the methods adopted
to identify and validate the predictive models and framework. In the same section, the metrics
adopted have been explained and formalized. They are related to: volume of tweets, retweets;
natural language processing counting nouns, adjectives, and other elements; the assessment of
network of unique users tweeting; and the sentiment analysis in terms of positive and negative
orientation of tweets. Section 4 reports the usage of Twitter data for the analysis and prediction
of audience in the context of a number of reality show TV programmes (in particular for XF9,
XF10 and Pechino Express, 2015). The section reports not only the results but also a
comparison with a number of methods to arrive at identifying the best resulting approach.
Conclusions are drawn in Section 5.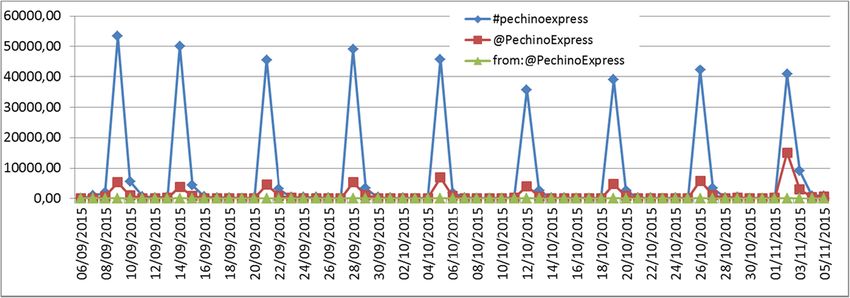
Multimed Tools Appl

2 Twitter Vigilance architecture

Twitter provides different kinds of modalities to allow accessing Twitter data: Search API and
Streaming API calls. Since version 1.1 of Twitter API, it is necessary to log into Twitter by using
OAuth protocol for all requests. Both Twitter APIs types return data in JSON format. Search API
presents a limited number of requests every 15 min. The Streaming APIs give developers a low
latency access to Twitter’s global stream, but limited access to the whole tweets. Twitter offers
different streaming endpoints customized for use type: public, user and site. Both Search and
Streaming APIs present some limitations in terms of maximum number of tweets per hour, and any
of them do not guarantee that all tweets which are on Twitter.com could be obtained for the analysis.
    Twitter Vigilance architecture is reported in Fig. 1, where data acquisition approach is
performed by the Crawler which consists of a multithread system exploiting the Twitter Search
API. The search query to be performed on Twitter.com can be configured by the users from the
FrontEnd GUI of the tool.
    Twitter Vigilance is multiuser, where each user may provide its own set of searches and
aggregated views.
    The Twitter Vigilance approach is based on the concept of BTwitterVigilanceChannel^,
which consists in a set of simple and complex search queries performed on Twitter platform by
the Crawler engine.
    The configuration and statistical results about the Crawler are accessible from the front-end
interface. The simplest TwitterVigilanceChannel to be monitored can refer to collect and
analyse tweets referring to a single: Twitter user, user citation, hashtag, or keyword. Complex
TwitterVigilanceChannels may consist in tens of queries/searches according to the search
query syntax of Twitter APIs by combining keywords, users IDs, hashtags, citations, etc.,
with some operators (e.g., and, or, from). Twitter Vigilance is able to monitor, follow and
analyse slow and fast events on Twitter. A fast event occurs with several hundred, thousands or
millions of related tweets produced in short time. Slow events may have very few tweets per
day or week or their absence for a long period of time. The Twitter Vigilance collects Twitter
data and makes them accessible for the back office processes of statistical analysis, natural
language processing (NLP) and sentiment analysis (SA), and for the general data indexing,
based on NLP on Hadoop [35].

Fig. 1 Twitter Vigilance Architecture
Multimed Tools Appl

    The results of the back office processes are made accessible on a distinct database
for the front-end graphic user interface which allows visual analytics, data results
navigation, the performance of user analysis, along a variable time window of
analysis, see for example Fig. 2. The users of Twitter Vigilance can define one or
more TwitterVigilanceChannel. Among the users who made its validation possible,
you should recall LAMMA agency, CNR IBIMET, NEUROFARBA, DISIT research
groups.
    The Twitter Vigilance front-end provides analyses at level of channel and/or search about:
volume/number of tweets and retweets (TW and RTW); user citations (to understand what are:
influencers, pushers, emerging citations, etc.); hashtags (to understand which are the most
cited, emerging, evolved, etc.); keywords, verbs, and adjectives (from NLP analysis) to
understand which are the most widely used, emerging, etc., verbs, words, adjective,
hashtags, citations, etc.; positive/negative signature as sentiment analysis and polarity
detection (to identify the reasons for positive/negative tweets, the reaction of the
community, the terms used). A detail of the Sentiment Analysis and NLP manager
interface is shown in Fig. 3. Figure 3a reports the trends of the relevant sentiment
analysis metrics over time. Please note that the most comprehensive metric BR + RT
score^ (defined later), put together positive and negative trends highlighting the global
positive/negative trend in time. In Fig. 3a, an over-imposed arrow put in evidence the
positive global value in that case.
    The reported metrics trends in Fig. 3a refer to a computation performed every hour on the
basis of the last hour tweet and retweet collected on the channel, and in particular:

&   (Tweet score pos) = Sentiment Analysis score for positive mood of Tweets;
&   (Tweet score neg) = Sentiment Analysis score for negative mood of Tweets;
&   (reTweet score pos) = Sentiment Analysis score for positive mood of reTweets;
&   (reTweet score neg) = Sentiment Analysis score for negative mood of reTweets;
&   (Tweet Score) = (Tweet score pos) + (Tweet score neg);

Fig. 2 Twitter Vigilance Front-end graphic user interface: http://www.disit.org/tv
Multimed Tools Appl

Fig. 3 Sentiment Analysis and NLP manager interface for an X Factor 9 event: a trend of the most relevant
sentiment analysis metrics, b detail of Top-Sentiment rated Italian adjectives (these figures are related to the
Twitter data analysed later in the paper)

&   (ReTweet Score) = (reTweet score pos) + (reTweet score neg);
&   (T + RT score pos) = (Tweet score pos) + (reTweet score pos);
&   (T + RT score neg) = (Tweet score neg) + (reTweet score neg);
&   (T + RT Score) = (T + RT score pos) + (T + RT score neg).

    The computation of the above presented sentiment analysis metrics is useful to
detect the inception and position in time of relevant events as pikes. Once detected,
the user can download the data table to estimate more complex and high level metrics
(grounded on the above mentioned ones) which are more suitable for predicting the
TV rating, as described in Section 3a. In Fig. 3b, the trends of the above listed
sentiment analysis metrics, computed on the basis of the adjectives extracted in the
tweets, are depicted. This view may help the analysts to identify the most influencing
tweets and corresponding adjectives which have provoked significant positive/negative
tendency. To this end, the operator may click on the graph and get back the list of the
adjectives with their score, and from them also some examples of tweets can be
shown. Similar graphs can be accessed corresponding to nouns and to verbs.
    Recently, TwitterVigilance has been also made accessible as real time computation of
statistical and sentiment analysis for specific dedicated analysis. An example of the channels
under observation in real time can be checked at http://www.disit.org/rttv.
Multimed Tools Appl

3 Framework for quantitative prediction by using TwitterVigilance
outcomes

As shown in the state of the art and related work sections presented in the introduction, Twitter
data have a relevant and flexible predictive power, and generally, they lead to quantitative
statistical predictive capabilities of several social targets of interest. Relations among social
media data and predictive variables are a priori unknown. An analysis of Twitter data related
with media show audience has been proposed in the literature. In [16], averaged value of
audience in past events and Twitter data (contributions per minute) have been used for
predicting audience on successive political TV shows having long series of events; thus
demonstrating a correlation between the volume of tweets and the audience. In [22], a neural
network approach has been used for predicting audience on the basis of Facebook data. In
particular, the number of posts, the number of shares, number of comments, etc. without
entering in the context of the posts; thus demonstrating the possibility of predicting the rating/
share by using a neural network approach. In [29], a very high level analysis of the twitter data
related to TV programme has been proposed, showing that the degree of interaction on Twitter
was correlated with X Factor programme and its evolution. The approach of using Twitter for
TV programme analysis is also used by Nielsen for analysing if Twitter is helping the audience
or viceversa, deducing that the fact are related, Bthe volume of tweets caused significant
changes in live TV ratings among 29 percent of the episodes^. [51].
    This paper describes the results of a research work aimed at identifying suitable predictive
models to predict media show audience (number of people following the programme) by
exploiting social media info for reality shows. The research meant also to verify their validity
in terms of prediction performance. The prediction of the number of attendees of the TV
program is a more precise measure with respect to the estimation of the rating, as in [22]. The
rating can be affected by the presence of other competing TV programmes in the same time
slots. In addition, the prediction of audience in short term TV shows such as reality shows is
very relevant for the present kind of television.
    The framework proposed in this paper aims at defining a reliable statistical methodology to
exploit Twitter data. Predictions with social data are generally based on conversational flow
metrics concerning the volume of tweets, as well as tweet content/text in terms of keywords,
hashtags, mentions; and/or users’ activity. Thus, our identified Twitter based metric predictors
can be classified into a number of main classes and estimated for each single
TwitterVigilanceChannel and/or for each single search per day or per hour, or in total per
event, and in particular the: (1) volume/number of tweets (TW) and retweets (RTW) versus
time; (2) volume/number of tweets or retweets containing a certain keyword, verb, adjective,
hashtags, citation, etc., versus time; (3) total sentiment analysis scores, taking into account
positive and/or negative scores for elements in the tweets and/or retweets, versus time; (4)
linear compositions of previous point tweets volumes statistics versus time (e.g., the ratio
between number of retweets divided by the number of the corresponding tweets); (5) calendar
variables calculated since the time tweets and/or retweets have been released; (6) volume of
unique users tweeting and/or retweeting versus time. Please note that the metrics based on
retweets have to be counted considering only the number of retweets at that time and not those
in the future (for example up to the day before with respect to the predictive day value).
Moreover, it should be noted that the lifecycle of retweet is limited in time. In the sense that
according to the literature, almost all retweets are manifested in few minutes and sometimes
few hours after the tweet, thus the number of those arriving after days can be neglected [57].
Multimed Tools Appl

   The number of predictors that could be extracted depends on the Twitter data of the
considered channel. Queries of popular keywords/searches on TwitterVigilanceChannel creat-
ed for large events with many searches are very rich in information and complex to analyse.
Many predictive models could be built; however, not all of them may have predictive
capability, or the same effectiveness in predicting events, visitors and/or audience. The
selection of predictors is crucial to build a reliable predictive model, on such grounds it is
mandatory to identify predictors having a significant connection with the event which a
prediction is needed for, with a reasonable temporal horizon.
   In order to build a reliable predictive model, the temporal dynamics explaining the
predictive capability have to be identified. Predictive models and metrics show different
behaviours when periodic or continuous events are considered. For example, the number of
visitors during an event could show relevant or null relationship with calendar variables (as
month, week day, year, etc.); while these variables are very important when the same attendee
prediction is performed over uninterrupted and time-bound events of long term duration such
as a long term event, a carnival, an exposition, etc.

3.1 Metrics definition and computation

A set of metrics have been identified and are reported in Table 1 with their corresponding
definition, where z can be applied on XF9, XF10, or Pechino Express. The adopted metrics
have been classified in: volume metrics when they are based on the volume of tweets or
retweets; NLP volume metrics when the counting has been based on extraction of grammat-
ical elements via natural language; network metrics when the counting is performed on the
number of people involved in the community (the network); sentiment analysis metrics when
the computation is based on the meaning and moods associated with words, verbs, adjectives,
etc.; high level metrics are those that can be computed on the basis of other metrics with some
non-linear function, such as the ratio between two metrics.
   To take into account of the ratio from RTW e TW does not mean that for very high numbers
of tweets the amount of retweets actually diminish the crowd/audience size, since the number
of tweets and retweets are typically numerically balanced in absence of large viral events and
audience as you can see from Twitter Vigilance platform. Furthermore, in presence of
audience, the identified ratio (RTW/TW) is a measure of the reactivity, while as to measuring
the volume metrics based on the total volume are more relevant. The ration of RTW/TW may
lead to have large values if the event under monitoring becomes strongly viral, for example
millions of retweets with only few tweets. This was not the case in general in all the three data
sets tested. On the other hand, this is not the case in our kind of events.
   The computation of Sentiment Analysis metrics has been performed by exploiting
SentiWordNet [10], a semantic knowledge base specifically designed for Sentiment Analysis.
SentiWordnet assigns sentiment scores to each extracted keyword in order to estimate the
general sentiment polarity of collected tweets. SentiWordNet is a sentiment-enriched imple-
mentation of WordNet [12], a widely used lexical database of English nouns, verbs, adjectives
and adverbs grouped into sets of cognitive synonyms (synsets). In SentiWordNet independent
positive, negative, and neutral sentiment values (i.e., real numbers varying in the interval from
−1 to 1) are associated with about 117 thousands of synsets. In order to carry out the analysis in
both English and Italian languages, the SentiWordNet lexicon (which has been originally
designed in English) has been automatically ported to an Italian version, on the basis of
MultiWordNet [41], a resource which aligns WordNet English synsets to Italian ones, which
Table 1 Definitions of metrics for assessing the stream of tweets per search and channel

Metric name           Kind        Description                               Metric definition

TWWeek_z              volume      total number of tweets of the main                        D−1
                                     hashtag collected over the 5 days      TWWeekz ¼       ∑ TW dz
                                                                                           d¼D−5
                                     preceding the event.
                                                                                                                                                                                         Multimed Tools Appl

                                                                            where TW dz is the number of tweets collected at day d, varying from D-5 to D-1, being D the day of the
                                                                              event.
TWRTWWeek_z           volume      total number of tweets plus retweets of                       D‐1
                                     the main hashtag over the 5 days       TWRTWeekz ¼ ∑ TWdz þRTWdz
                                                                                             d¼D‐5
                                     preceding the event.                   where TW dz is the number of tweets and RTW dz the number of retweets collected at day d, varying from D-5
                                                                              to D-1, being D the day of the event.
RTWWeekRatio_z        High level ratio from the number of retweets and                                  D‐1
                                                                                                              TWdz þRTWdz
                        metric,     tweets collected over the 5 days        RTWWeekRatioz ¼ ∑                     TWdz
                                                                                                      d¼D‐5
                        volume      preceding the event, is a sort of       where RTW dz is the number of retweets and TW dz the number of tweets collected at day d, varying from
                                    measure of the reactivity of the          D-5 to D-1, being D the day of the event.
                                    audience of visitors with respect to
                                    the conversation based on single
                                    tweet inside a
                                    TwitterVigilanceChannel.
UnqUserRTW_z          network    measures the number of unique users                               D‐1
                                    who retweeted in the 5 days             UnqUserRTWz ¼ ∑ UudRTW
                                                                                                  d¼D‐5
                                    preceding the event.                    where UudRTW is the number of unique users involved in retweeting estimated at day d, varying from D-5
                                                                              to D-1, being D the day of the event.
UnqUserTW_z           network     measures the number of unique users                             D‐1
                                    who tweeted in the 5 days               UnqUserTWz ¼ ∑ UudTW
                                                                                                d¼D‐5
                                    preceding the event.                    where UudRTW is the number of unique users involved in tweeting estimated at day d, varying from D-5
                                                                              to D-1, being D the day of the event.
FUnqUsers_z           network     the whole set of unique users involved                        D‐1
                                     in tweeting and/or retweeting in the   FUnqUsersz ¼ ∑ Uud
                                                                                             d¼D‐5
                                     5 days preceding the event.            where Uud is the number of unique users involved in tweeting and/or retweeting estimated at day d,
                                                                              varying from D-5 to D-1, being D the day of the event.
Table 1 (continued)
Metric name Kind Description Metric definition
NLPTWWeek_z NLP score taking into account tweets in the D‐1
d;n Nadj d;a Nver d;v
volume 5 days preceding the event, NLPTWWeekz ¼ ∑ ∑Nnns
n¼1 TWnnsz þ ∑a¼1 TWadjz þ ∑v¼1 TWverz
d¼D‐5
counting the occurrence of distinct d;a d;v
where TW nnsd;n
z , TW adjz and TW ver z are the total occurrence counts of, respectively, a generic noun n,
nouns, adjectives and verbs. a generic adjective a and a generic verb v extracted from collected tweets at day d, varying from D-5 to
D-1, being D the day of the event. Nnns, Nadj and Nver are the total number of distinct nouns, adjectives
and verbs, respectively, extracted in tweets collected in the same temporal window.
NLPRTWWeek_z NLP score taking into account retweets in the D‐1
nns d;n Nadj d;a d;v
volume 5 days preceding the event, counting NLPRTWWeekz ¼ d¼D‐5 ∑ ∑N n¼1 RTWnnsz þ ∑a¼1 RTWadjz RTWverz
the occurrence of distinct nouns, d;a d;v
where RTW nnsd;nz , RTW adjz and RTW verz are the total occurrence counts of, respectively, a generic
adjectives and verbs. noun n, a generic adjective a and a generic verb v extracted from collected retweets at day d, varying
from D-5 to D-1, being D the day of the event. Nnns, Nadj and Nver are the total number of distinct nouns,
adjectives and verbs, respectively, extracted in retweets collected in the same temporal window.
SATWPosWeek_z Sentiment Sentiment score taking into account all D‐1
d;n n Nadj d;a a Nver d;v v
analysis tweets in the 5 days preceding the SATWPosWeekz ¼ ∑ ∑Nnns n¼1 TWnnsz gsspos þ ∑a¼1 TWadjz gsspos þ ∑v¼1 TWverz gsspos
d¼D‐5
event, adding the nouns, adjectives where TW nnszd;n is the occurrence of a generic noun n with positive sentiment score ssnpos at day d;
and verbs, each one weighted by its
corresponding positive SA score. a
TW adjd;a
z is the occurrence of a generic adjective a with positive sentiment score sspos at day d
v
and TW verd;v
z is the occurrence of a generic verb v with positive sentiment score sspos at day d;
these three metrics are computed for all the tweets collected in the 5 days preceding the event;
Nnns, Nadjand Nver are the total number of distinct nouns, adjectives and verbs, respectively, retrieved
in tweets collected in the same temporal window.
SATWNegWeek_z Sentiment Sentiment score taking into account all D‐1
d;n n Nadj d;a a Nver d;v v
analysis tweets in the 5 days preceding the SATWNegWeekz ¼ ∑ ∑Nnns n‐1 TWnnsz gsspos þ ∑a¼1 TWadjz gsspos þ ∑v¼1 TWverz gsspos
d¼D‐5
event, adding the nouns, adjectives where TW nnszd;n is the occurrence of a generic noun n with negative sentiment score ssnneg at day d;
and verbs, each one weighted by its
corresponding negative SA score. a
TW adjd;a
z is the occurrence of a generic adjective a with negative sentiment score ssneg at day d
v
and TW verd;v
z is the occurrence of a generic verb v with negative sentiment score ssneg at day d;
these three metrics are computed for the tweets collected in the 5 days preceding the event; Nnns, Nadj
and Nver are the total number of distinct nouns, adjectives and verbs, respectively, retrieved in tweets
in the same temporal window.
Multimed Tools ApplTable 1 (continued)
Metric name Kind Description Metric definition
SARTWPosWeek_z Sentiment Sentiment score taking into account all D‐1
nns d;n n Nadj d;a a Nver d;v v
analysis retweets in the 5 days preceding the SARTPosWeekz ¼ ∑ ∑N
n¼1 RTWnnsz gsspos þ ∑a¼1 RTWadjz gsspos þ ∑v¼1 RTWverz gsspos
d¼D‐5
event, adding the nouns, adjectives
Multimed Tools Appl
where RTW nnszd;n is the occurrence of a generic noun n with positive sentiment score ssnpos at day d;
and verbs, each one weighted by its
corresponding positive SA score. RTW adjzd;a is the occurrence of a generic adjective a with positive sentiment score ssapos at day d
and RTW verzd;v is the occurrence of a generic verb v with positive sentiment score ssvpos at day d; these
three metrics are computed for the retweets collected in the 5 days preceding the event; Nnns, Nadj
and Nver are the total number of distinct nouns, adjectives and verbs, respectively, retrieved retweets
collected in the same temporal window.
SARTWNegWeek_z Sentiment Sentiment score taking into account all D‐1
nns d;n n Nadj d;a a Nver d;v v
analysis retweets in the 5 days preceding the SARTWNegWeekz ¼ ∑ ∑N n¼1 RTWnnss gssneg þ ∑a¼1 RTWadjz gssneg þ ∑v¼1 RTWverz gssneg
d¼D‐5
event, adding the words, adjectives where RTW nnszd;n is the occurrence of a generic noun n with negative sentiment score ssnneg at day
and verbs, each one weighted by its
corresponding negative SA score. d; RTW adjzd;a is the occurrence of a generic adjective a with negative sentiment score ssaneg at day d
v
and RTW verd;vz is the occurrence of a generic verb v with negative sentiment score ssneg at day d; these
three metrics are computed for the retweets collected in the 5 days preceding the event; Nnns, Nadj
and Nver are the total number of distinct nouns, adjectives and verbs, respectively, retrieved in retweets
collected in the same temporal window.Multimed Tools Appl
can therefore be used to transfer sentiment polarity information associated to English words to
Italian corresponding ones. For each single tweet/retweet, its overall polarity score is given by
the sum of all the sentiment weighted keywords extracted in it.
Most of the above mentioned metrics can be estimated every 5 min, every hour or day, or
on more days according to the objective of the assessment (see Fig. 3 for example). The
Twitter Vigilance platform allows estimating a number of them daily and other hourly. In any
case, the user may re-compute them with different granularity from a specific interface
requested an ad-hoc task. In the next section, an overview of the whole process is presented.
3.2 The overall process for model definition
The approach proposed to set up a predictive model includes the following steps:
(I) Set up a TwitterVigilanceChannel semantically linked to the event in order to perform
Twitter data harvesting. The creation of the channel is grounded on the official hashtags
and Twitter users IDs, and relevant keywords. Other searchers to collect tweets can be
added on the basis of the early analysis of the Twitter data, thus enlarging the set of
searched queries on Twitter. This step is strongly dependent on the cases under analysis
and described in Section 4.
(II) identify a first large set of possible metrics from early collected data, by using a coherent
temporal basis of aggregation with respect to the real data values to be predicted (for
example, volume of single channel query over time, unique users over time, calendar
variables, natural language processing features, sentiment analysis features). In any case,
the searches of the TwitterVigilanceChannel which collect a large number of tweets and
retweets are typically significant and thus good potential predictors. Then, the time-series
of metrics have to be merged to define a channel’s Bguess metric matrix^;
(III) select metrics: when metrics extracted from channel are too many, a statistical criterion
may be applied to select the statistical significant metrics. For example, by using
principal component analysis, PCA, which may give indication of the variance coverage
and of complexity of data in terms of number of PCA to be considered. In addition,
some early experiments adopting a multi-linear regressive schema may help with the
support of the Akaike Information Criterion, AIC [2] in selecting/discharging the most/
less significant metrics as predictors. The selection may be carried out by using step-
wise process to build a sharper model both discharging not reliable variables (by
minimizing the AIC) and retaining the ones with a stronger linkage with variable to
be predicted [54]. The statistical reliable predictors are defined as the ones having a
significant t-student test outcome (p-value < 0.05). In alternative, machine learning
approaches can be adopted, in any way the predictive capability, the adjusted R-squared
and the AIC may help in deciding among the different methods. In most cases, the
predictive model is produced by using the 70%–80% of data (e.g., estimating coefficient
parameters, or learning parameters). Then the learned model is used to predict the
remaining 30%–20% on which the MAPE (Mean Absolute Percentage Error), and or
APE (Absolute Percentage Error) are estimated to perform the validation of the
predictive mode against the actual values recorded by the auditing agencies.
In Fig. 4, the process for passing from data to prediction model is formalized. The process
also presents a mapping of the above mentioned phases (from (i) to (iii)), giving the evidenceMultimed Tools Appl
Fig. 4 Overall process from Twitter data crawling to the computation of the prediction model
about what is performed by the TwitterVigilance tool, and what has to be performed by means
of data analytics approaches described in the following. See for example Fig. 3 which
represents some trend for sentiment analysis metrics.
3.3 Predictive models
TV programmes as reality show are in some sense short time events occurring with week
periodicity and not for several weeks, thus concentrating the audience in few hours per week.
Good examples of this kind of events are the so-called reality shows, such as: XF9, XF10 and
Pechino Express, which are broadcasted live typically once per week (for a few hours), few
weeks per year condensed in specific part of the year.
Thus, a number of methods for creating predictive model for guessing the number of people
following the show in the next week show have been considered and tested. The first method is
a multi-linear regression model, that attempts to model relationships among explanatory
variables/metrics (z1 , z2 , . . , zk) and a response variable x, all of them depending on t:
xt ¼ β 1 z1;t þ β 2 z2;t þ β 3 z3;t þ …þβk zk;t þ n ð1Þ
The aim is to invert the model (1) by estimating β1 , β2 , β3 , … , βk , n, which represents
the coefficients and the intercept of the best fitting line, respectively, obtained by a least
squares model. In this process, the estimated model can be more or less significant and
statistical significance can be estimated for each coefficient and for the whole fitting. Weights
are estimated by means of a learning period, thus allowing targeting the model construction.
Basically, several different models have been tested by estimating weights, and assessing
predicting capabilities. In order to set up a predictive model, the value of xt is estimated on the
basis of explanatory variables/metrics (z1 , z2 , . . , zk) computed at t-1 or before.
With many predictors and few observations in the dataset, fitting the full model without
penalization could result in large prediction intervals, and sometimes the model can over-fits
the data: when there are issues with collinearity, the linear regression parameter estimates may
become inflated. One consequence of large correlations between the predictor variances is that
the variance can become very large. For this reason, a shrinkage/regularization model (i.e.,
ridge regression) has been tested [21], where it adds a penalty on the sum of the squared
regression parameters. The effect of the penalty consists in the fact that the estimated
parameters are allowed to become large only if there is a proportional reduction in sum of
the squared errors (SSE). Thus, by adding the penalty, we are making a trade-off between the
model variance and bias by sacrificing some bias, we can often reduce the variance enough to
make the overall MSE (Mean Square Error) lower than unbiased models. In the selection of theMultimed Tools Appl
best predictive model also other techniques have been tested such as lasso [52] and Elastic Net
[20].
The following section refers to the prediction of the audience on TV programmes: X Factor
9, X Factor 10 and Pechino Express. For such reasons a suitable prediction model has been
obtained by exploiting data from previous days using multi-regressive and ridge models.
According to the above considerations, the reliable covariates we used have been individuated
on the basis of their statistical relevance with respect to the variable to be predicted and by
using a minimal AIC criterion [2]. The assessment quality of the models in terms of predictive
capability has been performed against the validation period on the basis of the root mean
square error (RMSE) and Mean Absolute Error (MAE) metrics that have been applied on the
predicted values, as well as the correspondent ones that were observed during the validation/
test period. The metric selection process has been carried out by approaching their incidence in
exploiting the variable to be predicted in the multilinear regression model.
4 Predicting TV audience via twitter data
The adopted data refer to the last year seasons in the second part of the 2015 and 2016. About
these events, the official actual data regarding the audience following those TV programmes
have been published on Wikipedia and on the related official web sites. For example, for:
& XF9 description and actual audience data are accessible on: https://it.wikipedia.
org/wiki/X_Factor_%28nona_edizione%29, while TwitterVigilance data can be accessed
from: http://www.disit.org/tv/index.php?p=chart_singlechannel&canale=Xfactor9
& XF10 description and actual audience data are accessible on: https://it.wikipedia.
org/wiki/X_Factor_(decima_edizione), while TwitterVigilance data from: http://www.
disit.org/tv/index.php?p=chart_singlechannel&canale=xf10
& Pechino Express description and actual audience data are accessible on: https://it.
wikipedia.org/wiki/Pechino_Express_%28quarta_edizione%29, while TwitterVigilance
data from: http://www.disit.org/tv/index.php?p=chart_singlechannel&canale=ads
In more details, X Factor is a television music competition format born in UK and then
exported abroad, becoming the biggest television talent competition in Europe. In Italy the 9th
season was televised (identified as XF9), from September to December 2015 and a season 10
in the 2016 with the first episodes devoted to auditions and singers’ selections. The initial
transmissions were followed by six weeks of weekly live shows where less appreciated singers
have been progressively eliminated, thus, the best four talents could reach the final event
where the winner was voted by the public. XF9 and XF10 have been broadcasted by pay-tv
channel Sky1, while first phases and the final ones have been also transmitted on free of charge
channels, i.e., national public television. The show began at prime time and closed after mid
night with a shorter transmission called BXtra Factor^ to talk about the main show while
always attracting the same audience. The audience of XF9 is typically based on young people,
who are also engaged in voting singers and groups, so as to eliminate or push them ahead in
the competition. As it occurs for every talent competition, the participation of the public is
critical for the success of the show; social media play a relevant role in promoting singers,
stimulating discussions and comments, while pushing audience to follow the show, voting
their favourite singers and so on.Multimed Tools Appl
Votes from the audience during the final broadcast of XF9 reached 7 million, and the
official hashtag #xf9 was the most widely used of the day (on the 10th December, final show
date) both in Italy and in the worldwide trending topic on Twitter. The competition has led to
four finalists in December 2015: Giosada, Urban Strangers, Davide Sciortino, Enrica Tara,
and the final selected Giosada has been the winner. A similarly analysis could be performed
for XF10.
XF9/XF10 organization have prepared a wide and effective dissemination and marketing
campaign also including social media, and thus Twitter accounts and hashtags reminding of the
names of singers, and judges. Some of them have been proposed by the producers, while
others have been spontaneously proposed by the audience and the social community. The
initial Twitter hashtags were #XF9, #XTRA9 and later #xf9Live. Later on, some additional
hashtags have been added to the above mentioned keys, concerning the singers, such as:
#UrbanStrangers, #eleonora, #giosada, #Enrica, etc. But concerning the judges/tutors, as well,
and for specific cases as: @DivanoRolling, #divanorolling, #GiosadaAlBallottaggio, #Elio,
#elioperilsociale, etc. XF9 cannel on Twitter Vigilance collected about 1.6 million of tweets in
Italian language with hashtag #XF9. They have been mainly concentrated to the prime time;
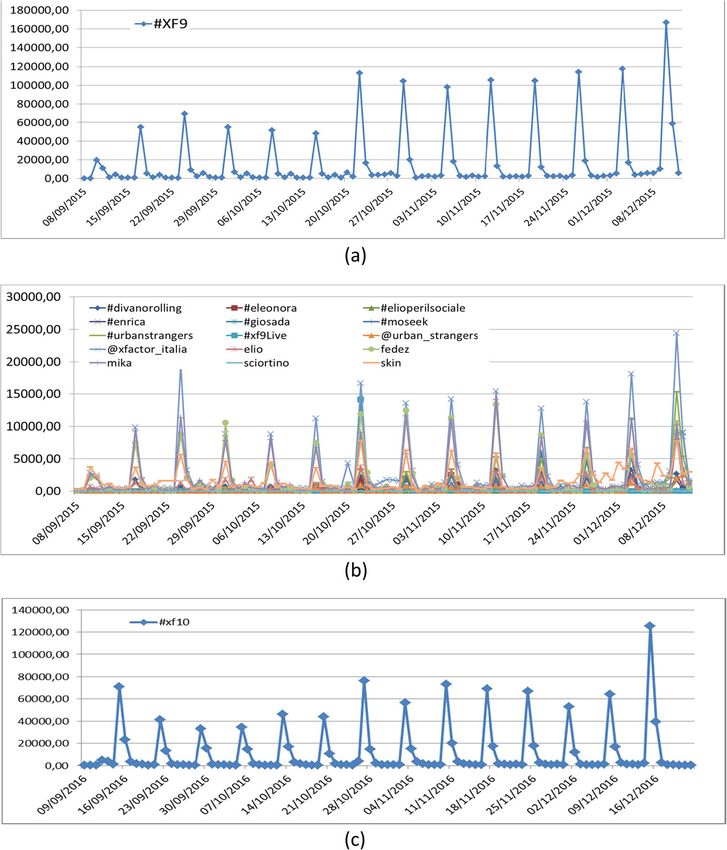
while smaller numbers have been collected over the days before the event (see Fig. 5). The
general volume of Twitter data in the XF9 channel resulted to be comprised of 43% of tweets
and 57% of retweets. Similarly for XF10, we can see from Fig. 5 that smaller volume of tweets
have been detected, only the final event of the serial reached an audience comparable to those
of season 9. According to Fig. 3b, the X Factor 9 channel presents a large number of other
keywords, hashtags citations, etc. that presents a similar trend with respect to the main hashtag
#XF9, and thus in some case add also a lot of noise. For example, those related to the judges
that also provoke some tweet for their own activity not related to XF9. Metrics specifically
related to those searches/keywords where discharge since less statistically relevant with respect
to #XF9.
The knowledge about the audience volume, and thus its prediction, can be very important
when it comes to ads sale, which is delivered in the context of television programmes. Today,
the ads value is only guessed since the measure of audience is obtained the day after, by Smart
Panel Sky and/or Auditel in some cases (Auditel is the national metering of TVaudience, could
not provide measures of XF9 over 15 days in the period and on such basis it was not used as
reference value).
A similar case can be described for Pechino Express TV show. Figure 6 reports the trend
Twitter data (TW + RTW) collected by TwitterVigilanceChannel and regarding Pechino
Express. In this case, the trend is quite different: the number of attendees does not tend to
increase aver the season, the last event does not attract a massive number of users.
4.1 Descriptive statistics
The Principal Component Analysis (PCA) is applied as exploratory technique for multivariate
data and is used to reveal the underlying structure that maximally accounts for the variance in
the data set. The basic goal of principal components analysis is to describe variation in a set of
correlated variables, xT = (x1, …, xq), in terms of a new set of uncorrelated variables, yT = (y1,
…, yq), each of which is a linear combination of the x variables. The new variables are derived
in decreasing order of importance in the sense that y1 accounts for as much as possible of the
variation in the original data amongst all linear combinations of x. Then y2 is chosen to account
for as much as possible of the remaining variation, subject to being uncorrelated with y1, andMultimed Tools Appl Fig. 5 Trends of twitters on Twitter Vigilance channels for XF9 and XF10: a trend of the whole #XF9 channel; b trends of the some of the channel XF9 less relevant searches, hashtags, mentions, keywords, etc. (among them also searches affected by relevant noise since connected to other meanings and not only to the TV show); c trend of the #XF10 so on. The new variables defined by this process, y1, …, yq, are the principal components [11]. The first few components take into account for a substantial proportion of the variation in the original variables and they be used to provide a lower-dimensional summary of these variables. Table 2 reports the importance of factors extracted by PCA in descending order of variance. In the second column of Table 2, the eigenvalues that represent the variance for each factor for XF9, are reported. The corresponding percentage of the variance is reported in the third column of the table. According to the Kaiser Criterion [25], it is recommended to retain only factors with eigenvalues greater than 1, thus the right number of principal components is three.
Multimed Tools Appl

Fig. 6 Trends of twitters on Twitter Vigilance channels for Pechino Express 2015

The first three factors account for the 91.85% of the total variance. In Table 3, the principal
component loadings for the X factor 9 features in Table 2 are reported.
   Factor 1 carries more than 53% of the total variability of the dataset (see Table 2) and this
variability is mainly explained by the majority of covariates. The variability of Factor 2
(28.4%) is carried by the positive correlation of RTWWeekRatio_z (0.8058) and the negative
correlation of SARTWPosWeek_z (−0.6526), while Factor 3 explains about 10.15% of the
total variability. PCA allowed to sort the features according to the impact on total variability
and understand the correlations among the metrics and the XF9 Sky audience.

4.2 Validation models

According to the above described data and cases, the first challenge was to identify a fitting
mode for XF9/XF10 and Pechino Express to validate the model consistency. The volume of
data is characterized by a max of a dozen of sporadic events plus all days in the middle, and an
explosive single event every week with a relevantly large audience for XF9 and XF10.
Therefore, as a first step for XF9/XF10 and Pechino Express a fitting model have been
identified by selecting the best metrics on the basis of PCA approach. As first approach, the
multilinear regression model has been adopted in some cases to estimate a model exploiting
volume metrics of Twitter such as in [6]. Botta et al., in [6], propose a multilinear model to
guess the number of people attending an event at the time of measure. Such approach does not

Table 2 Importance of components for XF9 data

Factors                  Eigenvalue                   % Variance                   % Cumulative Variance

1                        2.63                          53.26                       53.26
2                        1.92                          28.44                       81.71
3                        1.15                          10.15                       91.85
4                        0.86                          5.72                        97.57
5                        0.46                          1.61                        99.18
6                        0.23                          0.41                        99.59
7                        0.18                          0.25                        99.83
8                        0.12                          0.11                        99.94
9                        0.07                          0.04                        99.98
10                       0.05                          0.02                        100.00
11                       0.01                          0.00                        100.00
12                       0.01                          0.00                        100.00
Multimed Tools Appl

Table 3 Principal Component loadings for XF9 data with respect to identified metrics

metrics and data                          PC1                           PC2                             PC3

Sky Audience                              −0.1913                       −0.4001                         -0.7099
TWRTWWeek_z                               −0.8745                       0.4396                          −0.1848
TWWeek_z                                  −0.8572                       0.4846                          −0.1485
RTWWeekRatio_z                            −0.3462                       0.8058                          0.3857
UnqUserTW_z                               −0.9241                       0.2170                          −0.1115
UnqUserRTW_z                              −0.7276                       0.6518                          0.0693
FUnqUsers_z                               −0.7607                       0.6225                          0.0707
SATWPosWeek_z                             −0.8562                       −0.3978                         -0.1180
SATWNegWeek_z                             −0.8439                       −0.4174                         -0.2269
SARTWPosWeek_z                            −0.6261                       −0.6526                         0.2860
SARTWNegWeek_z                            −0.5478                       −0.5900                         0.5665
NLPTWWeek_z                               −0.8680                       −0.4149                         -0.1310
NLPRTWWeek_z                              −0.6449                       −0.5671                         0.3206

lead to a predictive model, but rather to a model able to guess the volume of people in a given
area at the current instant of measure on the basis of the Twitter data volume. Thus, in Table 2,
an early model estimated by the multi-linear regression approach for XF9 and XF10 based by
using volume and network metrics has been derived to confirm its validity in terms of structure
with the aim of using the same metric set for both cases. From Table 4, the models present a
satisfactory AIC and R-squared, while a less satisfactory adjusted R squared has been obtained
for XF10a. In the case of XF9a, according to the p-value, some of the metrics are not
significant (such as FUnqUsers_z and FUnqUsers_z). If removed, slightly better results have
been obtained producing the XF9b model as depicted in Table 5. In that case, an adjuster R
squared of 0.768, with an AIC of 302, have been obtained. Please note that RMSE remain
comparable among the three models. Therefore, the resulting models for XF9 and XF10 may
be in principle very similar, obtaining similar results in terms of fitting. Note that in the case of

Table 4 Parameters of the validation models using only volume and network based metrics estimated for XF9
and XF10 with a multilinear regression approach

Metrics                     XF9a Validation Model                     XF10a Validation Model

                            Coeff        Std Err     t-val    p-val   Coeff         Std Err     t-val     p-val

TWRTWWeek_z            β1   161.2        144.1       1.119    0.314   999.6         788.1       1.268     0.260
TWWeek_z               β2   −220.4       240.1       −0.918   0.401   −1489         1412        −1.054    0.340
RTWWeekRatio_z β3           −2,190,936   1,308,957   −1.674   0.155   −11,342,148   4,477,279   −2.533    0.052
UnqUserTW_z            β4   −327.8       490.8       −0.668   0.534   −6414         2761        −2.323    0.068
UnqUserRTW_z           β5   −99.16       670.1       −0.148   0.888   −6655         2821        −2.359    0.065
FUnqUsers_z            β6   −5.461       617.1       −0.009   0.993   6208          2726        2.277     0.072
Intercept              n    5,387,852    2,306,725   2.336    0.067   21,546,552    8,072,832   2.669     0.044
R squared                   0.867                                     0.781
Adjuster R squared          0.707                                     0.517
AIC                         306                                       310
RMSE                        42,159                                    50,800
MAE                         34,244                                    42,288
Weeks                       12                                        12
millions of tweets +        1.625                                     1.383
   retweets on Twitter
   Vigilance
You can also read