Request for Redesignation to Attainment for the 2015 Ozone National Ambient Air Quality Standard and Revision to Michigan's State Implementation ...
←
→
Page content transcription
If your browser does not render page correctly, please read the page content below
Request for Redesignation to Attainment for the
     2015 Ozone National Ambient Air Quality Standard
                             and
      Revision to Michigan’s State Implementation Plan
              and Ozone Maintenance Plan for
                  Berrien County, Michigan

Michigan Department of Environment, Great Lakes, and Energy
                    Air Quality Division

                         P.O. Box 30260
                  Lansing, Michigan 48906-7760
                      www.michigan.gov/air

                       January 2020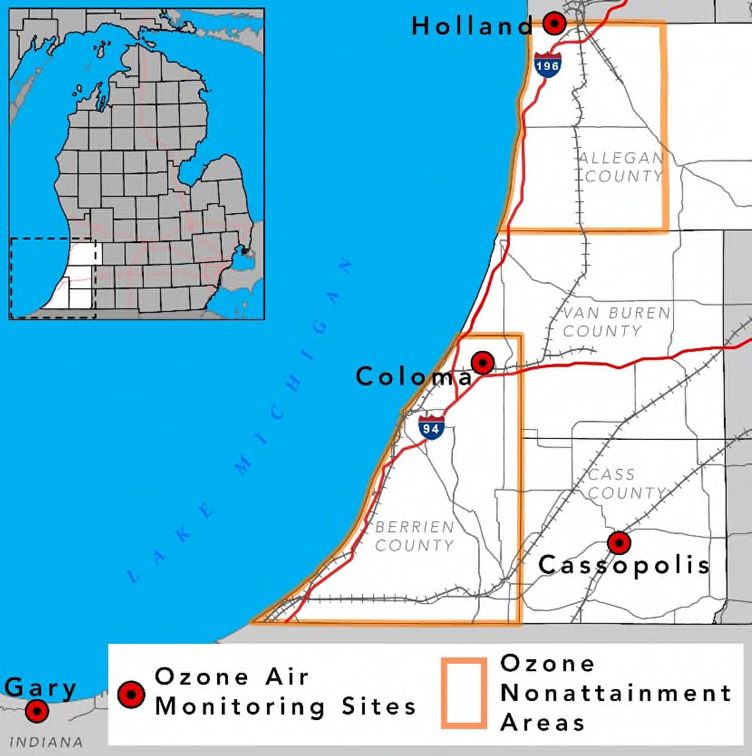
TABLE OF CONTENTS

                                                                                                                  Page No.

Introduction ............................................................................................................1
Background ............................................................................................................1

Clean Air Act Section 107(d)(3)(E) Requirements and Demonstrations .................2
1. Attainment of the NAAQS .................................................................................2
2. Approved SIP Under Section 110(k) .................................................................4
3. Permanent and Enforceable Reductions ..........................................................8
4. Section 175A Maintenance Plan ......................................................................19
5. Section 110 and Part D Conformity..................................................................23

Title 40, Code of Federal Regulations, Part 51,
    Appendix V Requirements ...............................................................................25
1. A Formal Request ............................................................................................25
2. Necessary Legal Authority ...............................................................................25
3. Sufficient Public Notice ....................................................................................26
4. Valid Public Hearing.........................................................................................26
5. Public Comments .............................................................................................26

Conclusion ............................................................................................................27

LIST OF FIGURES:

Figure 1. Coloma Air Quality Monitor Location ......................................................3
Figure 2. Ambient Air Monitor Locations in and Near Berrien County ..................11

LIST OF TABLES:

Table 1. Coloma Ozone 8-Hour Average, Design Value, and Completeness
         for 2017 Through 2019 ............................................................................2
Table 2. Berrien County 2017 Emissions Inventory ...............................................5
Table 3. Berrien County Onroad Vehicle Emissions .............................................17
Table 4. Berrien County NOx Emissions Inventory Projections ............................19
Table 5. Berrien County VOC Emissions Inventory Projections............................20
Table 6. Projected NOx Emission Reductions for Berrien County ........................24
Table 7. Projected VOC Emission Reductions for Berrien County ........................25
Table 8. Motor Vehicle Emissions Budget for Berrien County ..............................25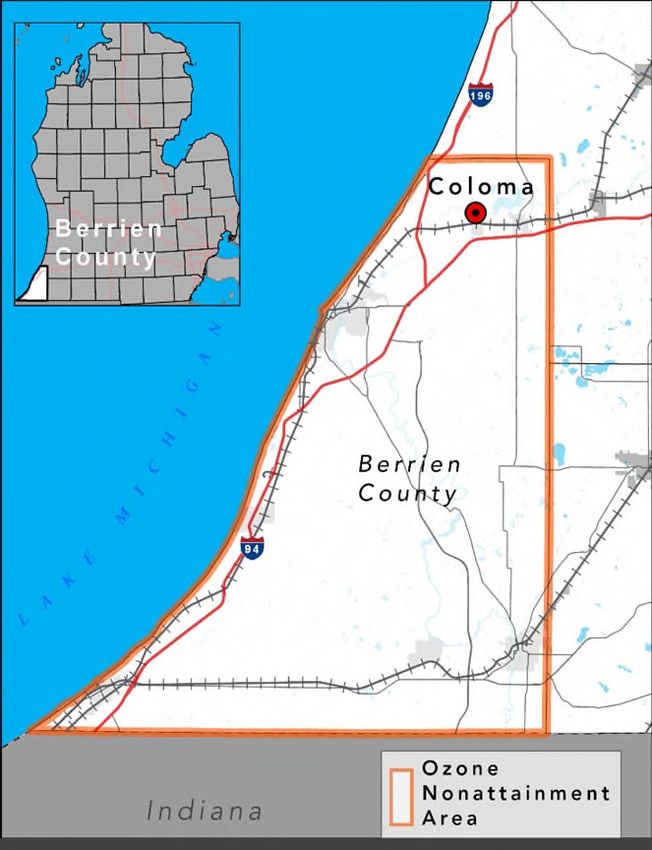
LIST OF CHARTS:
Chart 1. Coloma Days at or Above 80F vs. Maximum 8-Hour Ozone .................... 9
Chart 2. Coloma Average May through September Temperature vs. 4th
High 8-Hour Ozone (O3) Concentration .................................................... 10
Chart 3. Coloma 4th High Ozone (O3) Concentration vs. Holland and Gary,
Indiana, May through September, Average Relative Humidity (RH) ......... 12
Chart 4. West Michigan CART Analysis 2018 ........................................................ 13
Chart 5. Berrien County Vehicle Miles Traveled vs. 4th High 8-Hour Average
Ozone Concentrations .............................................................................. 14
Chart 6. Emissions from VOC Point Sources in Berrien County ............................. 15
Chart 7. Emissions from the Top NOx Point Source in Berrien County .................. 15
Chart 8. Berrien County Employment Data vs. 4th High 8-Hour Average
Ozone Concentration................................................................................ 16
ATTACHMENTS:
Attachment A Air Quality Redesignation Onroad Emissions for Berrien County,
Michigan, Nonattainment Area
Attachment B Michigan Air Emissions Reporting 2017 NOx and VOC Point Source
Emissions Estimates for Berrien County
Attachment C LADCO CART Analysis of Historic Ozone Episodes
Attachment D EGLE Emissions Projection Analysis
Attachment E Public Notice Documents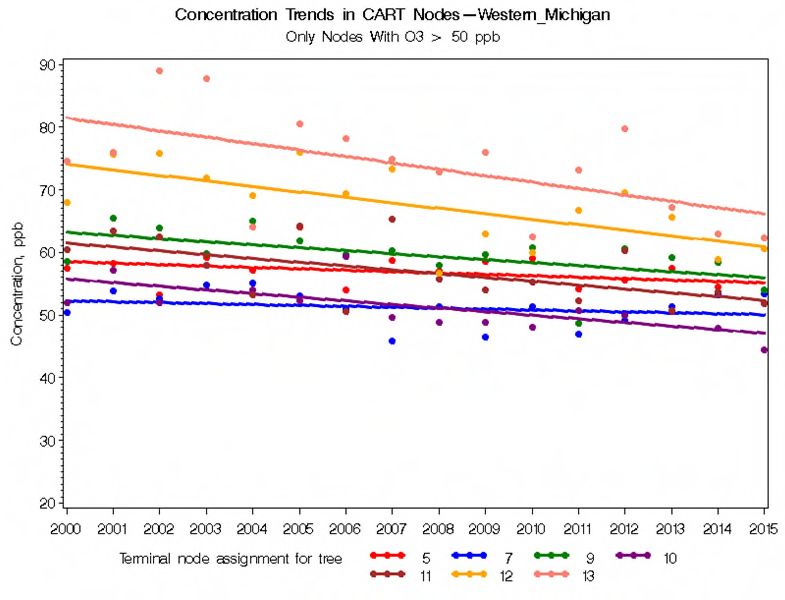
Proposed Request for Redesignation to Attainment for the
               2015 Ozone National Ambient Air Quality Standard
            and Revision to Michigan’s State Implementation Plan and
              Ozone Maintenance Plan for Berrien County, Michigan

Introduction

On October 1, 2015, the United States Environmental Protection Agency (USEPA)
promulgated a revised National Ambient Air Quality Standard (NAAQS) for ozone (the
2015 ozone NAAQS). The 2015 ozone NAAQS was revised to an 8-hour standard of
0.070 parts per million (throughout this document, the 2015 ozone NAAQS will be
expressed as 70 parts per billion [ppb]).

The USEPA made initial attainment / unclassifiable designations for the 2015 ozone
NAAQS for the state of Michigan on November 16, 2017 (82 Federal Register [FR]
54232) and made corrections to those designations on October 16, 2018 (83 FR
52157). On June 4, 2018 (83 FR 25776), the USEPA made the final designations and
classifications for Michigan, including designating Berrien County as marginal
nonattainment, effective August 3, 2018.

Section 107(d)(3)(E) of the Clean Air Act (CAA) allows states to request the
redesignation of nonattainment areas to attainment provided certain criteria are met. In
addition, Title 40 of the Code of Federal Regulations (CFR), Part 51, contains
requirements for State Implementation Plan (SIP) revisions.

This SIP document describes these criteria and Michigan’s demonstration of attainment.
Therefore, the State of Michigan, through the Department of Environment, Great Lakes,
and Energy (EGLE), is asking the USEPA to make a determination that Berrien County
is now in attainment with the 2015 ozone NAAQS, to change the status of the area from
nonattainment to attainment, and to approve the Section 175A maintenance plan and
emissions inventories included in this document as a revision to the Michigan SIP. In
addition, EGLE requests approval of the Motor Vehicle Emissions Budgets (MVEBs) for
Berrien County, included in this document, for the duration of the maintenance period.

Background

Under the 2015 ozone NAAQS, areas that had a three-year design value of 71 ppb or
higher were considered nonattainment. A design value for the 2015 ozone NAAQS is
the three-year average of the 4th highest 8-hour average ozone concentration. The
2015 ozone NAAQS classification level was determined by the amount the design value
for an area was above 71 ppb. Design values above 71 ppb and below 81 ppb were
identified as a marginal nonattainment classification.

In 2018, Berrien County was designated marginal nonattainment based on air
monitoring data from the 2015 through 2017 ozone seasons. The sole air monitor in

                                         Page 1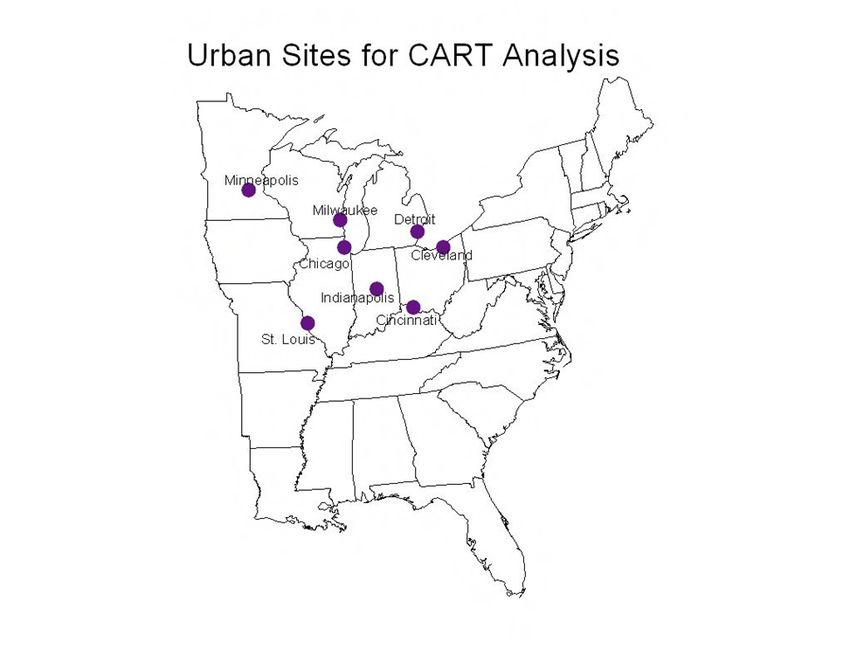
Berrien County, Coloma, had a 2015 through 2017 ozone design value of 73 ppb. The
Coloma air monitor is now demonstrating attainment of the 2015 ozone NAAQS with a
2017 through 2019 design value of 69 ppb, as demonstrated below.

Clean Air Act Section 107(d)(3)(E) Requirements and Demonstrations
   1. Attainment of the NAAQS
      CAA Section 107(d)(3)(E)(i) sets out requirements to demonstrate attainment of
      the 2015 ozone NAAQS. There are two components involved in making this
      demonstration; air quality data and supplemental air quality modeling. According
      to the USEPA’s 1992 Procedures for Processing Requests to Redesignate Areas
      to Attainment (USEPA Guidance), supplemental USEPA-approved air quality
      modeling is not required for ozone nonattainment areas seeking redesignation.
      The air quality data requirements, and Michigan’s demonstration of those, are
      listed in subsections a through c, below.

      a. Attaining Data
         Section 107(d)(3)(E)(i) requires three complete, consecutive calendar years
         of quality-assured air quality monitoring data to demonstrate attainment. This
         subsection addresses the three complete, consecutive year requirement.
         Quality assurance is addressed more thoroughly in subsection c, below.

         According to 40 CFR Part 50, Appendix I, the requirement for three complete,
         consecutive calendar years of data is met if the “daily maximum 8-hour
         average concentrations are available for at least 90 percent, on average, of
         the days during the designated ozone monitoring season, with a minimum
         data completeness in any one year of at least 75 percent of the designated
         sampling days.”

         Ozone monitoring data was collected at the Coloma air monitoring site (Site
         ID 26-021-0014) in Berrien County for the consecutive years of 2017 through
         2019. Table 1 lists the highest four 8-hour average values collected in 2017
         through 2019, along with the 2017 through 2019 design value. These values
         were obtained during the ozone season, which runs March 1 through
         October 31 in Michigan each year. Table 1 also lists the percentage of days
         (% Days) during the ozone season that data was obtained from this monitor,
         demonstrating completeness.

         Table 1. Coloma Ozone 8-Hour Average, Design Value, and Completeness
         for 2017 Through 2019.
                                          1st      2nd       3rd        4th     2017-2019
                                 %
             Site ID     Year           8-hour    8-hour    8-hour    8-hour
                                Days                                           Design Value
                                       Average   Average   Average   Average
           26-021-0014   2017    99       74        73        71        69
           26-021-0014   2018    88       78        77        76        73         69
           26-021-0014   2019    96      74        74        69        66

                                        Page 2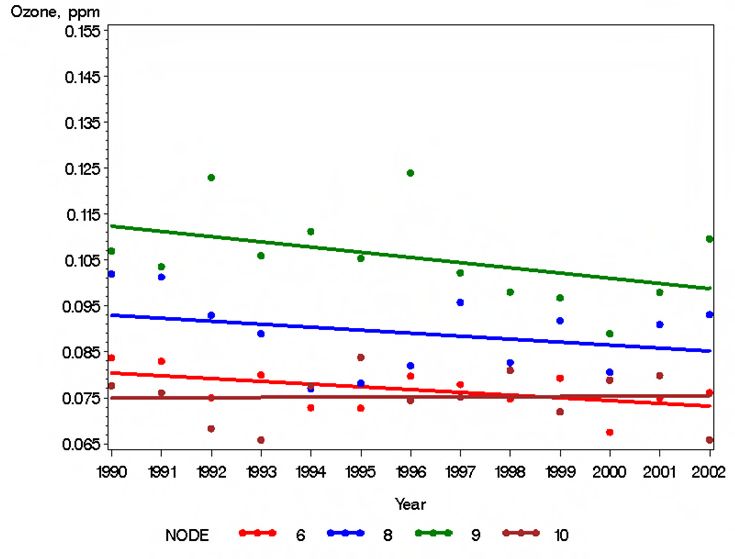
For the years 2017 through 2019, the Coloma monitor had a design value of
   69 ppb, a yearly completeness over 88 percent, and an average
   completeness over 94 percent. These completeness values align with the
   requirements under 40 CFR Part 50, Appendix I, and the design value is
   below the 2015 ozone NAAQS set at 70 ppb, therefore, demonstrating the
   monitoring data is attaining the NAAQS.

b. Representative Data
   Section 107(d)(3)(E)(i) also requires that the ambient air quality data is
   representative of the area of highest concentration and the ambient air
   monitor remained at the same location for the duration of the monitoring
   period.

   As stated above, Berrien County contains one air quality monitor located in
   the city of Coloma (Figure 1). This monitor is situated between the two major
   highways in Berrien County and upwind of the major population centers.

   Figure 1. Coloma Air Quality Monitor Location.
                                                    EGLE’s air monitoring network,
                                                    including the Coloma monitor,
                                                    adheres to the requirements in
                                                    40 CFR Part 58. This ensures
                                                    that the monitors are correctly
                                                    sited.

                                                    The Coloma monitor has
                                                    remained at the same location
                                                    for the 2017 through 2019
                                                    sampling years as referenced in
                                                    the 2017 through 2019 Annual
                                                    Ambient Air Monitoring Network
                                                    Reviews submitted to the
                                                    USEPA. The most recent
                                                    Network Review was submitted
                                                    on July 1, 2019. A copy of that
                                                    document is available at EGLE’s
                                                    Air Quality Division (AQD)
                                                    Webpage:
                                                    https://www.michigan.gov/docum
                                                    ents/egle/egle-aqd-amu-
                                                    2020_air_monitoring_network_re
                                                    view_654930_7.pdf.

                                  Page 3
c. Quality-Assured Data
      Section 107(d)(3)(E)(i) requires that the ambient air quality data was collected
      and quality-assured in accordance with 40 CFR Part 58 and recorded in the
      Air Quality System (AQS).

      As stated above, EGLE has quality-assured all data shown in Table 1. EGLE
      submits annual data certification letters to the USEPA, Region 5, certifying
      the completeness criteria under 40 CFR Part 50 and the quality assurance
      criteria under 40 CFR Section 58.10. The most recent annual data
      certification letter was submitted on April 17, 2019, and is available upon
      request. A certification letter for the 2019 Coloma air monitoring data was
      submitted to the USEPA on November 14, 2019.

2. Approved SIP Under Section 110(k)
   CAA Section 107(d)(3)(E)(ii) requires an approved SIP under Section 110(k) for
   an area to be redesignated to attainment. According to the USEPA Guidance,
   “[t]he SIP for the area must be fully approved under section 110(k), and must
   satisfy all requirements that apply to the area.” Section 110(k) contains the
   requirements for USEPA actions on SIP submissions. For marginal ozone areas,
   the requirements referred to in Section 110(k) are listed in Sections 172(c) and
   182(a).

   The requirements, and Michigan’s demonstration of those requirements, under
   Section 172(c) for nonattainment area plans in general, are listed in subsections
   a through d, below. The requirements, and Michigan’s demonstration of those
   requirements, under Section 182(a), are listed under the CAA Section 182(a)
   Requirements and Demonstration subsections, following the Section 172(c)
   discussion.

   CAA Section 172(c) Requirements and Demonstration
   a. Not Applicable Requirements Under Section 172(c)
      CAA Section 172(c) contains two requirements that are not applicable to
      marginal nonattainment areas subject to Section 182(a), such as Berrien
      County. These are the requirement to provide for the implementation of all
      reasonable control measures to attain the standard under Section 172(c)(1)
      and the requirement for reasonable further progress toward attainment under
      Section 172(c)(2).

      Also, Berrien County, due to lack of areas identified as economic
      development zones under Section 173(a)(1)(B), does not have any applicable
      requirements under Section 172(c)(4). In addition, Michigan has not
      requested any equivalent techniques from the USEPA for Berrien County.
      Therefore, there are no applicable requirements under Section 172(a)(8).

      Finally, Section 172(c)(6) requires the SIP to include measures to provide for
      attainment by the attainment date. In addition, Section 172(a)(9) requires

                                     Page 4
contingency measures in case “the area fails to make reasonable further
progress, or to attain” the NAAQS by the attainment date. This document
details Berrien County’s attainment of the 2015 ozone NAAQS, therefore
additional SIP measures to provide for attainment or reasonable further
progress are not needed.
b. Inventory
Section 172(c)(3) requires each plan to “include a comprehensive, accurate,
current inventory of actual emissions from all sources of the relevant pollutant
or pollutants in such area...”. The USEPA Guidance states “[f]or O3
nonattainment areas, the inventory should be based on actual typical summer
day emissions of O3 precursors...during the attainment year.” Michigan
submits the following inventory to comply with this requirement.
For onroad emissions, as stated in the Michigan Department of
Transportation’s (MDOT) Air Quality Redesignation Onroad Emissions for
Berrien County, Michigan Nonattainment Area (MDOT Analysis)
(Attachment A), MDOT used the MOVES model with the 2015 platform to
interpolate the 2017 data from the years 2015 and 2018, generating data
based on July weekday emissions.
For all other emissions, EGLE used the data collected for the USEPA
Emissions Modeling platform 2016v1 (2016v1) to estimate the 2017
emissions. The detailed USEPA data can be found at
ftp://newftp.epa.gov/air/emismod/2016/v1/reports/. EGLE conducted an
analysis (Attachment D) to interpolate, from the 2016v1 platform, the 2017
data, generating tons per day data based on annual emissions. Table 2,
below, is the result of these analyses for 2017 and contains the current
Berrien County attainment year inventory. In addition, detailed Michigan Air
Emissions Reporting System (MAERS) point source data is available in
Attachment B.
Table 2. Berrien County 2017 Emissions Inventory.
Emission NOx Emissions VOC Emissions
Sources (tons/day) (tons/day)
Onroad 5.94 3.50
Nonroad 0.97 1.22
Point 1.53 1.03
Nonpoint 1.62 6.61
c. Permits for New and Modified Major Sources
Section 172(c)(5) requires the SIP to “require permits for the construction and
operation of new or modified major stationary sources anywhere in the
nonattainment area, in accordance with section 173.” Section 173 is the
nonattainment permitting program or Nonattainment New Source Review
(NNSR).
Page 5Michigan’s NNSR rules were approved into the Michigan SIP for Berrien
County as part of a redesignation for the Benton Harbor Area for the 1997
8-hour ozone NAAQS on May 16, 2007 (72 FR 27425).
d. Compliance with Section 110(a)(2)
Section 172(a)(7) requires compliance with the applicable sections of
Section 110(a)(2). This section provides that the infrastructure SIP submitted
by a State must have been adopted by the State after reasonable public
notice and hearing, and among other things, it must:
include enforceable emission limitations and other control measures
(other than nonattainment emission limitations and measures which
are a part of nonattainment area plans and subject to the timing
requirements of Section 172);
include means or techniques necessary to meet the requirements of
the CAA;
provide for establishment and operation of appropriate devices,
methods, systems, and procedures necessary to monitor ambient air
quality;
provide for implementation of a source permit program to regulate the
modification and construction of any stationary source within the areas
covered by the plan;
include provisions for the implementation of Part C, prevention of
significant deterioration and Part D, NNSR permit programs;
include criteria for stationary source emission control measures,
monitoring, and reporting;
include provisions for air quality modeling; and
provide for public and local agency participation in planning and
emission control rule development.
Michigan verified that the State fulfills the requirements of Section 110(a)(2)
through the 2015 ozone NAAQS infrastructure SIP submitted to the USEPA
on March 5, 2019.
CAA Section 182(a) Requirements and Demonstration
a. Not Applicable Requirement Under Section 182(a)
Section 182(a)(1) states for marginal nonattainment areas, “[w]ithin 2 years
after the date of enactment of the [CAA] Amendments of 1990, the State shall
submit a comprehensive, accurate, current inventory of actual emissions from
all sources, as described in Section 172(c)(3)....”
The Section 182(a)(1) requirement for inventory submittals is due within two
years after the nonattainment designation. For Michigan nonattainment areas,
that date is June 4, 2020. Once an area is redesignated to attainment, the
Section 182(a)(1) requirement no longer applies.
Page 6This document details the attainment status of Berrien County, and will be
submitted to the USEPA before June 4, 2020, therefore, the Section 182(a)(1)
requirement is not applicable.
b. Corrections to the SIP
Section 182(a)(2) requires the following updates to a marginal area
nonattainment SIP:
1. Not Applicable Requirements Under Section 182(a)(2)
Berrien County was not subject to the requirements under
Sections 182(a)(2)(A) and (B) dealing with reasonable available control
technology and vehicle inspection and maintenance updates before the
CAA Amendments of 1990, therefore, updates to these programs are not
applicable.
2. Permit Programs
Section 182(a)(2)(C) requires updates to the NNSR permitting program
that were enacted before the CAA Amendments of 1990.
As stated above, NNSR rules were approved into the Michigan SIP for
Berrien County as part of the 1997 8-hour ozone NAAQS Benton Harbor
Area redesignation on May 16, 2007 (72 FR 27425). In addition,
Michigan’s SIP contains all emission control programs under the 1979
1-hour ozone NAAQS related to ozone included in the SIP revisions
submitted to the USEPA from March 8, 1994, through August 30, 2000.
c. Periodic Inventory
Section 182(a)(3)(A) requires a general inventory. This inventory must meet
the requirements of Section 182(a)(1) every three years until attainment.
Michigan satisfies the general inventory requirement through the 2017
inventory included above.
Section 182(a)(3)(B) requires the State of Michigan to submit a SIP revision
that “require[s] that the owner or operator of each stationary source of oxides
of nitrogen or volatile organic compounds provide the State with a
statement...showing the actual emissions...from that source.” These
statements must be submitted at least annually.
Michigan Air Pollution Control Rule (MAPCR) 336.202 requires an annual
report from sources of air contaminants. The rule is written broadly enough to
require submittal of all pollutants. MAPCR 336.202 was approved into the
Michigan SIP on March 8, 1994 (59 FR 10752). Sources subject to
MAPCR 336.202 are required to submit their emission estimates to MAERS
annually.
Page 7In addition, the AQD has created Policy and Procedure AQD-013. It specifies
which facilities must report to MAERS. AQD-013 states that sources with NOx
emission above 40 tons per year (tpy) or volatile organic compound (VOC)
emissions over 10 tpy will be notified to report emissions annually. AQD-013
is available on the AQD Webpage under Emissions/Laws and Rules.
d. General Offset Requirements
Section 182(a)(4) requires the general NNSR permit offset ratio for VOCs be
set to 1.1 to 1.
For marginal nonattainment areas, MAPCR 336.2908(6)(a)(i) sets the permit
offset ratio for VOCs at 1.1 to 1. MAPCR 336.2908 was approved into the
Michigan SIP on December 16, 2013 (78 FR 76064).
3. Permanent and Enforceable Reductions
CAA Section 107(d)(3)(E) requires that the improvement in air quality is due to
permanent and enforceable reductions in emissions. According to the USEPA
Guidance, “[t]he State must be able to reasonably attribute the improvement in
air quality to emission reductions which are permanent and enforceable.” EGLE
must demonstrate that the improvement in the air quality between the year the
violations occurred, and the year attainment was achieved, is due to permanent
and enforceable measures, not to temporary adverse economic conditions or
unusually favorable meteorology.
Section 1, above, demonstrates attainment of the 2015 ozone NAAQS for
Berrien County. Ozone is typically formed in the presence of VOCs and NOx on
sunny, high temperature, low relative humidity days. Consistent with the USEPA
Guidance, EGLE demonstrates below that attainment of the 2015 ozone NAAQS
in Berrien County is not based on meteorology or temporary adverse economic
conditions.
a. Attainment Not Based on Meteorology
To demonstrate that the improvement in air quality was not based on
unusually favorable meteorology, EGLE analyzed the elements typical of
ozone formation.
Ozone typically will form on hotter days. Chart 1 demonstrates the number of
days above 80 degrees Fahrenheit (°F) compared to the maximum 8-hour
ozone concentration measured at the Coloma site from the years 2000 to
2019.
Page 8Chart 1. Coloma Days at or Above 80F vs. Maximum 8-Hour Ozone.
120 80
Ozone Concentration (ppb)
70
Number of Days
100
60
80
50
60 40
30
40
20
20
10
0 0
2000
2001
2002
2003
2004
2005
2006
2007
2008
2009
2010
2011
2012
2013
2014
2015
2016
2017
2018
2019
Max 8-Hour O3 #Days at or > 80 Degrees F
Linear (Max 8-Hour O3) Linear (#Days at or > 80 Degrees F)
The data indicates that around 2015, the number of hot days, those above
80 degrees, began to increase while the maximum 8-hour ozone
concentration remained the same or decreased.
To further demonstrate that temperature was not a driver of ozone production
at the Coloma site, EGLE analyzed the average temperature during the
ozone season and compared that to the average 4th highest 8-hour ozone
concentration during the same 2000 to 2019 period (Chart 2). The 4th highest
8-hour ozone concentration is significant because the USEPA uses the 3-year
average of the 4th highest 8-hour ozone concentration to determine
attainment or nonattainment.
Originally the ozone season, those months more likely to contain hotter days
in Michigan, were determined by the USEPA to be April through September.
With the updated 2015 ozone NAAQS, the USEPA changed Michigan’s
ozone season to March through October. For this analysis, EGLE chose to
only include May through September data as those months are more likely to
have days over 80 degrees, leading to higher ozone formation, and
historically ozone data was not collected in March and October.
Page 9Chart 2. Coloma Average May through September Temperature vs. 4th High
8-Hour Ozone (O3) Concentration.
120 78
Ozone Concentration (ppb)
77
100
76
Temperature (oF)
80
75
60 74
73
40
72
20
71
0 70
2000
2001
2002
2003
2004
2005
2006
2007
2008
2009
2010
2011
2012
2013
2014
2015
2016
2017
2018
2019
4th High 8-Hour O3 Avg Temp May-Sept
Linear (4th High 8-Hour O3) Linear (Avg Temp May-Sept)
While the average May through September temperature varies from year to
year based mainly on warm and cold global cycles, there is a clear warming
pattern at the Coloma site. The trendlines on Chart 2 demonstrate around
2012 that the average May through September temperature at Coloma
continues to increase while a decreasing trend occurred with the 4th-high
8-hour ozone concentration.
Together, Charts 1 and 2 demonstrate there is no connection between
temperature and ozone production at the Coloma site.
Page 10Figure 2. Ambient Air Monitor Locations in and Near Berrien County.
High relative humidity can
also be a driver of ozone
production. EGLE does not
collect relative humidity
data at the Coloma air
monitoring site; however,
EGLE was able to obtain
that data from the Holland
air monitoring site (Site ID
26-0050-0003) and the
Gary, Indiana, air
monitoring site (Site ID
18-089-0022). These air
monitoring sites are the
closest to Coloma that are
similarly situated near the
Lake Michigan shoreline
(Figure 2).
EGLE analyzed the relative humidity data to demonstrate that relative
humidity was not a driver for ozone production at the Coloma site.
Chart 3 shows the average percent relative humidity from May through
September at both the Holland, Michigan, and Gary, Indiana, sites compared
to the 4th highest maximum 8-hour ozone concentration at the Coloma site for
the years 2000 through 2019. This chart shows that relative humidity and
ozone productions were not correlated at either site.
Also, while Chart 3 shows the ozone production at Coloma dropped while the
relative humidity at Holland dropped according to the trendlines, that is not
definitive due to the lack of data from the Holland site. The Holland site had a
malfunction that resulted in a lack of data availability for the years 2017, 2018,
and 2019. For this reason, EGLE also analyzed the Gary, Indiana data.
Trendlines between Coloma ozone production and Gary relative humidity
show no correlation.
Page 11Chart 3. Coloma 4th High O3 Concentration vs. Holland and Gary, Indiana,
May Through September, Average Relative Humidity (RH).
120 100
95
Ozone Concentration (ppb)
100 90
Relative Humidity (%)
80 85
80
60 75
70
40 65
20 60
55
0 50
2000
2001
2002
2003
2004
2005
2006
2007
2008
2009
2010
2011
2012
2013
2014
2015
2016
2017
2018
2019
4th high 8hr O3 Average RH May-Sept Holland
Average RH May-Sept Gary IN Linear (4th high 8hr O3)
Linear (Average RH May-Sept Holland) Linear (Average RH May-Sept Gary IN)
Together these three charts show decreasing trends connecting weather to
the production of ozone at the Coloma site.
In addition, the Lake Michigan Air Directors Consortium (LADCO) has studied
ozone production in the Lake Michigan states. One paper, the CART Analysis
of Historic Ozone Episodes (Attachment C), supplies a statistical
methodology to remove meteorology from the causes of ozone production
based on years 1990 through 2002. The paper demonstrated the CART
analysis is a valid methodology for assessing meteorology variability and its
impacts on ozone production in the Lake Michigan area.
Results from a more recent CART analysis conducted by LADCO were
presented at the Southeast Michigan Air Quality meeting on July 25, 2018.
Results of that CART analysis presented for West Michigan are shown in
Chart 4.
Page 12Chart 4. West Michigan CART Analysis 2018.
Chart 4 shows CART analysis nodes for ozone values above 50 ppb at the
Holland, Muskegon (26-121-0039), and Jenison (26-139-0005) air monitoring
sites from 2000 through 2015. Each node defines a set of days with similar
meteorological conditions. Looking at trends by node eliminates the effect of
changes in meteorology on ozone concentration trends. The downward slope
of the nodes in Chart 4 demonstrates that, controlling for meteorological
variability, ozone concentrations in western Michigan have declined over time.
Because meteorological conditions are held constant, the declining
concentrations are most likely due to declining ozone precursor
concentrations.
These results together demonstrate that attainment of the 2015 ozone
NAAQS at the Coloma site was not driven by weather.
b. Attainment Not Based on Temporary Adverse Economic Conditions
To demonstrate the improvement in air quality was not based on temporary
adverse economic conditions, EGLE utilized the MDOT Analysis, MAERS
data, and the United States Bureau of Labor Statistics (BLS) data. Temporary
adverse economic conditions would have been seen in an abrupt reduction in
emissions from point sources, vehicle travel, or employment in Berrien
County.
The MDOT Analysis (Attachment A) shows the Motor Vehicle Emission
Simulator (MOVES) results for vehicle miles of travel (VMT) over the years
Page 132014, 2015, 2017, and 2018, and projected for the years 2020, 2023, and
2030. For purposes of this demonstration, looking at the VMT for 2015
through 2018 (Chart 5) shows an increase in VMT in 2017 compared to a
decrease in the 4th highest 8-hour ozone concentration measured at the
Coloma site.
Chart 5. Berrien County Vehicle Miles Traveled vs. 4th High 8-Hour Average
Ozone Concentrations.
5,410,000 74
Vehicle Miles Traveled (annual)
5,400,000 73
Ozone Concntration (ppb)
5,390,000 72
5,380,000 71
5,370,000 70
5,360,000 69
5,350,000 68
5,340,000 67
2015 2017 2018
Vehicle Miles 4th high 8-hr O3 concentration
From 2010 through 2018, the VOC emitting point sources in Berrien County
showed overall downward emissions with a slight upward trend from 2016
through 2018, as shown in Chart 6. Chart 7 shows the downward trend of the
highest NOx emitting point source in Berrien County over the 2010 through
2018 period. This source emits 20 times more NOx than any other point
source of NOx in the county.
Page 14Chart 6. Emissions from VOC Point Sources in Berrien County.
500
450
400
Total VOC Emitted (tons)
350
300
250
200
150
100
50
0
2010 2011 2012 2013 2014 2015 2016 2017 2018
Chart 7. Emissions from the Top NOx Point Source in Berrien County.
800
700
Total NOx Emitted (tons)
600
500
400
300
200
100
0
2010 2011 2012 2013 2014 2015 2016 2017 2018
Charts 5 through 7 show the upward trends in VMT and the stable or slightly
decreasing emissions from point sources leading up to and including
attainment years.
In addition, looking at the employment data from the attainment years of 2017
and 2018, there does not seem to be a correlation between high ozone and
high or low economic activity. Data from the BLS Quarterly Census of
Employment and Wages was used for this analysis and can be found on their
Website at www.bls.gov/cew/.
Page 15Chart 8. Berrien County Employment Data vs. 4th High 8-Hour Average
Ozone Concentration.
63000 100
90
62000
Number of People Employed
Ozone Concentration (ppb)
80
61000 70
60
60000
50
59000
40
58000 30
20
57000
10
56000 0
2010 2011 2012 2013 2014 2015 2016 2017 2018
Annual Berrien County Employment
4th High 8-hr Ozone
Linear (Annual Berrien County Employment)
Linear (4th High 8-hr Ozone)
For instance, Chart 8 shows from 2016 to 2017, employment in Berrien
County increased while ozone measurements decreased. The inverse
occurred from 2017 to 2018 with employment slightly falling but ozone
measurements increasing.
Together, the VMT, point source emissions, and employment data
demonstrate that temporary adverse economic conditions were not a driving
force of the ozone production in Berrien County from 2017 through 2019.
c. Permanent and Enforceable Conditions
Permanent and enforceable reductions of VOC and NOx emissions have
contributed to the attainment of the 2015 ozone NAAQS in Berrien County
through the following measures:
1. Tier II Emission Standards for Vehicles and Gasoline Sulfur Standards
with Vehicle Turnover
In February 2000, the USEPA finalized a federal rule to significantly
reduce emissions from cars and light-duty trucks. Automakers were
required to sell cleaner cars and refineries were required to produce
cleaner, lower sulfur gasoline. This rule was phased in between 2004 and
2009. The USEPA estimated a 77 percent reduction in NOx from
passenger cars; 86 percent reduction for smaller sport utility vehicles
(SUVs), light-duty trucks, and minivans; and 65 to 95 percent reduction for
larger SUVs, vans, and heavy-duty trucks. The USEPA also estimated
VOC reductions of 12 percent for passenger cars; 18 percent for smaller
Page 16SUVs, light-duty trucks, and minivans; and 15 percent for larger SUVs,
vans, and heavy-duty trucks.
Table 3 demonstrates that emissions from onroad vehicles in Berrien
County have declined since 2014, due in part to the Tier II standards and
vehicle turnover. More information on the methodology used to determine
the emissions in Table 3 is located in the MDOT Analysis (Attachment A).
Table 3. Berrien County Onroad Vehicle Emissions.
VOC Emissions NOx Emissions
Analysis Year
(tons/day) (tons/day)
2014 4.81 9.01
2017 3.50 5.94
The MDOT Analysis projects continued vehicle turnover in Berrien County
through 2030. This means Berrien County will continue to see emission
reductions based on the Tier II standards.
2. Category 3 Marine Diesel Engine Standards
The USEPA finalized emissions standards for category 3 marine diesel
engines, effective June 2010. These standards require more stringent
exhaust standards for new large marine diesel engines with per-cylinder
displacement at or above 30 liters. The standards apply in two stages:
near-term standards from newly built engines, which took effect in 2011,
and long-term standards requiring an 80 percent reduction in NOx
emissions that began in 2016.
Berrien County borders Lake Michigan (Figure 1). Shipping traffic around
Lake Michigan indirectly impacts the formation of ozone within the county,
therefore, reductions in those emissions help reduce ozone
concentrations. According to 2016v1, Berrien County achieved an 8-ton
per year NOx reduction and a 1-ton per year VOC reduction between
2016 and 2018 attributed to these standards.
3. Emissions Standards for Locomotive and Marine Compression-Ignition
Engines
In 2008, the USEPA published regulations for a comprehensive program
to dramatically reduce pollution from locomotives and marine diesel
engines. The controls apply to all types of locomotives, including line-haul,
switch, and passenger, and all types of marine diesel engines below
30 liters per cylinder displacement, including commercial and recreational,
propulsion, and auxiliary. The near-term emission standards for newly built
engines phase-in started in 2009. The near-term program also includes
new emission limits for existing locomotives and marine diesel engines
that apply when they are remanufactured and take effect as soon as
certified remanufacture systems are available. The long-term emissions
Page 17standards for newly built locomotives and marine diesel engines began in
2015 for locomotives and in 2014 for marine diesel engines.
As stated above, Berrien County is situated on the shores of Lake
Michigan, so it benefits from any reductions in marine emissions. The
county also contains a heavily used rail line, including the Amtrak
passenger line connecting Michigan to Chicago (Figure 2). Therefore, it
also benefits from reductions in rail emissions. Between 2016 and 2018,
the rail component of the 2016v1 shows a 10-ton per year NOx reduction
and 1-ton per year VOC reduction for Berrien County.
4. Consumer Products Rules
In 2007, Michigan adopted MAPCR 336.1660. This rule reduces VOC
emissions by regulating the VOC content of consumer products sold,
supplied, offered for sale, or manufactured for use in the state of Michigan.
This rule adopts by reference a model rule developed by the Ozone
Transport Commission. The rule establishes VOC content limitations in
products such as sprays, paints, aerosols, waxes, varnishes, and other
consumer-oriented products, thereby reducing overall VOC emissions
throughout the state.
5. Diesel Emissions Reduction Act (DERA) Grants
EGLE administers the USEPA DERA grant program. This program
provides grants to replace older diesel vehicles with more efficient, cleaner
vehicles. Vehicles eligible for replacement include school buses, class 5
through 8 heavy-duty highway vehicles, locomotive engines, marine
engines, and certain nonroad engines, equipment or vehicles. The
program helps reduce NOx emissions through increased vehicle turnover
and promoting cleaner energy vehicles.
6. Area Source Boilers, Major Source Boilers, and Commercial and Industrial
Solid Waste Incinerator (CISWI) National Emission Standards for
Hazardous Air Pollutants
In 2013 the USEPA finalized revisions to the emission standards for large
boilers, small boilers, and incinerators. These standards cover more than
200,000 boilers and incinerators nationwide. Large boilers are located at
industrial facilities. Small boilers are located at universities, hospitals,
hotels, and commercial buildings. A CISWI unit is an incinerator that burns
solid waste at a commercial or industrial facility.
In a separate action, the USEPA revised the non-hazardous secondary
materials rule. This rule helps determine which standard applies (boiler or
CISWI) to a unit that burns material that is not solid waste. These
combined rules will lead to additional NOx and VOC reductions. The
compliance deadlines for area boilers, major boilers, and CISWI units was
2014, 2016, and 2018, respectively.
Page 184. Section 175A Maintenance Plan
CAA Section 107(d)(3)(E) requires a fully approved Section 175A maintenance
plan for a redesignation to attainment. Section 175A of the CAA, and the USEPA
Guidance, contains the following requirements for maintenance plans with which
EGLE demonstrates compliance. According to the USEPA Guidance, a State
may submit both the redesignation request and the maintenance plan at the
same time. EGLE submits the following maintenance plan for approval for
Berrien County.
a. Maintenance for 10 Years
Section 175A(a) requires the maintenance plan must provide for
maintenance of the NAAQS for at least 10 years after the redesignation.
The USEPA Guidance states that “the State should project emissions for
the 10-year period following redesignation...for the purpose of showing
that emissions will not increase over the attainment inventory.... The
projected inventory should consider future growth, including population
and industry, should be consistent with the attainment inventory, and
should document data inputs and assumptions.”
Tables 4 and 5 below demonstrate Berrien County’s maintenance of the
2015 ozone NAAQS through continued decreasing emissions across
emissions inventory sectors through 2030. The onroad emissions were
derived from the MDOT Analysis (Attachment A). The inputs and
assumptions for those projections are detailed in that analysis and are
based on July weekday emissions. The nonroad, nonpoint, and point
emissions were derived using the EGLE Emissions Analysis in
Attachment D utilizing the USEPA 2016v1 projections based on annual
emissions.
Projected Maintenance Emissions
Table 4. Berrien County NOx Emissions Inventory Projections (tons/day).
Emission Sectors 2017 2023 2030
Onroad 5.94 3.15 1.85
Nonroad 0.97 0.72 0.59
Point 1.53 2.24 2.23
Nonpoint 1.62 1.58 1.54
Total NOx 10.06 7.69 6.21
Emissions
Page 19Table 5. Berrien County VOC Emissions Inventory Projections (tons/day).
Emission Sectors 2017 2023 2030
Onroad 3.50 2.24 1.57
Nonroad 1.22 0.96 0.88
Point 1.03 1.08 1.06
Nonpoint 6.61 6.52 6.35
Total VOC 12.36 10.8 9.86
Emissions
b. Monitoring Network Commitment
The USEPA Guidance states that “[t]he maintenance plan should contain
provisions for continued operation of air quality monitors that will provide”
verification of the NAAQS.
EGLE commits to continued operation of the Coloma air monitor in
accordance with 40 CFR Part 58 for the duration of the maintenance
period.
c. Second Maintenance Plan and Nonattainment Requirements
Section 175A(b) requires the State of Michigan to submit an additional
10-year maintenance plan 8 years after the redesignation is approved.
EGLE commits to submit a revised maintenance plan as required under
this section.
Section 175A(c) states that the nonattainment requirements still apply until
the area is redesignated and the maintenance plan is approved.
d. Verification of Continued Attainment
The USEPA Guidance recommends that “the State submittal should
indicate how the State will track the progress of the maintenance plan.”
EGLE will continue to track ozone levels through the operation of a
USEPA-approved monitoring network as necessary to demonstrate
ongoing compliance with the 2015 ozone NAAQS. EGLE will consult with
the USEPA prior to making changes to the existing monitoring network,
should changes become necessary in the future. EGLE will continue to
quality-assure the monitoring data to meet the requirements of 40 CFR
Part 58 and all other federal requirements. EGLE will enter all data into the
AQS on a timely basis in accordance with federal guidelines.
EGLE will continue to produce periodic emission inventories as required
by 40 CFR Part 51, to track levels of emissions in the future.
Page 20e. Contingency Provisions
1. Requirement to Maintain Measures in the SIP
Section 175A states that contingency provisions “shall include a
requirement that the State will implement all measures with respect to
the control of the air pollutant concerned which were contained in the
[SIP] for the area before redesignation....”
EGLE commits to maintaining the control measures for VOC and NOx
emissions that were contained in the SIP before redesignation of this
area to attainment.
2. Measures to Promptly Correct Any Violation
Section 175A(d) requires each maintenance plan to contain
contingency provisions “to assure that the State will promptly correct
any violation of the standard which occurs after the redesignation of
the area as an attainment area.” The USEPA Guidance states that “the
State should also identify specific ... triggers, which will be used to
determine when the contingency measures need to be implemented.”
The USEPA Guidance also states that “[t]he plan should clearly
identify ... a schedule and procedure for adoption and implementation,
and a specific time limit for action by the State.”
Michigan commits to adopt and expeditiously implement necessary
corrective actions in the following circumstances:
Warning Level Response:
A warning level response shall be prompted whenever an annual
(1-year) 4th high, 8-hour average, monitored value of 74 ppb or greater
occurs in a single ozone season within the maintenance area. A
warning level response will consist of a study to determine whether the
ozone value indicates a trend toward a higher ozone value or whether
emissions appear to be increasing. The study will evaluate whether the
trend, if any, is likely to continue and, if so, the control measures
necessary to reverse the trend taking into consideration ease and
timing for implementation. Implementation of necessary controls in
response to a warning level response trigger will take place as
expeditiously as possible, but in no event later than 12 months from
the conclusion of the most recent ozone season.
Should it be determined through the warning level study that action is
necessary to reverse the noted trend, the procedures for control
selection and implementation outlined under “Action Level Response”
(below) shall be followed.
Page 21Action Level Response:
An action level response shall be prompted whenever a 4th high
8-hour average, monitored value, averaged over two years, of 71 ppb
or greater occurs within the maintenance area. A violation of the
NAAQS (4th high 8-hour average, averaged over three years, with a
value of 71 ppb or greater) shall also prompt an action level response.
In the event the action level is triggered and is not found to be due to
an exceptional event, malfunction, or noncompliance with a permit
condition or rule requirement, EGLE and MDOT, in consultation with
the metropolitan planning organizations or regional council of
governments, will determine additional control measures needed to
assure future attainment of the 2015 ozone NAAQS. In this case,
measures that can be implemented in a short time will be selected to
be in place within 18 months from the close of the ozone season that
prompted the action level. EGLE will also consider the timing of an
action level trigger and determine if additional, significant new
regulations not currently included as part of the maintenance
provisions will be implemented in a timely manner and will constitute
the response.
3. Adoption of Contingency Measures
The USEPA Guidance states that “[t]he plan should clearly identify the
measures to be adopted, a schedule and procedure for adoption and
implementation, and a specific time limit for action by the State.”
Michigan commits to the following control measure options, selection,
and implementation:
Control Measure Selection and Implementation:
Adoption of any additional control measures is subject to the
necessary administrative and legal process. If a new measure is
already promulgated and scheduled to be implemented at the federal
or state level, and that measure is determined to be sufficient to
address the upward trend in air quality, additional local measures may
not be necessary. Michigan will submit to the USEPA an analysis to
demonstrate the proposed measures are adequate to return the area
to attainment.
Control Measure Options:
Michigan may select one of the following control measures, if
necessary, to address an upward trend in air quality:
1. Adopt VOC or NOx Reasonable Available Control Technology on
existing sources.
2. Apply VOC Reasonable Available Control Technology to smaller
existing sources.
Page 223. Alternative fuel and diesel retrofit programs for fleet vehicle
operations.
4. Require VOC or NOx control on new minor sources (less than
100 tons per year).
5. Reduced idling programs.
6. Trip reduction programs.
7. Traffic flow and transit improvements.
5. Section 110 and Part D Conformity
CAA Section 107(d)(3)(E) requires a determination that all Section 110 and
Part D requirements have been met for an area to be redesignated to attainment.
The USEPA Guidance suggests the Section 110 requirements listed in
Section 107(d)(3)(E) pertain only to Section 110(a)(2). Section 110(a)(2) lists the
infrastructure SIP requirements. Part D lists the general requirements for
nonattainment areas. These requirements, except the Part D CAA Section 176
requirements, are already addressed in Section 2 above.
a. Conformity Requirements
The USEPA Guidance states the State must “show that its SIP provisions are
consistent with section 176(c)(4) conformity requirements. The redesignation
request should include conformity procedures if the State already has these
procedures in place.”
Section 176(c) of the CAA requires states to establish criteria and procedures
to ensure federally supported or funded activities, including highway projects,
conform to the air quality planning goals in the applicable SIPs. The two types
of conformity requirements and Michigan’s demonstration of compliance with
them are listed below.
1. Transportation Conformity Requirements and Motor Vehicle Emission
Budgets
Transportation conformity under Section 176(c) is the requirement to
determine conformity for transportation plans, programs, and projects
developed, funded, or approved under Title 23 of the United States Code
and the Federal Transit Act. Conformity to a SIP means transportation
activities will not produce new air quality violations, worsen existing
violations, or delay timely attainment of the NAAQS.
Michigan’s transportation conformity SIP was approved by the USEPA on
December 18, 1996 (61 FR 66609), and was updated on April 20, 2017
(82 FR 17134). In addition, EGLE has a Memorandum of Agreement
(MOA) among MDOT, the USEPA, and the various state and local
agencies involved in the transportation process. The 2016 MOA Regarding
Determination of Conformity of Transportation Plans, Programs, and
Projects to State Implementation Plans was signed on December 13, 2016,
by the USEPA and is available on the AQD Webpage at
Page 23https://www.michigan.gov/documents/egle/egle-aqd-sdu-
transportation_conformity_moa_671525_7.pdf.
Estimates of onroad motor vehicle emissions are projected for the
maintenance period (see Section 4 above) to assess emission trends and
to ensure continued compliance with the 2015 ozone NAAQS. Onroad
emissions include those from cars, buses, and trucks driven on public
roadways. These estimates are considered a ceiling or “budget” for
emissions and are used to determine whether transportation plans and
projects conform to the SIP. Estimated onroad mobile emissions of VOCs
and NOx must not exceed the emission budgets contained in the
maintenance plan.
A safety margin is utilized to account for potential variation of forecast
models used to project emissions for the maintenance period. A safety
margin, as defined by the conformity rule, looks at the total emissions from
all sources in the nonattainment area. States can apply a percentage of
that safety margin to the mobile source categories when creating motor
vehicle emission budgets.
Tables 6 and 7 list the 2017 emissions from all sectors along with the
projected emissions (from Tables 4 and 5) for 2023 and 2030. Tables 6
and 7 also show the projected decrease in emissions from 2023 to 2017
and from 2030 to 2017. A percentage of the projected decrease
(75 percent) is then used to calculate the safety margin for the onroad
sector for Berrien County (Table 8).
EGLE chose to use 75 percent of the safety margin to create the motor
vehicle emission budget. This percentage was chosen because it allowed
for a projected emission decrease that would produce both lower onroad
emissions and lower overall emissions for the maintenance period. Table 8
details the final Motor Vehicle Budget for the maintenance period for
Berrien County.
Table 6. Projected NOx Emission Reductions for Berrien County
(tons/day).
Projected Projected
2023 2023 2030 2030
2017 Projected Emission Projected Emission
Emissions Emissions Decrease Emissions Decrease
Onroad 5.94 3.15 -- 1.85 --
Nonroad 0.97 0.72 -- 0.59 --
Point 1.53 2.24 -- 2.23 --
Nonpoint 1.62 1.58 -- 1.54 --
Total 10.06 7.69 2.37 6.21 3.85
Page 24Table 7. Projected VOC Emission Reductions for Berrien County
(tons/day).
Projected Projected
2023 2023 2030 2030
2017 Projected Emission Projected Emission
Emissions Emissions Decrease Emissions Decrease
Onroad 3.50 2.24 -- 1.57 --
Nonroad 1.22 0.96 -- 0.88 --
Point 1.03 1.08 -- 1.06 --
Nonpoint 6.61 6.52 -- 6.35 --
Total 12.36 10.80 1.56 9.86 2.50
Table 8. Motor Vehicle Emissions Budget for Berrien County (tons/day).
2023 2030
Estimated 75% 2023 Estimated 75% 2030
Onroad Safety Total Onroad Safety Total
Emissions Margin MVEB Emissions Margin MVEB
NOx 3.15 1.78 4.93 1.85 2.89 4.74
VOC 2.24 1.17 3.41 1.57 1.87 3.44
2. General Conformity Requirements
General conformity under Section 176(c) also requires conformity for all
other non-transportation, federally supported or funded projects.
Michigan’s general conformity SIP was approved by the USEPA on
December 18, 1996 (61 FR 66607).
Title 40, Code of Federal Regulations, Part 51, Appendix V Requirements
40 CFR Part 51, Appendix V, contains requirements EGLE must follow to revise the
SIP. The applicable requirements and the EGLE’s fulfillment of them are as follows:
1. A Formal Request
Appendix V requires all SIP submittals contain a formal letter of submittal from the
governor or the governor’s designee requesting the USEPA approval of the SIP
revision.
A letter dated July 3, 2019, from Governor Gretchen Whitmer to the USEPA,
Region 5, delegates authority from the Governor to EGLE’s Director to make any
SIP submittal, request, or application under the CAA. This letter was submitted to
the USEPA on July 30, 2019, for inclusion in the Michigan SIP, and is available upon
request. This delegation of authority and the cover letter included with this SIP
submittal to the USEPA satisfies the formal request requirement.
2. Necessary Legal Authority
Appendix V requires states submit evidence the State has the necessary legal
authority under state law to adopt and implement the requested SIP revision.
Page 25Part 55, Air Pollution Control, of the Natural Resources and Environmental
Protection Act, 1994 Public Act 451, as amended, and Executive Reorganization
Order 2011-1 provide EGLE with the legal authority under state law to implement
and enforce the provisions of the Michigan SIP. A copy has been submitted to the
USEPA through previous SIP submittals and is available upon request.
3. Sufficient Public Notice
Appendix V requires the State of Michigan to submit evidence that public notice was
given of the proposed change consistent with procedures approved by the USEPA,
including the date of publication of such notice.
The notice of this SIP revision and an opportunity for public comment and hearing is
provided in Attachment E.
4. Valid Public Hearing
Appendix V requires the State submit a certification that a public hearing, if held,
was held in accordance with the information provided in the public notice and the
State’s Administrative Procedures Act.
According to the public notice in Attachment E, EGLE provided an opportunity for a
public hearing upon request. As stated in the public notice, requests for a public
hearing needed to be submitted to the AQD by January 15, 2020. By January 16,
2020, the AQD had not received any request for public hearing, therefore, no
hearing was held. As stated in the public notice, the AQD posted on the AQD
Website on January 16, 2020, that no hearing would be held as no hearing was
requested.
5. Public Comments
Appendix V requires the State to compile any public comments and the State’s
responses to them in the SIP submittal.
The AQD did not receive any public comments on this SIP submittal. This is noted in
Attachment E.
Page 26Conclusion
The Berrien County ozone nonattainment area has attained the 2015 ozone NAAQS
and complied with the applicable provisions of the 1990 Amendments to the CAA
regarding redesignations of ozone nonattainment areas. Documentation to that effect is
contained herein. EGLE has prepared a redesignation request and maintenance plan
that meets the requirements of Section 110(a)(1) of the 1990 CAA.
Based on this document, the Berrien County ozone nonattainment area meets the
requirements for redesignation under the CAA and the USEPA Guidance. Michigan has
performed an analysis demonstrating the air quality improvements are due to
permanent and enforceable measures. The State of Michigan hereby requests the
Berrien County ozone nonattainment area be redesignated to attainment,
simultaneously with the USEPA’s approval of the maintenance plan provisions
contained herein. In addition, EGLE requests the USEPA’s approval that this
maintenance plan satisfies the requirements of CAA Section 175A(b), for subsequent
plan revisions required for areas redesignated for the 2015 ozone NAAQS.
Page 27ATTACHMENT A
Air Quality Redesignation
                                   Onroad Emissions
                                           For
                               Berrien County, Michigan
                                  Nonattainment Area

                                     October 11, 2019

Prepared by:
Michigan Department of Transportation
Statewide and Urban Travel Analysis Section
Van Wagoner Transportation Building
Lansing, MI 48909
WittlD@Michigan.gov
517-335-4620

                                              1
Table of Contents
Table of Contents
1.0 Introduction .................................................................................................................................... 4
2.0 Geographic Area ............................................................................................................................. 4
3.0 Attainment Status........................................................................................................................... 4
4.0 Analysis ........................................................................................................................................... 5
4.1 Analysis Years .............................................................................................................................. 5
4.2 Transportation Modeling ............................................................................................................ 5
4.2.1 Development of Vehicle Miles of Travel for Years 2017, 2023, and 2030. .......................... 5
4.2.2 Travel Demand Forecasting Models ..................................................................................... 6
4.2.3 TwinCATS Model................................................................................................................... 6
4.2.4 Niles/South Bend Regional Model ....................................................................................... 7
4.2.5 Statewide Model .................................................................................................................. 7
4.2.6 Coding Travel Demand Model Links for NFC by Urban and Rural ....................................... 7
4.2.7 Highway Performance Monitoring System (HPMS) ............................................................. 7
4.2.8 Development of Vehicle Miles of Travel for Year 2014 ....................................................... 7
4.2.9 Model Networks ................................................................................................................... 8
5.0 Emission Modeling.......................................................................................................................... 8
5.1 MOVES Specifications ................................................................................................................. 8
5.2 Road Type Distribution ............................................................................................................... 8
5.3 Average Speed ............................................................................................................................ 8
5.4 Ramp Fraction ............................................................................................................................. 8
5.5 Average Weekday VMT to Annual VMT ..................................................................................... 8
5.6 Vehicle Population ...................................................................................................................... 8
5.6.1 Vehicle Population Years 2017, 2023, and 2030 .................................................................. 8
5.6.2 Vehicle Population Year 2014 .............................................................................................. 9
5.7 Vehicle Age Distribution............................................................................................................ 10
5.7.1 Analysis Years 2017, 2023, and 2030 ................................................................................. 10
5.7.2 Analysis Year 2014: ............................................................................................................. 10
5.8 Other Local Data ....................................................................................................................... 10
6.0 Results of Analysis ........................................................................................................................ 10
2You can also read