Albuquerque Public Schools
Tribal Education Status Report:
                    2019-2020
←
→
Page content transcription
If your browser does not render page correctly, please read the page content below
Albuquerque Public Schools
Tribal Education Status Report:
2019-2020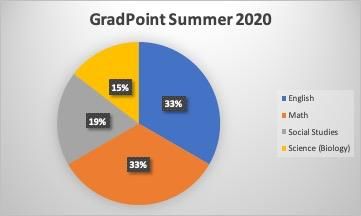
ALBUQUERQUE PUBLIC SCHOOLS – INDIAN EDUCATION DEPARTMENT

             ALBUQUERQUE PUBLIC SCHOOLS 2019-2020
                  TRIBAL EDUCATION STATUS REPORT

                                  Board of Education
                     District 7, Dr. David E. Peercy, Board President
           District 3, Lorenzo L. Garcia, Board Vice President, Audit Committee
                  District 1, Yolanda Montoya-Cordova, Board Secretary
                   District 2, Peggy Muller-Aragon, Finance Committee
             District 4, Barbara Petersen, Policy and Instruction Committee
        District 5, Candelaria Patterson, District Equity and Inclusion Committee
         District 6, Elizabeth Armijo, Capital Outlay, Property & Tech. Committee

                        Superintendent (July 2019-June 2020)
                                      Rachel Reedy

                     Interim Superintendent (July 2020-Current)
                                       Scott Elder

                                      Submitted by
                                   Dr. Daisy Thompson
             Senior Director of Albuquerque Public Schools Indian Education

                                     September 2020
                                                                                    Page 1

Tribal Education Status Report: 2019-2020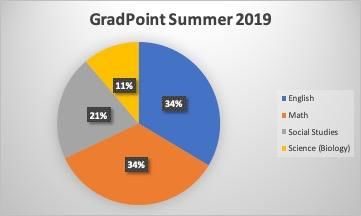
ALBUQUERQUE PUBLIC SCHOOLS – INDIAN EDUCATION DEPARTMENT

                                 ACKNOWLEDGMENTS

Acknowledgments to the following departments and staff who made this report possible:

Brenda Martinez-Papponi, Ph.D., Research & Analysis Manager, for her expert assistance
with data and editing. She completed sections 1-4 of the document. The completion of this
document would have been difficult and impossible without Dr. Martinez-Papponi’s help.

Charlene Lippert, Budget Analyst, for her annual assistance to Indian Education with fiscal
matters and updates.

                                                                                              Page 2

Tribal Education Status Report: 2019-2020
ALBUQUERQUE PUBLIC SCHOOLS – INDIAN EDUCATION DEPARTMENT
TABLE OF CONTENTS
1: STUDENT ACHIEVEMENT ..................................................................................................................................................... 8
2: SCHOOL SAFETY ................................................................................................................................................................... 23
3: GRADUATION RATE ............................................................................................................................................................. 27
4: ATTENDANCE ........................................................................................................................................................................ 34
5: PARENT AND COMMUNITY INVOLVEMENT ..................................................................................................................... 37
6: EDUCATIONAL PROGRAMS TARGETING TRIBAL STUDENTS ...................................................................................... 39
7: FINANCIAL REPORTS ........................................................................................................................................................... 41
8: CURRENT STATUS OF FEDERAL INDIAN EDUCATION POLICIES & PROCEDURES ............................................... 444
9: SCHOOL DISTRICT INITIATIVES TO DECREASE THE NUMBER OF STUDENT DROPOUTS AND INCREASE
ATTENDANCE ................................................................................................................................................................. 466
10: PUBLIC SCHOOL USE AND VARIABLE SCHOOL CALENDARS .................................................................................... 50
11: SCHOOL DISTRICT CONSULTATIONS WITH DISTRICT INDIAN EDUCATION COMMITTEES, SCHOOL-SITE
PARENT ADVISORY COUNCILS, TRIBAL, MUNICIPAL AND INDIAN ORGANIZATION ......................................... 52
12: INDIGENOUS RESEARCH AND EVALUATION MEASURES AND RESULTS FOR EFFECTIVE CURRICULA FOR
TRIBAL STUDENTS .......................................................................................................................................................... 55
Page 3
Tribal Education Status Report: 2019-2020ALBUQUERQUE PUBLIC SCHOOLS – INDIAN EDUCATION DEPARTMENT
TRIBAL EDUCATION STATUS REPORT
In compliance with the Indian Education Act Article 23A Indian Education, NMSA Section
22-23A-7 Report and IEA Rulemaking (Title 6, Chapter 25 Part 2.11), the purpose of the
Tribal Education Status Report (TESR) is to inform stakeholders of the Public Education
Department’s (PED) current initiatives specific to American Indian students and their
academic progress.
PROFILE OF INDIAN EDUCATION IN ALBUQUERQUE PUBLIC SCHOOLS
During the 2019-2020 school year, Albuquerque Public Schools (APS) included:
• 140 Traditional Schools:
o 88 Elementary Schools (K-5),
o 4 K-8 Schools,
o 28 Middle Schools (6-8),
o 20 High Schools (9-12)
o 31 APS Charter Schools
• 69.3% of students participated in the Free/Reduced Price Lunch Program
• 17.4% of students had current English Learner status
• 19.6% Students with Disabilities and 5.2% of students participated in the Gifted
program
• Staff was made up of 1.6% American Indian/Alaskan Native, 2.1% Asian, 2.5%
African American, 40.5% Hispanic, and 53.3% Caucasian.
During the 2019-2020 school year, Albuquerque Public Schools’ 80th day enrollment (not
including charters) was 79,707 students in grades Pre-Kindergarten through 12th grade.
The enrollment count for those whose primary race is non-Hispanic, American
Indian/Alaskan Native was 4,515 students (5.7% of the total student population; see
Figure 1). The enrollment count, which includes all students identified as American
Indian/Alaskan Native, including those who also indicate Hispanic ethnicity, was
6,627. The Indian Education Department at APS serves all students who identify as
AI/AN.
Page 4
Tribal Education Status Report: 2019-2020ALBUQUERQUE PUBLIC SCHOOLS – INDIAN EDUCATION DEPARTMENT
70%
65.5%
60%
50%
40%
30% 22.4%
20%
5.7%
5.4%
10% 5.2% 2.7% 3.6% 0.2%
0%
American Asian Black/African Hispanic Native Hawaiian or White/Caucasian
Indian/Alaskan American Other Pacific
Native Islander
2017-2018 2018-2019 2019-2020
FIGURE 1. 80th day student enrollment based on primary race for the last three school years
See APS Strategic Analysis & Program Research’s Public Visualizations (“Enrollment and
Demographic Information” and “Staff Demographics and Experience”) at http://www.aps.edu/sapr
for more information.)
The 2019-2020 80th day enrollment count of all students who identified a tribal affiliation,
including those who also indicate Hispanic ethnicity, was 7,455 students. The New Mexico
Tribes represented at Albuquerque Public Schools were as follows:
NM Tribe Name 2019-2020 SY
Acoma 2.2%
Cochiti 0.6%
Isleta 1.7%
Jemez 1.3%
Jicarilla Apache 1.1%
Kewa (Santo Domingo) 1.7%
Laguna 4.5%
Mescalero Apache 0.4%
Nambe 0.3%
Navajo 47.8%
Ohkay Owingeh (San Juan) 0.4%
Picuris 0.1%
Page 5
Tribal Education Status Report: 2019-2020ALBUQUERQUE PUBLIC SCHOOLS – INDIAN EDUCATION DEPARTMENT
Pojoaque 0.1%
San Felipe 1.0%
San Ildefonso 0.1%
Sandia 0.3%
Santa Ana 0.2%
Santa Clara 0.3%
Taos 0.4%
Tesuque 0.1%
Zia 0.2%
Zuni 4.4%
Other 30.8%
Page 6
Tribal Education Status Report: 2019-2020ALBUQUERQUE PUBLIC SCHOOLS – INDIAN EDUCATION DEPARTMENT
STATUTORY REQUIREMENTS
This section describes the laws and rules that apply to the Tribal Education Status Report
in relevant part as follows:
A. The Indian Education Division, in collaboration with the education division of the
federal Bureau of Indian Affairs and other entities that serve tribal students, shall
submit an annual statewide tribal education status report no later than November
15 to all New Mexico tribes. The division shall submit the report whether or not
entities outside state government collaborate as requested.
B. A school district with tribal lands located within its boundaries shall provide a
districtwide tribal education status report to all New Mexico tribes represented
within the school district boundaries.
C. These status reports shall be written in a brief format and shall include information
regarding public school performance, how it is measured, and how it is reported to
the tribes and disseminated at the semiannual government-to-government
meetings. The status report generally includes information regarding the following:
1. student achievement as measured by a statewide test approved by the
department, with results disaggregated by ethnicity;
2. school safety;
3. graduation rates;
4. attendance;
5. parent and community involvement;
6. educational programs targeting tribal students;
7. financial reports;
8. current status of federal Indian education policies and procedures;
9. school district initiatives to decrease the number of student dropouts and
increase attendance;
10. public school use of variable school calendars;
11. school district consultations with district Indian education committees,
school-site parent advisory councils and tribal, municipal, and Indian
organizations; and
12. Indigenous research and evaluation measures and results for effective
curricula for tribal students.
Page 7
Tribal Education Status Report: 2019-2020ALBUQUERQUE PUBLIC SCHOOLS – INDIAN EDUCATION DEPARTMENT
DETAILED REPORT
1: STUDENT ACHIEVEMENT
OBJECTIVE
Indian Education Department’s (IED) objective is to ensure that student achievement in
New Mexico public schools is measured by statewide tests that are approved by the PED,
and results are disaggregated by ethnicity, gender, economic status, and disabilities. In
turn, these results are used to develop strategies and programs that increase student
achievement and reduce the achievement gap.
BACKGROUND
The New Mexico assessments include the evaluation of student progress in the following
areas: reading K–2; English language arts 3–11; math 3–11, which includes Algebra I
(may be given in grade 8), Algebra II, Geometry, Integrated Math I, Integrated Math II,
Integrated Math III; science, Spanish reading, reading for students with disabilities, math
for students with disabilities, and science for students with disabilities.
METHODS
Assessment data for the 2019-2020 school year is not available; this report included data
from the 2018-2019 school year. During SY 2018–2019, students in grades K–2 were
tested in reading using the Istation assessment, and students in grades 3–11 were tested
using New Mexico assessments that include; the Transition Assessment in Math and
English Language Arts (TAMELA), the Partnership for Assessment of Readiness for
College and Careers (PARCC) ELA and math, standard-based assessment (SBA LEGACY)
Spanish reading, SBA science, New Mexico Alternative Performance Assessment (NMAPA)
reading, math, and science. During the 2018-2019 school year, New Mexico began using
the TAMELA, replacing PARCC as the state assessment. Also, during the 2018-2019 school
year, Istation was restructured from 3 levels of performance to 5 levels in an attempt to
align with other state assessments. These two assessment adjustments may have caused
changes to overall proficiency rates. As a rule, proficiencies for groups with fewer than
10 students are masked; they are not reported because the number is too small to
determine statistical significance, and student privacy might be compromised. Testing
data is reported as the percentage of students who meet the cut-off point for proficiency,
as defined for the 2018–19 school year. All assessment scores have been standardized to
reflect proficiencies—from non-proficient to at proficient and above proficient.
Source: New Mexico Public Education Department, Student Teacher Accountability Reporting System
(STARS) 120th day snapshot files; PED Student Assessment files
(https://webnew.ped.state.nm.us/bureaus/accountability/achievement-data/); New Mexico Public
Education Department Indian Education Division Student Assessment files; and Strategic Analysis & Program
Research public visualization files (http://www.aps.edu/sapr)
Page 8
Tribal Education Status Report: 2019-2020ALBUQUERQUE PUBLIC SCHOOLS – INDIAN EDUCATION DEPARTMENT
RESULTS
The first several graphs in this section show the districtwide percentage of students at
or above proficiency by race/ethnicity as measured by the New Mexico assessments.
The overall results in student achievement are based on all 2019 test results. The last
graphs in this section looked at districtwide enrollment in gifted and advanced
placement programs and overall results from the ACT and SAT.
The key findings are:
• Generally, the districtwide proficiency rates for reading and math have decreased
during the 2018-2019 school year compared to the previous two school years.
• American Indian/Alaskan Native (AI/AN) students showed no significant
changes in math and science proficiency rates over the last three school years.
Reading proficiency rates declined since the previous school year.
• Overall, percent proficient in reading for K-2nd grade AI/AN students, just as with
all K-2nd grade students in the district, decreased in the 2018-2019 school year1;
however, Grades 5 and 6 had gains with proficiency rates which were both up 3
percentage points from the previous year.
• AI/AN students’ math proficiency rates for Grades 9 and10 were decreased 5 and
4 percentage points from the previous school year.
• Science for AI/AN students in 4th grade and 7th grade improved compared to the
2017-2018 school year; 11th grades showed a drop in percent proficient during
the 2018-2019 school year.
• Reading scores of AI/AN students identified as non-economically disadvantaged
were 19 percentage points higher than economically disadvantaged AI/AN
students; 16 percentage points higher in math; and 15 percentage points higher
in science.
• There are performance gaps between male and female AI/AN students. While
AI/AN female students are outperforming AI/AN males in reading by about 9
percentage points, their male counterparts outperform them by about 2
percentage points in science. Both genders perform nearly equally in math,
although males are slightly more proficient than their female counterparts.
• AI/AN students tend to be underrepresented in the gifted program. A lower
proportion of AI/AN students are in the gifted program than in previous school
years. However, the proportion of AI/AN students enrolled in the district has
increased from previous school years.
• During the 2018-2019 school year, 331 AI/AN students were enrolled in
Advanced Placement courses, accounting for 2.9% of total AP course enrollment.
• The average ACT score for AI/AN students in 2018-2019 was 18.6, lower than
the district average, but slightly higher than the average score of AI/AN in 2017-
2018.
1
The decrease in proficiency rates for K-2nd grade reading is most likely due to the changes made to the
performance levels in the Istation assessment, rather than significant declines in proficiency.
Page 9
Tribal Education Status Report: 2019-2020ALBUQUERQUE PUBLIC SCHOOLS – INDIAN EDUCATION DEPARTMENT
CONCLUSION
During the 2018-2019 school year, the state assessment changed from PARCC to
TAMELA. Overall, the districtwide proficiency rates for reading, math, and science have
decreased during the 2018-2019 school year compared to the previous two school
years. AI/AN students also showed a small decrease in reading, math, and science
proficiency rates. Generally, AI/AN students are less proficient than their counterparts
in reading, math, and science. However, when we consider AI/AN students, who are not
identified as economically disadvantaged, proficiency rates are greatly improved. More
AI/AN students are identified as economically disadvantaged then non-economically
disadvantaged. Poverty is related to low academic progress, among other outcomes.
Increased research on the correlation between poverty among AI/AN and educational
progress and outcomes is essential.
ACTION PLAN
Improving and increasing school and early intervention programs will reduce some of
the risk factors for AI/AN students. If there were increased resource teachers for the
elementary grades, there would be a positive impact for AI/AN students struggling with
reading and mathematics. Currently, there are a few elementary schools served by
resource teachers from Indian Education for intervention in both reading and
mathematics.
Page 10
Tribal Education Status Report: 2019-2020ALBUQUERQUE PUBLIC SCHOOLS – INDIAN EDUCATION DEPARTMENT
Three-Year, Districtwide Assessment Comparison
At or Above Proficient by Race/Ethnicity
Percent Proficient and Above 70%
60%
50%
40%
30%
20%
10%
0%
2016-17 2017-18 2018-19 2016-17 2017-18 2018-19 2016-17 2017-18 2018-19
Reading Reading Reading Math Math Math Science Science Science
All Students 34% 37% 31% 20% 21% 20% 39% 41% 34%
Caucasian 53% 56% 49% 38% 40% 39% 64% 65% 60%
African American 29% 31% 25% 12% 13% 13% 32% 30% 27%
Hispanic 28% 30% 25% 14% 15% 15% 31% 33% 27%
Asian 57% 59% 52% 49% 49% 44% 58% 63% 55%
American Indian 24% 26% 21% 11% 13% 12% 24% 25% 24%
Note: Proficiencies include standard-based assessment (SBA) Spanish reading; SBA science; New Mexico
Alternative Performance Assessment (NMAPA) reading, math, and science; PARCC ELA and math; TAMELA; and
Istation reading.
Percent of American Indian/Alaskan Native Students Scoring
At or Above Proficient in Assessments
Percent Proficient and Above
30%
26% 25%
24% 24% 24%
25%
21%
20%
15% 13% 12%
11%
10%
5%
0%
Reading Math Science
2016-17 2017-18 2018-19
DISTRICTWIDE ASSESSMENT BY ETHNICITY
• Overall proficiency rates in reading, math, and science decreased during the 2018-
2019 school year compared to the previous school year.
Page 11
Tribal Education Status Report: 2019-2020ALBUQUERQUE PUBLIC SCHOOLS – INDIAN EDUCATION DEPARTMENT
o Reading proficiency rates decreased by 6 percentage points since the 2017-
2018 school year and about 3 percentage points since the 2016-2017 school
year.
o Math proficiency rates have remained relatively stable for the last three
school years, dropping only 1% since the 2017-18 school year.
o Science proficiency rates decreased by 7 percentage points since the 2017-
2018 school year and about 5 percentage points since the 2016-2017 school
year.
• About 21% of AI/AN students are proficient in reading; 12% in math, and about
24% in science. The proficiency rate of AI/AN students in 2018-2019 for reading,
math, and science decreased from SY 2017-2018.
o The AI/AN percent proficient in mathematics and science have each
decreased slightly since the 2017-18 school year.
o AI/AN reading proficiency rates have decreased by 5 percentage points
since the 2017-18 school year and about 3 percentage points since the
2016-2017 school year.
• Proficiency rates for AI/AN students remain considerably lower than other
ethnicity students. Especially discrepant is their comparison with students of
Caucasian and Asian backgrounds.
o As compared to the percentage of proficient Caucasian students at 49%, less
than half of the AI/AN students are proficient readers at 21%. In math,
AI/AN students perform at 12%, which is nearly one-quarter of the
proficient percentage of Asian students at 44%. Almost one-third of AI/AN
students are proficient in science at 24%, with Caucasian students
performing at 60% proficient.
o Compared to all subgroups of students, the AI/AN students’ proficiency
performance ranks the lowest in all three subject areas of Reading, Math,
and Science.
Page 12
Tribal Education Status Report: 2019-2020ALBUQUERQUE PUBLIC SCHOOLS – INDIAN EDUCATION DEPARTMENT
2018-2019 Districtwide Assessment
Reading Proficiency by Grade
American Indian/Alaskan Native Students
50%
Percent Proficient and Above
40%
30%
20%
10%
0%
K 1st 2nd 3rd 4th 5th 6th 7th 8th 9th 10th 11th
All Students 31% 29% 36% 24% 27% 30% 26% 26% 29% 30% 39% 40%
American Indian 17% 17% 27% 15% 18% 20% 17% 16% 16% 22% 29% 33%
READING BY GRADE
Grades K to 2 proficiencies for AI/AN students was determined using the Istation
assessment that showed the following:
• About 61% of AI/AN students are proficient or above by the end of second grade.
• The highest level of reading proficiency is the 2nd grade at about 27%
• The percent proficiency is 17% in both Kindergarten and 1st grade.
Grades 3 to 11 proficiencies for AI/AN students were based on TAMELA, PARCC, SBA, and
NMAPA reading assessments, which showed the following:
• The drop in reading proficiency from the end of 2nd grade to the end of 3rd grades is
likely due to:
1. The use of the two different assessments;
2. The more rigorous assessments in 3rd grade – 11th grade;
3. The perennial reason – the climb from decoding in the primary
grades to reading for comprehension starting in the 3rd grade.
• Reading proficiency rates for most of the grade levels have decreased when
compared to the 2017-2018 school year.
o Only 5th, 6th, and 10th grades had increases in proficiency rates compared to
the previous school year.
o Grade 10 had the largest gain, with a 2% increase in proficiency from the
prior school year.
o Grade 3 had the largest loss, with the percent proficient dropping from 27%
in 2017-2018 to 24% in 2018-2019.
• Reading proficiencies are at their lowest level in the 3rd grade, at 24 percent for all
students, and 15% for AI/AN.
• The proficiency rate for AI/AN students was highest in the 11th grade, with 33%
proficient or above.
Page 13
Tribal Education Status Report: 2019-2020ALBUQUERQUE PUBLIC SCHOOLS – INDIAN EDUCATION DEPARTMENT
2018-2019 Districtwide Assessment
Math Proficiency by Grade
American Indian/Alaskan Native Students
35%
Percent Proficient and Above
30%
25%
20%
15%
10%
5%
0%
3rd 4th 5th 6th 7th 8th 9th 10th 11th
All Students 30% 26% 24% 17% 19% 18% 20% 17% 13%
American Indian 20% 14% 14% 10% 9% 11% 11% 10% 10%
MATH BY GRADE
Grades 3 to 11 proficiencies for AI/AN students were based on TAMELA, PARCC, and
NMAPA math assessments. The 2018-2019 Math Proficiency by Grade chart shows:
• AI/AN students perform well below all other students in all grade levels from 3rd to
11th.
• AI/AN elementary students are performing slightly better in math than those in
middle and high school;
• Overall, AI/AN students slightly decreased in percent proficient from the 2017-
2018 school year.
o Grade 6 had the largest increase in percent proficient; proficiency rate
increased by 2 percentage points compared to the previous school year.
o Grades 9th and 10th had the largest decreases in percent proficient with a
5% and 4% drop from the previous school year.
Page 14
Tribal Education Status Report: 2019-2020ALBUQUERQUE PUBLIC SCHOOLS – INDIAN EDUCATION DEPARTMENT
2018-2019 Districtwide Assessment
Science Proficiency by Grade
American Indian/Alaskan Native Students
50%
Percent Proficient and Above
40%
30%
20%
10%
0%
4th 7th 11th
All Students 41% 39% 26%
American Indian 29% 27% 17%
SCIENCE BY GRADE
Science is assessed only in grades 4, 7, and 11. The proficiencies were based on SBA
science and NMAPA science. The 2018-2019 Science Proficiency by Grade figure shows
American Indian/Alaskan Native students demonstrate the following:
• The highest level of science proficiency is found in the 4th grades at 29% meeting
proficiency or above.
• Grade 4 percent proficiency increased by 4% in 2018-2019 compared to the 2017-
2018 school year.
• The lowest level of science proficiency is found in the 11th grade at about 17%
proficient or above, dropping 3% points from last school year.
Page 15
Tribal Education Status Report: 2019-2020ALBUQUERQUE PUBLIC SCHOOLS – INDIAN EDUCATION DEPARTMENT
2018-2019 Districtwide Assessments
In Reading, Math, and Science
At or Above Proficient by Economic Status
Percent Proficient and Above
60%
40%
20%
0%
AI Not
Not Economically Economically AI Economically
All Students American Indian Economically
Disadvantaged Disadvantaged Disadvantaged
Disadvantaged
Reading 31% 52% 21% 21% 36% 17%
Math 20% 40% 11% 12% 25% 9%
Science 34% 57% 23% 24% 36% 21%
PROFICIENCY BY ECONOMIC STATUS
• Overall, AI/AN students who are non-economically disadvantaged are performing
better than those who are identified as economically disadvantage.
o Reading performance for economically disadvantaged students is 19
percentage points lower than those non-disadvantaged students.
o Math performance is 16 percentage points higher for those students who
are non-economically disadvantaged compared to those who are
economically disadvantaged.
o Science performance is about 15 percentage points higher for students who
are non-economically disadvantaged compared to those who are
economically disadvantaged.
• In reading, non-economically disadvantaged AI/AN students performed better
than students in the district overall (36% compared to 31%).
• In Math, non-economically disadvantaged AI/AN students performed better than
students in the district overall (25% compared to 20%).
Page 16
Tribal Education Status Report: 2019-2020ALBUQUERQUE PUBLIC SCHOOLS – INDIAN EDUCATION DEPARTMENT
2018-2019 Districtwide Assessment
In Reading, Math, and Science
At or Above Proficient by Gender
40%
Percent Proficient and Above
35%
30%
25%
20%
15%
10%
5%
0%
All Students Male Female American Indian AI Male AI Female
Reading 31% 26% 35% 21% 16% 25%
Math 20% 21% 20% 12% 13% 12%
Science 34% 36% 33% 24% 25% 23%
READING, MATH, AND SCIENCE PROFICIENCY BY GENDER
• AI/AN male students performed slightly better in math and science than AI/AN
female students.
• AI/AN female students performed better in reading than AI/AN male students.
Page 17
Tribal Education Status Report: 2019-2020ALBUQUERQUE PUBLIC SCHOOLS – INDIAN EDUCATION DEPARTMENT
2018-2019 Districtwide Assessment
in Reading, Math, and Science
At or Above Proficient by Students with Disabilities
50%
Percent Proficient and Above
40%
30%
20%
10%
0%
Non-AI Students AI Students
Non-AI Students AI Students with
All Students without American Indian without
with Disabilities Disabilities
Disabilities Disabilities
Reading 31% 36% 8% 21% 25% 5%
Math 20% 25% 6% 12% 15% 3%
Science 34% 41% 11% 24% 29% 7%
READING, MATH, AND SCIENCE PROFICIENCY BY STUDENTS WITH DISABILITIES
• AI/AN students with disabilities are significantly underperforming in reading,
math, and science compared to AI/AN students without disabilities.
o AI/AN students without disabilities are at about five times higher in their
percent proficiency than AI/AN students with disabilities.
• AI/AN students with disabilities are underperforming in reading, math, and
science compared to the students with disabilities districtwide.
Page 18
Tribal Education Status Report: 2019-2020ALBUQUERQUE PUBLIC SCHOOLS – INDIAN EDUCATION DEPARTMENT
2018-2019 Districtwide Assessment
in Reading, Math, and Science
At or Above Proficient by
Students with English Learner Status
Percent Proficient and Above
50%
40%
30%
20%
10%
0%
All Students AI Students
All Students with AI Students with
All Students without current American Indian without current
current EL Status current EL Status
EL Status EL Status
Reading 31% 35% 11% 21% 23% 8%
Math 20% 24% 6% 12% 14% 6%
Science 34% 40% 10% 24% 26% 14%
READING, MATH, AND SCIENCE PROFICIENCY BY STUDENTS WITH EL STATUS
• Overall, AI/AN students without EL status outperform AI/AN students with
current EL status.
o Reading performance is 15 percentage points higher for those students who
are without EL status compared to those who are current EL students.
o Math performance is 8 percentage points higher for those students who are
without EL status compared to those who are current EL students.
o Science performance is about 12 percentage points higher for students
without English Learner status compared to those who are current EL
students.
• AI/AN students with EL status have higher proficiency rates in Science compared
to EL students at the district level.
• AI/AN students with EL status have lower proficiency rates in Reading and Math
compared to EL students at the district level.
Page 19
Tribal Education Status Report: 2019-2020ALBUQUERQUE PUBLIC SCHOOLS – INDIAN EDUCATION DEPARTMENT
American Indian/Alaskan Native
Gifted Education Program Enrollment
3.5%
3.0% 3.1%
2.9%
3.0%
2.6%
2.5% 2.3%
2.0%
1.5%
1.0%
0.5%
0.0%
2015-16 2016-17 2017-18 2018-19 2019-20
GIFTED PROGRAM PARTICIPATION
• Gifted education falls under the Special Education Department. Students are
identified through a referral and evaluation process.
• About 2% of the American Indian/Alaskan Native population at APS are enrolled in
the gifted program.
• The proportion of AI/AN students enrolled in the gifted program has decreased
slightly since the 2018-2019 school year. Less AI/AN students were in the gifted
program during the 2019-2020 school year.
Page 20
Tribal Education Status Report: 2019-2020ALBUQUERQUE PUBLIC SCHOOLS – INDIAN EDUCATION DEPARTMENT
American Indian/Alaskan Native
Advanced Placement Course Enrollment
3.5%
2.9%
3.0% 2.8%
2.5% 2.5%
2.5%
2.1%
2.0%
1.5%
1.0%
0.5%
0.0%
2014-15 2015-16 2016-17 2017-18 2018-19
ADVANCED PLACEMENT COURSE ENROLLMENT
• The proportion of AI/AN students enrolled in the Advanced Placement (AP) courses
has increased slightly since the 2014-2015 school year.
o Over 70 more AI/AN students were enrolled in AP courses during the 2018-
2019 school year than in the 2014-15 school year.
• AI/AN students are underrepresented in Advanced Placement (AP) course
enrollment:
o In 2018-2019, 331 AI/AN students enrolled in AP courses, accounting for
2.9% of total AP course enrollment, though they made up 5.4% of total
district enrollment.
o In 2017-18, 307 AI/AN students enrolled in AP courses, accounting for 2.8%
of enrollment for AP courses, though they made up 5.2% of total district
enrollment.
Page 21
Tribal Education Status Report: 2019-2020ALBUQUERQUE PUBLIC SCHOOLS – INDIAN EDUCATION DEPARTMENT
ACT - Total Composite Score by Race/Ethnicity
20.3
18.3 All Students
2017-18
African American
American Indian/Alaskan Native
Asian
20.1
Caucasian
2018-19
18.6
Hispanic
SAT - Overall Score by Race/Ethnicity
1101
1004 All Students
2017-18
African American
American Indian/Alaskan Native
Asian
1099
953 Caucasian
2018-19
Hispanic
ACT AND SAT
• The ACT and SAT are often required for college admissions.
o The ACT and SAT attempt to measure college readiness and predict future
academic success.
o The ACT measures achievement related to general high school curricula,
while the SAT measures verbal and quantitative reasoning.
• AI/AN students’ 2018-2019 ACT scores – though lower on average than the district
scores – were slightly higher than previous year scores.
• On the SAT, AI/AN students’ average scores decreased in the 2018-19 school year.
AI/AN students scored lower than the overall district average.
Page 22
Tribal Education Status Report: 2019-2020ALBUQUERQUE PUBLIC SCHOOLS – INDIAN EDUCATION DEPARTMENT
2: SCHOOL SAFETY
OBJECTIVE
To ensure that students in New Mexico schools attend safe, secure, and peaceful schools.
BACKGROUND
New Mexico—as do other states —looks at strategies to keep students, staff, and faculty
safe in schools.
The School Safety plan offers new research and new approaches with the intent to:
➢ assist schools and their community partners in the revision of the school-level
safety plans;
➢ prevent an occurrence and/or recurrences of undesirable events;
➢ properly train school staff, faculty, and students to assess, facilitate, and
implement response actions to emergency events; and
➢ provide the basis for coordinating protective actions prior to, during, and after
any type of emergency.
New Mexico school districts have developed supports to ensure the safety of students
within the schools. These provisions include the following: policies and procedures for
school safety, safety committees, safety implementation plans, prevention plans,
anonymous tip lines, emergency response plans, recovery plans, safe schools reports,
and a school safety report submitted to the PED Coordinated School Health and
Wellness Bureau (CSHWB). http://ped.state.nm.us/sfsb/safeschools/
METHODS
Albuquerque Public Schools submitted their current school safety process through a
districtwide survey issued by New Mexico Public Education Department Indian
Education Department (NMPED IED). The NMPED IED team analyzed the data to
determine which districts or charter schools required additional assistance to ensure
students have a safe school environment.
Behavioral incidence data were collected by each school in the district and recorded in
the district’s student information system. Data were summarized and collapsed into the
most highly reported student infractions.
Sources: New Mexico Public Education Department, Student Teacher Accountability Reporting System
(STARS).
Page 23
Tribal Education Status Report: 2019-2020ALBUQUERQUE PUBLIC SCHOOLS – INDIAN EDUCATION DEPARTMENT
RESULTS
The school district has in place required district training for all district personnel. The
training includes: Health Emergencies, Blood Borne Pathogens, Civil Rights/ Harassment/
American with Disabilities Act, Confidential Information, Crisis Response and Recovery,
Customer Service, Discrimination: Avoiding Discriminatory Practices, Employee
Regulations, Ethics and Conflict of Interest, Social Media Guidelines, SPAM/ Phishing:
Email Security, Technology Use, Undocumented Students, Bullying and Cyberbullying,
Child Abuse and Neglect, Gender Identification and Expression, Suicide Prevention,
Student Health Concerns, Asbestos Awareness, Additional Health Trainings and Threat
Assessment.
Also in place in each school are training and certification on English as a Second Language
for all teachers, Discipline Policy, Staff Handbook, Emergency Drills in every building,
Food Safety Inspections, Identification badges required at each site, Integrated Pest
Management, Tobacco, Alcohol and Drug Free Schools are enforced, School Safety
Committees, security officers at each location, school maps are in place, Emergency
protocols are written and in place, Prevention, Protection, and Mitigation plans, Lock
Downs, there are written protocol in place that includes: School-based Health Centers and
services, infectious and communicable disease prevention that include Pandemic
Influenza Prevention, Behavioral and Mental Health, and a District Wellness Policy.
The behavioral data for the 2019-2020 school year showed that the number of reported
discipline incidents increase as students move up in grade level; the number of incidents
peaks in middle school. The number of reported incidents begin to decline as students
move through high school. Male students are more than twice as likely to receive a
discipline report compared to females, although this difference is smaller than it was last
school year. The most common discipline infraction is general disorderly conduct, making
up about 47% of reported incidents; followed by assault/battery, making up about 25% of
reported incidents. Alcohol violation, graffiti, gang-related activity, weapon possession, and
arson infractions, each make up less than 1%. Approximately 9.6% of the AI/AN students
enrolled during the 2019-2020 school year had at least one behavioral violation on
record. Of those that did have discipline incidents, the highest reported infractions were
the general disorderly conduct category, followed by the assault/battery category.
CONCLUSION
The school district has communicated effectively with district personnel in adherence to
required district training each year. Policies related to safety and health are in place
districtwide. Protocols related to each area listed above are in place at each site.
Overall, reported discipline infractions have increased since last school year. However,
general disorderly conduct and assault/battery remains the highest reported offenses for
the district and among AI/AN students. Male students continue to have significantly
more reported infractions than female students, but the gender gap is narrowing as
females’ reported infractions are increasing. Generally, the number of reported
infractions for AI/AN students has remained stable since last school year. Although
Page 24
Tribal Education Status Report: 2019-2020ALBUQUERQUE PUBLIC SCHOOLS – INDIAN EDUCATION DEPARTMENT
there has been a drop in the percentages of several infractions for AI/AN students (e.g.,
alcohol violation and tobacco use), a few infractions have increased since last school
year (e.g., general disorderly conduct and assault/battery). The district is working to
address areas in which students are underrepresented or overrepresented in their
reported infractions in relation to their APS enrollment.
ACTION PLAN
Continuation of protocols and policies at each location is necessary. The district Indian
Education Department (IED) recognizes AI/AN students annually in 12 categories:
citizenship, leadership, academic achievement, most improvement, etc. Another support
for schools’ AI/AN students is counseling in coordination with the building counselors
and a full-time College and Career Counselor in the Indian Education Department. In
addition, referrals to partnering AI/AN Mental Health organizations are coordinated by
the Indian Education Department and school sites. The organizations have
Memorandum of Agreements (MOA’s) with the district Counseling Department.
Page 25
Tribal Education Status Report: 2019-2020Safety Indicators
✓ Albuquerque Public Schools has a districtwide School Safety plan in place.
✓ Albuquerque Public Schools submits an annual school safety report to the PED
Coordinated School Health and Wellness Bureau.
✓ Albuquerque Public Schools has a School Safety Committee.
✓ Albuquerque Public Schools is in compliance with the School Wellness Policy.
2019-20 Districtwide Reported Discipline Incidents
Weapons Possession-
Weapon Possession
Sexual Harassment
General Disorderly
Alcohol Violation
Assault/Battery
Property/Theft
Drug Violation
Knife/Cutting
Gang Related
Tobacco Use
Vandalism
Violence
Conduct
Bullying
Missing
Activity
Graffiti
Arson
Number Infractions
Reported 147 82 4,638 1,079 1,495 99 8,700 112 352 489 498 246 412 116 151
(total = 18,616)
Percent of
0.8% 0.4% 24.9% 5.8% 8.0% 0.5% 46.7% 0.6% 1.9% 2.6% 2.7% 1.3% 2.2% 0.6% 0.8%
Total Incidents
Caucasian 16% 17% 14% 15% 12% * 14% 14% 19% 10% 22% 15% 21% 14% 16%
African American * * 7% 8% 5% * 6% * 9% 5% 4% 5% 10% * 8%
American Indian
/Alaska Native * * 5% 4% 6% * 4% * 5% 3% 4% 5% 4% * 9%
Hispanic 77% 71% 73% 72% 76% 84% 75% 75% 66% 83% 70% 75% 64% 78% 66%
Note: Percentages for categories with fewer than 10 students/incidences are masked (*) to protect student privacy. For this reason, Native Hawaiian or Other Pacific
Islander and Asian subgroups are not included in the above table.ALBUQUERQUE PUBLIC SCHOOLS – INDIAN EDUCATION DEPARTMENT
2019-20 Districtwide 2019-20 Districtwide
Reported Discipline Incidents by Reported Discipline Incidents
Grade Level by Gender
25%
21%
21%
20%
16%
Female,
15% 12% 31.2%
10% 7%
Male,
4% 4% 68.8%
5% 2% 3% 2% 3% 3% 2%
0%
K 1 2 3 4 5 6 7 8 9 10 11 12
2019-2020 Reported Discipline Infractions: American Indian/Alaska Native Students
Alcohol Violation, *
Weapons Possession -
Knife/Cutting, 1.6% Arson, *
Weapons Possession, *
Violence, 2.1%
Vandalism, 1.4%
Assault/Battery, 27.8%
Tobacco Use, 2.1%
Sexual Harassment, 1.5%
Missing Property/Theft,
2.0%
Graffiti, * Bullying, 5.6%
Drug Violation, 11.3%
General Disorderly
Conduct, 40.8%
Gang-Related Activity, *
(Number of incidents = 799; AI/AN students represented about 4.3% of total 2019-20 districtwide
incidents)
Page 27
Tribal Education Status Report: 2019-2020ALBUQUERQUE PUBLIC SCHOOLS – INDIAN EDUCATION DEPARTMENT
3: GRADUATION RATE
OBJECTIVE
The graduation objective is to ensure that all American Indian/Alaskan Native (AI/AN)
students are given the opportunity to graduate from high school with a New Mexico
Diploma of Excellence. The high school experience and diploma together provide students
with solid preparation for college and career readiness.
BACKGROUND
Transitioning to the National Governors Association (NGA) cohort computation method,
New Mexico implemented its first 4-year cohort graduation rate in 2009. This adjusted
cohort graduation rate improves our understanding of the characteristics of the
population of students who do not earn regular high school diplomas or who take longer
than four years to graduate. Numerous statistics and reports from the US Department of
Labor indicate the importance of a high school diploma and reflect the high economic
costs of not completing high school. Since 2003, New Mexico has reported on a 5-year
cohort graduation rate for American Indian students in order to better capture the
number of students acquiring the New Mexico Diploma of Excellence.
METHODS
The cohort consists of all students who were first-time freshmen four years earlier and
graduated by August 1 of their 4th year. Additionally, cohorts are tracked for one
additional year past their expected year of graduation, yielding a 5-year graduation rate.
Targets for graduation—called School Growth Targets (SGT)—were reset and approved
by the United States Department of Education (USDOE) in the spring of 2012. These
targets are 4-year cohort graduation rates, which are anticipated to reach 85 percent by
2020. The 4-year data for Cohort 2020 and the 5-year and 6-year graduation rates for
2019 and 2018 were not yet available from NM PED.
Source: https://webnew.ped.state.nm.us/bureaus/accountability/graduation/; Results from 2019-2020
Senior Exit Survey; Results from National Student Clearinghouse APS College-Going data
RESULTS
The charts below showed:
• Districtwide 4-year graduation rates continued to increase from 69.6% in 2018
to 70.1% in 2019.
• The 4-year graduation rate of AI/AN students increased from the previous
cohort (54.2% in 2018 to 56.2%). However, it is lower than the statewide 4-year
graduation rate for AI/AN (69%).
• The 5-year graduation rate for AI/AN students rose from 61.7% in 2017 to
62.7% in 2018.
Page 28
Tribal Education Status Report: 2019-2020ALBUQUERQUE PUBLIC SCHOOLS – INDIAN EDUCATION DEPARTMENT
• The 5-year graduation rates for AI/AN students rose over ten percentage points
since the 2013 cohort.
• The majority of AI/AN graduates plan to enroll in a university or college
following high school.
• About 57% of the 2018-2019 high school seniors enrolled institutions of higher
learning.
• Districtwide mobility rate is 0.22%.
CONCLUSION
The number of AI/AN student graduates has increased since 2018. However, AI/AN
students continue to have the lowest graduation rate compared to other student groups.
The IED’s support for AI/AN students in achieving graduation is ongoing with the
creation and implementation of multiple programs specifically for AI/AN students
attending district schools. The program with the biggest impact is the Gradpoint Online
Credit Recovery Program by Pearson which assisted in the completion of core
coursework (i.e., English, Science, Social Studies, and Math).
ACTION PLAN
The school district submitted CSI grant applications last spring 2019, and many of the high
schools included in the grant applications GradPoint Credit Recovery Programs. They will
design and implement a GradPoint Credit Recovery Program for their students that need
this support in their schools. This will help many AI/AN students who may be short credits
for graduation next spring, 2021. The Indian Education Department will continue to serve
students who need this support regardless of who received CSI funding because many
Native American students prefer the one to one instruction the teachers provide onsite.
Page 29
Tribal Education Status Report: 2019-2020ALBUQUERQUE PUBLIC SCHOOLS – INDIAN EDUCATION DEPARTMENT
Four Year Graduation Rates for Cohort 2019
90%
84.4%
StateWide
80% 75.0% 75.4%
74.1%
70.1% 70.2% Districtwide
69.3%
70% 66.4% Male
62.8% 62.8%
59.3% Female
60% 56.2%
African American
50% American Indian
40% Asian
Caucasian
30%
Hispanic
20% Economically Disadvantaged
English Learners
10%
Students with Disabilities
0%
This indicator examines the percentage of APS high school students who graduated within
four years with a regular high school diploma.
Five Year Graduation Rate by Ethnicity Over Time
100%
75%
62.7%
61.7%
52.6% 52.3% 59.0% 57.1%
50%
Cohort 2013 Cohort 2014 Cohort 2015 Cohort 2016 Cohort 2017 Cohort 2018
Statewide 71.4% 70.5% 75.0% 75.9% 76.4% 79.0%
DistrictWide 68.8% 62.8% 71.0% 73.0% 73.3% 75.3%
Caucasian 76.9% 69.0% 75.0% 78.9% 78.8% 81.5%
African American 65.8% 57.2% 62.0% 61.9% 69.4% 69.7%
Hispanic 66.4% 60.7% 70.0% 72.1% 71.8% 73.8%
Asian 87.2% 82.4% 81.0% 85.0% 87.6% 92.8%
Native American 52.6% 52.3% 59.0% 57.1% 61.7% 62.7%
This graph examines the changes over time in graduation rates for students who graduated
within five-years.
Page 30
Tribal Education Status Report: 2019-2020ALBUQUERQUE PUBLIC SCHOOLS – INDIAN EDUCATION DEPARTMENT
GRADPOINT CREDIT RECOVERY PROGRAMS
In SY2017-2018, 222 students completed coursework. And in the summer of 2018, 125
students completed coursework, including 12 summer graduate seniors. The table below
provides information on the 2018-19 and 2019-20 school years as well.
Term Courses Completed Students Summer Senior Graduates
SY 2017-18 222 222
Summer 2018 125 125 12
SY 2018-19 61 55
Summer 2019 90 65 6
SY 2019-20* 3 3
Summer 2020 96 68 3
*due to funding shortfalls, GradPoint was only offered in Spring of 2020 and instruction was cut short due to Covid-19
quarantine.
The charts above show the relative distribution of GradPoint coursework completion
between the subject areas of English, mathematics, social studies and science.
Page 31
Tribal Education Status Report: 2019-2020ALBUQUERQUE PUBLIC SCHOOLS – INDIAN EDUCATION DEPARTMENT
Albuquerque Public Schools administers the Senior Exit Survey to graduating seniors every
spring. The purpose of the Senior Exit Survey (SES) is to capture seniors’ intentions after
high school. The graph below shows the percentages of the students’ self-reported
intentions disaggregated by race/ethnicity.
Post-graduation Intentions
Followng High School Graduation by Race/Ethnicity
60%
50%
36.4%
40% 22.2%
All Students
30%
American Indian
20% 12.3% Asian
11.1%
5.6% 6.2% African American
10% 1.2% 4.3%
0.6% 0.0% Hispanic
0%
Caucasian
POST-GRADUATION PLANS
• The key findings from the 2019-2020 Senior Exit Survey:
o The majority of AI/AN seniors (77%) plan on attending an institution of
higher learning in the fall semester following graduation (Fall 2020).
o AI/AN seniors have a higher proportion of students planning on attending
2-year/in-state institutions. In contrast, Asian and Caucasian students had a
higher percentage of choosing a 4-year/in-state option.
o AI/AN seniors are more likely to want to attend a trade school or
apprenticeship.
o AI/AN seniors are more likely to be unsure about their plans; in fact, they
are more than twice as likely when compared to African American and
Caucasian students and over five times as likely when compared to Asian
students.
o AI/AN seniors have a notable proportion of choosing to enlist in the
military.
Page 32
Tribal Education Status Report: 2019-2020ALBUQUERQUE PUBLIC SCHOOLS – INDIAN EDUCATION DEPARTMENT
APS High School Seniors Enrolling in College
During the Fall Following Graduation
80.0%
68.1% 67.3% 66.0%
70.0%
62.0%
60.0% 56.8%
49.7%
50.0%
40.0%
30.0%
20.0%
10.0%
0.0%
2016-17 2017-2018 2018-2019
All Students American Indian/Alaskan Native
COLLEGE ENROLLMENT
• College-going trends are made possible by the district’s membership in the
National Student Clearinghouse (NSC). NSC tracks graduates longitudinally
through their post-secondary enrollments.
• About 57% of the 2018-19 high school seniors enrolled in a post-secondary
institution in the fall semester following graduation (Fall 2019).
• Central New Mexico Community College and The University of New Mexico rank 1st
and 2nd choice for most APS graduates.
Page 33
Tribal Education Status Report: 2019-2020ALBUQUERQUE PUBLIC SCHOOLS – INDIAN EDUCATION DEPARTMENT
4: ATTENDANCE
OBJECTIVE
The attendance objective is to assure that all students attend school every day and on
schedule. This will be accomplished by supporting school district initiatives addressing the
decrease in the dropout rate and increase in attendance.
BACKGROUND
The Compulsory School Attendance Rule (6.10.8.9 NMAC) takes into consideration the
sovereignty of every American Indian pueblo or tribe. The rule requires an established
set of policies to be identified with each governing entity in support of the cultural well-
being of the student, with the goal of keeping children in school until the age of eighteen.
The local school board/governing body of the public or charter school adopts the
attendance policy. The attendance rate is reported by each district that serves a large
American Indian student population or one that borders on or around tribal lands. New
Mexico pursues programs and strategies to meet the needs of at-risk students and to
address obstacles associated with keeping students in school. New Mexico districts and
schools actively pursue programs focused on addressing the academic needs of at-risk
students and building capacity of truancy intervention programs. In addition, some
school districts have established agreements with outside agencies to jointly provide for
the educational and social needs of students who are at risk of dropping out. Students
who drop out negatively affect the four-year (freshman) cohort graduation rate for the
state, which results in a lower graduation rate.
METHODS
The Compulsory School Attendance Law requires districts to maintain an attendance
policy that provides for the early identification of students with unexcused absences and
truancy while providing intervention strategies that focus on keeping truants in an
educational setting. NM districts identify these students using demographic data
obtained from the Student Snapshot and Membership (school cumulative enrollment
between the first and last days of the school year) records stored in Student Teacher
Accountability Reporting System (STARS). Student membership is collected and
reported at the school, district, and state level—including the number of pupils in each
of several categories from grades K (kindergarten) through 12.
The school districts and charter schools report absences with excused and unexcused
identifiers through the STARS. They certify that the information is being reported
consistently at intervals at the 40th-, 80th-, and 120th-day, and end-of-year in a manner
as specified by the PED. Average Daily Attendance is based on the total number of days
present of all students enrolled at the school at any time during the school year divided
Page 34
Tribal Education Status Report: 2019-2020ALBUQUERQUE PUBLIC SCHOOLS – INDIAN EDUCATION DEPARTMENT
by the total number of days in membership of all students enrolled at the school at any
time and included both excused and unexcused absences.
Source: New Mexico Public Education Department, Student Teacher Accountability Reporting System
(STARS)
RESULTS
The results below indicate that overall, AI/AN students had a high attendance rate
(96.7%) during the 2019-2020 school year, just slightly lower than the district average.
Although AI/AN students still have a lower attendance rate than the other subgroups.
The gap between AI/AN students’ attendance and the other subgroups has narrowed.
AI/AN students had the highest rate of chronic absenteeism (9%), compared to 7% for
all students. Unfortunately, the percentage of AI/AN students chronically absent is
higher than their counterparts.
CONCLUSION
The attendance rate for AI/AN students increased from the previous school years, as did
the rate districtwide. Since the 2017-2018 school year, APS has prioritized increasing
attendance rates for all students. The district has been improving the monitoring of
absences, increasing communication with parents, and creating a climate in which
students appreciated the value of coming to school. Although AI/AN students continue
to have the lowest attendance rates, the gap between AI/AN students and other
subgroups is narrowing.
ACTION PLAN
The district will continue to identify the causes for the lower attendance rate among
specific subgroups. As the reasons are determined, strategies to address the issues will
be developed in consultation with tribal officials and community partners during the
Tribal Leaders Summits (Fall and Spring).
Improving the cultural and school operations to meet AI/AN students’ specific needs
and community dynamics can motivate students to attend school and perform well. To
accomplish this level of cultural responsiveness and bolster the overall effectiveness of
curriculum, the district will need to better recognize and respect students’ culture,
language, and tribal dynamics through culturally responsive instructional strategies
and policies. APS will continue to work to build relationships with AI/AN students and
their families to understand their needs and learning preferences better and promote
awareness of the importance of regular attendance at school.
Page 35
Tribal Education Status Report: 2019-2020ALBUQUERQUE PUBLIC SCHOOLS – INDIAN EDUCATION DEPARTMENT
Attendance Rates by Race/Ethnicity Over Time
100.0%
98.0%
96.0% 96.7%
96.4%
96.1%
94.0% 94.3% 94.3%
92.0%
2015-16 2016-17 2017-18 2018-19 2019-20
All Students 96.8% 95.4% 97.0% 95.8% 97.5%
American Indian/Alaskan Native 96.4% 94.3% 96.1% 94.3% 96.7%
Asian 98.5% 97.6% 98.8% 97.9% 98.9%
Black/African American 96.6% 95.0% 96.5% 95.0% 96.9%
Hispanic 96.9% 95.2% 96.8% 95.4% 97.3%
Native Hawaiian/Other Pacific Islander 97.2% 96.2% 97.0% 95.9% 98.5%
White/Caucasian 98.2% 96.6% 98.1% 97.4% 98.4%
2019-2020 Chronic Absenteeism by Student Group
All Students 7.2%
American Indian/Alaskan Native 9.8%
Asian 2.1%
African American 9.1%
Hispanic 8.0%
Native Hawaiian/Other Pacific Islander 5.5%
Caucasian 3.5%
Page 36
Tribal Education Status Report: 2019-2020ALBUQUERQUE PUBLIC SCHOOLS – INDIAN EDUCATION DEPARTMENT
5: PARENT AND COMMUNITY INVOLVEMENT
OBJECTIVE
The parent and community objective is to ensure that parents; tribal departments of
education; community-based organizations; urban American Indian community members;
the DOE; universities; and tribal, state, and local policymakers work together to find ways
to improve educational opportunities for American Indian students by encouraging and
fostering parental and community involvement within public and charter schools.
BACKGROUND
The importance of parent involvement in education has been documented as benefitting
students, parents, teachers, and schools—whether the program is at the pre-school or
elementary, middle or high school levels. Research has shown that when parents
participate in their children’s education, the result is an increase in student academic
achievement and an improvement in the student’s overall attitude and school behavior.
There is also improved attendance, fewer discipline problems, and less bullying. Higher
aspirations have been correlated to parent involvement as have improved attitudes,
enhanced interest in science among adolescents, increased language achievement, and
sustained achievement gains.
METHODS
Throughout the school year, parents have been supportive of their children as observed
through multiple events and activities which include: pick up of back-to-school supplies,
student recognition grab bag as AI/AN students were recognized for their outstanding
achievement in eleven categories annually by each school and staff from respective
students’ schools, attendance and participation of the elementary pow-wow,
participation during the annual fashion show, attendance at the annual Winter stories,
purchase and submittal of documents for reimbursements (i.e., cap and gown, ACT/SAT
fees, eyeglasses, college application fees, AP test fees, and student travel for academic
clubs). Also, the enrollment of children to the annual Summer cultural enrichment
classes, participation in educational travel and workshops for parents who serve on the
Indian Education Committee. Numerous educational field trips were taken to primary
source of study locations initiated by respective teachers to enhance education. Parent
and student workshops related to post-secondary education were coordinated by the
College and Career Readiness Counselor.
RESULTS
The table below shows the number of programs and activities conducted with students
and parents in support of AI/AN educational opportunities. The chart clearly showed
that many families participated in at least two activities and more, including back-to-
school supplies and educational field trips for students as teachers combined units of
study with travel to sites studied as primary sources to enrich student learning.
Page 37
Tribal Education Status Report: 2019-2020You can also read