R&SROMES4 DRIVE TEST SOFTWARE - MOBILE COVERAGE AND QOS MEASUREMENTS IN MOBILE NETWORKS
←
→
Page content transcription
If your browser does not render page correctly, please read the page content below
R&S®ROMES4                             NOW PART OF
DRIVE TEST SOFTWARE                    R&S®SmartONE
Mobile coverage and QoS measurements
in mobile networks

Product Brochure
Version 22.00
CONTENTS At a glance
► page 4
Easy operation and high flexibility
► page 6
5G NR network testing
► page 8
Numerous application tests
► page 10
Automatic handover and neighborhood analysis
► page 12
Testing of voice quality – incl. VoLTE
► page 13
LTE broadcast (eMBMS) network optimization
► page 14
2
NB-IoT/Cat NB1 and LTE-M measurements System configuration for various application scenarios
► page 16 ► page 32
Full overview of layer 1 and layer 3 System components
► page 19 ► page 35
Parallel spectrum measurement System requirements
► page 20 ► page 35
Location estimation of 2G/3G/LTE/5G and NB-IoT base stations Application: TETRA
► page 21 ► page 36
GSM interference analysis with automatic Application: LTE
interferer identification ► page 38
► page 22
Related products
Indoor measurements ► page 42
► page 24
R&S®ROMES4NPA: analysis and e valuation of
network problems
► page 25
Your local Rohde & Schwarz expert will help you find
the optimum solution for your requirements. To find
your n
earest Rohde & Schwarz representative, visit
www.sales.rohde-schwarz.com
R&S®ROMES4 with test devices.
CDMA2000® is a registered trademark of the Telecommunications Industry Association (TIA – USA).
WiMAX Forum is a registered trademark of the WiMAX Forum. WiMAX, the WiMAX Forum logo, WiMAX
Forum Certified, and the WiMAX Forum Certified logo are t rademarks of the WiMAX Forum.
Rohde & Schwarz R&S®ROMES4 Drive Test Software 3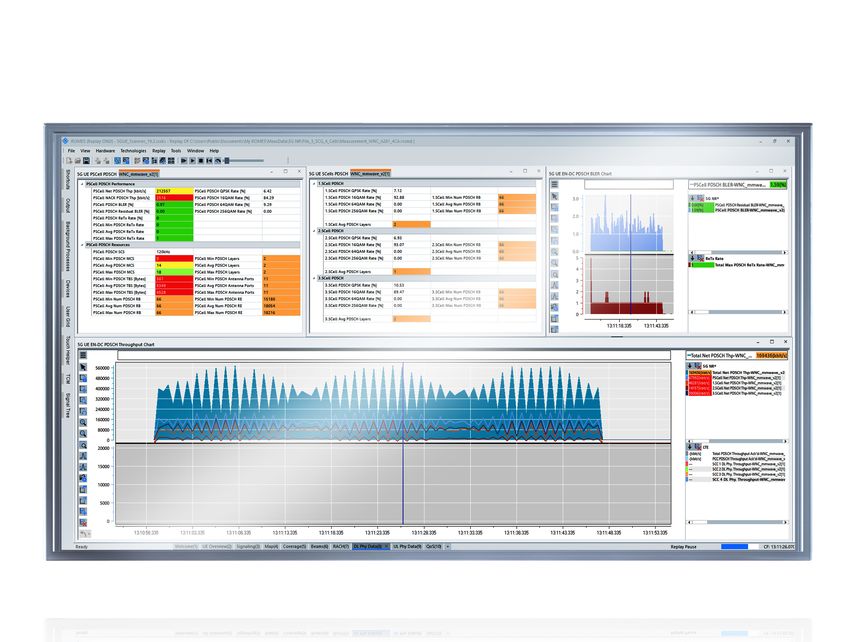
AT A GLANCE
The R&S®ROMES4 drive test software (now part of the R&S®SmartONE software), in combination with one
of the unique Rohde & Schwarz drive test scanners and the R&S®ROMES4 network problem analyzer (NPA)
tool, provides an all-in-one solution for network analysis and optimization.
Universal software platform Combination with R&S®TSMx scanners
R&S®ROMES4 is the universal software platform for net- When R&S®ROMES4 is combined with the R&S®TSMx
work engineering and network optimization systems from band-unlimited scanners, the measurements help typical
Rohde & Schwarz. In combination with other test and mea- users (such as network operators, regulatory authorities,
surement equipment such as wireless communications service providers, chipset manufacturers and government
scanners and test mobile phones, it provides solutions for authorities) complete their work quickly and easily.
all essential tasks involved in coverage measurements,
interference identification, performance measurements Part of R&S®SmartONE
and quality analysis in mobile networks. In addition to R&S®SmartONE is the unified Rohde & Schwarz solution
measuring and displaying test p arameters, data is pro- for PC based drive and walk testing. It covers all usecases
cessed instantly and statistics are calculated in real time. around optimization, network benchmarking and engi-
neering and scales from a single laptop to large multi-CPU
Support of multiple protocols and standards installations with tens of testmobiles. R&S®SmartONE
R&S®ROMES4 supports 5G NR, GSM/EDGE, WCDMA/ comprises of two user interface, designed for the tasks at
HSPA+, CDMA2000® 1xEV-DO Rev. A, WLAN hand. A web based GUI based on the SmartBenchmarker
(IEEE 802.11a, b, g, n), WiMAX™ (IEEE 802.16e), LTE, application software is available for efficient data-
NB‑IoT/Cat NB1, LTE-M and TETRA. Standard-compliant collection and remote control support. An expert GUI is
RF level measurements can be time and route-triggered provided by the R&S®ROMES4 application software for
over a very wide frequency range (9 kHz to 7 GHz). Due to complex measurement tasks and detailed data investiga-
its highly modular structure, the platform can be expanded tion during the measurement. Both R&S®ROMES4 and
at any time for new technologies. The test software runs SmartBenchmarker users can use R&S®SmartONE with
on a Windows 10 (64 bit) PC. both user interfaces.
Straightforward R&S®ROMES4 drive test software user interface.
4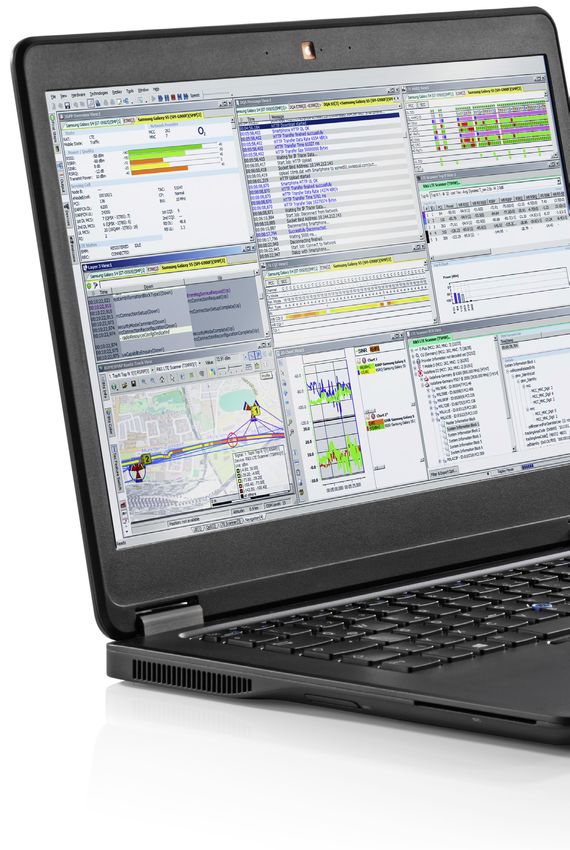
KEY FACTS
►   One software for all technologies from a single source
►   Flexible software licenses that meet user requirements reduce startup costs
►   Analysis of R&S®TSME6 and R&S®TSMA6 5G NR scanner measurements and 5G Qualcomm and
    Samsung (Exynos) based UE measurements
►   Parallel measurements with up to eight mobile devices per license save time, allowing
    more effective utilization of existing resources and saving operating expenses (OPEX)
►   High-precision, fast RF test and measurement equipment (Rohde & Schwarz scanners) delivers a
    large quantity of reliable measurements and results
►   Automated analysis at the end of the measurement using the integrated replay function or the
    network problem analyzer (NPA) considerably reduces OPEX
►   Automatic identification of GSM interference considerably reduces OPEX (up to 80 % potential
    savings compared to standard analysis)
►   Unique scanner for 5G NR, GSM, WCDMA, CDMA2000® 1xEV-DO, WiMAX™, LTE,
    NB‑IoT/Cat NB1 and TETRA in all bands and decoding of broadcast information

                                                   R&S®ROMES4 running on a tablet
                                                   with an R&S®TSMA6 scanner.

                                                                            Rohde & Schwarz R&S®ROMES4 Drive Test Software 5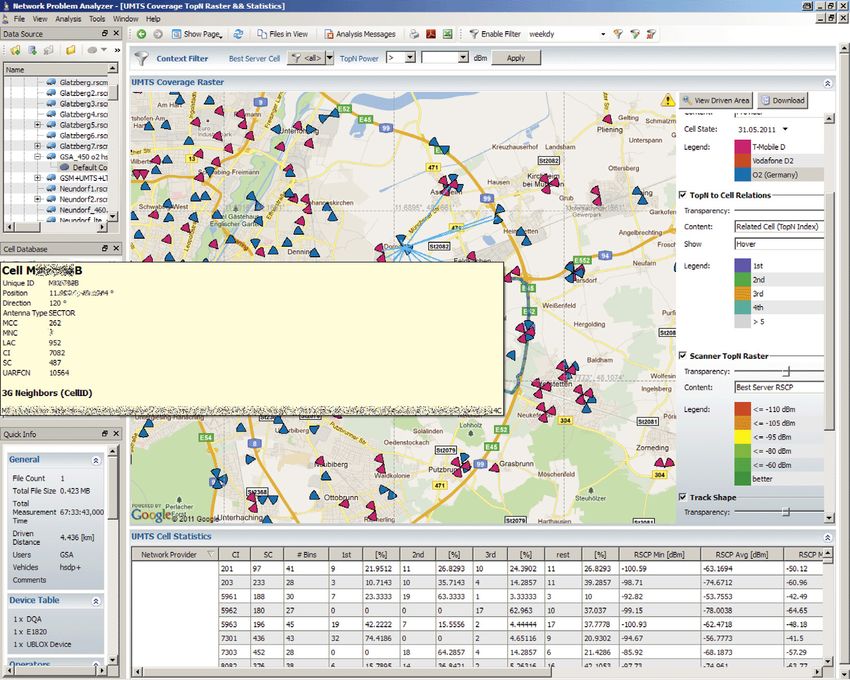
EASY OPERATION AND HIGH FLEXIBILITY
Easy-to-use interface that adapts to the user's level of Easy system configuration with device manager and wizards
knowledge Multiple wizards help users configure a test mobile
Featuring different user levels, R&S®ROMES4 can adapt to phone in order to perform application tests such as FTP
the user's level of knowledge. The different levels make it or HTTP downloads. In just three quick steps, the user
possible to adjust the displayed views and signals to what is ready to start testing. The device manager integrated
is most important for the individual user. Experienced and in R&S®ROMES4 automatically finds and displays all
novice users alike finish their work faster. connected test mobile phones and R&S®TSMx scanner
options. With just three mouse clicks, the user can config-
Ready to use in no time thanks to predefined workspaces and ure numerous application tests such as an FTP download.
composite signals After successfully loading the drivers, R&S®ROMES4
Users can create a workspace in which to store all settings automatically opens a selection of important windows that
and loaded drivers. At the start of a new drive test, all they display measured data. The test can then be started.
need to do is load this workspace and the test system is
immediately ready to use. To further simplify and speed
up this procedure, users can create a project. A project
contains all the settings of a workspace and reduces the
overall volume of the modules to be loaded when the
software is started. The startup wizard makes it possible to
fully automatically load and start a project, workspace or
test file.
Quick overview thanks to automatic channel detection.
6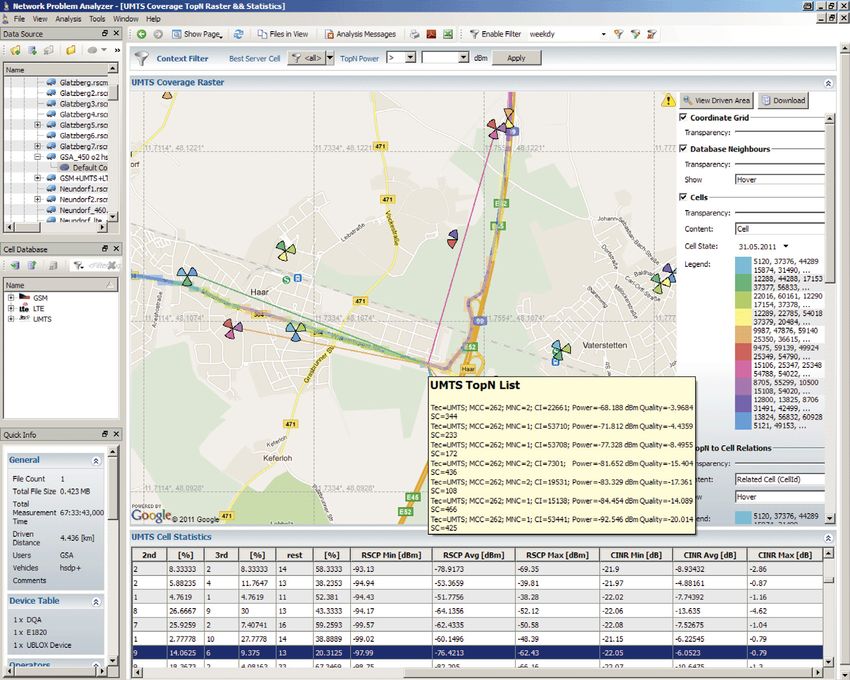
Fast setup due to automatic channel detection Powerful analysis tools
The R&S®ROMES4ACD automatic channel detection When multiple, long drive tests need to be automatically
feature enables the R&S®TSMW and R&S®TSMx drive evaluated for network errors and the cause for these errors
test scanners to automatically detect active channels determined, the R&S®ROMES4NPA network problem
in a specified band. 5G NR, LTE, UMTS, CDMA2000®/ analyzer is the ideal tool. The base module for displaying
1xEV‑DO, TETRA and NB-IoT networks are supported. ETSI key performance indicators (KPI) and providing an
The feature can be optionally enhanced by a spectrum overview of the data in the measurement files is included
scan that significantly speeds up the detection process. with R&S®ROMES4. Optional modules for dedicated error
This feature eliminates the need to set up channel lists analysis of voice or data calls automatically evaluate and
prior to a measurement campaign. The measurement display the error causes. Other modules enable analysis of
system dynamically identifies new channels and adds coverage test data and neighborhood relationships as well
them to the workspace during the drive. This is particularly as delta and comparative analysis. LTE MIMO measure-
relevant in networks deployed in a shared spectrum with ments can also be analyzed and evaluated (see page 38
other cellular standards, where channel frequency and for more details).
channel bandwidth frequently change.
Support of numerous map data formats
In addition to the MapInfo map data format, R&S®ROMES4
also supports OpenStreetMap (OSM). Once downloaded,
maps are also available offline. This is particularly import-
ant when testing data calls to ensure that measurement
results are not affected by map downloads. Measurement
results can be exported in ASCII format or converted to a
Google Earth format. With the Google Earth format, a drive
test can be displayed on a map with no additional effort.
OpenStreetMap (OSM)
OpenStreetMap (OSM) is a user-editable world map that is available
at the following Internet address: http://www.openstreetmap.org/
OSM is a wiki project in which users can participate by uploading
and editing geographical information such as GPS tracking data or
the course of a road or river. This world map is growing daily.
OpenStreetMap data can be used freely under the terms of the
Creative Commons Attribution-ShareAlike 2.0 license.
Rohde & Schwarz R&S®ROMES4 Drive Test Software 7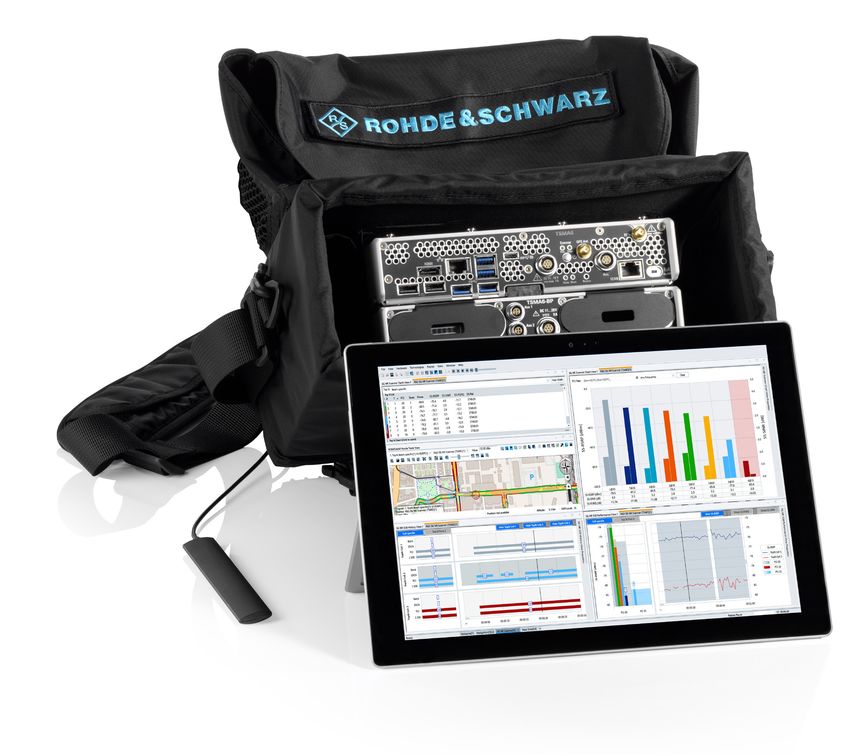
5G NR NETWORK TESTING
5G NR is expected to become the leading radio access
Requirements technology in mobile networks during the next few years.
► R&S®ROMES4 New use cases such as ultra high speed internet access,
► R&S®TSME6 or R&S®TSMA6 scanner with massive numbers of connected devices and low latency
R&S®TSME6-K50/R&S®TSMA6-K50 option connections require a completely new radio interface com-
► R&S®ROMES4T1E scanner driver pared to LTE. This leads to a very flexible physical layer
► For 5G NR mmWave measurements: that can be adapted to different use cases to enhance
R&S®TSME30DC/R&S®TSME44DC ultracompact network availability and maximize quality of service – from
downconverter and R&S®ROMES4T30D downconverter low latency to ultra high data rate applications.
hardware driver
► Qualcomm UE support: Another essential building block of the 5G NR physical
Snapdragon X55 modem up to 5G: R&S®R4QCBASE20 layer is the use of beamforming technology. It is the key
► Samsung UE support: to overcoming the issue of higher path loss due to oper-
Exynos 990 up to 5G: R&S®R4SGBASE20 ating on higher frequencies. Beamforming is even used
for synchronization signals that UEs traditionally use to
synchronize with the network. In 5G NR, synchroniza-
tion signals are also used for channel quality estimations,
which are the basis for establishing effective data
transmissions.
Measurement setup example for 5G NR.
8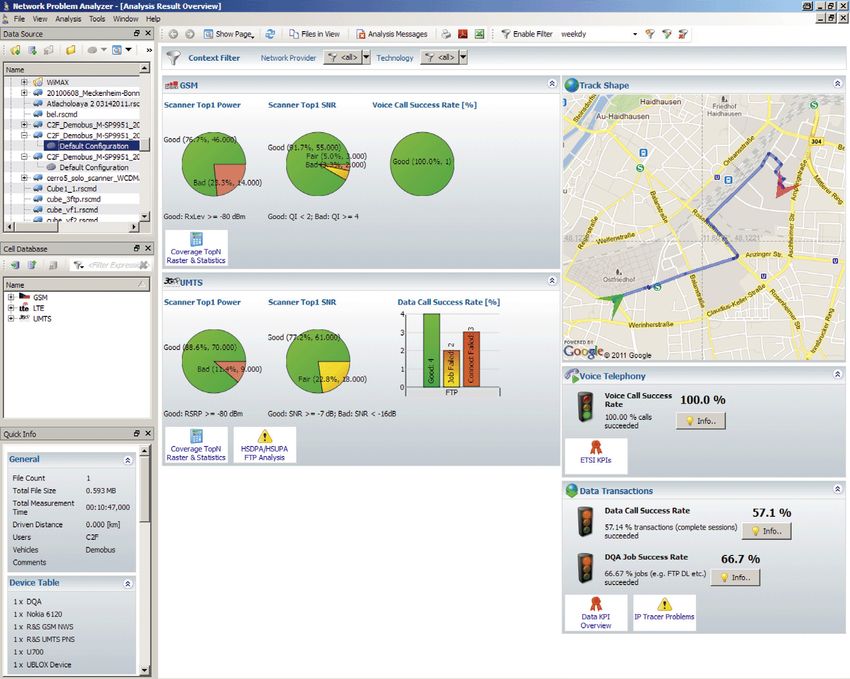
Analysis of 5G scanner measurements on 5G NR 5G NR UE measurements
synchronization signal blocks (SSB) With UE-specific options (listed under Requirements at the
With the R&S®TSME6-K50 or R&S®TSMA6-K50 option, beginning of this chapter), users are able to perform mea-
users can measure 5G NR synchronization signal blocks surements for both non-standalone (NSA) and standalone
(SSB) and decode the PBCH/MIB content of each detected (SA) mode. 5G NR UE NSA support provides LTE informa-
SSB. 5G NR SSB measurements help verify 5G NR cov- tion related to 5G as well as the 5G specific NR serving cell
erage and the effect of beamforming, which is a very information such as NR DL ARFCN, PCI and SSB index, L1
complex technology with several components involved. measurement values such as RSRP and RSRQ, L2 PDSCH
Each SSB can be transmitted on different beams (depend- and PUSCH information, L3 signaling together with ser-
ing on the network configuration), which can be decoded vices testing data, CSI-RS or 5G carrier aggregation related
by the scanner. With different SSBs and beams, the metrics. In addition to complete layer 3 and NAS layer
scanner results become three dimensional: power, signal- message decoding, an intelligent event view provides
to-noise and interference measurements for each PCI and insight into specific 5G NSA/SA network events (such as
SSB/beam index deliver a complete set of data to verify RRC reconfigurations or SCG link failures).
the transmission of each SSB/beam. 5G NR SSB mea
surements are supported for all SSB subcarrier spacings 5G SA and 4G/5G dynamic spectrum sharing (DSS) mea-
and transmission cases defined for sub-6 GHz bands (FR1) surements with Qualcomm X55/Exynos 990 based UE
and mmWave bands (FR2) from 24 GHz to 44 GHz, where connected to R&S®ROMES4 are fully supported. This
a downconverter is needed. capability makes it easy to investigate different aspects
of 5G SA network functionality (access procedure via
Validation of dynamic spectrum sharing (DSS) network layer 3 messages, mobility events, QoS/QoE), as well as
functionality is also supported in combination with scan- DSS related parameters (DSS band and frequency, ratio of
ners, which are able to deliver accurate measurements of traffic carried over 4G versus traffic carried over 5G).
both LTE and 5G broadcast channels if the DSS feature is
activated. Another scanner capability is verification of 5G
TDD synchronization accuracy by delivering accurate time
of arrival measurements.
R&S®ROMES4 5G NR GUI displaying the results measured with the R&S®TSME6 scanner.
Rohde & Schwarz R&S®ROMES4 Drive Test Software 9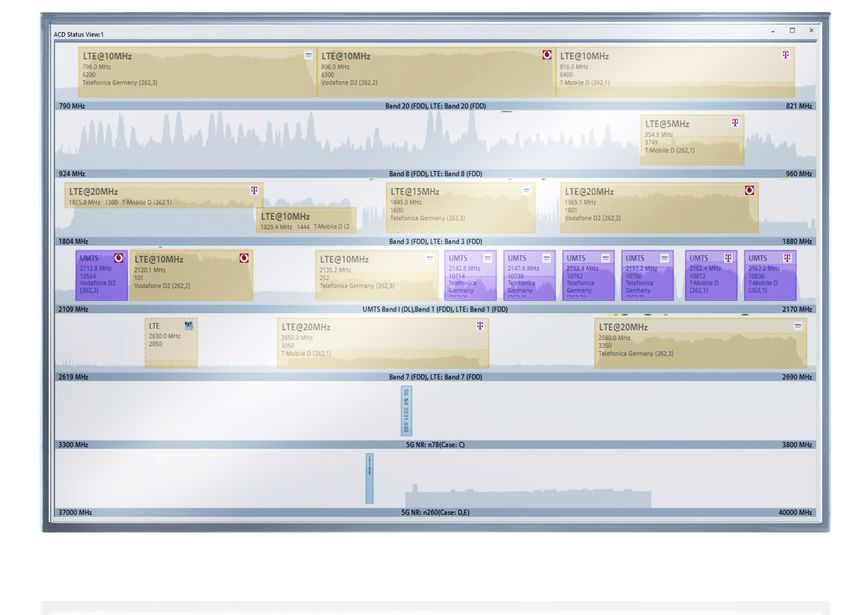
NUMEROUS APPLICATION TESTS
Innovative on-device testing with a smartphone
Requirements When used together with a suitable QualiPoc Android
► R&S®ROMES4 phone, the R&S®ROMES4QP smartphone option sends all
► Test mobile phone of the messages and analyses directly to the smartphone.
► Appropriate Samsung or Qualcomm chipset drivers (for This ensures an almost exact simulation of user b ehavior.
connecting devices to R&S®ROMES4), depending on R&S®ROMES4 GUI makes configuration easy and conve-
whether a rooted or unrooted/unmodified device is used nient. Up to six wired devices can be controlled in parallel.
Depending on the device, voice quality analyses and
VoLTE measurements can be performed in addition to data
tests (incl. carrier a
ggregation). R&S®ROMES4 includes
Creation of different application jobs the following jobs, which can also be assigned to a job
Mobile data calls are the standard today. It is therefore list: email, ping, FTP, HTTP, HTTP capacity test, Iperf3,
essential that data services be optimized with respect Call2AnyNumber, double-ended voice quality, MOC DL
to quality and data throughput. This requires tools that voice quality, network performance tests and applica-
can be used to configure, display and evaluate the differ- tion testing such as YouTube, OTT services, Facebook or
ent data measurements and packet-switched services. WhatsApp.
R&S®ROMES4 offers three different test solutions that are
based on differing test concepts. The QualiPoc Android phone can also be used as a stand-
alone device, for instance for indoor measurements. This
Data throughput measurement on a PC increases the flexibility and saves costs, since only one
The R&S®ROMES4 data quality analyzer (DQA) makes it device is needed.
possible to perform data tests using a commercially avail-
able mobile device (mobile phone, data stick), where the Innovative on-device testing with commercial smartphones
mobile device either acts as a modem or is connected Today’s applications often caIl for very high-speed mobile
via NDIS. The test is evaluated on a PC. This ensures that data transfer, where a USB connection can be a limiting
the latest devices are always used for testing and enables factor. To overcome that limitation, R&S®ROMES4 sup-
a fast response to new technologies such as LTE car- ports on-device testing for unmodified commercial or
rier a ggregation or 5G NR testing. DQA jobs can be run precommercial Android smartphones. Users can test data
in parallel so that users need just a few mouse clicks to throughput directly on the device without the limitations
generate the high data loads required for LTE CA and start imposed by a USB connection. For example, tests can be
testing. By a ppropriately linking parallel and sequential performed on precommercial devices during initial testing
jobs, the behavior of internet users can be simulated. The of new features (e.g. carrier aggregation 1), licensed-
R&S®ROMES4 data quality analyzer supports the following assisted access (LAA) and MIMO 4x4) in the lab or field.
applications, which can be combined in an individual job The R&S®ROMES4 data quality analyzer supports on-de-
list: SMS, email (POP3 and IMAP), ping, UDP, FTP, HTTP vice testing in both ADB mode for FTP, HTTP and capacity
and video streaming. tests and QualiPoc unrooted mode, where R&S®ROMES4
executes a QualiPoc installation on the connected com-
mercial smartphone, delivering DQA tests (Wi-Fi, VoLTE,
ping, messaging and POLQA call tests) in addition to those
provided in ADB mode.
1)
Up to 8 aggregated carriers supported.
The QoS report view reveals the status of data and voice tests.
10The QualiPoc Android phone can also be used as a standalone device.
Output of KPIs and the most important network parameters
in a report
Automatic real-time analysis generates multiple reports
containing key benchmark data. ETSI KPIs are calculated
automatically.
Rohde & Schwarz R&S®ROMES4 Drive Test Software 11AUTOMATIC HANDOVER AND
NEIGHBORHOOD ANALYSIS
Improvement of network coverage
Requirements Unlike test mobile phones, the R&S®TSMx scanners see
► R&S®ROMES4 all signals. These signals can be allocated to the relevant
► R&S®ROMES4HOA neighboring cells. R&S®ROMES4 is thus able to auto-
► R&S®TSMW, R&S®TSME or R&S®TSMA scanner matically compare the measured data from the scanners
► R&S®TSMx GSM/UMTS scanner and the test mobile phones against a base station list to
► R&S®ROMES4T1W or R&S®ROMES4T1E scanner driver identify any missing neighboring cells. These missing cells
► Test mobile phone may originate during the setup of a network and, in the
► Chipset drivers for connecting devices to R&S®ROMES4 worst case, can terminate a call.
The SIB analyzer integrated in R&S®ROMES4 compares
the neighboring cells measured by the scanner against
Automatic detection of missing neighboring cells during those in the base station list. Neighboring cells that were
drive testing detected but do not appear in the list are marked in yel-
Automatic neighborhood analysis is based on a base low, indicating a missing neighborhood. This automatic
station list and the base stations' broadcast signals that neighborhood analysis works for UMTS; a compara-
are decoded by the R&S®TSMx scanners. These system ble functionality exists for GSM. Both work in real time.
information blocks (UMTS and LTE) or system informa- For TETRA and LTE, this functionality is included in the
tion types (GSM) include information that is normally used R&S®ROMES4NPA network problem analyzer (see page
by test mobile phones to identify and monitor relevant 25).
neighboring cells. The report containing the measured
values of the neighbor channels is forwarded to the
base station. If necessary, the base station can use this
response to initiate a handover.
Detecting a missing neighborhood at a glance.
12TESTING OF VOICE QUALITY – INCL. VoLTE
Complete end-to-end measurement from the user perspective
Requirements The measurements can be performed using a fixed‑
► R&S®ROMES4 network station, usually a voice-quality server, or another
► R&S®ROMES4QP mobile phone. The mobile phone reflects the quality as
experienced by a mobile user and also permits HD voice
measurements. In contrast, a fixed-network station serves
as a reference, enabling the cause of a poor MOS to be
User-friendly configuration for checking voice quality found more quickly.
Mobile networks face increasingly high quality demands.
For testing voice quality, R&S®ROMES4 o ffers an inno- Based on POLQA standard
vative, full-featured, end-to-end solution that exactly The R&S®ROMES4QP option and a suitable QualiPoc
simulates user behavior. Android QA can be used to measure calls for the down-
link and uplink. For the downlink, the server replays a
The test mobile phone is connected to the R&S®ROMES4 reference voice signal, and the QualiPoc Android QA
via USB and configured using a job list. A POLQA algo- connected to R&S®ROMES4 evaluates this received signal.
rithm (ITU-T P.863) evaluates the voice quality directly on For the uplink, the R&S®ROMES4 test system replays a
the phone. The results are displayed live in R&S®ROMES4. voice s ignal and the server uses a POLQA algorithm to
The greater the difference between the transmitted voice evaluate it.
signal and the reference signal, the poorer the voice
quality. This is indicated by the usual mean opinion score Following a drive test, the measured data can be merged
(MOS) and can lie between 1 (poor) and 5 (very good). so that the uplink and downlink measurements are avail-
able in one log file. The merge process can be skipped if
two phones connected to R&S®ROMES4 call each other.
Voice quality measurement (MOS) with a Samsung Galaxy S5.
Rohde & Schwarz R&S®ROMES4 Drive Test Software 13LTE BROADCAST (EMBMS) NETWORK
OPTIMIZATION
Enabling broadcast in an LTE network poses challenges
Requirements for the network operator. It is necessary to ensure con-
► R&S®ROMES4 tinued high-quality unicast services and simultaneously
► R&S®TSMW scanner with R&S®TSMW-K29 and provide high-performance broadcast services. The broad-
R&S®TSMW-K32, or R&S®TSME scanner with cast network consists of a virtual single frequency network
R&S®TSME-K29 and R&S®TSME-K32, or (SFN) inside the LTE network, where a set of eNodeBs that
R&S®TSMA scanner with R&S®TSMA-K29 and are part of the same broadcast area transmit the same
R&S®TSMA-K32 downlink signal at the same time. This requires accurate
► R&S®ROMES4T1W or R&S®ROMES4T1E scanner driver eNodeB synchronization, which is typically not the case in
► Chipset drivers for connecting devices to R&S®ROMES4 LTE-FDD networks. In addition, intersymbol interference
becomes important in the SFN.
The eMBMS f eature already makes use of the extended
R&S®ROMES4 in combination with a Rohde & Schwarz LTE cyclic prefix, but when planning and commissioning the
scanner and an LTE eMBMS test mobile broadcast network, it is crucial to validate that the network
LTE broadcast, using the evolved multimedia broadcast footprint at the given operating frequency does not lead to
multicast service (eMBMS) feature of LTE, allows opera- intersymbol interference.
tors to more efficiently provide services to a large number
of subscribers. Instead of transmitting video and data R&S®ROMES4 in combination with an LTE scanner,
content separately to individual users, broadcast saves such as R&S®TSMW, R&S®TSME or R&S®TSMA, and
network resources, making it attractive for areas such as an eMBMS capable test mobile is the ideal solution for
event venues where a multitude of subscribers request the optimizing such a network.
same type of content.
Typical measurement setup with R&S®ROMES4,
R&S®TSMA and an eMBMS smartphone.
14Network planning Network configuration check
With the scanner, the LTE network can be baselined in The scanner decodes the SIB2 and SIB13 broadcast
the planning phase, and the network synchronization can messages that include information on the eMBMS con-
be checked against GPS. This allows the network p lanner figuration in the network, such as MBSFN subframe
to predict potential areas of intersymbol interference and configuration from SIB2 and MCCH configuration per
allows planning of the MBSFN area IDs, similar to PCI MBSFN area from SIB13. Engineers can check that the
planning in an LTE unicast network. network is configured correctly in the field.
Network rollout Network performance validation
During the network rollout and tuning of the broadcast While the scanner allows optimization of the RF environ-
network, the scanner can measure the power (RSRP) and ment, it is also crucial to validate the network performance
quality (SINR) of each MBSFN area. The engineer can then with a test mobile. R&S®ROMES4 supports eMBMS test
check the validity of the network planning by comparing it mobiles with a Qualcomm chipset, so the engineer can
to the results from the field. test the connection to the eMBMS network, view layer 3
and flute messages, capture the IP trace and analyze prob-
Intersymbol interference detection lems in the broadcast network. While testing eMBMS, it
The scanner can also be used to detect intersymbol inter is important to continue testing the unicast services (data
ference. Due to the impulse response measurement and VoLTE) to ensure that service quality stays at a high
per PCI, it can also detect which eNodeB is causing this level when introducing the eMBMS feature.
interference, allowing the engineer to take corrective
measures.
R&S®ROMES4 eMBMS scanner view with intersymbol interference analysis.
Rohde & Schwarz R&S®ROMES4 Drive Test Software 15NB-IOT/CAT NB1 AND LTE-M
MEASUREMENTS
For coverage validation, troubleshooting and optimization,
Requirements R&S®ROMES4 in combination with a Rohde & Schwarz
► R&S®ROMES4 scanner delivers signal power, signal quality, and carrier to
► R&S®TSMW scanner with interference and noise ratio (CINR) measurements for each
R&S®TSMW-K29 and R&S®TSMW-K34/R&S®TSMW-K35, or available physical cell ID.
R&S®TSME scanner with
R&S®TSME-K29 and R&S®TSME-K34/R&S®TSME-K35, or Support of all operating modes defined in
R&S®TSMA scanner with NB-IoT/Cat NB1
R&S®TSMA-K29 and R&S®TSMA-K34/R&S®TSME-K35 The NB-IoT/Cat NB1 standard defines three operating
► R&S®ROMES4T1W or R&S®ROMES4T1E scanner driver modes to integrate NB-IoT carriers efficiently into the
► R&S®ROMES4NBQ for Qualcomm NB-IoT UE support available spectrum. R&S®ROMES4 supports all three
► R&S®ROMES4NBN for Neul NB-IoT UE support modes. The LTE in-band mode makes the most efficient
use of the available spectrum. In this mode, one NB-IoT
carrier uses the spectrum of one LTE PRB. The other
operating modes – guard-band and standalone – allow
Combination with a Rohde & Schwarz scanner NB‑IoT deployments independently of the LTE spectrum.
In combination with an R&S®TSMW, R&S®TSME or
R&S®TSMA scanner, R&S®ROMES4 enables IoT mea- Simultaneous measurements of NB-IoT and other technologies
surements in both NB‑IoT and LTE-M networks. NB‑IoT/ NB-IoT measurements can be performed simultaneously
Cat NB1 and LTE-M are 3GPP standards for connecting a with measurements for other technologies such as
huge number of things such as smart meters to the inter- GSM, LTE or (W)CDMA. During network optimization or
net (IoT). troubleshooting, the impact of the NB-IoT spectrum on
adjacent GSM/LTE/(W)CDMA spectra and vice versa can
While traditional LTE standards are mainly aimed at be validated.
increasing throughput and network capacity, NB‑IoT/
Cat NB1 and LTE-M focus on low power consumption
for IoT devices and highest availability of the connecting
links, especially indoors. Indoor measurements require
lightweight, ultracompact scanners with low power
consumption.
NB-IoT RACH
retransmission.
16NB-IoT scanner TopN view
PCI, power and carrier to Frame structure type, cyclic Power, quality, CINR and RSSI based on
interference and noise ratio prefix information and NB‑IoT reference signal measurements for both
(CINR) based on S-SYNC carrier center frequency eNodeB antenna ports (TX0, TX1)
Total power received
inside the NB-IoT carrier
bandwidth (received
signal strength indicator,
RSSI)
TopN chart, received power bar for each PCI
NB-IoT scanner TopN signals. NB-IoT UE overview view.
Rohde & Schwarz R&S®ROMES4 Drive Test Software 17Layer 3 decoding It additionally provides information about NB-IoT s pecific
The NB-IoT scanner supports layer 3 BCH demodula- features such as cellular IoT (CIoT), coverage enhance-
tion (MIB/SIB1). Layer 3 BCH data offers deep network ment levels (CE) and eDRX. Dedicated NB efficiency
configuration insight and helps optimize troubleshoot- KPIs offer analysis of the used energy and transmission
ing. Demodulation is performed on the fly during efficiency as power consumption is a key NB-IoT metric.
standard NB‑IoT synchronization and reference signal
measurements. LTE-M (Cat M1/eMTC) support
LTE-M is fully compatible with existing LTE networks.
BCH/broadcast messages include master information R&S®ROMES4 supports LTE-M measurements in combi-
block (MIB) and system information block (SIB) messages. nation with both a scanner and an LTE-M device. LTE-M is
They are demodulated for each cell/PCI and displayed in a standardized for the LTE in-band mode only. By performing
tree structure in the new NB-IoT scanner BCH view. subband measurements with a Rohde & Schwarz scan-
ner, it is possible to evaluate the RF conditions for each
Combination with an NB-IoT UE LTE-M narrowband or identify e.g. the best narrowband for
In combination with an NB-IoT UE, R&S®ROMES4 enables LTE-M data transmission. In combination with an LTE-M
network performance and service quality measurements device, R&S®ROMES4 can deliver traditional UE based
in NB-IoT/Cat NB1 networks. This setup permits tradi- mobile network measurements (UL/DL RF conditions,
tional mobile network testing measurements such as RF UE state, operator information, serving cell information,
conditions (including serving cell allocation and identity, RACH procedure). LTE-M specific measurements sup-
downlink (DL) and uplink (UL) channel performance), the ported by R&S®ROMES4 include, for example, decoding
random access channel (RACH) procedure and various eDRX, power save mode and coverage enhancement (CE)
jobs executed directly on the NB-IoT stick (e.g. FTP jobs mode parameters.
executed on the device).
NB-IoT measurements with R&S®ROMES4
and t he R&S®TSMA autonomous mobile n etwork scanner.
18FULL OVERVIEW OF LAYER 1 AND LAYER 3
Display of mobile phone activities in layers 1 and 3
Requirements The basic functionality of R&S®ROMES4 in combination
► R&S®ROMES4 with the required test mobile phone drivers provides a
► Test mobile phone large amount of information from layers 1 and 3. Users
► Chipset driver for connecting devices to R&S®ROMES4 can investigate various procedures executed in 5G and
other technologies at a glance. An important functionality
for 5G – NAS layer message decoding – is also fully sup-
ported and enables comprehensive investigation of 5G SA
procedures.
If at the same time measurements are taken by a scan-
ner, the scanner’s measured data is displayed in the same
window, allowing a direct comparison. Layer 3 View dis-
plays all layer 3 protocol messages, sorted by uplink and
downlink. Each message is decoded and can be opened if
necessary.
Fast analysis of interrupted connections
In addition to protocol messages, interrupted/blocked and
successful connections are also displayed. When jumping
to a trouble spot, all views will show measurements taken
at this point in time. This makes it considerably easier to
find the cause of a problem. In addition, a filter function
in Layer 3 View enables users to evaluate only specific
messages.
EN-DC layer 3 protocol messages and RRC parameters.
Rohde & Schwarz R&S®ROMES4 Drive Test Software 19PARALLEL SPECTRUM MEASUREMENT
Detection of broadband interferers, neighborhood interference
Requirements and uplink activities
► R&S®ROMES4 The waterfall diagram gives the user a general idea of
► R&S®TSMx scanner with R&S®TSMW-K27 RF power scan the air interface and its history. This makes it very easy
► R&S®TSME scanner with R&S®TSME-K27 RF power scan to locate broadband interferers or external interference.
► R&S®TSMA scanner with R&S®TSMA-K27 RF power scan All the user needs to do is move the mouse pointer over
► R&S®ROMES4T1W or R&S®ROMES4T1E scanner driver the waterfall diagram. At any desired spot, timestamp
and frequency are displayed, enabling the user to find the
center frequency of an unknown signal faster.
Broadband spectrum measurement The spectrum function is based on FFT analysis. Various
In combination with an R&S®TSMW, R&S®TSME or FFT sizes allow users to set measurement bandwidths
R&S®TSMA scanner, R&S®ROMES4 can be used to down to min. 140 Hz. The smaller the measurement band-
perform a spectrum scan. The user can select up to width, the greater the measurement accuracy. This permits
32 frequency ranges from 80 MHz to 3 GHz (R&S®TSMW: very fast spectrum measurements without the usual
30 MHz to 6 GHz; R&S®TSME/R&S®TSMA: 350 MHz sweep time of a normal spectrum analyzer. Fast measure-
to 4.4 GHz). The frequency range is not limited. ments are especially important during drive tests in order
R&S®ROMES4 offers different display options, e.g. enve- to obtain a sufficiently high density of results during the
lope spectrum measurement, RMS, peak or a predefined drive.
channel mask. In this case, the power per channel is
displayed. A special threshold value is provided for monitoring the
spectrum. Spectra that do not show any test points above
Marker functions make it easy to precisely measure this threshold value are not displayed. Any data that is not
dedicated frequencies and detect changes. A marker can of interest is not recorded.
also be defined as a reference and compared against the
maximum value. Frequency markers and the entire spectrum can be
exported in the ASCII format.
Spectrum measurement
Five user-selectable frequency ranges
for spectrum measurements
Zoom display of one of the five ranges
(here the first range “0” from 80 MHz to 2.5 GHz)
Waterfall display of selected range
20LOCATION ESTIMATION OF 2G/3G/LTE/5G
AND NB-IoT BASE STATIONS
Creation of a base station list during a drive test
Requirements The R&S®TSMW, R&S®TSME and R&S®TSMA scanners
► R&S®ROMES4 enable users to estimate the geographic position of base
► R&S®ROMES4LOC stations. This can even be done for 5G, LTE, WCDMA,
► R&S®TSMW or R&S®TSME or R&S®TSMA scanner GSM, CDMA2000® 1xEV-DO and NB-IoT base stations in
► R&S®ROMES4T1W or R&S®ROMES4T1E scanner driver parallel.
Requires only scanners and GPS
For the calculation algorithm, all that is needed are
the measurement parameters from a highly accurate
GPS receiver with output of the PPS time reference
signal (pre‑installed in the R&S®TSMW, R&S®TSME and
R&S®TSMA) and from the 2G/3G/4G scanner.
The R&S®ROMES4 software and the R&S®ROMES4LOC
driver allow the scanners not only to detect the main levels
of the BTS (2G: RxLev, 3G: RSCP, 4G/5G: RSRP) but also to
demodulate the broadcast channels (BCH). Important time
information as well as details of the transmitting BTS are
thus obtained.
The maximum likelihood method is used to calculate
the geographic position of the individual BTS from the
measured data provided by the GPS receiver, BCH time
information and level changes during the drive test.
Following the drive test, the calculation results are
exported to a base station list and the located base
stations are displayed on an underlying street map.
Selecting the BTS opens another window in which the
characteristic data of the BTS is displayed.
The calculated position of a BTS lies within an error ellipse
(approx. 200 m) that is also exported. Base stations can be
filtered based on the accuracy of location estimation.
Results of the measured geographic position of base stations using the
R&S®ROMES4 software and the R&S®ROMES4LOC driver.
Rohde & Schwarz R&S®ROMES4 Drive Test Software 21GSM INTERFERENCE ANALYSIS WITH
AUTOMATIC INTERFERER IDENTIFICATION
Automatic measurement and identification of interferers from
Requirements own GSM mobile network
► R&S®ROMES4 R&S®ROMES4 allows GSM interference to be determined
► R&S®ROMES4COI automatically and clearly from the own GSM network
► R&S®TSMx GSM scanner during the drive test. The actual interferers can be dis-
► R&S®ROMES4T1W or R&S®ROMES4T1E scanner driver played on the underlying street map in Route Track View.
► Test mobile phone This makes it considerably easier to use the software and
► Chipset driver for connecting devices to R&S®ROMES4 perform tests, reducing costs dramatically in comparison
with conventional methods.
The evaluation is performed in three steps:
► Automatic detection of an interference situation (type,
length, location)
► Automatic analysis of the detected interference (test on
BCCH and TCH)
► Classification of the actual interferers on the basis of the
individual interference situation and pinpointing of the
interferers on the street map (interfering base station
with channel indication: BCCH, TCH, adjacent channel)
GSM interference analysis with automatic interferer identification – map display.
The map shows the position of the interference (crosshairs), the cell currently providing coverage (S) and the four interfering cells (I1, I2, I3
and I4). The markings N1 to N6 show the current neighboring cells. The color of the route indicates the received signal strength of the
GSM mobile phone.
22To optimize interference analysis, more than just selectable Detection of adjacent-channel and co-channel interferers
trigger thresholds (e.g. RxLevFull, RxLevSub, R xQualFull, The combination of scanner and test mobile phone can
RxQualSub, FER) are used. Some of the test mobile even be used to measure the power in the time slots being
phones supported by R&S®ROMES4 also provide a C/I used (TCH, TS Time Slot), making it possible to identify not
value for the traffic channels being used (TCH). Because only interfering BCCH channels but also TCH interferers.
the SIM connection only allows the test mobile phone
to see the data from the allocated mobile network, and
because it is not very RF‑sensitive, the use of high-grade
scanners is absolutely essential.
Evaluation of BCCH and TCH channels allows full‑featured
analysis
The R&S®TSMW, R&S®TSME and R&S®TSMA scanners are
able to instantly detect all s elected RF channels (BCCH)
and demodulate the BCH information. As a result, all the
data from the BTS transmitting the signals is available. This
is especially relevant when performing measurements in
the vicinity of national borders (faulty frequency allocation,
roaming, etc.).
GSM interference analysis with automatic interferer identification – detailed display.
Eight interference situations were detected during the drive (bottom window). The interference marked on the map was 17.7 s in
duration and extended over a distance of 75.8 m. The BCCH of the cell providing coverage is c hannel 38; the interference occurred
on TCH 45.
The upper part of the screen shows the scanner measurements from channel 45 of the cell providing coverage (green) as well as the
measurement of the interferers (red). The list shows the individual interferers together with the measured signal strength, the identifi-
cation of the cell and its distance to the location of the interference.
Rohde & Schwarz R&S®ROMES4 Drive Test Software 23INDOOR MEASUREMENTS
Combined indoor/outdoor measurements
Requirements The R&S®ROMES4IND indoor driver option provides a
► R&S®ROMES4 separate means of navigation that makes it possible to dis-
► R&S®ROMES4IND play positions on a floor plan. Measurements can be t aken
► Test mobile phone and/or scanner at specific points (hot spots, e.g. in conference rooms)
► Chipset driver for connecting devices to R&S®ROMES4 or along a specific path (continuous, e.g. in a corridor).
Combined DUTs (comprising buildings and outdoor areas
such as company premises) can be optimally measured
and georeferenced. The software also displays a smooth
Stationary or moving measurements indoors without a transition to areas covered by GPS. Measurements of
GPS signal multi-floor buildings are easily handled by displaying the
High-quality wireless communications coverage inside various floors as multiple layers on the map. The wide
buildings, e.g. at airports, shopping malls and exhibition support of georeferenced and non-georeferenced map
halls, is gaining in significance, especially with respect formats (tab, jpg, tif, bmp, png) and included import
to data traffic. Since GPS reception indoors is limited or functionalities for iBwave ibwc and AutoCAD DXF files
nonexistent, R&S®ROMES4 offers an alternative to conven- simplifies and speeds up daily work. The layer that corre-
tional navigation display (GPS data on a map). sponds to the floor where the user is located is visible on
the map. The complete integration of the indoor function-
ality into the R&S®ROMES4 map display allows intuitive
operation.
Display of a floor plan in hot spot mode.
24R&S®ROMES4NPA: ANALYSIS AND
EVALUATION OF NETWORK PROBLEMS
Sophisticated algorithms to support users
Requirements The easy-to-use interface guides the user through the
► R&S®ROMES4NPA (included in R&S®ROMES4 or standalone) process, from reading in the measured data (from one
► R&S®ROMES4N11 or more drive tests) and selecting the analysis criteria to
► R&S®ROMES4N15 retrieving the automatically generated list of trouble spots.
► R&S®ROMES4N17
► R&S®ROMES4N18 Right-clicking a problem automatically opens
► R&S®ROMES4N19 R&S®ROMES4 and positions the replay of the measure-
► R&S®ROMES4N20 ment file just ahead of the trouble spot in question so that
► R&S®ROMES4N21 the user can perform a detailed check if required. The
► R&S®ROMES4N22 result is displayed in HTML in a clear report that can be
► R&S®ROMES4N23 printed. An export to Excel allows easy data processing.
► R&S®ROMES4N30
► R&S®ROMES4N31 The measurement data is analyzed according to specific
► R&S®ROMES4N34 criteria that depend on the modules selected. In all mod-
ules, the analysis criteria can be adapted to user-specific
limit values and settings.
Automatic detection, analysis and documentation of trouble The R&S®ROMES4NPA base package includes the
spots following modules:
The sheer volume of recorded data makes individual and ► NQA (network quality analyzer) for voice calls, base
manual analysis impossible. The data (from R&S®ROMES4 module including KPIs
or QP files, after conversion in the latter case) is therefore ► DQA (data quality analyzer) for PS data connections,
automatically analyzed by the R&S®ROMES4NPA net- base module including KPIs
work problem analyzer, which outputs a list of all detected
trouble spots and displays them on a map using Google
Maps, OpenStreetMap (OSM) or user-defined maps.
R&S®ROMES4NPA also provides information about the
cause of the problem.
Start screen of R&S®ROMES4NPA.
Rohde & Schwarz R&S®ROMES4 Drive Test Software 25Broad range of optional add-on modules for voice quality and R&S®ROMES4N17
data tests as well as coverage and neighborhood analysis Neighborhood analysis module for automatic classification of
R&S®ROMES4N11 neighborhood relationships into one of the following categories
NQA for GSM/WCDMA/TETRA voice calls, expansion for problem ► (Potentially) missing neighbor: a cell with high signal
spot detection strength and good quality (both thresholds can be set)
This module enables analysis of voice calls for network has been measured but is not contained in the currently
problems, which can be selected from more than 140 defined neighbors
different problem categories, and delivers a list of the ► Unused neighbor: a cell is configured as a neighbor but
problem spots including the type and cause of problem. has not been detected during measurement
► Approved neighbor: a cell has been classified as a
R&S®ROMES4N15 (potentially) missing neighbor and is contained in
Coverage module with display of coverage data on a raster map the neighbor list. Analysis of intra‑RAT handover in
Coverage data (GSM, WCDMA, CDMA2000® 1xEV-DO, the network problem analyzer (NPA) is available for
TETRA, LTE, LTE‑M) measured with Rohde & Schwarz GSM, UMTS, LTE and TETRA. Inter-RAT handovers are
scanners is rasterized and displayed on a map using currently limited to GSM and UMTS, but will soon be
Google Maps or OpenStreetMap (OSM). This makes it available for LTE as well.
easy to generate coverage plots and create and visualize
overshooting problems. Optimizations can be checked
using a before-and-after comparison.
Initial overview of scanner measurement content.
26R&S®ROMES4N18 R&S®ROMES4N19
Spectrum analysis module for automatic detection of strong BTS evaluation – summary of key BTS parameters as acceptance
transmitters in a spectrum thought to be empty criteria
► Easy verification that a purchased spectrum is clear and To ensure a consistently high degree of network quality,
that no other emitter still occupies part of that band continual improvements must be made to the mobile net-
► Fast confirmation that part of a spectrum can be used work, such as updating the parameters for a mobile base
for refarming purposes station, replacing hardware or adding new base stations.
► Reliable observation of power scan measurements, Each time such improvements are made, the effects on
similar to a spectrum analyzer neighboring base stations as well as the mobile network
► Automated and configurable (bandwidth, duration, as a whole must be documented and evaluated. The
power) analysis from potential narrowband and BTS evaluation on the NPA performs these tasks reliably,
wideband interferers quickly and cost-effectively.
► Detailed analysis by drilling down to the corresponding
measurement file R&S®ROMES4N20
Data module for EDGE, HSPA+, LTE and LTE‑M data links
including problem spot detection
This module offers specific analysis of high-speed data
links for achievable data rates and analysis of poten-
tial problems as well as an IP data analyzer for analyzing
IP-based data traffic and associated problems. When
IP-based data services are used, e.g. web browsing or
email, this module analyzes the results and shows prob-
lem spots and their cause. A comprehensive collection of
different analyses specifically designed for LTE is available.
Display of all neighbors of a cell.
Rohde & Schwarz R&S®ROMES4 Drive Test Software 27R&S®ROMES4N21 R&S®ROMES4N23
Carrier aggregation analysis (downlink) Carrier aggregation analysis (uplink)
As the use of data is increasing exponentially, mobile As the use of data is increasing exponentially, mobile
networks need to provide higher-speed data links to networks need to provide higher-speed data links to their
their customers. When downlink carrier aggregation customers. When uplink carrier aggregation is used to pro-
is used to provide this capability, this module analyzes vide this capability, this module analyzes the results and
the results and shows detailed information such as shows detailed information such as how many carriers a
how many carriers are assigned to a mobile phone and mobile phone uses in uplink as well as the uplink through-
its downlink and uplink throughputs. It also provides put and number of resource blocks used.
statistics (RSRP, RSRQ, etc.) for each carrier as well for
investigation purposes. R&S®ROMES4N30
Delta and comparative analysis of R&S®ROMES4
R&S®ROMES4N22 measurement data
VoLTE analysis This add-on module enables quick comparison of mea-
LTE is also increasingly used for voice transmission. surement data, for example for visualizing the effects of
IP-based telephony via VoLTE places higher demands on an implemented network optimization. Measurement data
network quality because users have less tolerance for from different cells, UEs or operators can also be com-
poor voice call quality, such as dropped calls, than they pared for benchmarking.
do for data calls. This module automatically analyzes SIP
and layer 3 messages as well as call setup KPIs and spots
problems if there are timing issues at the SIP level.
Display of the cells providing coverage on the map.
28R&S®ROMES4N31 R&S®ROMES4N34
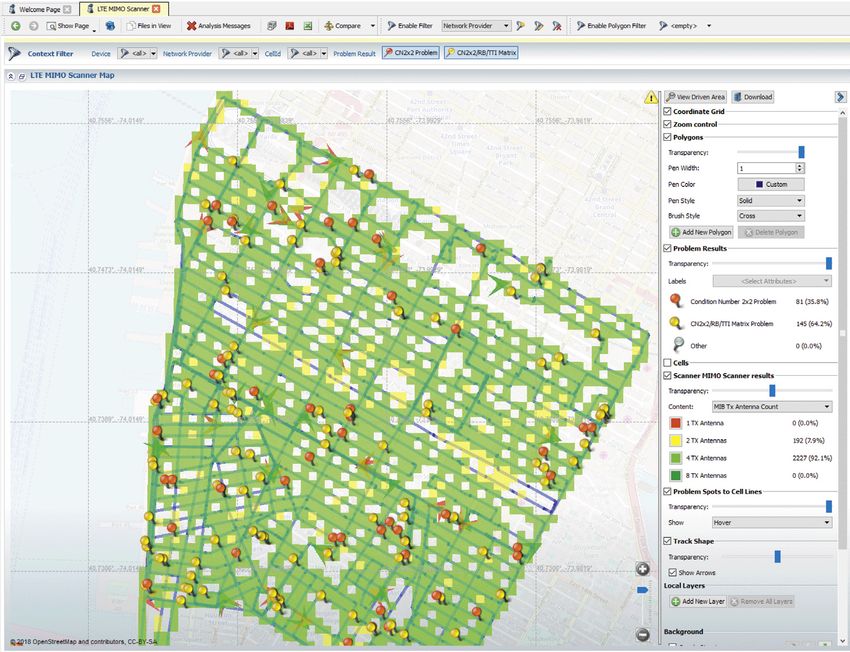
LTE MIMO and downlink allocation analyzer NB-IoT analyzer
LTE MIMO analysis is performed based on the condi- This module delivers dedicated coverage and problem spot
tion number (CN) and rank indicator (RI) values measured reporting as well as cell statistics for NB-IoT analysis based
by the scanner. If mobile device data is available for on scanner measurements.
the analysis, the efficiency per Hz or resource block is
also included in the analysis. Any inconsistencies in R&S®ROMES4N35
the condition number, efficiency per resource block or NB-IoT UE analyzer
condition number matrix are displayed as problem spots This module delivers dedicated coverage and problem spot
on the map and designated in tables. reporting as well as cell statistics for NB-IoT analysis based
on UE measurements.
The result analysis from the downlink allocation analyzer
lists the cell throughput per TTI and operator as well as
maximum and average cell throughput in a table and
graphically.
NPA analysis identifies LTE MIMO problems based on scanner and smartphone measurements.
Rohde & Schwarz R&S®ROMES4 Drive Test Software 29Comprehensive set of reporting functions Automated analysis with R&S®ROMES4NPA considerably
If multiple drive tests are selected, the user can draw saves time and reduces costs. Optimizing the results no
statistical conclusions about quality in the measured areas. longer requires time-consuming manual checks and analy-
A comparison between various network operators in the sis of data that may not even contain any problems.
same area is also possible (benchmarking).
R&S®ROMES4NPA uses sophisticated algorithms to help
A further way to evaluate analysis results in greater detail users find problem causes. More in-depth analyses can
is to use sophisticated filter algorithms (e.g. for examining be performed at any time. A large amount of measured
only one operator/one cell or only specific times or days of data can be automatically and quickly processed; reports
the week). The dynamic context filter algorithm makes this (for management and for general documentation) are
even easier and faster. For analyzing dedicated geograph- generated without requiring user interaction.
ical areas, polygon filters can easily be drawn on the map.
The result analysis and statistics are automatically tuned to
the active filters.
Random access statistics distributed on CE level as part of the analysis enabled by the NB-IoT analyzer.
30LTE neighborhood analysis: map, list of the actual, possible and unused neighbors of several cells.
LTE handover analysis: map, KPIs and detailed list.
Rohde & Schwarz R&S®ROMES4 Drive Test Software 31SYSTEM CONFIGURATION FOR VARIOUS
APPLICATION SCENARIOS
R&S®FR4 Freerider 4 backpack
The R&S®FR4 Freerider 4 backpack is a compact, light-
weight backpack for walk test and drive test campaigns.
Supporting for up to 12 test mobile phones and high-per-
formance scanner measurements (including 5G mmWave
R&S®FR4-CORE with mounted and LTE 4x4 MIMO), it is ideal for network optimization,
mobile phones and scanner. benchmarking and cellular network analysis. Its benefits
include the following:
Well thought-out product design
Flexible design
The backpack can be operated from a tablet or laptop via
Wi-Fi to control the measurement application running
on a built-in PC (R&S®NCM2) or an R&S®TSMA6 scan-
ner. A cabled LAN or USB connection is also p ossible
via the integrated LAN switch or optional USB hub. With
the R&S®FR4 Freerider 4, a complete and compact drive
test system can be temporarily installed in a rental car,
significantly reducing the setup time for measurement
campaigns. The sturdy construction is shock and vibration
proof in line with automotive standards and can be used in
any vehicle type.
User-specific cabling.
32Maximum flexibility and future readiness Designed for the toughest environmental conditions
Extensive test mobile support The system has been designed for indoor and outdoor use.
The R&S®FR4 Freerider 4 supports up to 12 test mobile Active ventilation with silent fans allows operation in hot
phones, which can be charged via the optional, integrated climates. The coating protects the backpack against splash
USB hub. water ingress in rainy conditions, and the light color of the
coating minimizes the impact of solar radiation.
Scanner and technology support
The R&S®FR4 fully supports the R&S®TSMx scanner R&S®ROMES4 configurations
family as well as GSM, WCDMA, CDMA2000® 1xEV‑DO, R&S®ROMES4 and the connected measuring equipment
WiMAX™, LTE, NB-IoT, LTE-M, PowerScan RF, (test mobile phones, R&S®TSMx scanners, etc.) can also
CW channel power scan and 5G NR. be used and delivered in the following configurations on
For the 5G NR mmWave bands, it offers a measurement request:
bandwidth of up to 100 MHz. LTE MIMO measurements ► User-specific cabling
support up to 4x4 MIMO. ► As a test suitcase
► As a turnkey test vehicle
► As a TETRA backpack solution based on the
R&S®MNT-CORE2.
R&S®FR4-BP backpack.
Turnkey test vehicle.
Rohde & Schwarz R&S®ROMES4 Drive Test Software 33R&S®FR4 Freerider 4 specifications in brief
Environmental conditions
0 °C to +50 °C
Temperature operating temperature range
permissible temperature range –10 °C to +55 °C 1)
storage temperature range –40 °C to +55 °C
+25 °C/+55 °C, < 95 % relative humidity, cyclic,
Damp heat
non-condensing, in line with EN 60068-2-14
► power in
Connectors ► 5 × LAN (5)
► 16 × USB (optional)
Power rating
Supply voltage, DC 10 V to 19 V
equipped with R&S®NCM2;
Power consumption during operation 2 R&S®TSME6, 8 UEs performing a real typ. 90 W
measuring task
Maximum inrush current 11 A at 19 V
Product conformity
applied harmonized standards:
► EN 55032: 2012/EN 61326-1: 2006
(home location, class B)
Electromagnetic compatibility EU: in line with EMC directive 2004/108/EC
► EN 55024: 2010
► EN 61000-6-2: 2005/EN 61326
(industrial location, class B)
Electrical safety EU: in line with directive 2014/35/EU EN 61010-1
USA UL 61010-1
485 mm × 356 mm × 146 mm
Dimensions R&S®FR4-CORE (layer 1 and 2)
(19.1 in × 14.0 in × 5.7 in)
R&S®FR4-CORE plus R&S®FR4-EXTEND 485 mm × 356 mm × 191 mm
(layer 1 to 3) (19.1 in × 14.0 in × 7.5 in)
Weight depends on installed devices
without devices/batteries, layer 1 and 2 approx. 3.2 kg (7.1 lb)
without devices/batteries, layer 1 to 3 approx. 4.0 kg (8.8 lb)
typical weight 7.9 kg (17.4 lb)
(1 × R&S®TSMA6 and 4 × test mobiles)
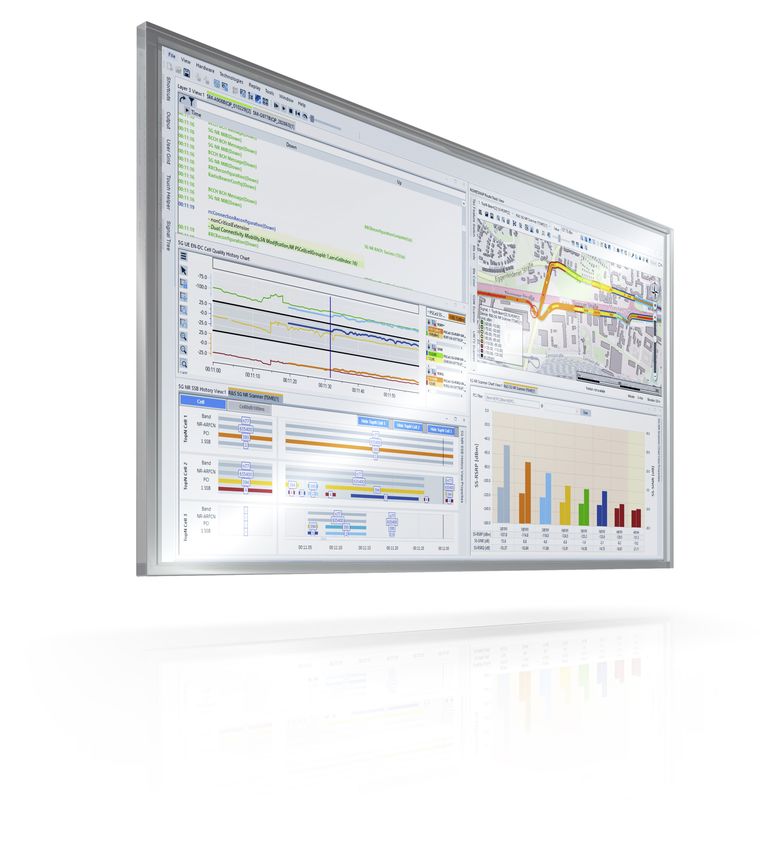
R&S®FR4 Freerider 4 is optimized for the software applications R&S®ROMES4, SmartBenchmarker and R&S®NESTOR.
Only one of them can be installed.
1)
The maximum operating temperature may be lowered by the maximum stable operating temperature of the installed UEs and devices.
34You can also read