Temporal and Spatial Monitoring of Cyanobacterial Blooms at Willow Creek Reservoir, North-Central Oregon
←
→
Page content transcription
If your browser does not render page correctly, please read the page content below
Prepared in cooperation with the U.S. Army Corps of Engineers

Temporal and Spatial Monitoring of Cyanobacterial Blooms
at Willow Creek Reservoir, North-Central Oregon

Scientific Investigations Report 2018–5083

U.S. Department of the Interior
U.S. Geological Survey
Cover: An algal surface accumulation occurring in the northwestern corner of Willow Creek Reservoir,
north-central, Oregon, September 23, 2015, at 1009 PDT. Photograph by U.S. Geological Survey.
Temporal and Spatial Monitoring of
Cyanobacterial Blooms at Willow Creek
Reservoir, North-Central Oregon
By Cassandra D. Smith

Prepared in cooperation with the U.S. Army Corps of Engineers

Scientific Investigations Report 2018–5083

U.S. Department of the Interior
U.S. Geological Survey
U.S. Department of the Interior
RYAN K. ZINKE, Secretary

U.S. Geological Survey
James F. Reilly II, Director

U.S. Geological Survey, Reston, Virginia: 2018

For more information on the USGS—the Federal source for science about the Earth, its natural and living
resources, natural hazards, and the environment—visit https://www.usgs.gov/ or call 1–888–ASK–USGS.
For an overview of USGS information products, including maps, imagery, and publications,
visit https:/store.usgs.gov.

Any use of trade, firm, or product names is for descriptive purposes only and does not imply endorsement by the
U.S. Government.

Although this information product, for the most part, is in the public domain, it also may contain copyrighted materials
as noted in the text. Permission to reproduce copyrighted items must be secured from the copyright owner.

Suggested citation:
Smith, C.D., 2018, Temporal and spatial monitoring of cyanobacterial blooms at Willow Creek Reservoir,
north-central Oregon: U.S. Geological Survey Scientific Investigations Report 2018–5083, 26 p.,
https://doi.org/10.3133/sir20185083.

SSN 2328-0328 (online)
iii

Contents
Abstract............................................................................................................................................................1
Introduction.....................................................................................................................................................1
     Purpose and Scope...............................................................................................................................3
     Description of Study Area ...................................................................................................................3
Data Collection................................................................................................................................................4
     Northwestern Corner Continuous Water-Quality Monitoring........................................................4
     Camera Monitoring................................................................................................................................5
     Spatial Mapping ....................................................................................................................................6
Water-Quality Analyses and Data Visualization .......................................................................................8
     Northwestern Corner Continuous Water-Quality Monitoring Results..........................................8
     Camera Monitoring Results...............................................................................................................12
     Camera and Instrument Results........................................................................................................15
     Spatial Mapping Results.....................................................................................................................15
Temporal and Spatial Monitoring of Cyanobacterial Blooms................................................................19
Summary and Conclusions..........................................................................................................................24
Acknowledgments........................................................................................................................................24
References Cited..........................................................................................................................................25

Figures
         1.     Map showing Willow Creek Reservoir near the town of Heppner, Oregon .......................4
         2.     Aerial image showing locations of a surveillance camera and the five camera
                image positions at Willow Creek Reservoir, north-central Oregon.......................................6
         3.     Aerial image of surface transects for mapping water quality in Willow Creek
                Reservoir, north-central Oregon.................................................................................................7
         4.     Graph showing hourly pH and dissolved oxygen percent saturation data during
                May–September 2015 at the fixed location in the northwestern corner of Willow
                Creek Reservoir, north-central Oregon......................................................................................9
         5.     Graph showing hourly total chlorophyll and turbidity data during May–September
                2015 at the fixed location in the northwestern corner of Willow Creek Reservoir,
                north-central Oregon..................................................................................................................10
         6.     Graph showing median, 10th–90th percentiles, and the 25th–75th percentiles for
                blue-green algae―phycocyanin data collected during May–September 2015 at
                the fixed location in the northwestern corner of Willow Creek Reservoir,
                north-central Oregon..................................................................................................................11
         7.     Two images of a cyanobacterial bloom in Willow Creek Reservoir taken
                15 minutes apart from the same position on May 21, 2015...................................................12
         8.     Images taken by the Axis 214 camera in the northwestern corner of Willow Creek
                Reservoir, north-central Oregon, showing four types of image quality..............................13
         9.     Images taken by the Axis 214 camera in the northwestern corner of Willow Creek
                Reservoir, north-central Oregon, showing functionality of website...................................14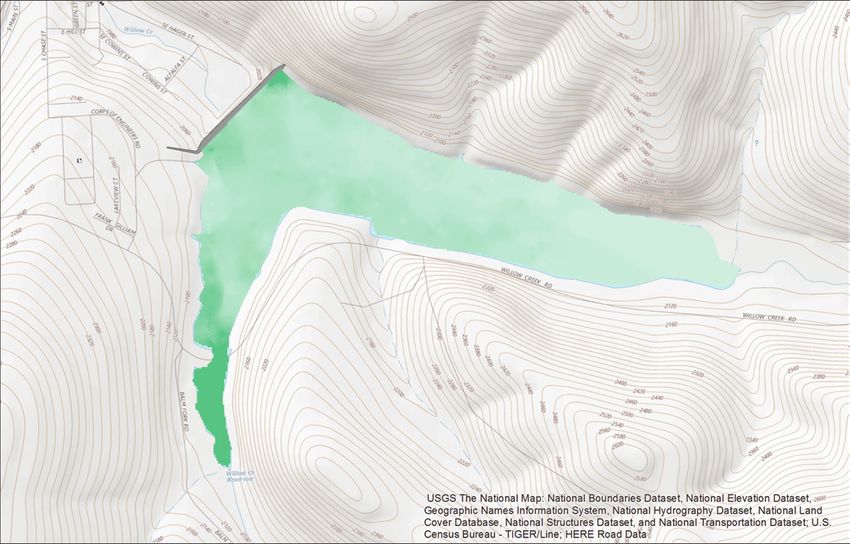
iv
Figures—Continued
10. Graph showing comparison of the total chlorophyll data from the continuous
water-quality instrument and the camera images.................................................................16
11. A colorized map representing relative total chlorophyll concentrations throughout
the reservoir at 1.5 feet deep on September 16, 2016, from 1150 and 1400 PDT...............17
12. A colorized map representing water temperature throughout the reservoir at
1.5 feet deep on September 16, 2016, from 1150 to 1400 PDT...............................................18
13. A colorized map representing relative blue-green algae―phycocyanin
concentrations throughout the reservoir at 1.5 feet deep on September 16, 2016,
from 1150 and 1400 PDT..............................................................................................................19
14. An algal surface accumulation occurring in the northwestern corner of Willow
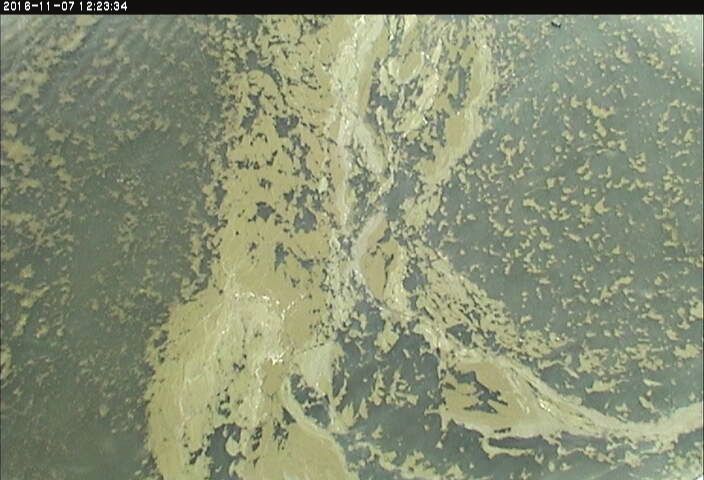
Creek Reservoir, north-central, Oregon, November 7, 2016, at 1223 PST..........................20
15. An algal bloom occurring along the dam face in Willow Creek Reservoir,
north-central Oregon, September 26, 2016, at 1150 PDT.......................................................21
16. An algal surface accumulation occurring in the northwestern corner of Willow
Creek Reservoir, north-central Oregon, September 28, 2016, at 1048 PDT........................22
17. A boat paddles through an algal bloom occurring in the northwestern corner of
Willow Creek Reservoir, north-central Oregon, October 10, 2016, at 1109 PDT................23
Tables
1. Descriptions of type of equipment, type of data collected, and dates of data
collection during 2015 and 2016 field seasons at Willow Creek Reservoir,
north-central Oregon ...................................................................................................................5
2. Comparison of the YSI EXO2 multi-parameter water-quality readings measured
at the same location in Willow Creek Reservoir, north-central Oregon,
June 9, 2015 .................................................................................................................................15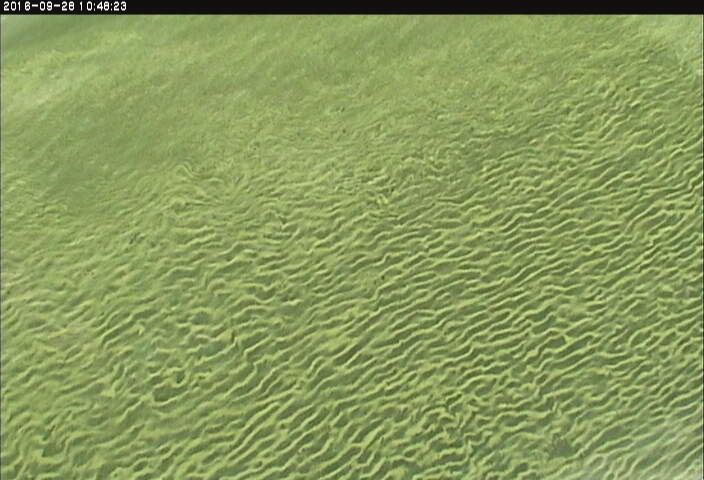
v

Conversion Factors
U.S. customary units to International System of Units

              Multiply                              By                             To obtain
                                                        Length
 inch (in.)                                             2.54           centimeter (cm)
 inch (in.)                                         25.4               millimeter (mm)
 foot (ft)                                              0.3048         meter (m)
 mile (mi)                                              1.609          kilometer (km)
                                                         Area
 acre                                           4,047                  square meter (m2)
 acre                                                   0.4047         hectare (ha)
 acre                                                   0.4047         square hectometer (hm2)
 acre                                                   0.004047       square kilometer (km2)
                                                        Volume
 acre-foot (acre-ft)                            1,233                  cubic meter (m3)
 acre-foot (acre-ft)                                    0.001233       cubic hectometer (hm3)
                                                        Speed
 mile per hour (mi/h)                                   1.609          kilometer per hour (km/h)

Temperature in degrees Celsius (°C) may be converted to degrees Fahrenheit (°F) as follows:
                                               °F = (1.8 × °C) + 32.

Datum
Horizontal coordinate information is referenced to the North American Datum of 1983 (NAD 83).

Supplemental Information
Specific conductance is given in microsiemens per centimeter at 25 degrees Celsius
(µS/cm at 25 °C).
Concentrations of chemical constituents in water are given in either milligrams per liter (mg/L)
or micrograms per liter (µg/L).
Temporal and Spatial Monitoring of Cyanobacterial
Blooms at Willow Creek Reservoir, North-Central Oregon
By Cassandra D. Smith

Abstract                                                         blooms on water quality and revealing potential restoration
                                                                 benchmarks for the freshwater reservoir. The spatially
     The U.S. Geological Survey (USGS) and U.S. Army             integrated mapping data showed the variation in water quality
Corps of Engineers (USACE) investigated the spatial and          across the reservoir that occurs during blooms and baseline
temporal dynamics of cyanobacterial (blue-green algal)           conditions and indicated regions of the reservoir to focus
blooms in Willow Creek Reservoir in north-central Oregon         restoration efforts. Additional spatial data collection can be
in 2015–16. A combination of cameras and water-quality           timed to collect daily extremes.
monitoring equipment was used to assess the frequency                 The camera deployment in 2016 demonstrated that
and duration of blooms and their effects on water quality. A     telemetering images from remote sites is possible and
surveillance camera captured color images every 15 minutes       provides valuable and timely information. Monitoring with a
during daylight hours of the northwestern corner of Willow       surveillance camera is inexpensive and supplies data regarding
Creek Reservoir, where surface blooms tend to accumulate         surface-bloom presence or absence. The use of a camera can
due to the prevailing summer winds. In 2015, a water-quality     help target site visits to periods when blooms are observed,
instrument was deployed in the northwestern corner of the        which may increase the accuracy of beginning and ending
reservoir to continuously measure water temperature, pH,         dates for water body closures.
dissolved oxygen, specific conductance, turbidity, total              Monitoring cyanobacterial blooms in Willow
chlorophyll, and the blue-green algae pigment phycocyanin.       Creek Reservoir with multiple devices provided a more
In 2016, a water-quality instrument was used to collect          comprehensive dataset than any one monitoring method.
measurements along transects throughout the reservoir to         The camera images showed when a surface bloom initiated
create spatial maps of water quality. The spatially integrated   and dissipated while the water-quality instrument revealed
mapping process was repeated on three different days under       the magnitude, or potential severity, of the effects on water
varying algal conditions. Also in 2016, a telemetry connection   quality.
was established allowing resource managers to view the
reservoir images in near-real time.
     Results from 2015 indicate that surface accumulations       Introduction
of cyanobacteria can form and dissipate within minutes in the
reservoir, and that blooms can cause substantial changes to           Cyanobacteria, also known as blue-green algae, are
water quality. A persistent cyanobacterial bloom in August and   photosynthetic bacteria that are ubiquitous in aquatic
September 2015 resulted in pH values of 9.5 standard units,      ecosystems around the world (Falconer and Humpage,
220 percent oxygen saturation, and pronounced increases in       2005). When exposed to ideal conditions, cyanobacteria can
turbidity and total chlorophyll. The stationary water-quality    proliferate and form blooms, which can be defined by high cell
instrument collected data during periods with and without        densities, visible surface accumulations (appearing as green
blooms, increasing our understanding of the effects of           scum), or by the dominance of a single or few species. In this
2  Temporal and Spatial Monitoring of Cyanobacterial Blooms at Willow Creek Reservoir, North-Central Oregon

report, the term “bloom” is used to refer to high algal biomass    and time-intensive, as many water bodies used for recreation
or the resulting surface scums or accumulations. Blooms affect     are in remote areas. Therefore, discrete toxin sampling is often
ecosystem health by altering food webs and causing hypoxia         infrequent (for example, biweekly) or does not occur.
(Paerl and others, 2011). Some genera of cyanobacteria                   Recent monitoring techniques have utilized satellite
have the capacity to produce toxins that can cause animal          imagery to detect algal biomass occurrence, spatial extent, and
deaths and acute and chronic human health issues (Falconer,        trends (Stumpf, 2001; Urquhart and others, 2017). Satellite
1991; Carmichael and others, 2001; Chen and others, 2009).         sensors that distinguish cyanobacterial wavelengths and are
Cyanobacterial blooms are not always toxin-producing               available to the public (such as the European Space Agency’s
(Vézie and others, 1998), but blooms indicate the potential        MERIS) can be valuable tools. However, satellite monitoring
for an abundance of organisms with the ability to produce          can be inconclusive or problematic due to satellite flyover
cyanotoxins (Graham and others, 2009). Cyanobacterial              intervals, cloud cover, or imagery resolution. Remote sensing
harmful algal blooms, commonly referred to as CyanoHABs,           using a coarse resolution (ex: Landsat 8 with 30-m pixels) can
negatively impact the economy by increasing water treatment        obscure finer scale spatial trends in bloom occurrence, and this
costs at drinking water intakes and through the loss of            problem is compounded with smaller water bodies. There is
recreational revenue due to water body closures and aesthetics     a need to develop a monitoring approach that is inexpensive,
(U.S. Environmental Protection Agency, 2015).                      high frequency (to characterize algal biomass dynamics), and
      Factors that influence cyanobacterial blooms include         can be implemented in remote water bodies of all sizes.
temperature, nutrient availability, wind/mixing, water                   Deploying a color surveillance camera is one monitoring
chemistry, and site-specific traits (Chorus and Bartram,           method that can address the problems of infrequent site visits
1999; Briand and others, 2003; Anderson and others, 2012;          and the resolution and periodicity of remote imagery flyovers.
Van der Merwe and Price, 2015). The combination of those           Programmable color surveillance cameras with appropriate
factors will affect the temporal and spatial characteristics of    lenses and pan/tilt/zoom capabilities take pictures at multiple
the bloom (Anderson and others, 2012). Water bodies with           angles and can save them locally, as well as transmit them via
warm, eutrophic water experiencing calm weather may have           cellular connection. These images could indicate the presence
intense or prolonged blooms (Kanoshina and others, 2003),          of a surface bloom, and short image intervals would show
especially if cyanobacterial blooms have occurred in that          the onset, duration, and dissipation. Continuously monitoring
water body in the past. Specific cyanobacterial cells (known       water chemistry could also provide timely indications that a
as akinetes) can persist from year to year, making it difficult    bloom is occurring. A continuous water-quality instrument
to break the seasonal bloom trend (Falconer and Humpage,           can measure temperature, pH, dissolved oxygen, specific
2005). Population growth and increased nutrient runoff,            conductance, turbidity, total chlorophyll, and blue-green
coupled with warmer temperatures, may cause an increase in         algae―phycocyanin (BGA-PC; a pigment specific to
the frequency and duration of cyanobacterial blooms in the         cyanobacteria) parameters to both confirm the imagery and
future.                                                            provide the physicochemical context for the occurrence of the
      The U.S. Environmental Protection Agency (EPA)               blooms.
established recreational guidelines for cyanotoxins, which               Some water-quality parameters can influence
recommend that swimming advisories be posted if microcystin        cyanobacterial blooms, and multiple parameters are affected
and cylindrospermopsin concentrations exceed 4 and 8 µg/L,         by blooms. Growth rates of cyanobacteria increase in warm
respectively (U.S. Environmental Protection Agency, 2017).         water temperatures (Johnk and others, 2008), and monitoring
Technology is rapidly evolving in this field, but at the present   water temperature data may indicate when high algal biomass
time, inexpensive and reliable sensors that can be deployed        is likely to occur. Cyanobacteria photosynthesize and respire
to detect cyanotoxins are not available. Collecting discrete       in the presence of light but only respire in the absence of
samples for toxins, cell count, and taxonomic identification       sunlight. Photosynthesis and respiration rates result in daily
is currently the most common way to identify a HAB and to          cycles in dissolved oxygen concentrations and pH, and
issue an advisory or water body closure (Graham and others,        the presence of a bloom often increases the magnitude and
2009). The Oregon Health Authority (2016) recommends that          the variation of the daily data (Maberly, 1996; Staehr and
samples are collected when temperatures are warm and from          others, 2010). Biological activity including photosynthesis
locations where humans and animals would likely contact            and respiration can affect the percent oxygen saturation,
the water. In States that do not receive Federal funding for       and high algal biomass can result in readings greater than
toxin sampling, the ability to sample the impaired water body      100 percent while algal die-offs may result in hypoxic and
and to post closures depends on management decisions in            anoxic conditions.
allocation of State resources. Toxin sampling can be costly
Introduction 3
Discharge and runoff events transport suspended Plateau ecoregion. This region is characterized by a plateau
sediment and nutrients (nitrogen and phosphorus) that can of Columbia River Basalt, few trees, and loess deposits of
promote bloom occurrence. Turbidity is an optical property varying thickness that are farmed. The area surrounding the
of water that is influenced by suspended particles and reservoir includes numerous farms that primarily cultivate
dissolved compounds (Wagner and others, 2006). While wheat.
turbidity sensors effectively measure the light-scattering Willow Creek Dam was built in 1983 by the USACE for
effects of fine, reflective particles in the water column, algal flood risk reduction, and the dam impounds Willow Creek
filaments and colonies also may be detected (Sadar, 1998). and Balm Fork Creek to create Willow Creek Reservoir. The
Algal and cyanobacterial blooms with high cell densities 125‑acre reservoir can hold a maximum of 13,250 acre-ft
can increase turbidity in a water body (Paerl and Huisman, of water, and USGS operates streamgages (U.S. Geological
2008), and water-quality data can reflect a positive correlation Survey, 2018a) on an incoming tributary (streamgage No.
with turbidity and cyanobacteria abundance. Chlorophyll 14034470), the outflow from the dam (streamgage No.
concentrations increase as photosynthetic biomass (green 14034500), and historically operated a stream gage on the
algae and blue-green algae) increases, and BGA-PC increases other incoming tributary (streamgage No. 14034480).
as cyanobacteria abundance increases. Monitoring chlorophyll Willow Creek Reservoir contains high total phosphorus
and BGA-PC fluorescence shows relative patterns when concentrations, potentially due to high phosphorus
cyanobacteria are proliferating and decreasing. concentrations in the basalt parent material (Abrams and
Willow Creek Reservoir is a recreational destination in Jarrell, 1995; Porder and Ramachandran, 2012), and has
Oregon that is affected by frequent CyanoHABs during the been studied and managed for its frequent cyanobacterial
summer (Harris and others, 2014). Due to the remote location blooms. Water samples collected from 1984 to 1996 were
of the reservoir, a monitoring technique that minimizes site examined by Aquatic Analysts, Incorporated (Larson,
visits and provides near-real time information would assist 1997). Six genera of cyanobacteria were identified including
in decision-making about water body safety and closures. Dolichospermum sp. (formerly Anabaena), Aphanizomenon
This report describes a proof-of-concept monitoring study sp., Chroococcus sp., Gloeotrichia sp., Microcystis sp., and
conducted at Willow Creek Reservoir that used existing Oscillatoria sp. (Larson, 1997). The cyanobacterial blooms
camera technology and water-quality instrumentation and are a concern to resource managers and toxin sampling
tested the utility of information provided to the resource began in the reservoir in 2006 (Harris and others, 2014). The
managers. dominant genus of cyanobacteria during the 2015 and 2016
bloom seasons was Dolichospermum (formerly Anabaena)
or Aphanizomenon, and Green Water Laboratories (Palatka,
Purpose and Scope Florida) documented a shift in the planktonic community from
dominance of Dolichospermum in May 2015 to dominance of
This research was conducted to (1) evaluate multiple
Aphanizomenon in October 2015 (Green Water Laboratories,
monitoring devices and data collection methodology,
unpub. data). Due to the prevailing winds at Willow
(2) establish an early warning system of cyanobacterial
Creek Reservoir, any cyanobacterial surface scums tend to
blooms, and (3) to increase our understanding of
accumulate in the northwestern corner of the reservoir against
cyanobacterial blooms in Willow Creek Reservoir by
the dam.
monitoring the effects of cyanobacterial blooms on the
In addition to the routine toxin sampling, multiple studies
reservoir’s water quality. This report documents the data
have been conducted in the reservoir to increase understanding
collected by USGS from Willow Creek Reservoir in 2015
of the system and to experiment with mitigation techniques.
and 2016 and draws conclusions regarding the utility of the
Researchers constructed large mesocosms in the reservoir and
various monitoring devices, including the circumstances under
manipulated the total nitrogen to total phosphorus (TN:TP)
which they may be most applicable to other water bodies that
ratio. Results indicated that adding ammonium nitrate (to
tend to produce cyanobacterial blooms.
increase the TN:TP) decreased cyanobacteria abundance and
toxin concentration while increasing water clarity (Harris
Description of Study Area and others, 2014). One study experimented with nutrient
removal by deploying solar-powered water-circulating devices
Willow Creek Reservoir is in north-central Oregon in Willow Creek Reservoir, and current research involves
within Morrow County and near the town of Heppner quantifying the phosphorus flux into the reservoir through
(fig. 1). Heppner, Oregon, is in the U.S. EPA-designated sediments (Frank Wilhelm and Sarah Burnet, University of
Columbia Plateau ecoregion, and specifically in the Umatilla Idaho, unpub. data).4 Temporal and Spatial Monitoring of Cyanobacterial Blooms at Willow Creek Reservoir, North-Central Oregon
119°33'30" 119°33' 119°32'30" 119°32' 119°31'30" 119°31'
Map
Wil
area
MORROW
low
COUNTY
C
Heppner
ree
14034500
45°
k
ek
21' OREGON
Cre
Shobe
Will
ow
Cre
ek R
e servo
ir 14034470
Wi
45° ll o w Cre
20' ek
30"
EXPLANATION
Ba 14034480 U.S. Geological Survey
lm
Fo streamgage and No.
45° rk
20'
14034480
Base image from Esri, copyright, 2018. Coordinate reference system: NAD83 0 0.2 0.4 0.6 0.8 1.0 MILES
UTM Zone 10N. Horizontal datum is North American Datum of 1983.
0 0.2 0.4 0.6 0.8 1.0 KILOMETERS
Figure 1. Willow Creek Reservoir near the town of Heppner, Oregon.
Data Collection The water-quality instrument was housed in a 3-ft segment of
PVC pipe, and 1-inch holes were liberally drilled throughout
Multi-parameter water-quality instruments and a color the pipe to allow free-flowing water to the probes. The PVC
surveillance camera were used to collect data regarding algal housing was attached to buoys and was positioned to remain
conditions (table 1). horizontal with the probes 1.5 ft (0.5 m) below the surface of
the water. Chain and concrete anchors were used to keep the
instrument in place; the instrument continued to measure water
Northwestern Corner Continuous Water-Quality generally in the same location as the water level declined
Monitoring throughout the summer season and the extra slack in the chain
allowed the instrument to slightly migrate from the original
A Yellow Springs Instrument (YSI) EXO2 water- location. The instrument was deployed in the northwestern
quality instrument with probes for seven parameters corner of the reservoir where surface blooms accumulate,
(water temperature, specific conductance, pH, dissolved approximately 75 ft from the dam, and directly across from the
oxygen, turbidity, total chlorophyll, and blue-green algae― camera on the dam.
phycocyanin) was programmed to log internally and hourly.
tac18-1227_fig 01Data Collection 5
Table 1. Descriptions of type of equipment, type of data collected, and dates of data collection during 2015 and 2016 field seasons at
Willow Creek Reservoir, north-central Oregon.
[YSI, Yellow Springs Instrument]
Type of equipment Type of data collected Dates of data collection
YSI EXO2 multi-parameter water- Continuous (hourly) water-quality data from one May 13 to Sept. 21, 2015
quality instrument location in the northwestern corner of the reservoir.
Axis 214 color surveillance camera Five images of the northwestern corner of the reservoir May 14 to Nov. 9, 2015 (not telemetered)
every 15 minutes during daylight hours. July 20 to Nov. 22, 2016 (telemetered)
YSI EXO2 multi-parameter water- Spatial water-quality data throughout the reservoir. June 9, 2015; Aug. 17, 2016; Sept. 16, 2016
quality instrument
A clean and calibrated instrument was deployed on Camera Monitoring
May 13, 2015 and monthly site visits were conducted
following standard USGS protocols (Wagner and others, A camera was deployed to observe cyanobacterial
2006). At each site visit, the instrument was cleaned and surface blooms occurring in Willow Creek Reservoir. An Axis
then swapped with a newly calibrated EXO2. During site 214 color surveillance camera was chosen for this proof-
visits, a wide-mouth 1-L polypropylene bottle was inverted of-concept study because it had the ability to pan, tilt, and
in the water next to the instrument probes (1.5 ft deep) and zoom, and was programmable. Additionally, the camera could
filled, taking care to avoid the collection of any surface withstand hot temperatures, could be fitted with a polarizing
scum. The sample water was added to an 8-L polyethylene lens to potentially reduce glare, and was able to either store
churn sample splitter (Wilde and others, 2004), and this images internally or connect to a wireless network to transmit
process was repeated until the churn sample splitter contained images.
approximately 6 L of water. The EXO2 water-quality The camera was positioned above the water and facing
instrument was positioned in the churn sample splitter, and downwards to achieve the desired contrast in colors. The
multiple total chlorophyll readings were logged and averaged. camera was attached to a railing of the Willow Creek Dam in
The composite water sample was homogenized using the the northwestern corner of the reservoir about 70 ft above the
churn paddle and two 1-L subsamples were dispensed from surface of the water. The system was powered by a solar panel
the spigot. The samples were filtered, frozen, and analyzed and large battery, and the camera was programmed to take a
at the USGS Oregon Water Science Center using a Trilogy® series of five pictures every 15 minutes during daylight hours
Laboratory Fluorometer and following EPA Method 445.0 (fig. 2).
In Vitro Determination of Chlorophyll a (Arar and Collins, During 2015, the camera was installed on May 14 and
1997). retrieved on November 9. Site visits occurred at regular
Following site visits, the internally logged instrument intervals and consisted of downloading the stored images and
data were downloaded and the appropriate fouling and troubleshooting any issues. A polarizing lens specific to the
calibration corrections were applied to the data (Wagner and Axis 214 camera was tested from May to July 2015.
other, 2006). Calibration corrections to the total chlorophyll The camera was installed at the same location on July 20,
record were based on the laboratory readings. All continuous 2016, and was retrieved November 22, 2016. Site visits were
water-quality data are available online in the National Water frequent and multiple modems, antenna, and cellular phone
Information System as site 452053119323001 Willow Creek companies were tested to attain consistent telemetry of the
Reservoir NW Corner, OR (U.S. Geological Survey, 2018a). images. A script was created that uploaded the telemetered
images to a public website in near-real time.6 Temporal and Spatial Monitoring of Cyanobacterial Blooms at Willow Creek Reservoir, North-Central Oregon
5
4
3
2
Willow Creek
Reservoir
1
Background image from Google, copyright, 2018. 0 100 200 FEET
0 25 50 METERS
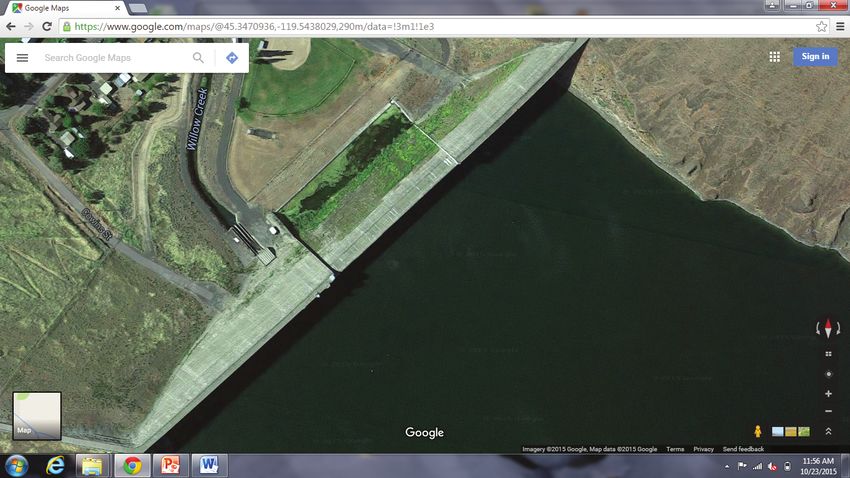
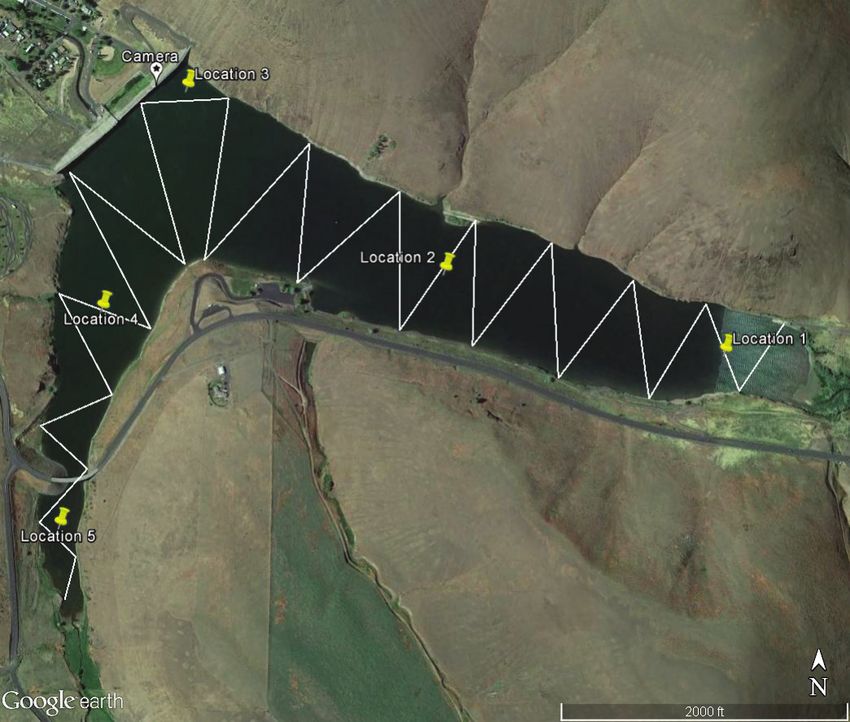
Figure 2. Locations of a surveillance camera and the five camera image positions at Willow Creek Reservoir, north-central Oregon.
The location of the camera on the dam is indicated by the five-pointed star, and the numbered rectangles indicate the approximate area
captured by each camera image. Position number 1 is photographed first, followed by position number 2, and in order through position
number 5. The yellow circle represents the approximate location of the continuous water-quality instrument. Background image is from
Google (https://www.google.com/maps/place/Heppner,+OR+97836/@45.3476167,-119.5439632,409m/data=!3m1!1e3!4m5!3m4!1s0x54bcde
9fefa0ff5f:0x8c43eb5baecaeb35!8m2!3d45.3531842!4d-119.5577997, accessed December 21, 2017).
Spatial Mapping progressed about 2.5 mi/h throughout the reservoir; the speed
was chosen to ensure the probes remained submerged 1.5 ft
Surface water in Willow Creek Reservoir was mapped below the surface. A tablet or Trimble GPS unit recorded
along transects using a water-quality instrument three times the GPS track and logged readings every 3 seconds. The
in 2015–16. A YSI EXO2 multi-parameter instrument was boat roughly followed the GPS track (fig. 3) and traversed
outfitted to measure seven parameters (water temperature, the reservoir without pausing, ending at the eastern end of
specific conductance, pH, dissolved oxygen, turbidity, total the reservoir near location 1. After the track was completed,
chlorophyll, and BGA-PC) and programmed to log internally discrete chlorophyll-a samples were collected at the accessible
every 10 seconds. The weighted, calibrated YSI EXO2 multi- locations (1–5); samples were analyzed at the Oregon Water
parameter instrument was attached to a boat cleat on the right Science Center following the procedures listed above to
side at the front of the boat. The boat began data collection at compare to the instrument measurements.
the southern end of the reservoir near location 5 (fig. 3) and
tac18-1227_fig 02Data Collection 7
Willow
Creek
Reservoir
Willo
w Cree
k Arm
rk Arm
Balm Fo
Background image from Google, copyright, 2018. 0 1,000 FEET
0 250 METERS
Figure 3. Surface transects for mapping water quality in Willow Creek Reservoir, north-central Oregon. The white line denotes
the approximate GPS path the boat followed while logging water-quality parameters with a Yellow Springs Instrument (YSI) EXO2
instrument. The boat returned to locations 1–5 and collected discrete chlorophyll-a water samples. A stationary, continuous instrument
was located at location 3 and a surveillance camera location is symbolized by the white marker with a black star. Willow Creek flows
into the reservoir from the east and Balm Fork Creek flows into the reservoir from the south.
tac18-1227_fig 038 Temporal and Spatial Monitoring of Cyanobacterial Blooms at Willow Creek Reservoir, North-Central Oregon
Water-Quality Analyses and Data chlorophyll readings ranged from 0.5 to 115.0 µg/L, and
based on the total chlorophyll concentrations, the reservoir
Visualization likely shifted to eutrophic and hypereutrophic states during
May and August/September (Carlson and Simpson, 1996).
Northwestern Corner Continuous Water-Quality The laboratory-corrected total chlorophyll concentrations may
Monitoring Results differ from actual values between sample collection dates
due to the complexity of phytoplankton communities and the
The water-quality instrument measured high frequency many factors affecting chlorophyll fluorescence. BGA-PC
data from one location in the reservoir, often where the reached a minimum of 0 and maximum of 20.8 µg/L during
cyanobacterial surface blooms accumulate. Collecting the deployment (fig. 6); however, the BGA-PC data were
continuous water-quality data from a bloom-prone location not corrected to discrete samples and values are considered
can reveal how the water quality is affected by cyanobacterial relative concentrations.
blooms. Water temperature ranged from 15.0 °C on May 14, The instrument data from this study show periods of
2015 to 26.6 °C on July 2, 2015 and often experienced diel high algal productivity (characterized by elevated pH and
fluctuations of 1 °C or less. Specific conductance generally dissolved oxygen) during May, August, and September 2015.
increased from May 2015 to early September 2015, with a The data show that the percent oxygen saturation at Willow
minimum of 211 µS/cm and a maximum of 252 µS/cm. On Creek Reservoir was greater than 100 percent saturation
59 days during May, August, and September 2015, the pH throughout most of the study period, which indicates that
was greater than or equal to 9.0 standard units and reached a photosynthesizing organisms in the water column were
maximum of 9.5 standard units on September 11, 2015 (fig. 4). producing and releasing oxygen. Other optical parameters
The percent oxygen saturation at Willow Creek Reservoir including the total chlorophyll, turbidity, and BGA-PC also
was greater than 100 percent for most of the deployment indicated that the water quality was affected in May, August,
period, and neither anoxic nor hypoxic concentrations and September. Specific conductance data decreased for a few
were measured at this near-surface location. In September, days in mid-September, which corresponds to the elevated pH,
dissolved oxygen reached 220.5 percent saturation (fig. 4). dissolved oxygen, total chlorophyll, turbidity, and BGA-PC
Turbidity, total chlorophyll, and BGA-PC data have similar readings. The water was super-saturated with oxygen and
trends with pronounced variation and elevated measurements it is possible that air bubbles accumulated in the specific
during the May and August/September blooms (fig. 5). Total conductance probe, decreasing the readings during that time
period.Water-Quality Analyses and Data Visualization 9
Willow Creek Reservoir NW Corner, OR (452053119323001)
9.6 230
9.5 215
9.4 200
9.3 185
Oxygen saturation, in percent
9.2 170
pH, in standard units
9.1 155
9.0 140
8.9 125
8.8 110
8.7 95
8.6 80
15 1 15 1 15 1 15 1 15
May June July August September
2015
Figure 4. Hourly pH (standard units) and dissolved oxygen percent saturation data during May–September 2015 at the fixed
location in the northwestern corner of Willow Creek Reservoir, north-central Oregon. Oxygen percent saturation values were
calculated using algorithms from USGS Data Grapher (U.S. Geological Survey, 2018b).
tac18-1227_fig 0410 Temporal and Spatial Monitoring of Cyanobacterial Blooms at Willow Creek Reservoir, North-Central Oregon
Willow Creek Reservoir NW Corner, OR (452053119323001)
120 60
110 55
100 50
90 45
Turbidity, in Formazin Nephelometric Units (FNU)
80 40
Total chlorophyll, in micrograms per liter
70 35
60 30
50 25
40 20
30 15
20 10
10 5
0 0
15 1 15 1 15 1 15 1 15
May June July August September
2015
Figure 5. Hourly total chlorophyll (µg/L) and turbidity (FNU) data during May–September 2015 at the fixed location in the
northwestern corner of Willow Creek Reservoir, north-central Oregon (U.S. Geological Survey, 2018b).
tac18-1227_fig 05Water-Quality Analyses and Data Visualization 11
Willow Creek Reservoir NW Corner, OR (452053119323001)
13
EXPLANATION
12
Median
25th–75th percentile
11 10th–90th percentile
10
9
Phycocyanin, in micrograms per liter
8
7
6
5
4
3
2
1
0
15 1 15 1 15 1 15 1 15
May June July August September
2015
Figure 6. Median, 10th–90th percentiles, and the 25th–75th percentiles for blue-green algae―phycocyanin data
collected during May–September 2015 at the fixed location in the northwestern corner of Willow Creek Reservoir,
north-central Oregon (U.S. Geological Survey, 2018b).
tac18-1227_fig 0612 Temporal and Spatial Monitoring of Cyanobacterial Blooms at Willow Creek Reservoir, North-Central Oregon
Camera Monitoring Results The proof-of-concept camera monitoring study
demonstrated that cyanobacterial surface blooms were visible
All camera images from 2015 and 2016 are archived in images from a color surveillance camera. Successive
in Smith (2017a). Monitoring surface blooms with a camera images could be joined together to view a video of the bloom
revealed that surface accumulations in this reservoir have on a given day. Not all images were clear or useful, and
the capacity to form and dissipate within 15 minutes based figure 8 shows a variety of images from the 2015 and 2016
on wind and currents (fig. 7). In 2015, the camera was field seasons. The use of a polarizing lens during this study
functioning and saved images on 106 of 180 days that the was unnecessary and caused the cyanobacterial blooms to
camera was deployed. The 74 days of missing images were a appear light brown. Collecting high-frequency images was
result of technical issues caused by faulty charge controllers advantageous considering that some images were obscured by
for the solar panel. During the 2016 deployment, images glare or cloud reflection. Telemetering images from Willow
were telemetered on 108 of 126 days. The 18 days of missing Creek Reservoir was successful, and images could be viewed
images were due to poor cellular coverage; consistent in near-real time by the resource managers (fig. 9).
telemetry began in September 2016 when the cellular
company, modem, and antenna were replaced.
Figure 7. Two images of a cyanobacterial bloom in Willow Creek Reservoir taken 15 minutes apart from the same position on May 21,
2015. The image on the left shows a surface accumulation, which is the lighter color and covering about three-quarters of the image.
The image on the right shows the bloom mixed in the water. The blooms appear brown because the camera was temporarily outfitted
with a polarizing lens. Photographs by U.S. Geological Survey.Water-Quality Analyses and Data Visualization 13 Polarizing lens Reflection Glare Desired outcome Figure 8. Images taken by the Axis 214 camera in the northwestern corner of Willow Creek Reservoir, north-central Oregon, showing four types of image quality. The top left panel shows a complete covering of a cyanobacterial surface scum that appears brown due to the polarizing lens. The top right panel and the bottom left panel are examples of interference from cloud reflection and glare. The bottom right image captures a cyanobacterial bloom in the northwestern corner of the reservoir without the use of a polarizing lens. Photographs by U.S. Geological Survey. tac18-1227_fig 08
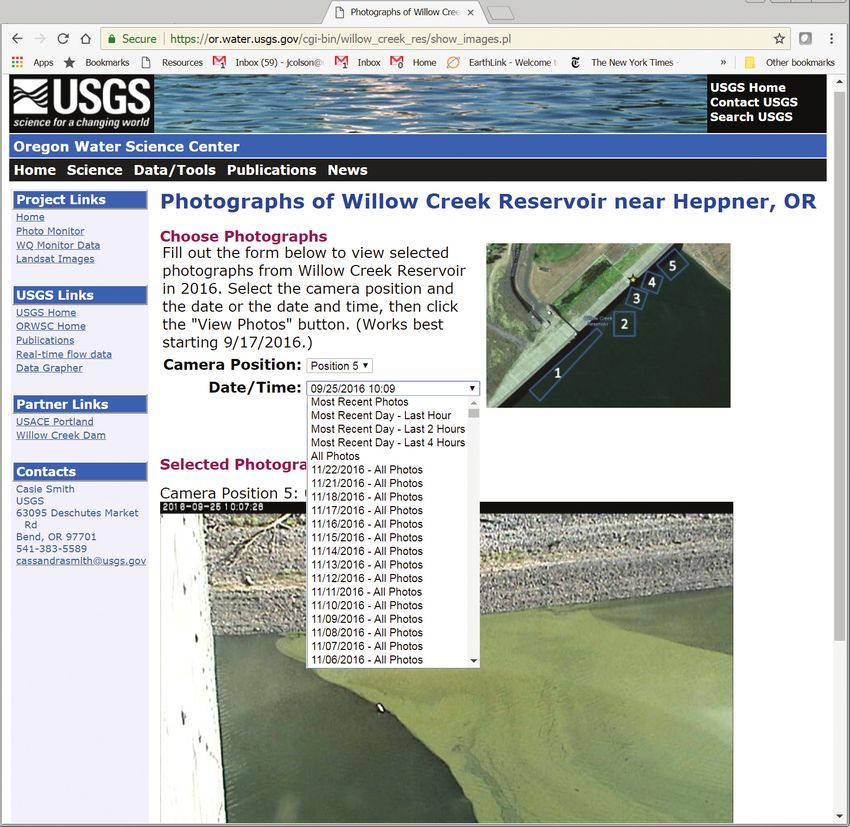
14  Temporal and Spatial Monitoring of Cyanobacterial Blooms at Willow Creek Reservoir, North-Central Oregon

Figure 9. Images taken by the Axis 214 camera in the northwestern corner of Willow Creek Reservoir, north-central Oregon, showing
functionality of website. Images of the surface of the water were taken at five positions every 15 minutes during daylight hours.
During 2016, the images were telemetered to a website in near real-time. This figure displays the functionality of the website that was
available to both researchers and resource managers.

 tac18-1227_fig 09
Water-Quality Analyses and Data Visualization    15

Camera and Instrument Results                                               Spatial Mapping Results
     Comparing the camera and water-quality instrument                            All data from the three spatial mapping events are
results indicated that the findings generally supported each                archived in Smith (2017b). A period of low algal activity
other, but that differences in surface and water column                     was observed during the mapping event conducted from
conditions did occur. Images from May 14 through June 26,                   1103 to 1245 PDT on June 9, 2015; the LandSat 8 image and
2015, were visually inspected for the presence of a surface                 the color surveillance camera images (not shown) confirm
bloom accumulation, and camera images showed surface                        that the reservoir did not have high algal productivity or a
blooms during a total of 200 daylight hours of that period. The             cyanobacterial surface accumulation at that time. Dissolved-
continuous water-quality data were collected from 1.5 ft below              oxygen measurements ranged from 109.2 to 115.0 percent
the surface of the water, and figure 10 displays the hourly                 saturation, and the EXO2 total chlorophyll readings ranged
visual bloom occurrences overlaid with the continuous total                 from 0.4 to 1.2 µg/L. The stationary, continuous water-quality
chlorophyll data from the same period.                                      instrument logged similar readings as were collected from the
     The elevated total chlorophyll data indicated when bloom               mapping effort (table 2).
conditions were measured with the water-quality instrument.                       During the mapping event on August 17, 2016 (from
Similar trends and timing were observed in the pH, dissolved                1305 to 1430 PDT), water appeared green and possible
oxygen, turbidity, and BGA-PC data. There were a few hours                  Aphanizomenon filaments were observed, but no surface
in June where surface accumulations were observed in images,                bloom was present. Dissolved-oxygen measurements reached
but no elevated response was detected by the total chlorophyll              155.8 percent saturation and pH reached 9.15 standard units,
probe (fig. 10). The ephemeral surface accumulations observed               which are indicative of high levels of algal activity. Most
on June 14, June 21, and June 26, 2015, appeared in the early               of the total chlorophyll readings were low (< 1 µg/L), but
morning; it is possible that those films were not comprised                 elevated total chlorophyll readings (maximum of 34.8 µg/L)
of cyanobacteria and were possibly pollen. Conversely,                      were detected in a small area in the Balm Fork arm of the
the water-quality instrument measured relatively high total                 reservoir.
chlorophyll in early June that was not detected by the camera.

              Table 2. Comparison of the YSI EXO2 multi-parameter water-quality readings measured at the same
              location in Willow Creek Reservoir, north-central Oregon, June 9, 2015.
              [Instrument readings: Stationary, continuous instrument logged hourly, while the spatial mapping instrument was secured
              to a moving boat and logged every 10 seconds. Both instruments were 1.5 feet (0.5 meter) below the surface of the water.
              Total chlorophyll values are raw values, not corrected to discrete samples. YSI, Yellow Spring Instrument]

                                                                                               Instrument readings
                                       Parameter                                 Spatial mapping            Stationary, continuous
                                                                              (recorded at 1140 PDT)        (recorded at 1200 PDT)
               Water temperature (degrees Celsius)                                     24.23                         24.02
               Specific conductance (microsiemens per centimeter)                    229.6                         228.0
               pH (standard units)                                                      8.93                          8.93
               Dissolved oxygen (milligrams per liter)                                  9.17                          9.40
               Turbidity (Formazin Nephlometric Units)                                  0.52                          0.60
               Chlorophyll, total (micrograms per liter)                                0.49                          0.48
               Blue-green algae–phycocyanin (micrograms per liter)                      0.12                          0.11
40
EXPLANATION
35 Surface accumulation visible in images
No photo (either night or missing)
Surface accumulation not present in images
30
Total chlorophyll
25
20
15
Total chlorophyll, in micrograms per liter
10
5
0
14 15 16 17 18 19 20 21 22 23 24 25 26 27 28 29 30 31 1 2 3 4 5 6 7 8 9 10 11 12 13 14 15 16 17 18 19 20 21 22 23 24 25 26
May June
2015
Figure 10. Comparison of the total chlorophyll data from the continuous water-quality instrument and the camera images. The total chlorophyll data are comprised
of hourly readings that were measured in micrograms per liter and adjusted to discrete laboratory values. All surface water images from all locations were visually
inspected for this period. Light green bars indicate that a surface bloom was visible in the images. The white areas (lack of colored bars) represent the hours when
images were collected, but surface blooms were not observed. The camera did not capture images between late evening and early morning, and the gray regions were
a result of the camera being off at night or missing images (June 9, 2015).
16 Temporal and Spatial Monitoring of Cyanobacterial Blooms at Willow Creek Reservoir, North-Central Oregon
tac18-1227_fig 10Water-Quality Analyses and Data Visualization 17
A surface bloom was present in the northwestern corner face of the dam. The dissolved oxygen map from that date
of the reservoir during the mapping event that took place shows higher oxygen percent saturation in areas with warmer
from 1150 to 1400 PDT on September 16, 2016. Measured temperatures, indicating that more algal productivity is
dissolved oxygen reached a maximum of 121.6 percent occurring in these areas. The total chlorophyll and BGA-PC
saturation while total chlorophyll readings reached a trends provided supporting evidence for what was observed in
maximum of 4.9 µg/L (fig. 11). Instrument readings were the other parameters but were not conclusive as stand-alone
assigned to the closest corresponding GPS coordinate reading maps, likely due to overall low concentrations (figs. 11 and
in time. Data were analyzed in ArcGIS using the Inverse 13). Spatial turbidity data from September 16 also supported
Distance Weighted spatial analyst tool to create colorized the evidence that the Balm Fork arm of the reservoir had
maps that represent how the water quality varied spatially in higher algal productivity than other areas of the reservoir.
the reservoir. A water temperature map from September 16, Analyzing maps of multiple water-quality parameters provides
2016 (fig. 12) reveals warmer water along the southern edges a more complete understanding of spatial variation than any
of the reservoir (within the Balm Fork arm) and along the one parameter.
119°33'15" 119°33' 119°32'45" 119°32'30" 119°32'15" 119°32' 119°31'45" 119°31'30" 119°31'15"
45°
21' EXPLANATION
Total chlorophyll, in
micrograms per liter
High: 4.9
26.2
Low: 0.1
45° 15.9 Chlorophyll-a discrete
20' samples, in
45"
micrograms per liter
15.9
23.0
45°
20'
30"
45°
20'
15"
Base image from Esri, copyright, 2018. Coordinate reference system: NAD83 0 100 200 300 400 500 FEET
UTM Zone 10N. Horizontal datum is North American Datum of 1983.
0 50 100 150 METERS
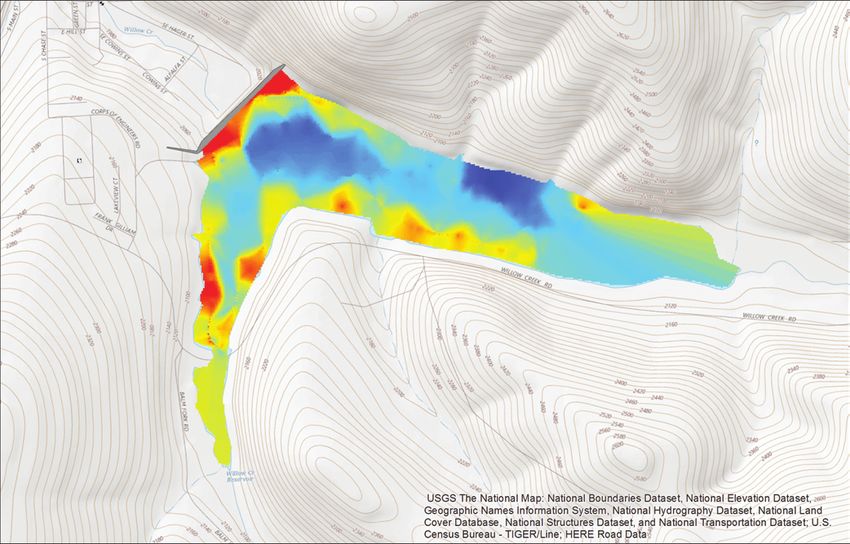
Figure 11. A colorized map representing relative total chlorophyll concentrations throughout the reservoir at 1.5 feet deep on
September 16, 2016, from 1150 and 1400 PDT. Data for the colorized map were derived from boat transects as shown in figure 3. Data
were analyzed in ArcGIS using the Inverse Distance Weighted spatial analyst tool. Areas that were too shallow for the boat to sample
were interpreted based on the nearest measurements. Discrete water samples were collected from the three noted locations as soon
as the mapping was complete, and samples were analyzed in the USGS Oregon Water Science Center laboratory following EPA Method
445.0 In Vitro Determination of Chlorophyll a. Mapping data were not corrected to laboratory results.18 Temporal and Spatial Monitoring of Cyanobacterial Blooms at Willow Creek Reservoir, North-Central Oregon
119°33'15" 119°33' 119°32'45" 119°32'30" 119°32'15" 119°32' 119°31'45" 119°31'30" 119°31'15"
45°
21' EXPLANATION
Water temperature, in
degrees Celsius
High: 21.99
Low: 18.15
45°
20'
45"
45°
20'
30"
45°
20'
15"
Base image from Esri, copyright, 2018. Coordinate reference system: NAD83 0 100 200 300 400 500 FEET
UTM Zone 10N. Horizontal datum is North American Datum of 1983.
0 50 100 150 METERS
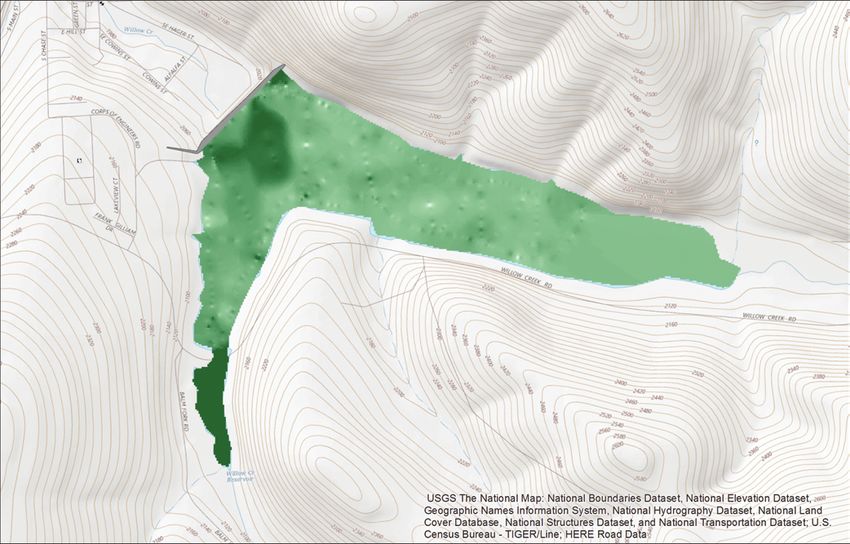
Figure 12. A colorized map representing water temperature throughout the reservoir at 1.5 feet deep on September 16, 2016, from
1150 to 1400 PDT. Data for the colorized map were derived from boat transects as shown in figure 3. Data were analyzed in ArcGIS
using the Inverse Distance Weighted spatial analyst tool. Areas that were too shallow for the boat to sample were interpreted based
on the nearest measurements.
tac18-1227_fig 12Temporal and Spatial Monitoring of Cyanobacterial Blooms 19
119°33'15" 119°33' 119°32'45" 119°32'30" 119°32'15" 119°32' 119°31'45" 119°31'30" 119°31'15"
45°
21' EXPLANATION
Blue-green algae
phycocyanin
concentrations, in
micrograms per liter
High: 5.1
45°
20' Low: 0
45"
45°
20'
30"
45°
20'
15"
Base image from Esri, copyright, 2018. Coordinate reference system: NAD83 0 100 200 300 400 500 FEET
UTM Zone 10N. Horizontal datum is North American Datum of 1983.
0 50 100 150 METERS
Figure 13. A colorized map representing relative blue-green algae―phycocyanin concentrations throughout the reservoir at 1.5 feet
deep on September 16, 2016, from 1150 and 1400 PDT. Data for the colorized map were derived from boat transects as shown in figure 3.
Data were analyzed in ArcGIS using the Inverse Distance Weighted spatial analyst tool. Areas that were too shallow for the boat to
sample were interpreted based on the nearest measurements.
Temporal and Spatial Monitoring of One objective of this study was to evaluate multiple
monitoring devices, including the color surveillance camera
Cyanobacterial Blooms and the multi-parameter water-quality instrument. The
camera was deployed for approximately 8 months from
Each monitoring method tested (camera, in-situ multi- 2015 to 2016 and collected information about cyanobacterial
parameter instrument, spatial mapping) in 2015 and 2016 surface bloom dynamics, including duration and frequency.
at Willow Creek Reservoir was successfully used to collect Standard tools previously used to monitor blooms in the
valuable information. However, each method has benefits and reservoir include analyzing routine samples (collected about
limitations, and determining which equipment and method to once every 2 weeks) or viewing LandSat8 images (taken
use should be based on the resource managers’ goals and how once every 16 days). With images of the reservoir captured
the information will be used. Ultimately, the combination of every 15 minutes, the camera collected more thorough
all three methods helped provide details on timing, severity, temporal coverage than the other data-collection methods
spatial extent, and capacity for early warning that no single could provide. The camera revealed that the presence of
method would deliver. surface bloom scums or accumulations can change rapidly
tac18-1227_fig 1320 Temporal and Spatial Monitoring of Cyanobacterial Blooms at Willow Creek Reservoir, North-Central Oregon (on the order of 15 minutes or less) due to a wind mixing Once the telemetry was established, the camera provided effect, which could help inform routine toxin sampling and near real-time color images of the surface of the remote recreation. Other benefits of deploying a camera include the reservoir via a website interface to resource managers who relatively inexpensive equipment costs and the ability to use were located about 200 mi away (fig. 9). Images may provide the equipment for multiple seasons. Technology has improved more useful information to the public than other types of data since the Axis 214 camera (used in this study) went on the because images require minimal interpretation. Telemetered market, and using a modern color surveillance camera would images could be made available to the public to inform their provide higher color resolution and improve this collection decisions about fishing and safe recreation (figs. 14–17). technique. Limitations of monitoring with a camera in a Additionally, telemetered images could be used as an early remote location include the potentially poor cellular coverage warning system that could prompt resource managers to for telemetry and the challenging logistics associated with collect samples for toxin analysis and to potentially issue positioning the camera above the water at the proper angle. recreational closures. In the future, the camera method could While the camera could pan and capture images from multiple be adapted to utilize pigment-detecting software to automate angles, the spatial coverage of the camera was limited and the process and alert resource managers when a pigment multiple cameras may be required for larger reservoirs. In concentration threshold is exceeded. areas of poor cellular coverage, telemetry via an alternate cabled Internet connection may be needed. Figure 14. An algal surface accumulation occurring in the northwestern corner of Willow Creek Reservoir, north-central, Oregon, November 7, 2016, at 1223 PST. Photograph by U.S. Geological Survey.
Temporal and Spatial Monitoring of Cyanobacterial Blooms   21

Figure 15. An algal bloom occurring along the dam face in Willow Creek Reservoir, north-central Oregon, September 26, 2016, at
1150 PDT. Photograph by U.S. Geological Survey.

      Another objective of the study was to monitor the effects    reservoir. Stone and others (2013) developed a model using
of cyanobacterial blooms on the reservoir’s water quality.         dissolved oxygen, specific conductance, and fluorescence data
During the 4 months that the continuous instrument was             to obtain estimates of dissolved phosphorus concentrations
deployed in Willow Creek Reservoir, 17.5 percent of the            in a reservoir in Kansas. These types of models may allow
values exceeded the Total Maximum Daily Load (TMDL)                the inference of continuous nutrient concentrations that could
maximum limit of 9.0 standard units (Oregon Department             help elucidate nutrient loading patterns and ultimately assist in
of Environmental Quality, 2017), and the pH reached                controlling algal blooms.
a maximum of 9.5 standard units. Those pH values are                     Continuous water-quality monitoring is often viewed as
biologically relevant because such basic pH values can cause       an expensive form of data collection because the instruments
ammonia in the water column to remain in its un-ionized form,      require ongoing maintenance and the data require auditing
which can negatively affect fish gills and ultimately cause        or adjusting (based on calibration and fouling corrections)
ammonia toxicity if concentrations are high enough (U.S.           to ensure their accuracy; however, numerous benefits can be
Environmental Protection Agency, 2013). The water-quality          derived from collecting multiple years of continuous data from
instrument data also revealed supportive trends among total        an impaired water body. Continuous monitoring collects data
chlorophyll, turbidity, and BGA-PC, and more information can       during short-term events, when manual on-site sampling may
be gleaned from these datasets. For example, with additional       not be possible, and helps define baseline conditions. Studying
data and the development of a model, turbidity might become        the baseline conditions will provide possible benchmarks, or
a suitable surrogate for total phosphorus concentrations in the    goals, for restoration practices in the future. The continuous

 tac18-1227_fig 15
You can also read