EBRAINS brain atlas services: Exploring and analysing the brain in its different facets Status at M8 - (D4.2 - SGA3)
←
→
Page content transcription
If your browser does not render page correctly, please read the page content below
EBRAINS brain atlas services:
       Exploring and analysing the brain in its different facets
                            Status at M8
                            (D4.2 – SGA3)

Figure 1: EBRAINS atlas services allow to explore and analyse the brain in its different facets.

D4.2 (D33) SGA3 M8 ACCEPTED 210504.docx        PU = Public       4-May-2021     Page 1 / 31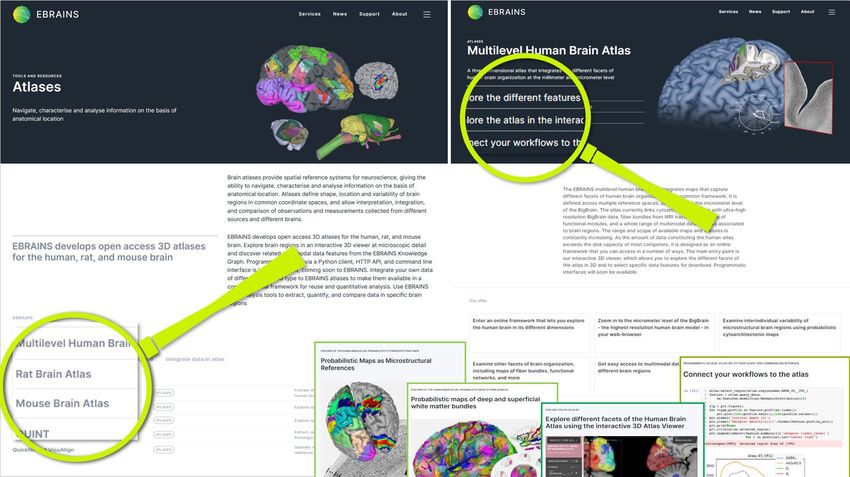
Project Number:           945539                       Project Title:            HBP SGA3

Document Title:           D4.2 - EBRAINS Brain Atlas Services (SC2)

Document Filename:        D4.2 (D33) SGA3 M8 ACCEPTED 210504.docx

Deliverable Number:       SGA3 D4.2 (D33)

Deliverable Type:         Other

Dissemination Level:      PU = Public

Planned Delivery Date: SGA3 M8 / 30 Nov 2020

Actual Delivery Date:     SGA3 M9 / 21 Dec 2020; resubmitted 23 Apr 2021; accepted 04 May 2021

Author(s):                Timo DICKSCHEID, JUELICH (P20)

                          Timo DICKSCHEID, JUELICH (P20)
Compiled by:              Trygve LEERGARD, UIO (P81)
                          Anna HILVERLING, JUELICH (P20)

                          Jan Bjaalie, UiO (P81), contributed to Sections 2.1.3, 2.2.2, 2.3.2, 2.4.2
                          Trygve LEERGAARD, UiO (P81), contributed to Sections 2.1.2, 2.1.3, 2.2.2, 2.3.2,
                          3.1, 4.1, 4.3, 4.4
                          Maja PUCHADES, UIO (P81), contributed to Sections 2.1.3, 2.2.2, 2.3.2, 2.4.2, 4.1,
                          4.3, 4.4
                          Rembrandt BAKKER, JUELICH (P51), contributed to Sections 4.3
                          Anna KRESHUK, EMBL (P123), contributed to Section 2.4.1
                          Wim VANDUFFEL, KUL (P111), contributed to Section 4.1
Contributor(s):           Puiu BALAN, KUL (P111), contributed to Section 4.1
                          Nicola PALOMERO-GALLAGHER, JUELICH, (P20), contributed to Section 4.1
                          Nicolas BERNAOLA, UPM (P68), contributed to Section 4.4
                          Bertrand THIRION, INRIA (P33), contributed to Section 4.4
                          Simon EICKHOFF, JUELICH (P20), contributed to Section 4.4
                          Xiaoyun GUI, JUELICH (P20), contributed to Sections 2.3.3, 3.2
                          Lyuba ZEHL, JUELICH (P20), contributed to Sections 1, 2.2.3
                          Stefan KÖHNEN, JUELICH (P20), contributed to Section 2.4.3

WP QC Review:             Sara ZAFARNIA, JUELICH (P20)

WP Leader / Deputy
                   Jan BJAALIE, UIO (P81)
Leader Sign Off:

                          Martin TELEFONT, EPFL (P1) - sci/tech QC
T7.4 QC Review:
                          Annemieke MICHELS, EPFL (P1) - editorial QC

                          Updated brain atlases including full coverage of cytoarchitectonic probabilistic
Description in GA:
                          maps and first microscopic resolution maps for human.

D4.2 (D33) SGA3 M8 ACCEPTED 210504.docx               PU = Public           4-May-2021      Page 2 / 31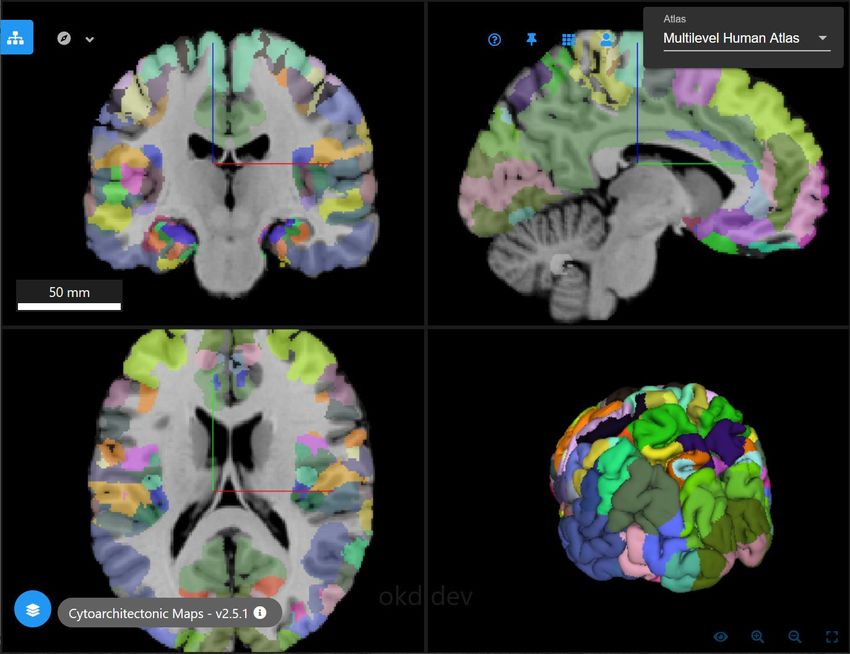
EBRAINS provides access to reference atlases for the human, rat and mouse brain.
                              Guided via the EBRAINS web portal, they can be explored using the 3D Interactive
                              Atlas Viewer, as well as a 2D viewer for serial section images and, coming soon to
                              EBRAINS, a Rest API and Python Client for structured programmatic access. Atlas
                              services link to the EBRAINS Knowledge Graph for storing maps as curated datasets
                              and giving access to a growing set of neuroscience datasets as multimodal data
Abstract:
                              features of brain regions. To facilitate continuous integration of data to atlases,
                              online tools are in place for spatial registration of common data types. Finally, a
                              selection of workflows enable to analyse data in the spatial context defined by the
                              reference atlases. This document describes the status of EBRAINS Brain Atlases
                              Services in November 2020 (month 8) of SGA3 and highlights recent developments
                              since April 2020.

Keywords:                     Atlases, Spatial data integration, Data analysis tools

                              computational neuroscience community, computer scientists, Consortium members,
                              funders, general public, neuroimaging community, neuroinformaticians,
Target Users/Readers:
                              neuroscientific community, neuroscientists, Platform users, researchers, scientific
                              community, students

                                                     Table of Contents
1.   Introduction ............................................................................................................. 5
2.   Current status of EBRAINS atlas services ......................................................................... 6
  2.1     Atlases of different species ..................................................................................... 6
      2.1.1      Multilevel Human Atlas ................................................................................... 6
      2.1.2      Waxholm Space Rat Atlas ................................................................................ 8
      2.1.3      Allen Mouse Brain Atlas .................................................................................. 9
  2.2     Exploring atlases ................................................................................................. 10
      2.2.1      The 3D Interactive Atlas Viewer ....................................................................... 10
      2.2.2      LocaliZoom 2D serial section image viewer ......................................................... 11
      2.2.3      Access via the EBRAINS Knowledge Graph ........................................................... 13
      2.2.4      Python Client and HTTP API ............................................................................ 14
  2.3     Integration of multimodal data to atlases ................................................................... 14
      2.3.1      Datasets as multimodal features of brain regions .................................................. 14
      2.3.2      Integrating 2D images using QuickNII and VisuAlign ............................................... 15
      2.3.3      Integrating high-resolution partial volumes - VoluBA .............................................. 16
  2.4     Tools for analysing data using EBRAINS atlases ............................................................. 18
      2.4.1      Interactive image segmentation using ilastik ....................................................... 18
      2.4.2      Extracting image features in atlas space - QUINT .................................................. 18
      2.4.3      Gene expression analysis in brain regions - JuGEx ................................................. 19
3. Recent developments ............................................................................................... 20
  3.1     Updated brain reference atlases .............................................................................. 20
  3.2     New release of Interactive Atlas Viewer ..................................................................... 22
  3.3     Prototype Python atlas client .................................................................................. 25
4. Future features of EBRAINS atlas services ..................................................................... 26
  4.1     Atlases of different species .................................................................................... 26
  4.2     Exploring atlases ................................................................................................. 27
  4.3     Integration of multimodal data to atlases ................................................................... 27
  4.4     Tools for analysing data using EBRAINS atlases ............................................................. 28
5. References ............................................................................................................ 29
6. Annex ................................................................................................................... 31
  6.1     Listing of known problems, possible risks and delays ..................................................... 31

D4.2 (D33) SGA3 M8 ACCEPTED 210504.docx                         PU = Public               4-May-2021         Page 3 / 31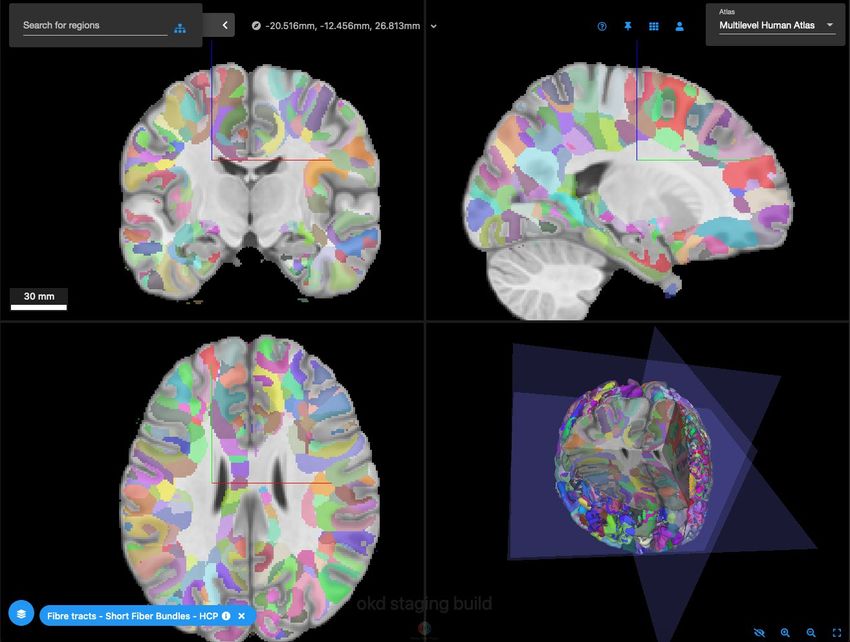
Table of Figures
Figure 1: EBRAINS atlas services allow to explore and analyse the brain in its different facets. .............. 1
Figure 2: An impression of the atlas pages on the EBRAINS web portal. ............................................ 5
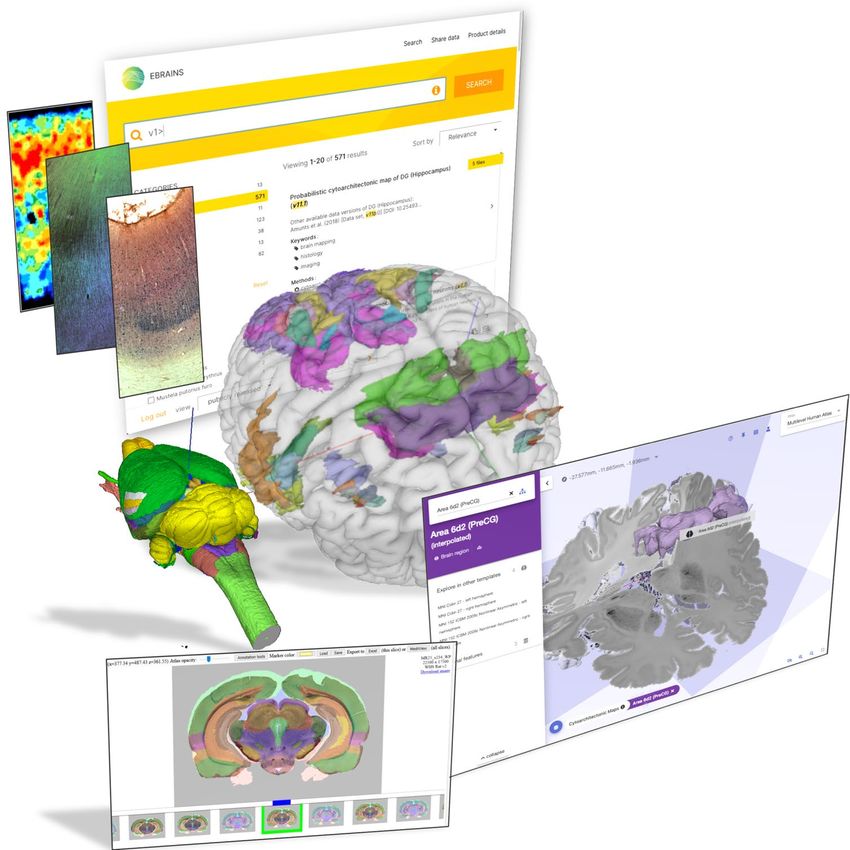
Figure 3: EBRAINS 3D Interactive Atlas Viewer. ......................................................................... 6
Figure 4: Representing and linking the macroscopic and microscopic scale in the EBRAINS human brain atlas
............................................................................................................................. 7
Figure 5: Complementary maps supported by the multilevel human brain atlas. ................................. 8
Figure 6: Different versions of the Waxholm Space Atlas of the Sprague Dawley rat brain. .................... 9
Figure 7: The Interactive Atlas Viewer combines a 3D surface view with three planar views. ................ 10
Figure 8: Interface of the LocaliZoom 2D serial section viewer. .................................................... 12
Figure 9: Viewer links available via the EBRAINS Knowledge Graph. ............................................... 12
Figure 10: Atlas information openly available in the EBRAINS Knowledge Graph. ............................... 13
Figure 11: Accessibility of region specifications for a dataset in the EBRAINS Knowledge Graph. ............ 15
Figure 12: Accessing multimodal datasets linked to brain regions in Interactive Atlas Viewer. ............... 15
Figure 13: Registration of 2D histological images with QuickNII and VisuAlign. .................................. 16
Figure 14: Rigid alignment of a high-resolution volume of interest to BigBrain using VoluBA. ................ 17
Figure 15: Refining a rigid alignment in VoluBA by entering corresponding 3D landmarks. .................... 17
Figure 16: The cloud ilastik prototype for online interactive image segmentation. ............................. 18
Figure 17: QUINT workflow for spatial feature analysis in rodent brain histological series. ................... 19
Figure 18: JuGEx, a tool for analysing gene expressions in different atlas regions. ............................. 20
Figure 19: New cytoarchitectonic maps available in the EBRAINS human brain atlas. .......................... 21
Figure 20: The new maps of short white matter bundles based on the HCP dataset. ........................... 22
Figure 21: Basic controls in the EBRAINS Interactive Atlas Viewer. ................................................. 23
Figure 22: Side panel with information about a selected region and links across scales........................ 24
Figure 23: Atlas viewer side panel for exploration of iEEG recordings in the selected region. ................ 24
Figure 24: Atlas viewer panel for exploring receptor densities of a particular brain region. .................. 25
Figure 25: Waxholm Space Rat Brain atlas version 4beta. ............................................................ 26
Figure 26: Anatomical template of the macaque monkeys. .......................................................... 26
Figure 27: Current pilot pipeline for alignment of neuron morphologies. ......................................... 28
Figure 28: Planned architecture for integrating neuron morphology alignment with EBRAINS. ............... 28
History of Changes made to this Deliverable (post Submission)
Date Change Requested / Change Made / Other Action
21.12.2020 Deliverable submitted to EC
Resubmission with specified changes requested in Review Report:
23.03.2021
• An analysis of known problems, delays and risks is missing and should be added
Revised draft sent by WP to PCO.
Main changes made, with indication where each change was made:
1. Analysis of known problems, delays and risks added (see Annex)
Minor changes made:
21.04.2021 1. Fixed URL to JuGEx documentation (p.20)
2. Update of JuGEx Sceenshots to current release version (p.20, Figure 18)
3. Fixed URLs of the hippocampus dataset cards (HC-xxx) and added version
numbers (p.21)
4. Removed preliminary Python library name, as it will be changed in the next
release (p.25, p.28)
23.04.2021 Revised version resubmitted to EC by PCO via SyGMa
D4.2 (D33) SGA3 M8 ACCEPTED 210504.docx PU = Public 4-May-2021 Page 4 / 31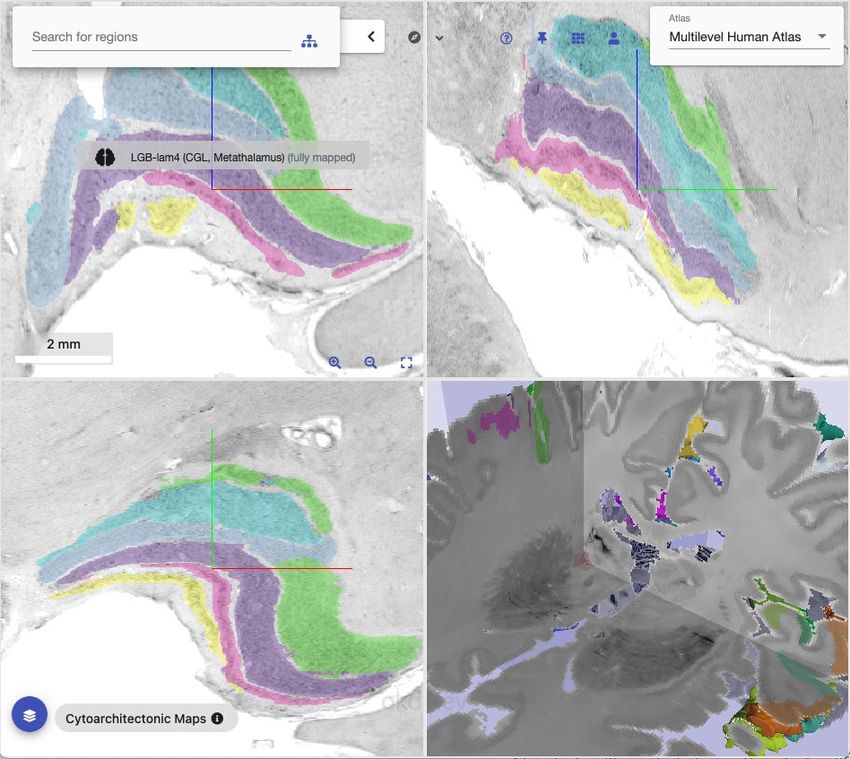
1.         Introduction
EBRAINS provides access to brain atlases for three different species: A multilevel atlas of the human
brain, the Waxholm space atlas of the Sprague Dawley rat, and the Allen Mouse Brain Atlas. The
human and rat atlases are developed in the Human Brain Project (HBP). The HBP is also developing
a basic atlas of the monkey brain which will be included in the future (see 4.1). The general entry
point for EBRAINS Atlases services is the EBRAINS web portal at https://ebrains.eu, which provides
basic information about the brain atlases and the most important tools to access and work with them
(Figure 2).

                Figure 2: An impression of the atlas pages on the EBRAINS web portal.
Today, the main interface to EBRAINS atlases is the 3D Interactive Atlas Viewer, which can be freely
accessed using most modern web browsers at https://atlases.ebrains.eu/viewer (Figure 3). It allows
to explore the maps in 3D at different spatial scales and discover many data features linked to brain
regions (see 2.2.1). Additionally, a 2D viewer for browsing images for serial sections in atlas space
with sliced atlas region delineations is available. EBRAINS is also developing a dedicated Rest API
and Python Client for structured programmatic access (see 2.2.4) which is currently available as a
prototype.
With few exceptions, all maps and data features offered by the EBRAINS Atlases services are curated
and shared as datasets via the EBRAINS Knowledge Graph 1 (see 2.2.3). With EBRAINS data curation
as a part of the atlas development workflow, it is ensured that the atlases follow the practices of
FAIR data and comply with the metadata standards promoted by EBRAINS. An OWL ontology model
for the reference atlases is in development, and a compatible metadata model (openMINDS_SANDS)
was released in November 2020.
A key feature of EBRAINS Atlases services is the growing set of neuroscience datasets that are linked
to specific brain regions and exposed as multimodal data features (Figure 3). Most of these data
features are datasets in the EBRAINS Knowledge Graph that have undergone spatial registration
(anchoring) in the curation process, which assigns anatomical location to the data. Additional
interfaces are available for region-agnostic access to selected external data repositories like the
Allen Human Brain Atlas.

1
    https://kg.ebrains.eu/search/?facet_type%5b0%5d=Dataset
D4.2 (D33) SGA3 M8 ACCEPTED 210504.docx             PU = Public     4-May-2021     Page 5 / 31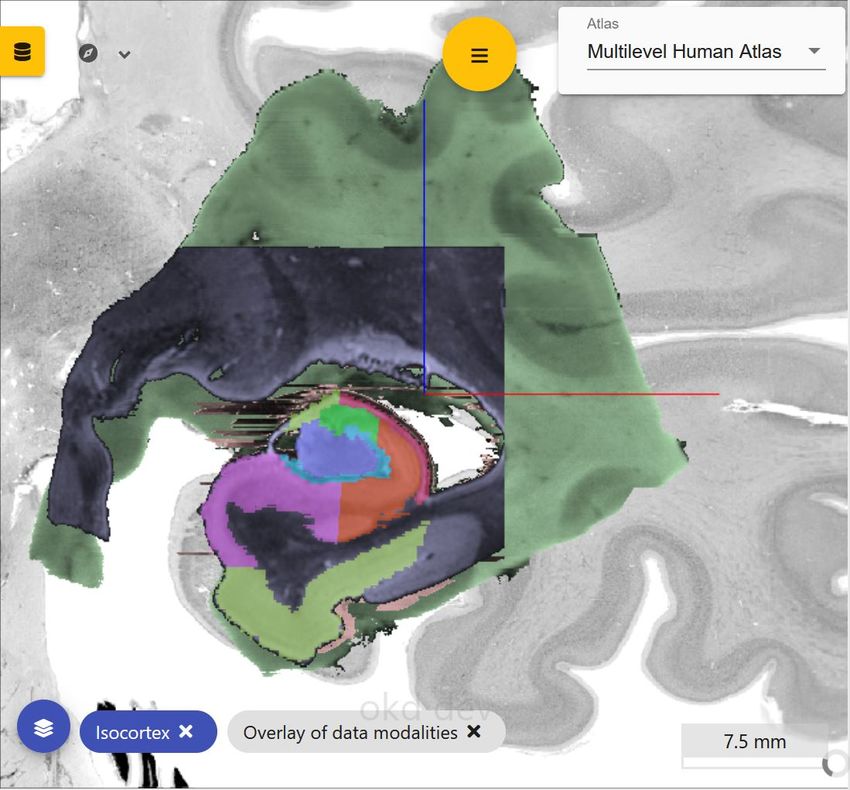
To ensure ongoing integration of datasets to EBRAINS atlases, EBRAINS Atlases services offer online
tools for common cases of anchoring datasets to atlases, including spatial alignment of 2D images,
3D partial volumes, and 3D geometries (see 2.4).
Finally, EBRAINS Atlases services include selected workflows for analysing data in a spatial context
defined by the reference atlases. These cover extraction of image features in specific atlas regions,
systematic and reproducible comparison of regional features, and projection of atlas contents to
user data. The services are designed to be extended with more analysis tools and workflows in the
future (see 4.4).
This document describes the status of EBRAINS Atlases services in November 2020 (month 8) of SGA3
and highlights some recent developments since April 2020.

                             Figure 3: EBRAINS 3D Interactive Atlas Viewer.
The EBRAINS 3D Interactive Atlas Viewer showing the Julich-Brain cytoarchitectonic maps in MNI space, browsing
connection strengths from area hOc3d to other areas extracted from diffusion imaging in a large cohort. This view is
available at https://atlases.ebrains.eu/viewer/saneUrl/icbm_hOc3d .

2.        Current status of EBRAINS atlas services
2.1          Atlases of different species

2.1.1           Multilevel Human Atlas
The EBRAINS multilevel human brain atlas goes beyond the typical structure of a single labelled brain
volume with associated region names. Aiming to capture the many facets of human brain organisation
in an integrated framework, it combines different complementary maps across multiple template
spaces, and links them with diverse regional data features.
The framework is defined across multiple reference spaces (Figure 4). It supports the MNI Colin27
and ICBM 2009c nonlinear asymmetric spaces to reflect the macroanatomical scale, which are

D4.2 (D33) SGA3 M8 ACCEPTED 210504.docx                  PU = Public           4-May-2021       Page 6 / 31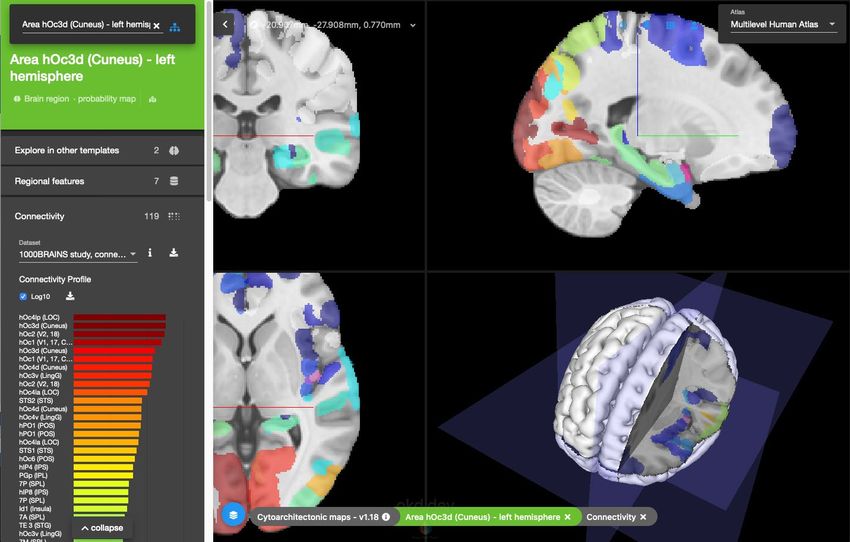
common in functional imaging and whole-brain connectivity studies. To represent brain organisation
at the cellular level, it combines those with the microscopic resolution BigBrain model (Amunts K et
al., 2013). Coordinates between these spaces are related by nonlinear diffeomorphic transformations
(Lebenberg J et al., 2018) (P1391), which are implemented into a spatial transformation module.
This allows EBRAINS atlas services to use approximate spatial links between the different template
spaces.

 Support of multiple
 template spaces

 Corresponding
 cytoarchitectonic
 region definitions at
 different scales

   Figure 4: Representing and linking the macroscopic and microscopic scale in the EBRAINS
                                       human brain atlas
Top: The MNI spaces and BigBrain model are spatially linked via diffeomorphic transformations with underlying sulcal
constraints. Bottom: Cytoarchitectonic maps provide a segregation scheme that is well defined at the cellular level,
and at the same time serve as a reference for probabilistic assignment of neuroimaging signals. This way,
microstructural definitions of cytoarchitectonic borders serve as a unifying principle across the spatial scales.

However, building a link that bridges multiple spatial scales of the human brain needs to go beyond
coordinate transformations, and requires a segregation scheme which is both well-defined at the
cellular level and able to localise information at the macroscopic level. This is a key feature of the
EBRAINS human brain atlas: it uses the Julich-Brain cytoarchitectonic maps as the unifying principle
of organisation, which are precisely defined at the microscopic scale and well established as a
reference for anatomical assignment of neuroimaging signals. They are included in the form of
probabilistic maps in the MNI spaces - capturing variability across different post-mortem samples -,
as well as in the form of a growing set of highly detailed 3D maps that are defined natively for the
BigBrain space (Figure 4). Corresponding regions in different templates spaces are linked, so that
users can navigate in the same region at different scales (see 2.2.1). The number of
cytoarchitectonic region definitions is constantly increasing. The most recent version of the
probabilistic maps (Amunts K et al., 2020) (P2583) provides a full coverage of the cortex (see 3.1).
The human brain atlas combines the cytoarchitectonic reference delineations with additional maps
describing complementary levels of organisation. These currently include probabilistic maps of deep
and superficial white matter fibre bundles, capturing variability and structure of fibre architecture
at the macroscopic scale (Guevara M et al., 2017) (P1149). The bundle maps are based on diffusion
D4.2 (D33) SGA3 M8 ACCEPTED 210504.docx                  PU = Public           4-May-2021       Page 7 / 31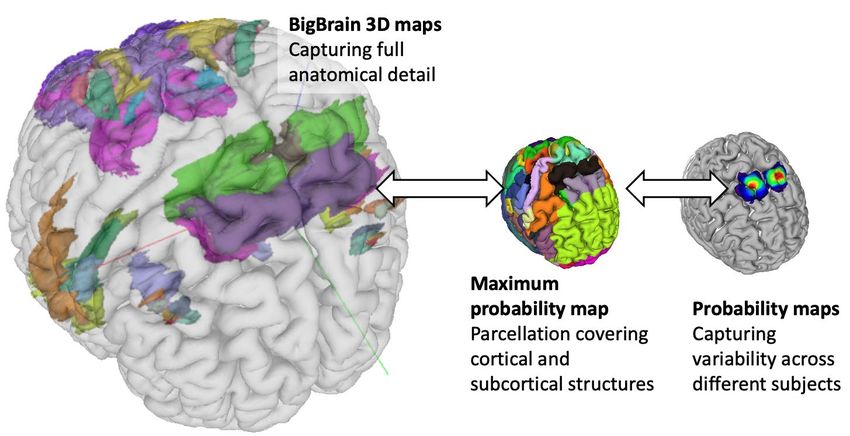
MRI and tractography, initially inferred from MRI scans of the ARCHI dataset, and more recently from
the Human Connectome Project resulting in more than 700 short bundles. Furthermore, the
functional organisation is covered by maps reflecting from dictionaries of functional modes (DiFuMo;
(Dadi K et al., 2020)) (P2622) which are offered at different granularities ranging from 64 to 1024
networks. The functional modes are sampled on millions of functional brain (fMRI) volumes, spanned
over 27 studies and many research groups. These maps help to solve classic analysis problems on a
wide variety of functional images: stimuli decoding, standard GLM analysis of fMRI across sessions
and individuals, resting-state functional connectomes biomarkers.

          Figure 5: Complementary maps supported by the multilevel human brain atlas.
Each of the maps is available as a discrete parcellation (top row), or as individual continuous or probabilistic maps
(bottom row). The maps are available in the Interactive Atlas Viewer:
https://atlases.ebrains.eu/viewer/saneUrl/icbm_cytomap,
https://atlases.ebrains.eu/viewer/saneUrl/icbm_long_bundle,
https://atlases.ebrains.eu/viewer/saneUrl/icbm_short_bundle,
https://atlases.ebrains.eu/viewer/saneUrl/functional_modes_64

2.1.2           Waxholm Space Rat Atlas
The Waxholm Space (WHS) rat brain reference atlas is defined in a high-resolution volumetric
magnetic resonance imaging (MRI) and diffusion tensor imaging (DTI) template of an adult (80 days
old) Sprague Dawley rat brain (Papp EA et al., 2014). It contains comprehensive anatomical
delineations of brain regions and fibre tracts, defined by domain experts interpreting the MRI / DTI
template, aided by spatially registered histological images showing the microscopic brain
architecture. The atlas is embedded in spatially focused workflows and several other EBRAINS tools
(QuickNII, VisuAlign, LocaliZoom, QUINT) for analysing data from the rat brain. Commonly used rat
brain reference atlases, including “The rat brain in stereotaxic coordinates” by Paxinos and Watson
(editions 2-7) and Swanson’s brain maps: structure of the rat brain (editions 1-4), have been spatially
D4.2 (D33) SGA3 M8 ACCEPTED 210504.docx                  PU = Public           4-May-2021        Page 8 / 31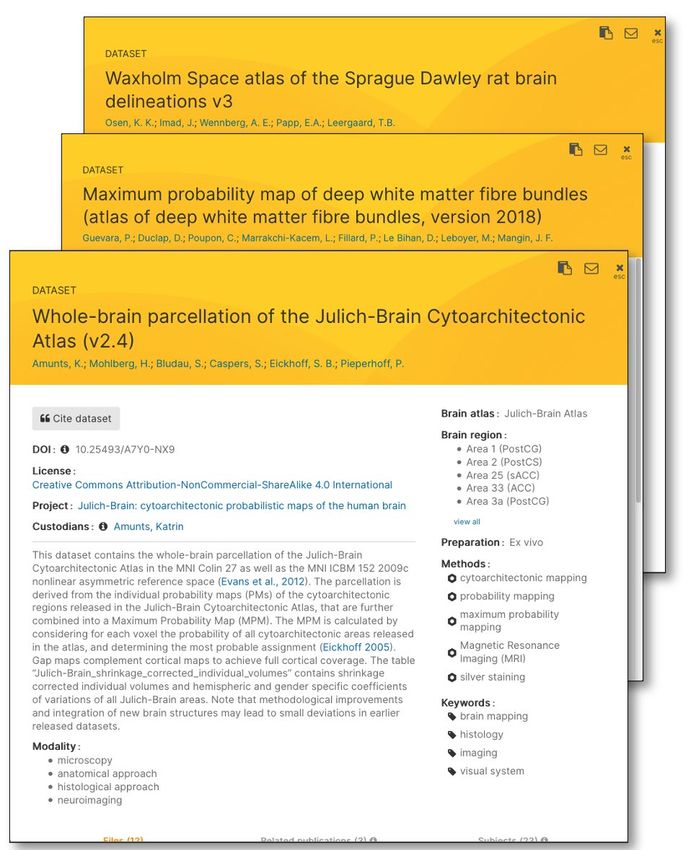
registered to the Waxholm space rat brain atlas, shared via EBRAINS, and incorporated in the EBRAINS
data curation workflow. In this way anatomical terms and locations defined using different atlases
can be compared and translated across atlases. 2D and 3D image data from 56 datasets, shared via
EBRAINS, have been spatially registered to the Waxholm space rat brain atlas.
The first version of the WHS rat brain atlas contained 76 delineations, covering most major brain
regions (Papp EA et al., 2014). Version 2 contained 89 delineations and features detailed delineations
of the hippocampus and parahippocampal region (Kjonigsen LJ et al., 2015). Version 3 contains 118
structures and includes detailed delineations of the ascending auditory system (Osen KK et al., 2019)
(P1879; Figure 6).
When opening the WHS rat brain atlas in the EBRAINS Interactive Atlas Viewer, version 3 is loaded
by default (WHS rat brain atlas v3 2). Earlier versions can be selected and compared. More information
about the different versions is available in the EBRAINS Knowledge Graph.
                 v1.01                                     v2                                       v3
https://kg.ebrains.eu/search/instan https://kg.ebrains.eu/search/instan https://kg.ebrains.eu/search/instan
 ces/Dataset/f40e466b-8247-463a-     ces/Dataset/2c8ec4fb-45ca-4fe7-     ces/Dataset/e80f9946-1aa9-494b-
        a4cb-56dfe68e7059                   accf-c41b5e92c43d                    b81a-9048ca9afdbe
       76 region delineations              89 region delineations              118 region delineations

      Figure 6: Different versions of the Waxholm Space Atlas of the Sprague Dawley rat brain.
Different version of the Waxholm space atlas of the Sprague Dawley rat brain available in EBRAINS, shown in coronal
view at level of the hippocampus in the EBRAINS 3D atlas viewer. The different versions are available in the Interactive
Atlas Viewer:
https://atlases.ebrains.eu/viewer/saneUrl/whs_v101,
https://atlases.ebrains.eu/viewer/saneUrl/whs_v2,
https://atlases.ebrains.eu/viewer/saneUrl/whs_v3.

2.1.3            Allen Mouse Brain Atlas
The Allen Mouse Brain Coordinate Framework (CCFv3) has been included in the EBRAINS Atlas services
since it is the most widely used open atlas for the mouse brain (Wang Q et al., 2020). The atlas is
defined in a population-averaged image volume acquired from 1,675 male C57BL/6J mice using serial
two-photon tomography (STPT). The most recent version of the CCFv3 (CCFv3-2017) contains more
than 600 brain regions delineated in 3D based on this template. The atlas is used in EBRAINS to
compare, analyse, and showcase mouse brain data, and the atlas is embedded in several EBRAINS
tools (QuickNII, QUINT workflow). Commonly used mouse brain reference atlases, including “The
mouse brain in stereotaxic coordinates” by Paxinos and Watson (editions 2-4), have been spatially
registered to the CCFv3, shared via EBRAINS, and incorporated in the EBRAINS data curation
workflow. In this way anatomical terms and locations defined using earlier versions of the Franklin
& Paxinos atlases can be compared and translated across atlases. A large number of 2D and 3D image

2
    https://atlases.ebrains.eu/viewer/saneUrl/whs_v3
D4.2 (D33) SGA3 M8 ACCEPTED 210504.docx                   PU = Public            4-May-2021        Page 9 / 31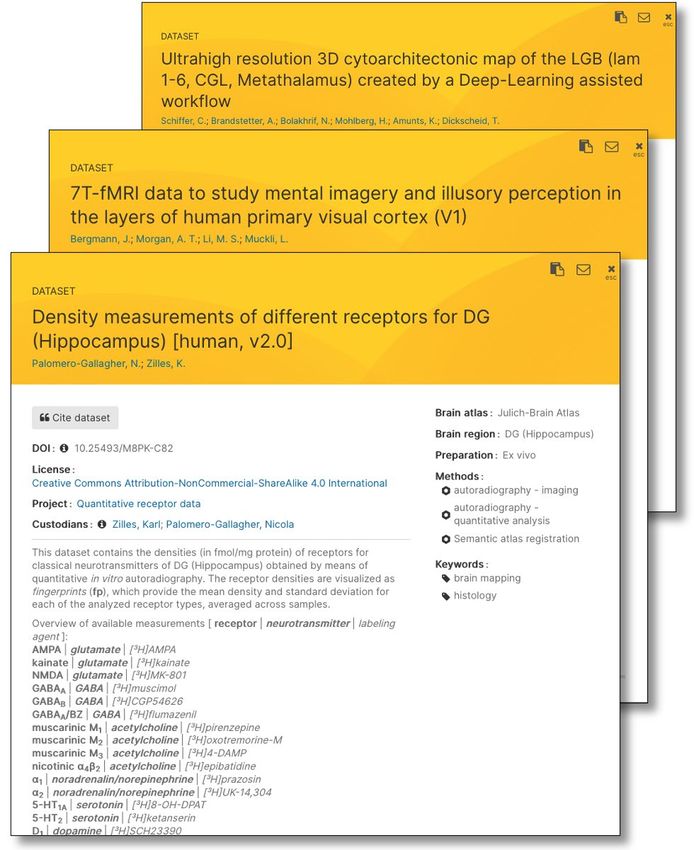
data shared via EBRAINS have been spatially registered to the CCFv3. When opening the Allen Mouse
Brain Coordinate Framework (CCFv3), the user enters the most recent version by default (explore
the CCFv3-2017 3). Earlier versions can be selected and compared. Further details about the CCFv3
can be found on the Allen Brain Atlas website http://atlas.brain-map.org/ of the Allen Institute for
Brain Science (Seattle (WA)).

2.2           Exploring atlases

2.2.1            The 3D Interactive Atlas Viewer
A                                                          B

C                                                          D

    Figure 7: The Interactive Atlas Viewer combines a 3D surface view with three planar views.
(A) MNI reference space of the human atlas with data at about 1mm resolution, displaying the cytoarchitectonic maps.
(B) Maximised mode of one view, in this case the 3D rotatable view. In this setting, the “Space” key cycles through
the views (https://atlases.ebrains.eu/viewer/saneUrl/colin_cytomap). (C) BigBrain reference space of the human
atlas, where the planar views are zoomed into a custom oblique cut at ~20 micrometre resolution, allowing to identify
individual cortical layers and larger cells. The 3D view provides orientation about the selected location in the brain
(https://atlases.ebrains.eu/viewer/saneUrl/bigbrain_isocortex). (D) Overlay of additional image data, here: High-
resolution     maps      and     volumes      of    interest   from     MRI     and    Polarized     Light     Imaging
(https://atlases.ebrains.eu/viewer/saneUrl/bigbrain_3dpli).

The EBRAINS 3D Interactive Atlas Viewer provides an intuitive way of navigating volumetric reference
atlases from a web browser. It allows to switch between different template spaces, browse different
parcellation maps as visual layers, search their region hierarchies, and select regions to find more

3
    https://atlases.ebrains.eu/viewer/saneUrl/CCFv3_2017
D4.2 (D33) SGA3 M8 ACCEPTED 210504.docx                  PU = Public            4-May-2021       Page 10 / 31
detailed information and associated data features. The viewer can be reached from the atlas section
of the EBRAINS webportal 4, and directly via the URL https://atlases.ebrains.eu/viewer.
At its core, it is a web-based 3D image viewer with a common 2x2 layout that combines a rotatable
3D surface view of a brain volume with three planar views of different, typically orthogonal, image
planes (Figure 7A). Each of these four image views allows to zoom (scroll wheel) and pan (click&drag)
and can be maximised to full screen (Figure 7B) using the corresponding icon (“⛶”) at the bottom
right of each view. The three planar views further allow to select custom oblique sections
(shift+click&drag) to produce non-orthogonal views of the 3D image (Figure 7C). This is an important
feature especially for high-resolution reference volumes, as it allows to display e.g., cortical layers
in their natural orientation - orthogonal to the brain surface - instead of being restricted to axis-
aligned coordinate planes.
Building on the open source project Neuroglancer 5, the viewer can visualise very large brain volumes
in the Terabyte range, and allows to zoom from common MRI resolutions down to the microscopic
resolution of the BigBrain reference space (Figure 7C) without downloading the underlying dataset -
which in case of BigBrain typically exceeds the disk capacity of an office computer. The viewer also
supports multiple image layers to co-display brain region maps with additional image data (Figure
7D).
The atlas viewer provides various interactive controls for interacting with atlases and their features
and gives access to an extensible set of tools for working with data associated to atlas regions,
including a “shopping cart” for collecting and downloading interesting data features. Several
functionalities have been newly introduced or optimised in the most recent release of the atlas
viewer, which is described in more detail in Section 3.2.
Full documentation of the Interactive Atlas Viewer can be found here: https://interactive-
viewer.readthedocs.io/en/latest/.
2.2.2 LocaliZoom 2D serial section image viewer
EBRAINS LocaliZoom serial section image viewer provides an intuitive way of navigating high-
resolution 2D image series coupled with segmentation overlay, from a web browser. At its core, it is
a web-based pan-and-zoom 2D image viewer coupled with a volumetric atlas slicer, and a
navigational aid showing the entire image series as a "filmstrip". Building on the open standard Deep
Zoom Image format, it is able to efficiently visualise very large brain images in the gigapixel range,
allowing to zoom from common, display-sized overview resolutions down to the microscopic
resolution without downloading the underlying very large image dataset. It further allows extraction
of a limited number of coordinates, e.g. representing an electrode track or labelling within a small
region of interest. EBRAINS uses LocaliZoom for inspecting 2D image datasets that are spatially
registered to the Waxholm Space rat brain atlas or the Allen Mouse Atlas. Users can inspect the
images at cellular resolution and observe brain regions, names, and boundaries and annotate points
in order to extract coordinates.
In LocaliZoom, serial section images are represented in a filmstrip at the bottom of the webpage
user interface (Figure 8-1), with the selected section image shown with an atlas overlay in the middle
panel and the pointer of the mouse showing the atlas region name. In the upper panel, the user can
visualise the coordinates of the mouse pointer (Figure 8-2); adjust the transparency of the atlas
overlay (Figure 8-3); change the colour of the coordinate markers (Figure 8-4) and export coordinates
to either Excel (Figure 8-5) for storage or MeshView for visualisation (Figure 8-6).
The main image can be zoomed and panned by scrolling and clicking. To extract a coordinate, the
mouse marker must be positioned at the desired location, and space must be pressed. A cross will
appear in the selected colour (Figure 8-4), representing the location of the extracted coordinate.
After all desired points have been marked, the coordinates can be exported either to Excel (Figure
8-5) or to MeshView (Figure 8-6) using the corresponding buttons in the upper toolbar. When clicking
4
https://ebrains.eu/services/atlases
5
https://github.com/google/neuroglancer
D4.2 (D33) SGA3 M8 ACCEPTED 210504.docx PU = Public 4-May-2021 Page 11 / 31these buttons, a set of coordinates will appear that can be copy pasted into MeshView in order to
work with these point clouds in 3D.
Figure 8: Interface of the LocaliZoom 2D serial section viewer.
Shown here: Waxholm Space rat atlas v2: http://cmbn-
navigator.uio.no/navigator/filmstripzoom/filmstripzoom.html?atlas=200000&series=283&preview=WHSRatv2Previe
w.png.
An example dataset that can be inspected with LocaliZoom is shown in Figure 9 (A,B). Further
datasets can be found in the Knowledge Graph Search User Interface using a faceted search function
by selecting the filter options “Rattus norvegicus” or “Mus musculus”, and the method “Spatial atlas
registration”. More details about the faceted search can be found in “HBP Deliverable 4.1 (D32) -
EBRAINS Data and Knowledge services”.
A B
C
Figure 9: Viewer links available via the EBRAINS Knowledge Graph.
Where applicable, the EBRAINS Knowledge Graph provides links from Dataset cards (A) to the LocaliZoom 2D serial
section image viewer (B) or The 3D Interactive Atlas Viewer (C). The Dataset card with access to the viewers is
available here: https://kg.ebrains.eu/search/instances/Dataset/6ce1f96ae210b2335b75a793367e3865.
D4.2 (D33) SGA3 M8 ACCEPTED 210504.docx PU = Public 4-May-2021 Page 12 / 312.2.3 Access via the EBRAINS Knowledge Graph
Figure 10: Atlas information openly available in the EBRAINS Knowledge Graph.
Almost all information and datasets underlying the EBRAINS atlases are curated and openly accessible as Dataset cards
in the EBRAINS Knowledge Graph. Left: Examples of Dataset cards for different parcellations used in EBRAINS atlases.
Right: Examples of Dataset cards for multimodal features that are linked to atlas regions. The Dataset cards are
available via the Knowledge Graph here: Waxholm Space atlas of the Sprague Dawley rat brain delineations v3 -
https://kg.ebrains.eu/search/instances/Dataset/e80f9946-1aa9-494b-b81a-9048ca9afdbe, Maximum probability map
of deep white matter fibre bundles (atlas of deep white matter fibre bundles, version 2018) -
https://kg.ebrains.eu/search/instances/Dataset/fcbb049b-edd5-4fb5-acbc-7bf8ee933e24, Whole-brain parcellation
of the Julich-Brain Cytoarchitectonic Atlas (v2.4) - https://kg.ebrains.eu/search/instances/Dataset/5249afa7-5e04-
4ffd-8039-c3a9231f717c, Ultrahigh resolution 3D cytoarchitectonic map of the LGB (lam 1-6, CGL, Metathalamus)
created by a Deep-Learning assisted workflow - https://kg.ebrains.eu/search/instances/Dataset/d0c36f4a-91a8-4885-
880d-f2896f5c54cf, 7T-fMRI data to study mental imagery and illusory perception in the layers of human primary
visual cortex (V1) - https://kg.ebrains.eu/search/instances/Dataset/de7a6c44-8167-44a8-9cf4-435a3dab61ed,
Density measurements of different receptors for DG (Hippocampus) [human, v2.0] -
https://kg.ebrains.eu/search/instances/Dataset/e1ae30a5-f6ed-40f8-ad54-9ded33b82052.
EBRAINS brain atlases can also be accessed via the EBRAINS Knowledge Graph (KG) Search User
Interface at https://kg.ebrains.eu/search, because almost all of the parcellations, maps, reference
templates and multimodal datasets that make up the atlases are curated and indexed in the KG in
accordance with the FAIR principles (cf. D4.1 EBRAINS Data and Knowledge services). While the KG
Search User Interface is not designed as an atlas exploration tool, it allows several workflows that
make use of atlas information and related metadata:
• In the KG, the new schemas of the openMINDS SANDS metadata model allow to capture and query
information on the anatomical location of neuroscience data as well as to identify datasets that
are part of reference brain atlases and coordinate spaces. The previous version of the KG
metadata models allowing tagging parcellations, brain regions, and coordinate spaces.
• Some dataset information pages in the KG provide direct URL links to view the corresponding
data in an appropriate online viewer (as in Figure 10)
D4.2 (D33) SGA3 M8 ACCEPTED 210504.docx PU = Public 4-May-2021 Page 13 / 31• Complex brain atlases that sometimes are comprised of multiple dataset releases can be
captured as individual datasets within the KG, allowing to model the provenance of the brain
atlas and explore the history and related publications (see 3.1)
2.2.4 Python Client and HTTP API
EBRAINS develops a dedicated HTTP API and Python Client for working with atlases in a more
programmatic fashion. The Python client is currently at the prototype stage and has been used for
a first coupling of brain simulation with the EBRAINS atlases (Showcase 1 of WP 1). A brief outline of
this new development is included in Section 3.3.
2.3 Integration of multimodal data to atlases
2.3.1 Datasets as multimodal features of brain regions
Together with the curation teams of Service Category 1 (SC1), brain atlases are continuously
enriched with multimodal information by linking neuroscience datasets to their most appropriate
locations in an atlas (Tier 2 curation). The assignment of location can take different forms:
1) Spatial registration of coordinates to one of the supported reference spaces (“coordinate-based
integration”). This applies to 2D and 3D images, point locations like recording sites of tissue
probes, or geometric shapes like neuron morphologies (see 2.3).
2) Direct assignment to a brain region (“semantic integration”). In this case, the origin brain region
of a dataset is known, and the dataset is linked to the name of the region according to a reference
parcellation.
3) Probabilistic assignment of whole brain signals to brain regions. This applies to continuous
feature distributions in the form of images in a reference space, as for example 3D activation
maps from fMRI studies. Here the coverage of certain brain regions by the signal can be evaluated
from a probabilistic perspective, leading to multi-assignments with probabilistic weights to
different brain regions. This corresponds to the concept used in the SPM anatomy toolbox
(Eickhoff S et al., 2005). The human atlas currently provides links of this type to a range of fMRI
scans stored in the EBRAINS Knowledge Graph.
More details regarding the data curation processes can be found in “HBP Deliverable 4.1 (D32) -
EBRAINS Data and Knowledge services”. EBRAINS makes links between datasets and brain locations
accessible in different ways:
• As a region specification appearing in the corresponding dataset description of the EBRAINS
Knowledge Graph (Figure 11 left)
• As a direct link from the dataset description in the EBRAINS Knowledge Graph to a superimposed
view in EBRAINS atlas viewer (Figure 11 right)
• As a list of data features presented in the 3D atlas viewer when selecting a brain region (Figure
12)
In addition, a Python client and HTTP API are in development, that will allow to retrieve datasets
by brain region in a programmatic fashion (see 2.2.4).
The number of datasets linked to brain regions is constantly increasing and kept up to date with
modifications of the atlas parcellations and maps. For example, browsing regions of the Julich-Brain
cytoarchitectonic maps includes links to 214 datasets with regional maps, 24 datasets from molecular
imaging, 4 datasets with single cell measurements, 4 physiology datasets, 3 high-resolution MRI
datasets, several microscopy datasets and imaging studies, whole-brain connectivity from 5 different
cohort studies, and retrieval of gene expressions from the Allen brain atlas for each individual brain
region. In this way, it provides access to about 20,000 files with locations.
D4.2 (D33) SGA3 M8 ACCEPTED 210504.docx PU = Public 4-May-2021 Page 14 / 31Figure 11: Accessibility of region specifications for a dataset in the EBRAINS Knowledge Graph. Left: The associated brain region names are listed on the Dataset card. If applicable, an additional link allows to open a 3D view of files from the dataset in EBRAINS atlas viewer. Right: Dataset view in the EBRAINS Interactive Atlas Viewer. Files of the dataset are displayed at their position in reference space (here: BigBrain reference space). The Dataset card with access to the Interactive Atlas Viewer is available via the EBRAINS Knowledge Graph here: https://kg.ebrains.eu/search/instances/Dataset/b08a7dbc-7c75-4ce7-905b-690b2b1e8957. Figure 12: Accessing multimodal datasets linked to brain regions in Interactive Atlas Viewer. Left: Probability map of area DG in MNI reference space with associated data features (https://atlases.ebrains.eu/viewer/saneUrl/icbm_dg). Right: High-resolution map of area hOc2 (V2, Brodmann Area 18) in BigBrain reference space with associated data features (https://atlases.ebrains.eu/viewer/saneUrl/bigbrain_hoc2). 2.3.2 Integrating 2D images using QuickNII and VisuAlign Tools for anatomical landmark-based registration of mouse and rat 2D brain images to 3D murine reference atlases are QuickNII and VisuAlign (Puchades MA et al., 2019) (P2182). The atlases embedded in these tools are Allen Mouse Brain Atlas (CCFv3, 2015 and 2017) and the Waxholm Atlas of the Spraque Dawley rat (v2 and v3). D4.2 (D33) SGA3 M8 ACCEPTED 210504.docx PU = Public 4-May-2021 Page 15 / 31
QuickNII is a stand-alone software tool for semi-automated affine registration of 2D brain section
images to mouse and rat reference atlases. It has been used for integration of more than 100 2D
datasets, available in the EBRAINS Knowledge Graph. Based on landmarks visible in the tissue, the
user anchors some of the images from a series of sections to reference slices, and the propagation
algorithm will position the remaining images of the series. Further precision is achieved with the
VisuAlign software which refines the QuickNII registration of the images using non-linear deformation
(Figure 13).
Both tools are available for Windows and OS operative systems and shared from the EBRAINS web
portal: https://ebrains.eu/service/quicknii-and-visualign
Tutorials and manuals for the tools can be found in a                     publicly   available       Collab:
https://wiki.ebrains.eu/bin/view/Collabs/quicknii-and-visualign/
QuickNII and VisuAlign are key elements of the QUINT workflow ((Yates SC et al., 2019) (P2245),
(Groeneboom NE et al., 2020) (P2589)), allowing users to perform atlas-based quantifications of the
labelled features in their brain sections.

          Figure 13: Registration of 2D histological images with QuickNII and VisuAlign.

2.3.3           Integrating high-resolution partial volumes - VoluBA
Spatial anchoring of high-resolution volumes of interest (VOIs) from specific imaging experiments
into the detailed anatomical context of a high-resolution reference model like the BigBrain is an
important practical problem since such high-resolution models and VOIs become increasingly
available in recent years. Typical application examples are integration of laminar resolution
functional MRI (De Martino F et al., 2013), microscopic resolution structural connectivity as derived
from 3D Polarized Light Imaging (Axer M et al., 2011), or 2-Photon fluorescence imaging (e.g.,
(Silvestri L et al., 2014)), which would all be appropriately organised in the detailed anatomical
context of the BigBrain microscopic brain model. However, downloading this huge (~1 Terabyte)
dataset and working on a proper positioning of new imaging data is out of reach for many
neuroscientists due to the sheer size of the data, as well as the lack of practical tools.
EBRAINS atlas services provide an interactive online service for the anchoring of user data to very
large reference volumes, VoluBA (Volumetric Brain Anchoring). VoluBA is accessible from
https://voluba.apps.hbp.eu. VoluBA is implemented as an online web service that currently provides
the BigBrain model as a fixed reference dataset and allows users to upload data from their own
imaging experiment to perform interactive anchoring. VoluBA shares several software components
and its overall look & feel with the The 3D Interactive Atlas Viewer, so that a user of the EBRAINS
atlas services will quickly feel comfortable with it. Furthermore, the image data is read from the
same image service, so that a dataset in VoluBA can be directly set as an image source of the atlas
viewer and viewed as an image overlay in atlas context.
The anchoring process of a VOI is typically started by direct manipulation of its position and 3D
orientation using the mouse pointer. Additional linear transformations like flipping of coordinate
axes and isotropic or anisotropic scaling are accessible from a menu (Figure 14). This initial alignment
results in a rigid transformation from the VOI to the reference volume. Furthermore, VoluBA supports

D4.2 (D33) SGA3 M8 ACCEPTED 210504.docx            PU = Public        4-May-2021      Page 16 / 31
full 3D affine transformations, allowing more precise adjustment with shearing parameters. This is achieved by interactive anchoring of pairs of corresponding 3D landmarks to the scene (Figure 15). The resulting linear transformation can be downloaded and/or submitted to EBRAINS data curation. The aligned VOI can be opened in the EBRAINS Interactive Atlas Viewer to see the aligned data in context with brain region maps and other datasets. In addition to this, an experimental plugin is available which allows a nonlinear adjustment of cortical VOIs, provided that a segmentation mask for the grey matter is available as well. After an initial linear alignment of the cortical VOI to its target position and orientation, this plugin will then try to adjust the cortical depth of the VOI according to the equivolumetric model of Bok to match that of the reference model. This allows a much better alignment of cortical layers across different subjects. Full documentation on the Volumetric Brain Anchoring tool can be found here: https://voluba.readthedocs.io/en/latest/. Figure 14: Rigid alignment of a high-resolution volume of interest to BigBrain using VoluBA. Figure 15: Refining a rigid alignment in VoluBA by entering corresponding 3D landmarks. D4.2 (D33) SGA3 M8 ACCEPTED 210504.docx PU = Public 4-May-2021 Page 17 / 31
2.4           Tools for analysing data using EBRAINS atlases

2.4.1            Interactive image segmentation using ilastik
Ilastik is a simple, user-friendly tool for interactive image classification, segmentation, and analysis.
It is built as a modular software framework, which currently has workflows for automated
(supervised) pixel- and object-level classification, automated and semi-automated object tracking,
semi-automated segmentation, and object counting without detection. Most analysis operations are
performed lazily, which enables targeted interactive processing of data subvolumes, followed by
complete volume analysis in offline batch mode. Using it requires no experience in image processing.
Ilastik version 1.0 is described in a recent publication (Berg S et al., 2019) (P2348). The common
form of ilastik is a Desktop application which can be installed on most common operating systems.
It is available from https://www.ilastik.org.
EBRAINS builds interfaces with ilastik to allow segmentation of image data from the EBRAINS
Knowledge Graph, and to enable execution of image segmentation tasks on EBRAINS compute
resources. Two interfaces are currently available in prototype form. The first is a data import module
which allows to load image data from EBRAINS storage systems into the ilastik Desktop client,
allowing to apply any of the available ilastik workflows to EBRAINS image datasets. Installing and
using this prototype is documented in a public EBRAINS collab 6. The second form - Cloud ilastik - is
a web version of the ilastik client with reduced functionality, which does not require installation of
the client. This prototype runs in a web browser and allows to train a “pixel classification” classifier
in a web browser and store the resulting model in EBRAINS (Figure 16). This prototype is accessible
at https://web.ilastik.org/live_training/.

         Figure 16: The cloud ilastik prototype for online interactive image segmentation.
Left: Starting page for the “Live training” allows selection of suitable image datasets. Right: Interactive web interface
for performing the training and storing the trained classifier in, based on Neuroglancer 7.

2.4.2            Extracting image features in atlas space - QUINT
QUINT is a workflow for the quantification and spatial analysis of labelled features in a large number
of histological brain sections. The workflow consists of several consecutive software tools. All
applications are desktop based and have user-friendly graphical interfaces and tutorials. First,
QuickNII and VisuAlign (Puchades MA et al., 2019) (P2182) provide precise image registration, ilastik
(Berg S et al., 2019) (P2348) allows the segmentation of marked objects in the brain section, and
then Nutil (Groeneboom NE et al., 2020) (P2589) subsequently quantifies features per identified

6
    https://collab.humanbrainproject.eu/#/collab/11516/nav/86128
7
    https://github.com/google/neuroglancer
D4.2 (D33) SGA3 M8 ACCEPTED 210504.docx                    PU = Public            4-May-2021        Page 18 / 31
atlas region (Figure 17). Added value of the QUINT workflow is that it removes the need for time-
consuming methods such as stereotactic analysis with manual delineation of the individual brain
regions.
• QuickNII and VisuAlign allow precise registrations of 2D brain image data to reference atlases
both for mice and rats. Any deviation in cutting angle can be accepted and the propagation
algorithm greatly facilitates registrations of brain-wide series with hundreds of slices.
• The output of QuickNII and VisuAlign are tailor-made for input into the quantification workflow
QUINT but can also be used directly or in combination with other workflows.
• The QUINT workflow is unique as it allows the users to customise their analysis in many aspects
like choice of the granularity level of the atlas, or define their own ROI, filtrate artefacts and
quality control steps included in the workflow.
All software tools can be downloaded via the EBRAINS web portal: https://ebrains.eu/service/quint.
A manual for the tools can be found in this publicly available collab:
https://wiki.ebrains.eu/bin/view/Collabs/quint
Figure 17: QUINT workflow for spatial feature analysis in rodent brain histological series.
2.4.3 Gene expression analysis in brain regions - JuGEx
Decoding the chain from genes to cognition requires detailed insights how areas with specific gene
activities and microanatomical architectures contribute to brain function and dysfunction. The Allen
Human Brain Atlas 8 contains regional gene expression data, while the EBRAINS human brain atlas
offers three-dimensional cytoarchitectonic maps reflecting the interindividual variability. JuGEx
offers an integrated framework that combines the analytical benefits of both repositories towards a
multilevel brain atlas of adult humans. It is a new method for integrating tissue transcriptome and
cytoarchitectonic segregation.
EBRAINS atlas services provide JuGEx in two forms: a plugin of the Interactive Atlas Viewer (Figure
18 left), as well as a Python library accessible via the Collaboratory (Figure 18 right), thus allowing
for both interactive and advanced programmatic use. For the plugin, the python code was wrapped
into a back end web service that is interactively controlled via the plugin, providing an intuitive
graphical user interface that allows visual selection of brain areas and auto-completion for selecting
candidate genes. Once an experiment is configured, it can be executed directly from the viewer.
The resulting probe locations can be visualised as landmarks (Figure 18 left), and all results can be
downloaded as a .csv file. On request, the Plugin can generate the explicit Python code that
corresponds to this computation, and directly import it into a private user Collab for programmatic
use in a Jupyter notebook. This allows a seamless transition from basic exploratory analysis to larger
scale data experiments. The EBRAINS interfaces to JuGEx are described on the EBRAINS portal at
8
© 2015 Allen Institute for Brain Science. Allen Brain Atlas API. Available from: brain-map.org/api/index.html
D4.2 (D33) SGA3 M8 ACCEPTED 210504.docx PU = Public 4-May-2021 Page 19 / 31https://ebrains.eu/service/jugex, where links to documentation and software are continuously
updated.
Figure 18: JuGEx, a tool for analysing gene expressions in different atlas regions.
Left: JuGEx integrated as an interactive plugin of the EBRAINS atlas viewer. Right: The same code as a Python
notebook in a Jupyter notebook of the EBRAINS Collaboratory.
3. Recent developments
3.1 Updated brain reference atlases
The most notable development for the human atlas since April 2020 is the integration of the new
Julich-Brain v2.5 (Amunts K et al., 2020) (P2583), which contains probabilistic cytoarchitectonic
maps of 248 different cortical and subcortical areas (Figure 19 left). It brings together brain region
definitions from 41 projects of doctoral students and researchers and integrates in total 85,210
contour lines from histological sections into the 3D reference framework. Besides adding many more
brain regions, this new release provides whole-brain coverage of the cortical surface. About 70% of
the cortical surface are now covered with published mapping projects, and complemented with
several “gap maps” which pool the remaining uncharted areas. The gap maps will be continuously
refined with ongoing and new mapping projects and released in EBRAINS. The new Julich-Brain is
accessible as part of the multilevel atlas in the 3D atlas viewer 9, and as a data project in the EBRAINS
Knowledge Graph (see 2.2.3). The new brain areas included in this version include:
• Area TI (STG) (v5.1) 48383281-9a83-4c6f-8166-f8bb139052dd
• Area TE 2.1 (STG) (v5.1) a5589ffe-5148-4006-8d8d-8bcf411f750b
• Area TE 2.2 (STG) (v5.1) d5bfb044-ec4e-4fe6-ad9c-844cad8c7844
• Area TeI (STG) (v5.1) 35f2107d-2e3c-41ae-b26a-83b101829346
• GapMap Frontal II (v9.0) 86510749-dec2-4dff-bc3a-f9fb98c5447d
• GapMap Frontal I (v9.0) 7383f4c6-d678-4539-8d36-33501eef55d3
• GapMap Frontal to Occipital (v9.0) 83b4b184-57be-4385-a1b2-2cec8519509d
• GapMap Frontal to Temporal (v9.0) 48f5905e-2cc5-41ae-b37a-6eb1438337c5
9
https://atlases.ebrains.eu/viewer/saneUrl/icbm_cytomap
D4.2 (D33) SGA3 M8 ACCEPTED 210504.docx PU = Public 4-May-2021 Page 20 / 31• GapMap Temporal to Parietal (v9.0) 822ef227-264a-4584-8c3b-e41e33e16fe7
• CA1 (Hippocampus) (v11.1) effec48c-edf6-4be4-9e0e-75c57480d53c
• CA2 (Hippocampus) (v11.1) 159b16ee-2451-44d6-81cf-871d04755da4
• CA3 (Hippocampus) (v11.1) 72f4d9d3-6a14-4b68-8924-bcc01a977f07
• Area OP5 (Frontal Operculum) (v2.0) d9fc6c97-7a2c-4620-aa0f-7ffc9e410918
• Area OP6 (Frontal Operculum) (v2.0) ee72c2a3-bc04-4853-b6db-cb9ecdd247b4
• Area OP7 (Frontal Operculum) (v2.0) ed0b0aee-4260-4d4d-b84b-63a718f24f8d
• Area a29 (retrosplenial) (v11.0) 64845be7-6bfd-4428-a5a5-b61de3d06689
• Area a30 (retrosplenial) (v11.0) 78e278a4-9c9f-4122-baea-102d02cdefc3
• Area i29 (retrosplenial) (v11.0) 563b99ec-6fe3-4b31-bafa-41eaeaa7710c
• Area i30 (retrosplenial) (v11.0) afd7389c-299c-476a-9953-a15750b33ffc
• Area p29 (retrosplenial) (v11.0) 2980bbca-354d-4b9f-b198-59c94545dfdd
• Area p30 (retrosplenial) (v11.0) 40b7a5dd-9c88-47cf-91a2-061f7d3f7559
• HC-Parasubiculum (Hippocampus) (v13.0) e7ebf0c3-a5e8-4382-8447-88714bdcca59
• HC-Presubiculum (Hippocampus) (v13.0) fe24e44e-aef4-4fd2-bf84-16c2d7a8913e
• HC-Prosubiculum (Hippocampus) (v13.0) 11250154-4be9-4024-a12a-61a104cbffb9
• HC-Transsubiculum (Hippocampus) (v13.0) 1de506d5-c303-44b7-a44d-a908dd6804f7
Another recent development is the release of more highly detailed 3D maps of cytoarchitectonic
regions for the BigBrain template (Figure 19 right). These maps correspond directly to probabilistic
maps of Julich-Brain, but represent a precise delineation performed directly in the BigBrain model
using a novel workflow based on Deep Learning, across all histological sections. For example, for
area hOc1, delineations in 2,461 histological sections have been computed and reconstructed into a
full 3D map. Besides a set of interpolated maps, detailed maps are now available for areas hOc1,
hOc2, hOc3v, hOc5, and LGB-lam1 up to LGB-lam6 of the metathalamus 10. A map of the entorhinal
cortex is already under curation and will become available soon.
Figure 19: New cytoarchitectonic maps available in the EBRAINS human brain atlas.
10
https://kg.ebrains.eu/search/instances/Dataset/d0c36f4a-91a8-4885-880d-f2896f5c54cf
D4.2 (D33) SGA3 M8 ACCEPTED 210504.docx PU = Public 4-May-2021 Page 21 / 31Left: Julich-Brain maximum probability cytoarchitectonic maps with many new region definitions and full coverage
of the cortex (https://atlases.ebrains.eu/viewer/saneUrl/colin_cytomap). Right: New microscopic resolution 3D maps
in BigBrain; here: Maps of areas LGB-lam1 - LGB-lam6 of the methatalamus (e.g., LGB-lam1:
https://atlases.ebrains.eu/viewer/saneUrl/bigbrain_lgblam1).
Furthermore, the diffusion MRI dataset of the Human Connectome Project has been used to compute
the largest map to date of reproducible short fibre bundles (less than 8 cm) of the human brain
(Labra AN et al., 2019) (P2540), see Figure 20. This map results from a framework aligning subjects
using a diffeomorphic procedure forcing the match of the main cortical sulci. This is a key feature
to align correctly the U-bundles, which circumvent the cortical folds. This sulcus-based alignment
includes the nonlinear ICBM T1-weighted MRI average in order to drive all the subject’s tractograms
(the set of dMRI-based virtual fibres) to the standard ICBM space. Then, a two-level clustering
(intrasubject and intersubject) was performed on the tractograms to define the most reproducible
bundles across subjects. A post registration with freesurfer space leads to label each bundle
according to the nomenclature of the Desikan-Killiany atlas. As the previous bundle maps in EBRAINS,
probabilistic maps of each bundle are accessible together with an aggregated map providing a
parcellation of superficial white matter defined from a maximum probability principle.
Figure 20: The new maps of short white matter bundles based on the HCP dataset.
The maps of short white matter bundles are available in the Interactive Atlas Viewer:
https://atlases.ebrains.eu/viewer/saneUrl/hcp_shortbundles.
The Waxholm Space Rat Brain atlas and the Allen Mouse Brain atlas are now also available via the
EBRAINS Interactive Atlas Viewer with optional display of different atlas versions, hierarchical
overview of delineated structures, and links to EBRAINS datasets connected to the atlases. Updated
atlas versions with hierarchically organised delineations, are now also available in the NUTIL analysis
tool. The hierarchical organisation improves data queries and analyses, allowing users to specify
regions or selected substructures.
3.2 New release of Interactive Atlas Viewer
The latest release of the 3D Interactive Atlas Viewer described in Section 2.2.1 has received a major
update of the user interface that incorporates several improvements, suggested by users, and
implements a range of new functionalities. Most importantly, it supports the concept of a multilevel
atlas more explicitly by allowing one selected atlas to provide different complementary maps in
multiple reference spaces, each with possibly multiple granularities and versions.
The new features include an improved search box for finding, selecting and navigating to brain
regions (Figure 21B) that can be expanded into a full searchable region hierarchy browser (Figure
21D), a new layer browser which provides navigation between different reference template spaces
and maps offered by a multilevel atlas (Figure 21E), and a coordinate navigation tool for direct
manipulation of the view in physical and voxel coordinates, reset of rotation/zoom/pan, and sharing
the current scene (Figure 21C).
D4.2 (D33) SGA3 M8 ACCEPTED 210504.docx PU = Public 4-May-2021 Page 22 / 31You can also read