A Practical Review of NMR Lineshapes for Spin-1/2 and Quadrupolar Nuclei in Disordered Materials - MDPI
←
→
Page content transcription
If your browser does not render page correctly, please read the page content below
International Journal of
            Molecular Sciences

Review
A Practical Review of NMR Lineshapes for Spin-1/2
and Quadrupolar Nuclei in Disordered Materials
Kuizhi Chen
 Nation High Magnetic Field Laboratory, Tallahassee, FL 32310, USA; kuizhi.chen@magnet.fsu.edu

 Received: 29 June 2020; Accepted: 5 August 2020; Published: 7 August 2020

 Abstract: NMR is a powerful spectroscopic method that can provide information on the structural
 disorder in solids, complementing scattering and diffraction techniques. The structural disorder in
 solids can generate a dispersion of local magnetic and electric fields, resulting in a distribution
 of isotropic chemical shift δiso and quadrupolar coupling CQ . For spin-1/2 nuclei, the NMR
 linewidth and shape under high-resolution magic-angle spinning (MAS) reflects the distributions of
 isotropic chemical shift, providing a rich source of disorder information. For quadrupolar nuclei,
 the second-order quadrupolar broadening remains present even under MAS. In addition to isotropic
 chemical shift, structural disorder can impact the electric field gradient (EFG) and consequently the
 quadrupolar NMR parameters. The distributions of quadrupolar coupling and isotropic chemical shift
 are superimposed with the second-order quadrupolar broadening, but can be potentially characterized
 by MQMAS (multiple-quantum magic-angle spinning) spectroscopy. We review analyses of NMR
 lineshapes in 2D DQ–SQ (double-quantum single-quantum) and MQMAS spectroscopies, to provide
 a guide for more general lineshape analysis. In addition, methods to enhance the spectral resolution
 and sensitivity for quadrupolar nuclei are discussed, including NMR pulse techniques and the
 application of high magnetic fields. The role of magnetic field strength and its impact on the strategy
 of determining optimum NMR methods for disorder characterization are also discussed.

 Keywords: disorder; solid-state NMR; amorphous material; quadrupolar nuclei; lineshape;
 high-field NMR; DQ–SQ; MQMAS; inhomogeneous broadening

1. Introduction
      Disordered structures are found in a wide variety of solid-state materials, such as glasses [1,2],
polymers [3,4], batteries [5,6], solid state catalysts [7,8], metal-organic frameworks [9,10], etc. Many of
these materials have partial or complete crystallinity, and are therefore typically characterized using
scattering and diffraction techniques. However, these techniques offer only “average” structural
information [11]. Solid state NMR is a complementary method that can provide local structural
information at the atomic level without the requirement of the long-range order and periodicity.
Material structures can be characterized in two different regimes in solid-state NMR, namely,
spectroscopy [2,12,13] and relaxometry [3,4,14]. In particular, the former refers to the spectral
analysis such as chemicals shift, lineshape and linewidth, while the latter consists of measurements
of nuclear relaxation times [14]. The focus of this review will be on the “spectroscopy” regime in
solid-state NMR. We present a survey of modern NMR techniques, which can serve as a useful
summary for experts in the field, but is primarily intended as a practical introduction for material
scientists whose research may benefit from these cutting-edge applications of NMR.
      The local magnetic field induced by the external magnetic field, i.e., the chemical shielding,
is reflected as a chemical shift and is sensitive to the surrounding electron environment of the nuclei.
A distinct chemical shift stemmed from the variety chemical bondings provides the NMR spectral
resolution and assignment. A structural disorder can cause small changes to the local environment,

Int. J. Mol. Sci. 2020, 21, 5666; doi:10.3390/ijms21165666                        www.mdpi.com/journal/ijms
Int. J. Mol. Sci. 2020, 21, 5666                                                                     2 of 22

which can lead to variations of the chemical shielding. For spin-1/2 nuclei, magic-angle spinning (MAS)
averages chemical shift anisotropy (CSA) yielding high-resolution spectra with only the isotropic
chemical shift δiso . Thus, the line broadening and shape in MAS spectra of spin-1/2 nuclei reflect directly
the distribution of δiso induced by the disorder. For spin>1/2 nuclei, an additional spin interaction can
occur between the electric quadrupole moment and the electric field gradient (EFG) at the nuclear site.
The quadrupole moment is zero for all spin-1/2 nuclei, whereas spin>1/2 nuclei can have quadrupolar
interactions, and are therefore referred to as quadrupolar nuclei. Large quadrupolar interactions cause
rapid spin-spin (T2 ) relaxation and significant quadrupolar broadening, making NMR spectroscopy
of quadrupolar nuclei relatively more difficult than spin-1/2 nuclei. A structural disorder affects the
NMR spectra of quadrupolar nuclei through both the δiso and the EFG, which can be represented by
CQ (quadrupolar coupling constant) and ηQ (asymmetry parameter). Thus, the characterization of
quadrupolar nuclei is more complicated due to the superimposition of isotropic and quadrupolar
interactions. However, given that the quadrupolar interaction provides an additional “set of parameters”
that can reflect the local structural changes, performing NMR characterizations on quadrupolar nuclei
in addition to more common spin-1/2 nuclei could play important roles in revealing material structures.
      In the periodic table, more than 75% of NMR active nuclei are quadrupolar and many of them such
as 27 Al, 11 B, 71 Ga, 73 Ge, 17 O, 23 Na and 67 Zn can be found in various type of materials. These nuclei
have half-integer spins (I = 3/2, 5/2, 7/2 and 9/2) and the quadrupolar interaction to the central
m = 1/2  -1/2 transition (CT) vanishes at the first-order. Compared to the broad signals arising from
satellite transitions (STs), relatively narrow CT signals can be acquired for these half-integer quadrupolar
nuclei. However, the second-order quadrupolar interaction still remains even under magic-angle
spinning (MAS). Therefore, MAS NMR spectra, which display both an isotropic chemical shift and
a second-order quadrupolar interaction, are more complex than spin-1/2 nuclei. Note that the latter
consists of both the isotropic quadrupolar shift and anisotropic broadening terms. Several methods have
been developed to remove the quadrupolar broadening, namely, dynamic angle spinning (DAS) [15,16],
double rotation (DOR) NMR [15,16], multiple-quantum magic-angle spinning (MQMAS) [17,18] and
satellite transition magic-angle spinning (STMAS) [19,20]. Two-dimensional MQMAS and STMAS
have gained popularity recently as they can refocus the anisotropic quadrupolar broadening using
standard MAS probes. The separation between isotropic and quadrupolar terms can be achieved by
these two methods as the relative scales between isotropic chemical and quadrupolar shifts varies
between the different transitions presented along the two dimensions [21]. These 2D experiments can
help to untangle various contributions to the spectral broadening from structural disorder.
      High magnetic fields are of particular importance to solid-state NMR of quadrupolar nuclei.
The application of high fields can provide direct improvement to the spectral resolution in 1D MAS
spectra through the reduction of anisotropic second-order quadrupolar broadening that remains
under MAS. This high-field advantage has been demonstrated using low-homogeneity unregulated
superconducting/resistive hybrid magnet up to 40 T at the National High Magnetic Field Laboratory
(NHMFL) [22]. The NHMFL has recently commissioned a series-connected-hybrid (SCH) magnet with
a more homogeneous and regulated field up to 36 T [23]. The availability of high-field superconducting
magnets and the even higher hybrid magnets is particularly useful to enhance the spectral resolution
and sensitivity of quadrupolar nuclei for both 1D and more demanding 2D experiments, as well as for
highly crystalline and amorphous solids with a disorder. We will provide a detailed discussion of the
2D MQMAS method with high-fields in a later section. Typically, NMR experiments performed on
quadrupolar nuclei have low sensitivity and/or broad-line problems due to low gyromagnetic ratios,
low natural abundances and/or large quadrupole moments. This review will give a brief overview of
modern NMR methods, including some from recent developments that address these issues related to
quadrupolar nuclei, such as QCPMG (quadrupolar Carr–Purcell–Meiboom–Gill) [24,25] and central
transition polarization [26,27], which enhance sensitivity, and QMAT (quadrupolar magic angle
turning)/QPASS (quadrupolar phase adjusted sideband suppression), which separate isotropic band
from sidebands [28–30].
Int. J. Mol. Sci. 2020, 21, 5666                                                                     3 of 22

      In this review, we demonstrate several techniques of disorder characterization in both the
spin-1/2 and quadrupolar nuclei cases, taking solid catalyst zeolite, among a few other materials
from the literature, as our primary examples. Zeolite is usually known as a crystalline material with
microporous framework structure, but the location of active sites and amorphous protonic contents
can be considered as disordered on the environments to the nuclei under investigation. In addition,
the existence of numerous distinct crystalline inequivalent sites, for example as many as 12 in the
case of MFI zeolites [31,32], can have similar effects and consequences to 27 Al and 17 O NMR [8,33,34],
when not resolved, as distributions of isotropic chemical shift and quadrupolar coupling parameters
from disordered structures. DFT (Density Functional Theory) calculations have been used to directly
relate NMR parameters to structural differences and variations, modeled either as many distinct
crystalline sites or continuous distributions from disorder. [11] Such an approach has prompted
increased interest in recent research in heterogeneous catalysis, such as revealing aluminum/proton
site distributions in zeolite [32,35,36] and amorphous silica-alumina catalysts [37].
      The following discussion is divided into two sections. Section 2 focuses on revisiting the basics of
NMR lineshapes for spin-1/2 nuclei in both 1D and 2D spectroscopy, followed by an illustration of the
effects of disorder on the lineshape, with examples on 2D DQ–SQ correlation spectroscopy and the
various interpretation methods from the literature. Section 3 extends the discussion of disorder effects
to quadrupolar NMR nuclei, by first reviewing the fundamentals of quadrupolar NMR spectroscopy,
including high-field effects, and then detailing the strategy of disorder characterization through
examples of MQMAS experiments.

2. NMR Detection of Spin-1/2 Nuclei in Disordered Environments

2.1. Impacts of Disorder on 1D NMR Spectroscopy

2.1.1. NMR Lineshapes of Spin-1/2 Nuclei
    The Fourier transformed NMR spectrum of an isolated I = 1/2 spin can be represented
mathematically by Equation 1, where Ω0 is the center frequency of the peak, S0 is the signal intensity
and R = T2 −1 is the transverse relaxation rate. Defined by the equation, the peak is a Lorentzian
shape [38].
                                                    S0 R
                                      S( Ω ) =                                                     (1)
                                               (Ω − Ω0 )2 + R2
      For an ensemble of spins with a distribution of its resonant frequency, the lineshape can become
Gaussian or a mixture of both components. The Lorentzian lineshape is often found in the spectra of
solutions, while the Gaussian shape is more common in solids as a result of a distribution of Lorentzian
peaks due to the rigidity of the system [39]. The NMR peak can be broadened by two mechanisms,
namely, homogeneous and heterogeneous broadening, which stem from two different types of local
field interactions. Briefly, homogeneous broadening is generated by randomly fluctuating local fields,
whereas the inhomogeneous broadening arises from the local field that does not vary in the time scale
of the signal measurement [40,41]. The disorder in materials, as the primary interest in this review,
can often lead to inhomogeneous broadening. Although the inhomogeneous broadening can arise
from multiple factors as listed below, the essential origins can all be attributed to a distribution of the
resonant frequency induced by the magnetic field dispersion. It is important to inspect the factors
causing the spectral broadening for the purpose of disorder characterizations. Including structural
disorder of the material, a few common factors that result in inhomogeneous broadening and their
origins can be summarized as follows:

a.      Structural disorder, chemical shielding;
b.      CSA (chemical shift anisotropy), chemical shielding;
c.      Imperfect shimming, external field;
d.      Bulk magnetic susceptibility (BMS), internal field;
Int. J. Mol. Sci. 2020, 21, 5666                                                                       4 of 22

e.      Anisotropy bulk magnetic susceptibility (ABMS), internal field;
f.      Dipolar coupling from nearby spins, dipole–dipole interaction;
g.      J-coupling, through-bond interaction.
       Although many factors exist, the interesting term, i.e., the disorder induced broadening (a), can still
be safely characterized with common NMR techniques employed, particularly, MAS (magic-angle
spinning) and decoupling methods, as the disorder broadening is not affected by either of them.
Among the factors, the CSA (b) and dipolar coupling (f) are the most prominent interactions but can
be sufficiently suppressed by MAS [40]. In general, the magnitude of CSA ranges from tens of ppm
in 1 H to 120–140 ppm in 13 C and can be much larger in some heavier nuclei (up to 1000 s ppm) [42].
It is important to notice that the magnitude of CSA is constant in ppm at variable fields. In contrast,
dipolar coupling is constant in Hz at variable fields with magnitude ranges from a few to tens of
kHz (up to 100 kHz between two proton spins), depending on the gyromagnetic ratios and spatial
distances between the coupled spins [38,42]. In addition to MAS, hetero- [43] and homo-nuclear [44,45]
decoupling methods have been extensively used to reduce or remove the dipolar coupling broadening.
The other interactions are minor but worthy of inspections in order to ensure that disorder is the
primary effect contributing to the lineshapes being analyzed. Imperfect shimming (c) creates an
external field gradient that broadens the peak, and thus its effect cannot be removed by MAS. The bulk
magnetic susceptibility (BMS) (d) refers to magnetic fields induced at different parts of the sample,
such as the field induced by bubbles in liquid and voids in solid samples, whose susceptibility tensor
is NOT orientation dependent, and therefore behaves like magnetic dipoles and can be removed
by MAS [46]. The anisotropic bulk magnetic susceptibility (ABMS) (e), on the order of 1–2 ppm,
produces a dispersion of chemical shifts in a way similar to the ring current shifts in aromatic systems,
and therefore cannot be removed by MAS [47,48]. Hence, ABMS needs to be treated carefully in the
lineshape analysis of disordered structures. Finally, the through-bond J-coupling (g) is not removed by
MAS but is usually considered a weak interaction, as it is normally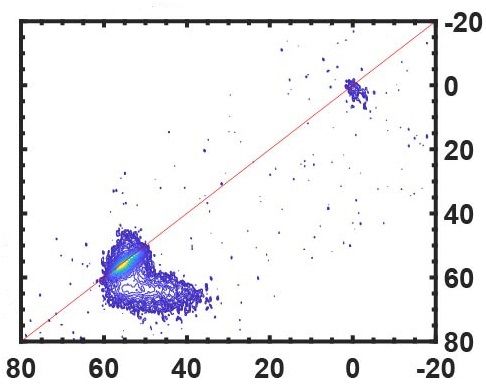
Int. J. Mol. Sci. 2020, 21, 5666 5 of 22
under MAS [41]. However, such broadening can be reduced by increasing spinning speed, increasing
field strength and/or
Int. J. Mol. employing
Sci. 2020, decoupling
21, x FOR PEER REVIEW sequences [41,44]. In this case, because the 5zeolite
of 22 catalyst
possesses a dilute proton system, the homonuclear-coupling-induced broadening is not a concern at
sequences [41,44]. In this case, because the zeolite catalyst possesses a dilute proton system, the
moderate spinning speed (10 kHz).
homonuclear-coupling-induced broadening is not a concern at moderate spinning speed (10 kHz).
a.
CSA δiso
d.
b. Dipolar MAS
coupling * * *
c.
Both
MAS
Static
δiso
e. f.
MAS
* *
Figure 1. Figure
(a–c) 1.Simulated
(a–c) Simulated powderlineshapes
powder lineshapes ofofstatic spectra
static spectra (13 C
(13C at 9.4 T) with 3 kHz
at 9.4 chemical
T) with shift chemical
3 kHz
anisotropy (CSA) and 5 kHz dipolar coupling interactions introduced separately or together as
shift anisotropy (CSA) and 5 kHz dipolar coupling interactions introduced separately or together as
indicated in the figures. With 5 kHz magic-angle spinning, all inhomogeneous patterns in (a–c) break
indicated upin to
the figures. With 5 kHz magic-angle spinning, all inhomogeneous patterns in (a–c) break
an isotropic peak and spinning sidebands, as shown in (d). (e,f) show the suppression of dipolar
up to an isotropic peak
coupling and CSAandforspinning sidebands,
a dehydrated as shown
zeolite HZSM-5 in in
catalyst (d).
1H(e,f)
NMRshow the suppression
by magic-angle spinning of dipolar
coupling and(MAS).CSA for a dehydrated
The spectra zeoliteat HZSM-5
of (e,f) were acquired 9.4 T, wherecatalyst in 1 H atNMR
(f) was acquired by frequency
spinning magic-angle
of 10 spinning
(MAS). The kHz. Spinning
spectra ofsidebands
(e,f) wereare denoted
acquired in “*”.
at 9.4 T, where (f) was acquired at spinning frequency of
10 kHz. Spinning
2.1.3. Effect of sidebands
Disorder onare 1D denoted
MAS NMR in Spectroscopy
“*”.
2.1.3. Effect ofChemical
Disordershift
onis1D
very sensitive
MAS NMR to Spectroscopy
the local environment of the nucleus. The changes in the
chemical shift can essentially be attributed to deviations of the local magnetic fields, which, are
Chemical
induced shift is veryinsensitive
by changes to the local
chemical shielding and canenvironment
be generated by of athe nucleus.
number Thefactors
of possible changes in the
including the structural disorder, molecules with different conformations, a rich hydrogen
chemical shift can essentially be attributed to deviations of the local magnetic fields, which, are induced bonding
environment, or imperfect crystalline packings, among others. Significant changes of local
by changes in chemical shielding and can be generated by a number of possible factors including the
environment (i.e., changes in coordination number) will lead to large changes of the chemical shift,
structural observed
disorder,asmolecules with Relatively
separated peaks. different small
conformations,
changes (i.e.,achanges
rich hydrogen bonding
in bond angle and/orenvironment,
bond or
imperfect distance)
crystallinewillpackings, among others.
result in variations Significant
to the chemical shift, changes
leading toofa local environment
chemical (i.e., changes in
shift distribution,
observed
coordination as inhomogeneous
number) will lead tobroadening to the spectrum.
large changes Such a broadening
of the chemical effect is illustrated
shift, observed in
as separated peaks.
Figure 2 by an NMR investigation of stepwise morphology change (“crystalline” to “crystalline with
Relatively small changes (i.e., changes in bond angle and/or bond distance) will result in variations to
site disorder” to “amorphous”) in a drug molecule system, adapted from work by Clawson et al. [12].
the chemical shift,
Figure leading
2a shows a 13C to
CPaMAS
chemical
spectrum shift
of a distribution,
crystalline powder observed as inhomogeneous
sample formed by mixing the drug broadening
to the spectrum. Such a broadening effect is illustrated in Figure 2 by an NMR investigation of
stepwise morphology change (“crystalline” to “crystalline with site disorder” to “amorphous”) in a
drug molecule system, adapted from work by Clawson et al. [12]. Figure 2a shows a 13 C CP MAS
spectrum of a crystalline powder sample formed by mixing the drug molecule I in base A (tartaric
acid) in a 1: 1 ratio, where the molecular structures are illustrated on top of the figure. The sharp lines
in the NMR spectrum suggest that the system attains a high crystallinity, in agreement with the sharp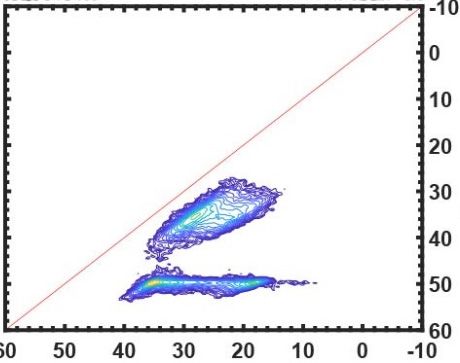
Int. J. Mol. Sci. 2020, 21, 5666                                                                                                 6 of 22
           Int. J. Mol. Sci. 2020, 21, x FOR PEER REVIEW                                                           6 of 22

          molecule
diffraction   peaksI in inbase
                            the AXRD
                                   (tartaric acid) in In
                                         pattern.      a 1:Figure
                                                            1 ratio, where
                                                                      2b, bythecrystallizing
                                                                                  molecular structures   are illustrated
                                                                                                  the mixture             on base B in
                                                                                                                   of I and
          top of the figure. The sharp lines in the NMR spectrum suggest that the system attains a high
a 1: 2.8 ratio,   a disorder occurred selectively on a carbonyl site, visualized as broadening effects on
          crystallinity, in agreement with the sharp diffraction peaks in the XRD pattern. In Figure 2b, by
the carbonyl     peaksthe
          crystallizing   at mixture
                              aroundof180     ppm.
                                          I and base BThe     triplet
                                                         in a 1:        is aindicative
                                                                 2.8 ratio,                of a crystalline
                                                                             disorder occurred   selectively onsystem     with multiple
                                                                                                                 a carbonyl
molecules site,
             in visualized    as broadening
                 the asymmetric                effects
                                       unit (Z’),        on the carbonyl
                                                    according                 peaks at The
                                                                     to the author.      around  180pattern,
                                                                                               XRD    ppm. Thehowever,
                                                                                                                   triplet is still shows
          indicative of
high crystallinity     duea crystalline
                             to the lacksystem   with multiple
                                            of sensitivity     to molecules
                                                                   the local in   thedisorder.
                                                                                site  asymmetric    unit (Z’),
                                                                                                  When    theaccording
                                                                                                                sample was to prepared
          the author. The XRD pattern, however, still shows high crystallinity due to the lack of sensitivity to
in a non-crystalline       form by mixing I and base B in a specific ratio 1: 1.4, as indicated in Figure 2c,
          the local site disorder. When the sample was prepared in a non-crystalline form by mixing I and base
both the BNMRin a specific ratio 1:pattern
                     and   XRD                were broadened
                                   1.4, as indicated                    andthe
                                                       in Figure 2c, both      lost
                                                                                 NMRresolution,     due to
                                                                                       and XRD pattern    werethe  loss of long-range
                                                                                                                 broadened
          and   lost resolution,  due  to the loss  of  long-range    order.  Note  that  the inhomogeneous
order. Note that the inhomogeneous broadening arising from the chemical shift distribution should               broadening
          arising from the chemical shift distribution should always be differentiated from the homonuclear
always be     differentiated from the homonuclear broadening [49]. One-dimensional spectroscopy is
          broadening [49]. One-dimensional spectroscopy is usually incapable of distinguishing between these
usually incapable      of distinguishing between these two effects, but 2D NMR methods can, by producing
          two effects, but 2D NMR methods can, by producing different types of cross peaks in each case, as
different will
           types    of cross below.
                be discussed    peaks in each case, as will be discussed below.

                          I: Drug molecule                    A: Tartaric acid                 B: Propionic acid

                  a. Crystalline
                        I:A = 1:1

                  b.     Crystalline with site disorder
                         I:B = 1:2.8

                   c.    Amorphous
                          I:B = 1:1.4

                13 C CP-MAS
      Figure 2.Figure 2. 13C CP-MAS   spectra
                                 spectra   andandXRD
                                                  XRD patterns
                                                       patternsshowing
                                                                  showing a drug material
                                                                              a drug       I prepared
                                                                                         material      with different
                                                                                                   I prepared      with different
               degrees of disorder. A and B are both base molecules that can affect the formation of crystallinity for
      degrees of disorder. A and B are both base molecules that can affect the formation of crystallinity for I.
      The material in crystalline (a), crystalline with site disorder (b) and amorphous (c) forms were prepared
      by mixing I with A or B at ratios indicated in each figure. Reprinted from Ref. [12], Copyright (2011),
      with permission from Elsevier.

2.2. Impacts of Disorder on 2D NMR Spectroscopy

2.2.1. Lineshapes in 2D NMR
     It is well known that Lorentzian and Gaussian peaks appear in different shapes in 2D NMR, i.e.,
“star” and “round” shapes in each case, as illustrated in simulations in Figure 3a,b [50]. In solids,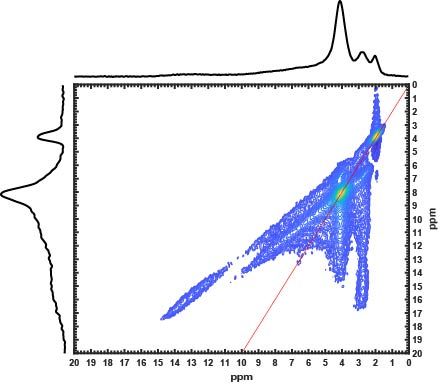
Int. J. Mol. Sci. 2020, 21, x FOR PEER REVIEW 7 of 22
I. The material in crystalline (a), crystalline with site disorder (b) and amorphous (c) forms were
prepared by mixing I with A or B at ratios indicated in each figure. Reprinted from Ref. [12],
Int. J. Mol. Sci. 2020, 21, 5666 7 of 22
Copyright (2011), with permission from Elsevier.
2.2. Impacts of Disorder on 2D NMR Spectroscopy
peak shapes are commonly Gaussian, or a mixture of both Gaussian and Lorentzian, in which case
one expects2.2.1. Lineshapes
a shape in 2Dto
similar NMRthose shown in Figure 3b,c. However, chemical shift dispersion,
essentially caused by aknown
It is well dispersion of the and
that Lorentzian local magnetic
Gaussian peaksfield,
appearcan “stretch”
in different a 2D
shapes in 2Dcross
NMR,peaki.e., from a
“star” and
symmetric shape into“round” shapes in each
an elongated case,The
ridge. as illustrated
effect isinillustrated
simulations in Figure
here 3a,b [50]. In solids,
analogously by observing
peak shapes are commonly Gaussian, or a mixture of both Gaussian and Lorentzian, in which case
the shape changes on a solution 2D cross peak with a “field dispersion” intentionally introduced
one expects a shape similar to those shown in Figure 3b,c. However, chemical shift dispersion,
by shimming [50]. The Gaussian–Lorentzian mixed crossfield,
peak 23 Na NOESY
essentially caused by a dispersion of the local magnetic canin Figurea 3c
“stretch” 2D was
cross apeak
2D from a
spectrum acquired
symmetricon 2 Minto
shape NaCl in D2 O.ridge.
an elongated Upon Thethe introduction
effect of the
is illustrated here shimming
analogously gradient,
by observing thethe cross
peak becameshape changes
a narrow on a stretched
ridge solution 2Dalongcross peak with a “field
the diagonal, as dispersion” intentionally
shown in Figure 3d. Theintroduced
change byoccurred
shimming [50]. The Gaussian–Lorentzian mixed cross peak in Figure 3c was a 2D 23Na NOESY
because atoms in different parts of the sample started to experience different effective magnetic fields,
spectrum acquired on 2 M NaCl in D2O. Upon the introduction of the shimming gradient, the cross
resulting inpeak
a distribution
became a narrow of resonant frequencies,
ridge stretched along thewhich is visualized
diagonal, as shown inasFigure
a distribution
3d. The changeof chemical
shift. In other words,
occurred the ridge
because atomsin in Figure
different3d is aofsuperposition
parts the sample started of cross peaks at
to experience different
different parts of the
effective
magnetic fields,
sample, as illustrated by theresulting
schematicin a distribution
in Figure 3e. of resonant frequencies,
In this specific which
case, the islocal
visualized as a
field dispersion is
distribution of chemical shift. In other words, the ridge in Figure 3d is a superposition of cross peaks
manipulated by a shimming gradient in a static solution spectrum. However, the same effect occurs
at different parts of the sample, as illustrated by the schematic in Figure 3e. In this specific case, the
for isotropiclocal
peaksfieldin solids at
dispersion the MAS condition,
is manipulated by a shimming as long as in
gradient the localsolution
a static field dispersion exists. Indeed,
spectrum. However,
the dispersion
the in
samesolids
effectcan be for
occurs caused by peaks
isotropic disorder but at
in solids also
the ABMS as bothasoflong
MAS condition, them arelocal
as the not field
removed by
dispersion exists. Indeed, the dispersion in solids can be caused by
MAS. In a 1D spectrum, if the broadening is a homogeneous broadening, the broadened line is not a disorder but also ABMS as both
of them are not removed by MAS. In a 1D spectrum, if the broadening is a homogeneous broadening,
superposition of individual narrower peaks, and therefore the cross peak does not appear stretched
the broadened line is not a superposition of individual narrower peaks, and therefore the cross peak
but rather asdoes
a more circular
not appear shape
stretched but[51].
rather as a more circular shape [51].
a. b. c.
Lorentzian Gaussian Lorentzian+Gaussian
e.
d.
With field gradient
Figure 3. The line-shape
Figure of cross peaks
3. The line-shape of crossinpeaks
2D spectroscopy in (a)
in 2D spectroscopy in Lorentzian,
(a) Lorentzian,(b)
(b)Gaussian and(c)(c) mixed
Gaussian and
shapes. Themixed shapes.in
spectrum The spectrum
(a,b) in (a,b) are simulated
are simulated andisina(c)23isNa
and in (c) a 23Na NOESYspectrum
NOESY spectrum acquired on on 2 M
acquired
2 M NaCl in D2O. (d) is acquired on the same sample as of (c) but with a shim gradient applied during
NaCl in D2 O. (d) is acquired on the same sample as of (c) but with a shim gradient applied during the
the experiment. The schematic in (e) illustrates three spins located at different positions of the sample
experiment. The schematic in (e) illustrates three spins located at different positions of the sample and
their frequencies in the spectrum. (a–d) are reprinted from Ref. [50], Copyright (1995), with permission
from Elsevier.
2.2.2. Effect of the Disorder on 2D MAS NMR Spectroscopy
The lineshape information contained in the 2D spectrum can be extremely useful for understanding
the structural disorder. Promising applications have been reported in the characterization of disordered
materials using 2D homonuclear or heteronuclear correlation experiments, for example, double-quantum
single-quantum (DQ–SQ) [13,51] and heteronuclear correlation (HETCOR) experiments [48,52].
These methods normally show remarkable resolution improvements compared to 1D spectroscopy
because of the presence of the correlated connections between species and the absence of signal for
non-coupled spins. Although only DQ–SQ spectroscopy was chosen for lineshape analysis in this
review, by no means is it the only method for this type of analysis.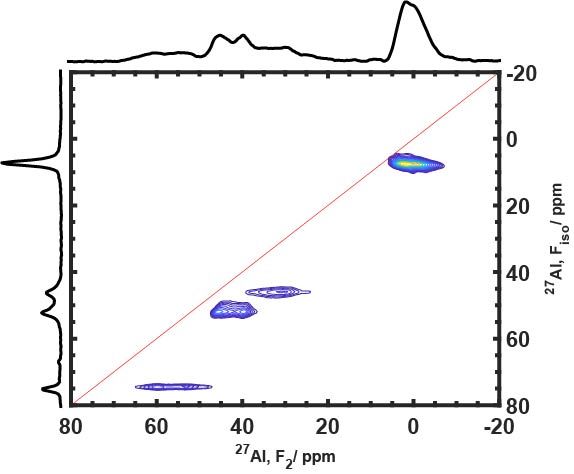
Int. J. Mol. Sci. 2020, 21, 5666                                                                                                       8 of 22

     In a DQ–SQ NMR spectrum, the correlation is observed at the double-quantum frequency shown
by the summed chemical shifts of coupled pairs in the single-quantum dimension. For example,
for a correlated pair whose chemical shifts are δ1 and δ2 in the single-quantum dimension (F2 ),
their correlation will be observed as two cross peaks horizontally aligned at δDQ = δ1 + δ2 in the
double-quantum dimension (F1 ). Since the magnetization evolves at twice the isotropic frequency
in the double-quantum dimension, a diagonal can be drawn with slope F1 /F2 = 2 to assist in the
interpretation of the spectrum. Inhomogeneous broadenings often appear as “stretched” ridges due
to the dispersion of chemical shift, as illustrated previously in Figure 3d. The shapes and slopes of
the ridges are important features since they correspond to changes of the local environment of the
paired spins. Figure 4 shows a few typical lineshapes in DQ–SQ correlation NMR spectra caused
by disorder. Figure 4a,c,e is the 1D MAS spectra of three different materials, namely, 31 P NMR
for N,N-bis(diphenylphosphino)-N-((S)-R-methylbenzyl) amine [13], 13 C NMR for 10% carbon-13
labeled cellulose extracted from wood [13] and 1 H NMR for dehydrated zeolite catalyst HZSM-5 [8].
Figure 4b,d,f are their associated 2D DQ–SQ spectra. Notably, the resolutions in these 1D spectra were
substantially degraded by broadening and their 2D spectra contained several stretched cross peaks,
which unambiguously indicate that the broadenings were inhomogeneous but not homogeneous.
The latter typically       yields
             Int. J. Mol. Sci. 2020, 21,circular
                                        x FOR PEER shapes
                                                   REVIEW in 2D correlation spectra [51]. 9 of 22

                      a.                                                 b.

                     c.                                                  d.

                      e.                                                 f.
                       Disordered
                       species                                                        Disordered species

                   Typical
      Figure 4. Figure          types
                          4. Typical    ofofdisorder
                                     types                patterns
                                              disorder patterns         illustrated
                                                                illustrated  by 1D MASbyand 1D
                                                                                             2D MASMASDQ-SQand    2D inMAS DQ-SQ
                                                                                                              spectra

      spectra in three
                   threematerials,
                             materials,which are 1D (a) and 2D INADEQUATE (b) 31P NMR for N,N-
                                             which are 1D (a) and 2D INADEQUATE 13(b) 31 P NMR for
                  bis(diphenylphosphino)-N-((S)-R-methylbenzyl)amine; 1D (c) and 2D INADEQUATE (d) C NMR
      N,N-bis(diphenylphosphino)-N-((S)-R-methylbenzyl)amine;                         1D (c)
                  for 10% carbon-13 labeled cellulose; 1D (e) and 2D dipolar-based DQ-SQ     (f) and 2Dfor
                                                                                                 1H NMR   INADEQUATE
                                                                                                            dehydrated          (d) 13 C
      NMR for 10%      carbon-13
                  zeolite             labeled
                          catalyst HZSM-5.       cellulose;
                                            (e) was acquired at1D
                                                                9.4 T,(e) and
                                                                       at 10 kHz2D   dipolar-based
                                                                                 spinning               DQ-SQ
                                                                                          frequency. (a–d)               1
                                                                                                                    (f) H NMR for
                                                                                                           are reprinted
      dehydrated (adapted)    with permission from Ref. [13]. Copyright (2020) American Chemical Society. (f) is
                  zeolite catalyst     HZSM-5. (e) was acquired at 9.4 T, at 10 kHz spinning frequency. (a–d) are
                  reprinted (adapted) with permission from Ref. [8]. Copyright (2020) American Chemical Society.
      reprinted (adapted) with permission from Ref. [13]. Copyright (2020) American Chemical Society. (f) is
      reprinted (adapted)
                  In the 31P with
                               DQ–SQ permission     from Ref.
                                        spectrum acquired     by [8].
                                                                   the Copyright
                                                                        INADEQUATE    (2020)   American
                                                                                          (Incredible       Chemical
                                                                                                       Natural   Abundance Society.
                DoublE QUAntum Transfer Experiment) method, as shown in Figure 4b, three coupled pairs are
                observed at 99, 108 and 116 ppm in the double-quantum (F1) dimension. The two cross peaks in each
                pair are all stretched in the same direction, i.e., parallel to the diagonal with slope F1/F2 = 2. The
                “stretch effect” is caused by chemical shift distribution due to local field distribution. The reason that
                both peaks are elongated concomitantly is because the local fields of the paired atoms change
                identically, which is believed to be caused by a symmetrical structural disorder in this case [13,51].
                However, anisotropic bulk magnetic susceptibility (ABMS) can also result in the similar “symmetric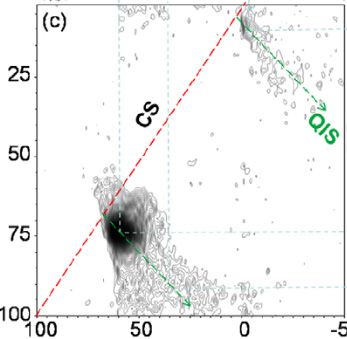
Int. J. Mol. Sci. 2020, 21, 5666                                                                     9 of 22

     In the 31 P DQ–SQ spectrum acquired by the INADEQUATE (Incredible Natural Abundance
DoublE QUAntum Transfer Experiment) method, as shown in Figure 4b, three coupled pairs are
observed at 99, 108 and 116 ppm in the double-quantum (F1 ) dimension. The two cross peaks in
each pair are all stretched in the same direction, i.e., parallel to the diagonal with slope F1 /F2 = 2.
The “stretch effect” is caused by chemical shift distribution due to local field distribution. The reason
that both peaks are elongated concomitantly is because the local fields of the paired atoms change
identically, which is believed to be caused by a symmetrical structural disorder in this case [13,51].
However, anisotropic bulk magnetic susceptibility (ABMS) can also result in the similar “symmetric
stretch” to the cross peaks, thus should always be carefully considered or ruled out when analyzing
disordered structures. A more complex example is presented in the 13 C spectra for the cellulose sample
shown in Figure 4c,d. Note the remarkable resolution improvement and the rich correlation features
of the 2D DQ–SQ (INADEQUATE) spectrum as compared to the 1D spectrum. These advantages of
the 2D spectrum enable one to extrapolate the disorder information via the appearance of the cross
peaks, particularly from the shapes and slopes. As a general observation, some cross peaks were
correlated in the same direction (parallel to the diagonal), such as peaks at ca. F1 = 150 ppm, however,
some were correlated in the reversed direction, such as the peaks at ca. F1 = 140 ppm. The peaks at ca.
F1 = 165 and 180 ppm show even richer features. The authors Cadars et al. have proposed a model to
systematically address the appearances for all correlated peaks, based on the population distribution
of individual chemical shift components in the coupled spins [51]. As a concept adapted from their
work, y = kx can be used as a convenient expression to address the peak features (particularly the
slopes), where k is the virtual linewidth ratio between the correlated peaks, and y and x are the slopes
for each of peaks. For instance, the peak pairs at F1 = 140 and 150 ppm can be expressed as y = −0.25x
(negative sign indicate opposite direction) and y = x, respectively [51]. More complex situations such
as the “horse shoe”-shaped cross peaks at F1 = 180 and the “arbitrarily”-shaped cross peaks at 165 ppm
would require a comprehensive analysis with the model. Without examining the details of the model,
the shapes can still be reasonably understood by the k value, i.e., both complicated shapes arise from
overlapped cross peaks with different k values. This model provided by Cadars et al. may cover most
lineshapes in the DQ–SQ spectrum, but a special case is worth mentioning, as shown in Figure 4f,
which is a 2D DQ–SQ 1 H MAS NMR spectrum for a dehydrated zeolite HZSM-5 recently reported
by Chen et al. [8]. In this case, the lineshape corresponds to a system where significantly disordered
species are coupled to non-disordered species. The narrow peaks at 2.8 and 4.2 ppm (non-disordered)
are both coupled to the broad-line ranging from 5 to 10 ppm (disordered) as shown in the deconvoluted
spectrum in Figure 4e, resulting in straight vertical ridges at both 2.8 and 4.2 ppm and two narrow
ridges on the other side of the diagonal. The slopes of the latter ridges, however, are not parallel to the
diagonal at F1 /F2 = 2, but appear with the value of F1 /F2 = 1, which is reasonable because with the
chemical shifts of individual components within 5–10 ppm increasing along the F1 dimension, the 2.8
and 4.2 ppm peaks remained constant. Consequently, the slope was fixed to 1 due to the basic rule
δDQ = δ1 + δ2 . Note that the discussion above was focused on the lineshape analysis and not on the
detailed structural implications. Although the lineshape analysis discussed here was limited to specific
materials, it is clear that rich information about disordered structures can be extracted from 2D NMR
spectroscopy, which could find important applications in a wide range of systems.

3. NMR Detection of Quadrupolar Nuclei in Disordered Environments
      Solid-state NMR analysis of quadrupolar nuclei is more complex than spin-1/2 nuclei due to the
existence of quadrupolar coupling, which can only be partially averaged out by magic-angle spinning
with the remaining contribution typically much larger than CSA, dipolar coupling and the other
line-broadening resources discussed previously. Disorder leads to distributions of both the chemical
shift and EFG (electric field gradient). Therefore, the key to characterizing disorder in materials with
quadrupolar nuclei involved materials is to disentangle the isotropic and quadrupolar interactions.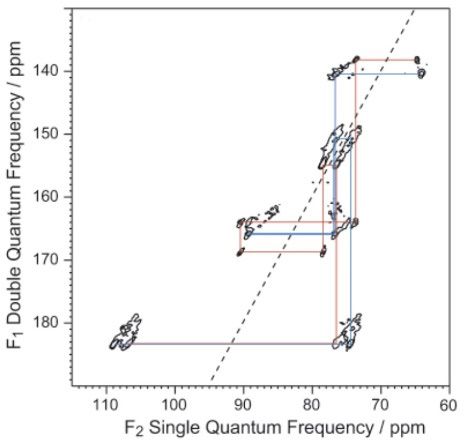
Int. J. Mol. Sci. 2020, 21, 5666                                                                               10 of 22

The discussion in this section is focused on high field applications and MQMAS characterizations,
which play important roles in quadrupolar NMR analysis.

3.1. NMR Spectroscopy of Quadrupolar Nuclei

3.1.1. Quadrupolar Effect
     For quadrupolar nuclei, the NMR spectra are not only affected by CSA, dipolar- and J-couplings,
but quadrupolar couplings that arise from the interaction between the electric quadrupole moment of
the nucleus and the surrounding electric field gradient (EFG). Such quadrupolar couplings can range
from a few kHz to several MHz or even a few GHz in magnitude [53,54]. The quadrupolar interaction
                                                                                 f ull      (1)    (2)             (1)
as a perturbation of the Zeeman interaction can be expressed as: HQ                      = HQ + HQ + . . ., where HQ
        (2)
and HQ are referred to as the first-order and second-order quadrupolar interactions, respectively.
The third-order terms are only necessary in uncommon occasions. For half-integer quadrupolar
nuclei, which are primarily focused in review, the quadrupolar perturbation of the Zeeman interaction
gives rises to central transition (CT) and satellite transitions (STs) in the NMR spectrum. However,
the transitions are often significantly broadened in spectra acquired on powder samples. It is often
only the relatively narrower CT that can be observed, being unaffected by the quadrupolar interaction
to the first-order [18,20,53]. The detailed expression of the perturbation theory can be found in the
book written by R. Wasylishen and S Ashrook et al. in Ref. [53]. The CT, however, is still affected
by the second-order interaction, which contains high-rank anisotropic terms that are not completely
averaged by magic-angle spinning, hence resulting in the remaining quadrupolar broadening to the
spectrum. In a spinning sample at the axis of β, the time averaged NMR frequencies of the second-order
interaction on the CT can be expressed as,

                                   ω2Q
              ω−1/2↔1/2 =                [S(S + 1) − 3/4][A0 + 8A2 (θ, ϕ)P2 (cosβ) + 18A4 (θ, ϕ)P4 (cosβ)]         (2)
                                   ωL

where S is the spin quantum number, ωQ is the quadrupolar coupling constant, ωL is the Larmor
frequency, A0 is a constant proportional to the isotropic quadrupolar shift, A2 (θ,ϕ) and A4 (θ,ϕ) are
the orientation-dependent terms responsible for the anisotropic lineshape in the powdered spectrum
and P2 and P4 are the second- and fourth-order Legéndre polynomials [18]. Under MAS where the
spinning angle β = 54.74◦ , the second-rank term P2 (cosβ) vanishes, however the fourth-rank term
P4 (cosβ) survives. It will require the sample to be spinning at a second angle β = 30.56◦ or 70.12◦
simultaneously to completely remove both A2 (θ,ϕ)P2 (cosβ) and A4 (θ,ϕ)P4 (cosβ), i.e., the anisotropic
broadening terms [15,18,53]. The MAS effects on the powder lineshapes of both spin-1/2 (with only
CSA simulated) and the CT of spin-n/2 nuclei (with only quadrupolar interaction simulated) are
illustrated in Figure 5 as denoted, where finite and infinite spinning rates are applied [55]. As shown
in the left figure, MAS broke the CSA pattern into an isotropic peak and spinning sidebands with
finite spinning rate and totally removed the sidebands with the spinning rate increased to infinite.
However, as shown in the right figure, the quadrupolar pattern was never completely eliminated even
at the infinite spinning rate, due to the remaining fourth-rank term discussed above. The resulted CT
peak under MAS contained the anisotropic lineshape whose width and shape were determined by the
quadrupolar coupling constant CQ and quadrupolar asymmetry parameter ηQ , respectively. In the
specific case in Figure 5 (right), the lineshape corresponded to ηQ = 0. Since quadrupolar broadening
masks other interactions in the smaller scales, it needs to be reduced, removed or separated for further
analysis to the spectrum. The second-order quadrupolar broadening is inversely proportional to the
external magnetic field B0 in Hz and to B0 2 in ppm, meaning increasing the field strength by a factor of
2 will narrow the line-width by a factor of 4 in ppm. Therefore, one obvious method to enhance the
resolution for quadrupolar nuclei is to raise the field strength. Another important method is to employ
two-dimensional methods such as 2D multiple-quantum magic angle spinning (MQMAS) [17,18]
Int. J. Mol. Sci. 2020, 21, 5666 11 of 22
or satellite-transition magic angle spinning (STMAS) [19,20] experiments, where the second-order
quadrupolar broadening
Int. J. Mol. Sci. 2020, is majorly
21, x FOR PEER REVIEWremoved by evolving the magnetization via multiple-quantum
12 ofor
22
satellite transitions in the indirect dimension.
δiso
Remaining
second-order
broadening
Figure 5. Simulated powder lineshapes in spectroscopy of spin-1/2 nuclei with only CSA (left) and
Figure 5. Simulated powder lineshapes in spectroscopy of spin-1/2 nuclei with only CSA (left) and
spin-n/2 nuclei with only quadrupolar interaction (right) at static, finite MAS and infinite MAS
conditionsnuclei
spin-n/2 with only
as denoted in thequadrupolar interaction
figure. With infinite (right)
MAS, CSA isatcompletely
static, finite MAS and
removed infinite
in the MAS
left bottom
conditions as denoted in the figure. With infinite MAS, CSA is completely removed in the
figure, however a broad quadrupolar lineshape presents in the bottom right figure due the remaining left bottom
figure, however
second-order a broad quadrupolar
quadrupolar broadening.lineshape presents
Adapted with in the bottom
permission right
from Ref. figure
[55]. due the2002,
Copyright remaining
Wiley.
second-order quadrupolar broadening. Adapted with permission from Ref. [55]. Copyright 2002,
3.1.2. Wiley.
Resolving Quadrupolar Species with Higher Fields and/or MQMAS Method
Performing experiments at high fields and using the MQMAS method are two common means
3.1.2. Resolving Quadrupolar Species with Higher Fields and/or MQMAS Method
to study quadrupolar nuclei. 27 Al MAS NMR spectra of A9B2 (9Al2 O3 ·2B2 O3 ), a crystalline sample
Performing
containing experiments
four distinct Al sites,at high fieldsasand
denoted AlO using
4 , AlO the5 (I),
MQMAS method
AlO5 (II) are two
and AlO common
6 , were acquiredmeans at
to study magnetic
multiple quadrupolar nuclei.
fields up to Al
27
40 MAS
T by GanNMR[22], spectraand of areA9B2 (9Al2Oin
presented 3·2B 2O3), a6b
Figure crystalline
to illustratesample
the
containing four
field-strength distinct
effects on theAlquadrupolar
sites, denoted lineas AlO4and
shape , AlO 5 (I), AlO
width. (II) and AlO6, of
The5 deconvolution were acquired
the four sites isat
multiple magnetic fields up to 40 T by Gan [22], and are presented in
shown in the spectrum acquired at 17.6 T in Figure 6a, where broad quadrupolar patterns dominate the Figure 6b to illustrate the field-
strength
lines and effects
result inonsignificant
the quadrupolar
overlaps.line shape and
Dramatic width. Theisdeconvolution
line-narrowing observed in the ofspectra
the four sites is
acquired
shown
with in strength
field the spectrum acquired
increased, at 19.6,
at 14, 17.6 T25inandFigure
40 T,6a, where broad
respectively. quadrupolar
Notably, patterns dominate
the quadrupolar pattern
the lines and
disappears at 40 result in significant
T, leaving all peaks overlaps. Dramatic line-narrowing
resolved completely. Though raisingisthe observed in theisspectra
field strength a neat
acquired
and with field strength
straightforward method,increased, at 14, 19.6,
it is not always 25 and 40 accessible.
conveniently T, respectively. As aNotably, the quadrupolar
complementary method,
pattern disappears
MQMAS, currently at the40most
T, leaving
popular allexperiment
peaks resolved completely. Though
for quadrupolar raising [11,56],
nuclei analysis the fieldoffers
strength
the
is a neat and
capability straightforward
of resolving quadrupolar method, it at
sites is not
lower always
fields.conveniently
Figure 6c shows accessible. As a complementary
a 2D MQMAS spectrum of
method,
A9B2, MQMAS,
which currently
was acquired theTmost
at 19.6 popular experiment
and performed with isotropic for quadrupolar
shearing [17,57]. nuclei
Theanalysis
shearing[11] [56],
process
offers the capability of resolving quadrupolar sites at lower fields.
is normally necessary for interpreting the MQMAS spectrum because the magnetization evolves at Figure 6c shows a 2D MQMAS
spectrumfrequencies
different of A9B2, which (due to was acquired at 19.6transition)
multiple-quantum T and performed with isotropic
in the indirect dimension,shearing
unless[17,57]. The
the split-t1
shearingis process
method employed is during
normally necessary for
the experiment [58].interpreting the MQMAS
In the isotropically shearedspectrum
spectrum,becausetheAl sites the
magnetization evolves at different frequencies (due to multiple-quantum
appears as horizontal ridges, with the direct F2 dimension broadened by the second-order quadrupolar transition) in the indirect
dimension,
coupling and unless the split-t1
the indirect Fiso method is employedseparated
(or F1 ) dimension during the δF1 = δiso −[58].
at experiment In qis
10/17δ the, respectively,
isotropically
sheared
where spectrum,
δiso and δqis are theAlthesites appears
isotropic as horizontal
chemical shift and ridges, with theinduced
quadrupole direct F2shiftdimension
[21,57]. broadened
Note that
by the second-order quadrupolar coupling and the indirect F
the F2 projection nearly reproduces the 1D spectrum shown in the 19.6 T trace in Figure 6b. The
iso (or F 1 ) dimension separated at δFF1iso=
δiso − 10/17δhowever,
projection, qis, respectively,
showswhere δiso and
completely δqis are the
resolved peaks isotropic chemical
of all four Al sitesshiftdue
andtoquadrupole
the removal induced
of the
shift [21,57]. Note that the
second-order quadrupolar broadening. F 2 projection nearly reproduces the 1D spectrum shown in the 19.6 T trace
in Figure 6b. The Fiso projection, however, shows completely resolved peaks of all four Al sites due to
the removal of the second-order quadrupolar broadening.Int. J. Mol. Sci. 2020, 21, 5666 12 of 22
Int. J. Mol. Sci. 2020, 21, x FOR PEER REVIEW 13 of 22
a. b.
c.
AlO6
AlO5 (II)
AlO5 (I)
AlO4
Figure 6. 27 Al MAS NMR of A9B2 (9Al O ·2B2 O3 ) acquired at 17.6 T showing the deconvolution of
Figure 6. 27Al MAS NMR of A9B2 (9Al22O33·2B2O 3) acquired at 17.6 T showing the deconvolution of
four sites (a) and, at four different fields 14, 19.6, 25 and 40 T showing field-dependent resolution
four sites (a) and, at four different fields 14, 19.6, 25 and 40 T showing field-dependent resolution
enhancement (b). All four sites are completely resolved at 40 T where quadrupolar broadening is
enhancement (b). All four sites are completely resolved at 40 T where quadrupolar broadening is
majorly removed. The peaks are also resolved in the 2D MQMAS spectrum at 19.6 T as shown in (c).
majorly removed. The peaks are also resolved in the 2D MQMAS spectrum at 19.6 T as shown in (c).
(a,b) are reprinted (adapted) with permission from Ref. [22]. Copyright (2002) American Chemical
(a,b) are reprinted (adapted) with permission from Ref. [22]. Copyright (2002) American Chemical
Society. (c) was acquired at 19.6 T at National High Magnetic Field Laboratory (NHMFL).
Society. (c) was acquired at 19.6 T at National High Magnetic Field Laboratory (NHMFL).
3.2. Disorder Observed by MQMAS Spectroscopy
3.2. Disorder Observed by MQMAS Spectroscopy
Due to its capability of separating isotropic and quadrupolar features, the MQMAS method is
Due
a promising to its capability
approach to of separating isotropic
disentangling and quadrupolar
the distributions features,
of the isotropic the MQMAS
chemical shift δmethod is a
iso and EFG,
promising approach to disentangling the distributions of the isotropic chemical
which can be induced by disorder or crystalline inequivalent sites. The distribution of EFG results shift δ iso and EFG,
which can be induced
in distributions of CQby disorder
, δqis and ηQor crystalline inequivalent
, specifically. An inspection sites.
ofThe distribution
all the of EFG
parameters that results in
affect the
distributions of C Q, δqis and ηQ, specifically. An inspection of all the parameters that affect the
lineshapes in MQMAS spectroscopy revealed three essential parameters, namely, the “distribution of
lineshapes in MQMAS
δiso ”, “magnitude of CQspectroscopy revealed
” and “distribution three
of C essential parameters, namely, the “distribution
Q ”. Common features of the MQMAS lineshapes are
of δiso”, “magnitude
summarized of CQ” and
and modeled “distribution
in six scenarios inofTable
CQ”. 1,Common
in termsfeatures of the MQMAS
of the contribution lineshapes
of each are
parameter,
summarized and modeled in six scenarios in Table 1, in terms of the contribution
denoted “P” for prominent and “N” for non-prominent. It is important to notice that the non-prominentof each parameter,
denoted “P” of forC prominent and “N” for non-prominent. It is important to notice that the non-
“magnitude Q ” does not include CQ = 0, because the multiple-quantum transitions will not be
prominent “magnitude of C Q” does not include CQ = 0, because the multiple-quantum transitions will
observed if there is no quadrupolar interactions. It merely represents the case where CQ is very small
not be observed if there is no quadrupolar interactions. It merely represents the case where CQ is very
small and/or the field strength is large so that quadrupolar broadening is minor or overwhelmed byInt. J. Mol. Sci. 2020, 21, 5666 13 of 22
and/or the field strength is large so that quadrupolar broadening is minor or overwhelmed by other
interactions in the spectrum. The quadrupole induced shift δqis is surely an important parameter,
but not included in Table 1 for the sake of simplicity, as it is a function of CQ by itself.
Table 1. Six scenarios of regular lineshapes in MQMAS spectrum determined by combinations of
“distribution of δiso ”, “distribution of CQ ” and “magnitude of CQ ”. “N” stands for non-prominent (does
not mean “not exist”), “P” stands for prominent. The key feature of each pattern is also commented.
Examples of real spectra are shown in Figure 7.
δiso CQ Features of Lineshape
Scenarios
Distribution Magnitude Distribution
I N (Non-prominent) N N Round
II N P N Horizontal ridge
III N P P Triangle
IV P (Prominent) P N Ridge along diagonal
V P P N Wide ridge parallel to diagonal
VI P P P Need fitting for analysis
Figure 7 shows a few representative experimental results selected from the literature [2,8,59]
to illustrate the scenarios summarized in Table 1. As the specific information for each material and
experiment is listed in detail in the caption of Figure 7, we focused here instead on the lineshape
analysis. The scenarios in Table 1 and their corresponding peaks in Figure 7 are labeled with the same
Roman numerals. The details of MQMAS theory and its fundamentals are described explicitly in
the literature [17,18,57,58,60], but we described here a few empirical trends in the appearance of the
lineshapes in i-sheared MQMAS spectroscopy, in order to point out typical connections between the
spectroscopic features and the changes to the NMR parameters. Similar trends have been previously
illustrated by Amoureux and Pruski [61]. The diagonal, or the chemical shift line, which is drawn in
each spectrum in Figure 7, provides the most important guidance for addressing the identity of each
resonance. A universal trend can be found in the MQMAS spectrum, as a function of the value of
CQ . For small values of CQ , the 2D peak appears closer to the chemical shift line; for larger values of
CQ , the peak moves further from the chemical shift line and the lineshape appears broader in the F2
dimension. The center of gravity of a given resonance along the F2 dimension is determined by δcenter
= δiso + δqis , where the quadrupole induced shift δqis has a negative sign and its absolute value is
proportional to CQ . The reason that the peak moves away from the chemical shift line is that the shift in
the isotropic dimension (F1 or Fiso ) is defined by δF1 = δiso − 10/17δqis . In other words, if CQ increases,
|δqis | increases so that δF1 becomes larger. In terms of the feature to the spectrum, increasing CQ will
generally elongate the width of the horizontal ridge and move it away (downward) from the chemical
shift line, and importantly, it will follow the QIS (quadrupole induced shift) line. These empirical
trends regarding the behavior of the MQMAS spectral pattern, with respect to the NMR parameters,
will assist in the interpretation of the different features illustrated in spectra Figure 7. Although the 2D
spectral patterns in Figure 7 arise from species with various CQ , at variable fields and with multiple
features, they can still be categorized into the scenarios listed in Table 1, as discussed below:Int. J. Mol. Sci. 2020, 21, 5666 14 of 22
Int. J. Mol. Sci. 2020, 21, x FOR PEER REVIEW 15 of 22
b.
a.
I
IV
II III
d.
c.
V
IV
II
e.
VI
Figure 7. Experimental spectra showing sheared MQMAS spectra of the six scenario lineshapes
Figure 7. Experimental spectra showing sheared MQMAS spectra of the six scenario lineshapes
described in Table 1, with the indication of chemical shift (CS) and/or quadrupole induced shift (QIS)
described in Table 1, with the indication of chemical shift (CS) and/or quadrupole induced shift (QIS)
lines. Projections are not shown as the focus is on the lineshape analysis. The detailed information of
lines. Projections are not shown as the focus is on the lineshape analysis. The detailed information of
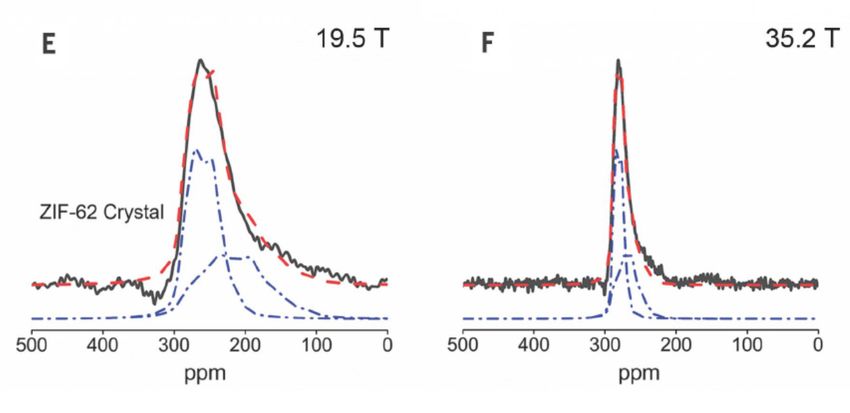
all figures are: (a) 27 Al MQMAS for hydrated zeolite HZSM-5 at 14.1 T; (b) 27 Al MQMAS of zeolite
all figures27are: (a) Al MQMAS for hydrated zeolite HZSM-5 at 14.1 T; (b) 27Al MQMAS
27 of zeolite
HUSY; (c) 27Al MQMAS for the same hydrated zeolite HZSM-5 in (a) but at 35.2 T; (d) 17 O17MQMAS for
HUSY; (c) Al MQMAS for the same hydrated zeolite HZSM-5 in (a) but at 35.2 T; (d) O MQMAS
hydrated zeolite HZSM-5 at 18.8 T and (e) 27 Al MQMAS of CaO-Al2 O3 -SiO2 glass at 17.6 T. (a) and (c)
for hydrated zeolite HZSM-5 at 18.8 T and (e) 27Al MQMAS of CaO-Al2O3-SiO2 glass at 17.6 T. (a) and
are reprinted (adapted) with permission from Ref. [8]. Copyright (2020) American Chemical Society.
(c) are reprinted (adapted) with permission from Ref. [8]. Copyright (2020) American Chemical
(b) is reprinted from Ref. [59], Copyright (2010), with permission from Elsevier. (d) was acquired at
Society. (b) is reprinted from Ref. [59], Copyright (2010), with permission from Elsevier. (d) was
18.8 T at National High Magnetic Field Laboratory. (e) is reprinted from Ref. [2], Copyright (2004),
acquired at 18.8 T at National High Magnetic Field Laboratory. (e) is reprinted from Ref. [2],
with permission from Elsevier.
Copyright (2004), with permission from Elsevier.
Scenarios “I” and “IV” represent the cases where the quadrupolar effect is non-prominent or even
In scenario
negligible, which“II”, when
is often the fieldfor
observed was not C
small strong enough to remove the quadrupolar effect, the
Q species. Given that the second-order quadrupolar
second-order
broadening was inversely proportional to B0 in ppm, theand
quadrupolar broadening becme 2 important started to effect
quadrupolar affecton
thethe
spectrum.
lineshapeFor a
will
nuclear site without a chemical shift distribution but only quadrupolar broadening,
eventually “vanish” at some point with increasing magnetic field strength, examples of which are e.g., a single
crystalline
shown in “I” site,
in the lineshape
Figure 7a and appeared
“IV” in bothas 7a
a narrow
and 7c. horizontal ridge, as
Note the strength of previously
a “vanishing shown
field”for the
varies
A9B2 sites in Figure 6 and “II” in Figure 7d. This type of horizontal ridge could also be broadened in
the isotropic dimension. For instance, another horizontal peak “II” in Figure 7a was broadened in theYou can also read