Promoting the blue circular economy of the Aquaculture value chain in Tunisia
←
→
Page content transcription
If your browser does not render page correctly, please read the page content below
Promoting the blue circular
economy of the Aquaculture
value chain in Tunisia
Mapping report of the aquaculture value chain actors
Analysis and potential areas of circular development
                                                                        www.switchmed.eu

 Dr. Mohamed S. Azaza (INSTM) / Prof. Dr. Harry Palm, Dr. Adrian Bischoff-Lang (Steinbeis)
                          Martin Schüring (ttz Bremerhaven)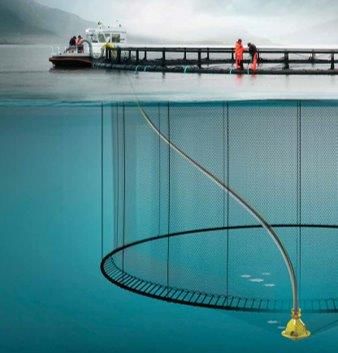
Content
Content .......................................................................................................................... 2
List of figures ................................................................................................................ 3
List of tables ................................................................................................................. 4
1.     Reminder of the Objectives of the SwitchMed Programme ............................ 5
2.     Methodological Approach ................................................................................... 7
     2.1.    Involvement of national stakeholders ........................................................................ 7
     2.2.    Selection of priority sub-sectors ................................................................................ 7
     2.3.    Bilateral consultations ................................................................................................ 8
     2.4.    Surveys ...................................................................................................................... 9
       2.4.1.       Preliminary survey .......................................................................................................... 9
       2.4.2.       Interview campaign ........................................................................................................ 9
3.     Survey Results by subsector ............................................................................ 11
     3.1.    Fish Farming ............................................................................................................ 11
     3.2.    Aquaculture Feed ..................................................................................................... 24
     3.3.    Hatcheries ................................................................................................................ 31
     3.4.    Shellfish Farming ..................................................................................................... 33
4.     Conclusions and Key Issues of the priority sub-sectors .............................. 39
     4.1.    Fish Farming ............................................................................................................ 39
       4.1.1.       Waste treatment ........................................................................................................... 39
       4.1.2.       Circularity of value chains and optimisation options .................................................... 39
     4.2.    Aquaculture Feed ..................................................................................................... 41
       4.2.1.       Waste treatment ........................................................................................................... 41
       4.2.2.       Energy saving ............................................................................................................... 41
       4.2.3.       Circularity of value chains and optimisation options .................................................... 42
     4.3.    Hatcheries ................................................................................................................ 43
       4.3.1.       Energy saving ............................................................................................................... 43
     4.4.    Shellfish Farming ..................................................................................................... 44
       4.4.1.       Waste treatment ........................................................................................................... 44
       4.4.2.       Circularity of value chains and optimization options .................................................... 44
5.     Annex ................................................................................................................... 45

                                                                       2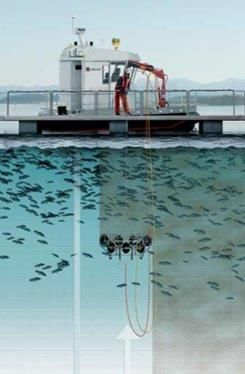
List of figures
FIGURE 1: SCHEMATIC OF THE INTERACTIONS BETWEEN THE DIFFERENT SUBSECTORS OF THE AQUACULTURE
     SECTOR ............................................................................................................................................. 8
FIGURE 2 THE MAP OF GEOGRAPHICAL DISTRIBUTION OF THE SURVEYED COMPANIES ................................... 10
FIGURE 3. ANNUAL AVERAGE PRODUCTION OVER THE 3 LAST YEARS (BLUE BARS) VERSUS PRODUCTION
     CAPACITY OF THE INTERVIEWED FINFISH FARMS (ORANGE BARS). ....................................................... 12
FIGURE 4: VARIABLE COSTS OF SEABREAM AND SEABASS PRODUCTION ....................................................... 12
FIGURE 5: STRATEGY OF THE AQUAFARMS AT SHORT AND MEDIUM TERMS ................................................... 13
FIGURE 6: ORIGIN OF AQUAFEED (A) AND JUVENILE (B) USED IN FINFISH PRODUCTION OVER THE LAST FIVE
     YEARS ............................................................................................................................................. 14
FIGURE 7: DIFFICULTIES ENCOUNTERED WHEN PROCURING INPUTS. ............................................................ 14
FIGURE 8: THE MAIN OBSTACLES TO INNOVATION / USE OF TECHNOLOGIES .................................................. 15
FIGURE 9: THE AWARENESS OF THE FINANCIAL INCENTIVES FOR INVESTING IN MASTERING AND INTRODUCING
     NEW TECHNOLOGIES. ....................................................................................................................... 15
FIGURE 10: CRITICAL STAGES OF FINFISH PRODUCTION............................................................................... 16
FIGURE 11: MOST CRITICAL SEASON OF FINFISH PRODUCTION ..................................................................... 17
FIGURE 12: MEAN FREQUENCY OF CHANGING NETS DURING A PRODUCTION CYCLE TO DEAL WITH THE FOULING
     PHENOMENON. ................................................................................................................................. 18
FIGURE 14: RELATIONSHIPS BETWEEN AQUAFARMS AND RESEARCH INSTITUTES: FIG A: YES/NO: EXISTING
     /NOT EXISTING TECHNICAL COOPERATION RELATIONSHIP. (B): MOST CONTACTED INSTITUTES TO DEAL
     WITH ENCOUNTERED PROBLEMS . ...................................................................................................... 18
FIGURE 15: THE REASON OF THE LAST INVESTMENTS MADE BY AQUA FARMS ............................................... 21
FIGURE 16: INTERACTION OF SUBSECTOR OF FINFISH NET CAGE CULTURE WITH OTHER SUBSECTORS .......... 21
FIGURE 17: SCENARIO OF USING SMART TO OPTIMIZE FEED MANAGEMENT ................................................ 23
FIGURE 18: STRATEGY OF COMPANY AT SHORT AND MEDIUM TERMS ........................................................... 24
FIGURE 19 : DIFFICULTIES ENCOUNTERED WHEN PROCURING INPUTS FOR AQUA FEED. ................................ 25
FIGURE 20: THE MAIN OBSTACLES TO INNOVATION / USE OF TECHNOLOGIES ................................................ 26
FIGURE 21: THE AWARENESS OF THE FINANCIAL INCENTIVES FOR INVESTING IN MASTERING AND INTRODUCING
     NEW TECHNOLOGIES. ....................................................................................................................... 26
FIGURE 22 : RELATIONSHIPS BETWEEN FEED COMPANIES AND CONTACTED INSTITUTES TO DEAL WITH
     ENCOUNTERED PROBLEMS. ............................................................................................................... 26
FIGURE 23: THE REASON OF THE LAST INVESTMENTS MADE BY AQUA FARMS. .............................................. 28
FIGURE 24 : INTERACTION OF SUBSECTOR OF AQUAFEED PRODUCTION WITH OTHER SUBSECTORS .............. 29
FIGURE 25: SCENARIO OF IDENTIFICATION OF ALTERNATIVE INGREDIENTS IN AQUAFEED . ............................. 30
FIGURE 26 : INTERACTION OF SUBSECTOR OF FINFISH NET CAGE CULTURE WITH OTHER SUBSECTORS .......... 32
FIGURE 27 : STRATEGY OF THE AQUAFARMS AT SHORT AND MEDIUM TERMS ................................................ 33
FIGURE 28 : THE MAIN FACTORS LIMITING THE EXPANSION OF THE SHELLFISH ACTIVITIES . ............................ 34
FIGURE 29: THE MAIN OBSTACLES FOR INNOVATION / USE OF TECHNOLOGIES .............................................. 34
FIGURE 30 : THE AWARENESS OF THE FINANCIAL INCENTIVES FOR INVESTING IN MASTERING AND INTRODUCING
     NEW TECHNOLOGIES. ....................................................................................................................... 35
FIGURE 31: PRESENCE (YES) OR ABSENCE (NO) OF ENVIRONMENTAL CONSTRAINTS FOR SHELLFISH FARMS 35
FIGURE 32: MOST CRITICAL SEASON OF SHELLFISH PRODUCTION ................................................................ 36
FIGURE 33: FREQUENCY OF THE ENCOUNTERED DISEASE IN SHELLFISH PRODUCTION .................................. 36
FIGURE 34:. RELATIONSHIPS BETWEEN AQUAFARMS AND RESEARCH INSTITUTES: FIG A: YES/NO: EXISTING
     /NOT EXISTING TECHNICAL COOPERATION RELATIONSHIP. (B): MOST CONTACTED INSTITUTES TO DEAL
     WITH ENCOUNTERED PROBLEMS . ...................................................................................................... 37
FIGURE 35 : INTERACTION OF SUBSECTOR OF FINFISH NET CAGE CULTURE WITH OTHER SUBSECTORS .......... 38

                                                                            3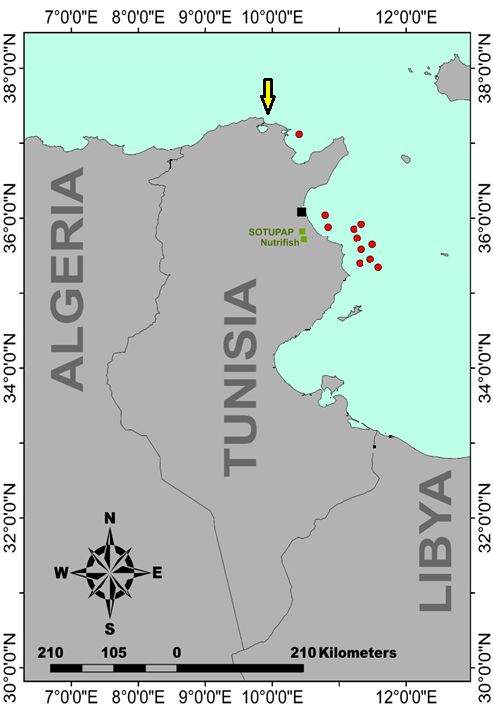
List of tables
      TABLE 1. CHARACTERISTICS OF THE SELECTED AQUAFARMS. ...................................................................... 11
      TABLE 2: ESTIMATION OF QUANTITY OF USED ENERGY AND INITIATIVE TO REDUCE THEIR COSTS ................... 19
      TABLE 3: ESTIMATION OF FRESHWATER USE ............................................................................................... 19
      TABLE 4: WASTE GENERATED BY PRODUCTION SYSTEMS. ........................................................................... 20
      TABLE 5: THE LAST INVESTMENTS MADE BY AQUA FARMS. ........................................................................... 21
      TABLE 6: THE SELECTED AQUAFEED COMPANIES ........................................................................................ 24
      TABLE 7: ESTIMATION OF THE QUANTITY OF ENERGY USED AND INITIATIVES TO REDUCE THE COSTS . ............. 27
      TABLE 8: ESTIMATION OF FRESHWATER USE ............................................................................................... 27
      TABLE 9: WASTE GENERATED BY PRODUCTION SYSTEMS. ........................................................................... 27
      TABLE 10: THE LAST INVESTMENTS MADE BY THE TWO AQUAFEED COMPANIES. ........................................... 28
      TABLE 11: THE SHELLFISH FARMS PARTICIPATING IN THE QUESTIONNAIRE. .................................................. 33

Disclaimer                             This publication was produced with the financial support of the European Union.
                                       Its contents are the sole responsibility of its authors and do not necessarily reflect
                                       the views of the UNIDO and/or the European Union.

                                                                         4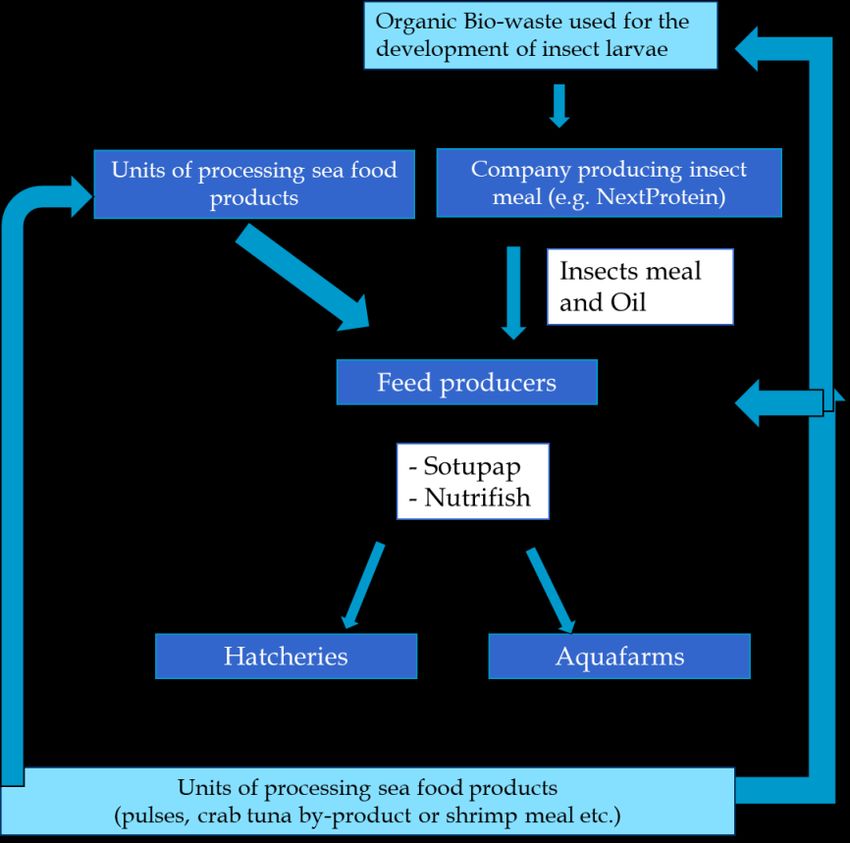
1. Reminder of the Objectives of the
      SwitchMed Programme
The SwitchMed initiative, funded by the European Union and implemented by UNIDO, aims to
stimulate the creation of new business opportunities and job creation while reducing the
environmental impacts of existing economic activities in the south of the Mediterranean.
SwitchMed is part of the continuity of the results of the first phase to support and further
intensify the transition to sustainable consumption and production practices (SCP: Sustainable
and Cleaner Production) that contribute to a green and circular economy in the region.
The integration of the circular blue economy component within SwitchMed in 2020 aims in
particular to contribute to the preservation of marine and coastal ecosystems in the southern
Mediterranean. The application of SCP practices, including the UNIDO TEST methodology, to
economic activities related to marine and coastal areas is crucial in efforts to develop the
concept of a blue economy in the Mediterranean region.
The approach consists of stimulating the development of industrial projects oriented towards
the blue economy to reduce the negative environmental impact on the marine ecosystem
(depletion of natural resources and pollution), as well as to increase the efficiency and
competitiveness of the sectors established and emerged from blue economy.
To reach this goal, the SwitchMed project will proceed in several phases through:
•   Identifying projects / initiatives with high potential for sustainable development and in line
    with Tunisia's sectoral priorities,
•   Implementing a number of pilot projects by demonstrating via the TEST methodology and
    / or promoting the circular economy via innovative technologies and finally by
•   Disseminating results and best practices to expand at the national level.

As part of this first phase, scheduled for 2021, the project will focus on carrying out an in-depth
study of the aquaculture value chain in Tunisia, in relation with the key players in the industry,
to analyse the regulatory and market barriers, the potential for optimization to reduce the
environmental impact of industrial sites as well as studying innovative technology transfer
opportunities (SMART) in the implementation of circular solutions. Particular attention will be
paid to national flows to propose an analysis of scenarios and alternative business models
aimed at their valuation and the creation of added value at national and local level.
This study is part of the SwitchMed II program and includes a value chain analysis of the
aquaculture sector in Tunisia. Marine fish production and processing can be considered having
future potential in the food production industry. Switched is a key action carried out under the
EU-funded regional cooperation with the Mediterranean region.
The integration of a blue economy component within the second phase of SwitchMed II shall
contribute to preserving healthy marine and coastal ecosystems and ensure the continuous
delivery of goods and services for present and future generations. These principles are to be
established and advanced in the form of 4 – 5 pilot projects, which shall be a major outcome
of this study.
Aquaculture is a very promising activity within the emerging blue economy sector, being
currently the fastest growing food-production sector with an annual expansion rate of 8 % in
the last three decades, now contributing to ~ 44 % of all seafood. However, aquaculture is still

                                                5
an underutilized technology in the countries of the Southern Mediterranean like Tunisia. The
current project shall identify key areas for optimisation towards SCP.
The major outcome of this study will be the definition of 4 – 5 pilot projects as a result of the
survey and the identification of the key areas. These pilot projects are intended to set an
example for the entire sector on the way to more sustainable and SMART production methods.
Based on a compilation and evaluation of the current state-of-the-art of the Tunisian
aquaculture sector, a representative survey among the key players within the sector will be
carried out to identify the above-mentioned key areas.

                                               6
2.         Methodological Approach
    2.1. Involvement of national stakeholders

The national stakeholders are involved by the following measures:
•   Pre-opening event, opening event and Atelier Technique
•   Bilateral consultations (see 2.c)
•   A quantitative 2-step-survey approach (see 2.d)
The quantitative approach is carried out by representative sampling, considering the following
criteria:

•   Belonging to the identified priority sub-sectors
•   Geographical representation
•   Representativeness in terms of company size
•   Potentially important data quality

Companies were selected by these criteria and directly addressed.

    2.2. Selection of priority sub-sectors
The analysis of the different sub-sectors of the aquaculture sector according to the above-
mentioned criteria highlights four priority sub-sectors:

•   Finfish aquaculture in net cages for Seabream, Seabass and Meagre (12 companies)
•   Aquafeed (3 companies)
•   Finfish Hatcheries (2 Hatcheries)
•   Shellfish (6 companies)

These sub-sectors are not isolated. There are various interactions as shown in figure 1.

                                                7
Figure 1: Schematic of the interactions between the different subsectors of the aquaculture sector

The survey focused particularly on the following issues:

•   Potential production increase
•   Improving feed conversion efficiency and feed management (reduce FCR)
•   Diversification of species
•   Reduction of the impact on the environment
•   Reduction of feed costs
•   Hatchery development
•   Energy use
•   Potential application of new technologies

    2.3. Bilateral consultations

Besides the 3 official meetings (Pre-Opening event, Atelier Technique, opening event) a
bilateral consultation with the general directorate of fisheries and aquaculture (DGPA) enabled
access to the aquaculture data base to check some data collected from aquafarms through
the questionnaire (Phase II). In fact, this consultation allowed us to adjust some data that
appeared skewed in a way that is regarded as inaccurate.

The official meetings constitute an excellent opportunity to discuss with all stakeholders of all
subsectors and all implicated partners such as administration, research, professional
institution, extension services, technical institution, and NGOs. This allows us to tailor the
questionnaire based on the relevant interaction with participants. The most relevant points

                                                      8
were considered in the elaboration of the questionnaire. Following are the most relevant key
take-aways from the meetings in terms of thematic priorities:

•   Increasing stakeholder conflicts in the coastal regions, negatively affecting public
    awareness of the aquaculture sector
•   Price dependency of the local products on the international markets
•   Low prices on the local markets with less competitiveness to regular fisheries products
    and therefore high production costs and low income for the farms
•   Increasing problems with fish diseases and parasites
•   Increasing environmental issues
•   The aquaculture sector was not able to develop sufficient hatchery capacities and local
    feed sources, both seen as the main cost driving factors that limit income and benefits
    inside the sector.
•   SMART Technology use is at low level in the aquaculture sector

    2.4. Surveys

    2.4.1.   Preliminary survey

The preliminary survey was addressed to all farms and companies of all subsectors. This
allows the mapping of the aquaculture sector with the main shortcoming and gaps. Also,
through this preliminary survey, we selected the most relevant aquafarms and companies for
the deeper interview campaign.
The results of this survey were presented in an official meeting to have feedback of the
stakeholders and we take into account all relevant points for the second survey.

    2.4.2.   Interview campaign

For the interview campaign, we proceeded by the selection approach:

•   For the finfish subsector, we selected 12 aquafarms, 11 out of 12 interviewed farms
    participated (91.66%). For the selection two main criteria were taken into account:
    geographical position and production capacity.
•   For the aquafeed companies, we selected 3 manufactures and finally, 2 participated in
    the survey.
•   For the hatcheries, currently only one hatchery is in activity, which participated in this
    survey.
•   For the shellfish subsector, 8 farms were selected for the 2nd phase, 5 shellfish farms
    (i.e., 62.5 %) participated

The average participation rate of the selected companies is 79 %, which gives a representative
overview of the whole sector.

                                                9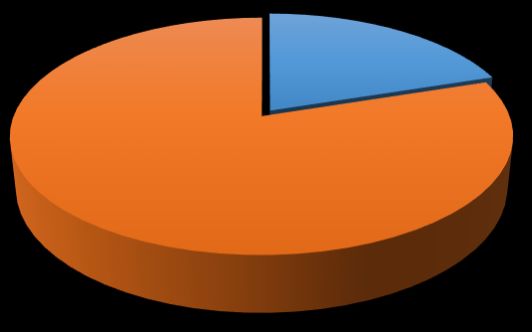
Figure 2 The map of geographical distribution of the surveyed companies

                                  10
3. Survey Results by subsector
3.1. Fish Farming
Currently there are 25 productive marine fish farms in Tunisia. Following the preliminary
questionnaire of the first phase, we selected 12 finfish farms for the 2nd Phase. The criteria for
choosing these farms were:
• Their geographical position: we have chosen companies farms located in all production
areas (North and East).
• Their production capacity: we have chosen aquaculture farms based on their production
capacities (small, medium, and large production capacity) to cover all categories.
The selected finfish farms were contacted by e-mail and they received the questionnaire. After
a month of data collection, only one farm, out of 12, did not participate in this assessment.
Thus, the participation rate is 91.66% (11 from 12 interviewed farms). Since some of the
responses from a few farms were not sufficiently clear or missing, they were contacted by
telephone/e-mail and/or direct interview, to improve the accuracy of their responses.
The 12 selected finfish farms have a total production capacity of around 17850 tons. They are
classified, in terms of production capacity, into three groups as follows: (i: from 400 to 800
tons, ii: from 1000 to 1600 tons and iii: from 2000 to 3500 tons). The production capacity of
these farms represents 78 % of actual Tunisian Finfish production.
Table 1. Characteristics of the selected aquafarms.
Finfish Farm Abbreviation Production Capacity
Sea Food AF1 400
Pirate Fish AF2 750
STEP AF3 800
Porto Farina AF4 1000
TTF AF5 1300
AquaSud AF6 1500
Hanchia Fish AF7 1600
Aquafish AF8 2000
Ruspina AF9 2500
Rafaha AF10 2500
Prima Fish AF11 3500
The analysis of average annual production data over the past 3 years for the interviewed finfish
farms (Fig. 1) showed that only 3 out of 11 farms have reached their potential production
capacities (AF1, AF2, AF5). However, the remaining other farms (8) their means annual
productions vary between 25 to 87.5% of their potential production capacities.
11Figure 3. Annual average production Over the 3 last years (Blue bars) versus Production capacity of the
interviewed finfish farms (Orange bars).
Figure 4: Variable costs of seabream and seabass production
As indicated by Figure 3, we noticed that the production over the last few years of the
interviewed farms is below their potential production capacities.
Figure 4 demonstrates the repartition of the variable costs of seabream and seabass
production. Gathered data demonstrate that feed represents significant part of the production
cost and can reach 65 and 68 %, respectively. for seabream and seabass. The strategy of
aquaculture farms in the short and medium term is of utmost importance. The results are
shown in the following figure (Fig. 5).
12Figure 5: Strategy of the aquafarms at short and medium terms
As indicated in this figure, increased production and improved production quality are the top
priorities of interviewed farms and thus constitute the main strategic tasks in short and medium
terms, followed by new market exploration.
The interviewed farms elucidate that the main factors limiting the expansion of their business
are:
• High investment cost (indicated by 63.63 % of the interviewed aquafarms)
• Limitation of local market capacity and competition in foreign markets
• High cost of inputs
• Production cost versus selling price
Finfish production is based on two main inputs: Aquafeed and Juvenile. Figure 4 indicates their
origins (imported or local produced). Regarding Aquafeed (Fig 6 A), results indicate a
decreasing tendency over the last years of the imported aquafeed although the imported
quantity is still high (48.71 % on 2020).
For the juvenile, results (Fig. 6 B) demonstrate that over the last years (2016-2020) most of
the needed juvenile is imported and reached 87.45 %. However Tunisian hatcheries contribute
no more than 13 % (year 2020).
Since the most inputs are not produced locally and thus imported, producers encountered of
some difficulties when procuring aquafeed and juvenile. These difficulties are summarized in
Figure 7. The most interviewed farms (73%) indicate that the high price is considered the main
encountered problem for their acquiring, followed by the fact that their quality is not always
assured. In addition, the complicated administrative procedure (e.g., authorization) is indicated
by 45 % of the interviewed aquafarms.
13Figure 6: Origin of aquafeed (A) and Juvenile (B) used in finfish production over the last five years
Figure 7: Difficulties encountered when procuring inputs.
From the previous questionnaire (preliminary questionnaire in the first phase) we noticed the
lack of using technologies/innovation tools and thus the applied rearing systems can be
considered more basic.
According to the producers, the main obstacles to innovation/use of technologies are indicated
in the following figure (Fig. 8). High investment cost to implement technologies remain the main
14problem (90 % of the interviewed aquafarms). Also, the lack of government incentives is
indicated by 45 % of the producers/aquaculturists.
The government and competent authority are aware of the use of new technologies to improve
production efficiency through the decree N° 2017-389 of March 9, 2017 of financial incitation
when introducing new/innovation technologies. The APIA (Agency for the Promotion of
Agricultural Investment) is the institution that is involved in the financial mechanisms. The
criteria of eligibility and application procedures are indicated at the end of this document as
annexed document. However, as indicated by figure 7, 64 % of the interviewed farms are
unaware of this incitation. So, an effort should be deployed to raise aquaculturists awareness
of the issue.
Lack of government incentives 45%
High investment cost 90%
Lack of technical / scientific
knowledge
36%
0% 20% 40% 60% 80% 100%
Figure 8: The main obstacles to innovation / use of technologies
No 64%
yes 36%
0% 10% 20% 30% 40% 50% 60% 70%
Figure 9: The awareness of the financial incentives for investing in mastering and introducing new technologies.
To identify the most relevant SMART Technologies which can improve and enhance finfish
profitability and reduce environmental impacts, we suggested the following technology
systems:
• T1: Environmental control system
• T2: Net cage health, cleaning net cages
15• T3: Optical system for monitoring and adjusting the feed ration according to
environmental conditions and fish behaviour.
• T4: Collection system of dead fish
• T5: Surface feed distribution system (homogeneous distribution)
• T5: Submarine feeding system: Improved feed conversion efficiency
• T6: Stunning and slaughtering systems
In terms of relevance, interviewed farms selected as priority the following SMART technologies
systems:
T3 (Optical systems) was ranked as top 1 by 63 % of interviewed farms followed respectively
by T5 (spread feed distribution) and T1 (Environmental control system). It is obvious that the
two selected technologies as priorities concern the feed management. This parameter is of
utmost importance in aquaculture, particularly in intensive system. In fact, this importance is
confirmed through the collected data in this questionnaire as indicated in Figure 4 that indicates
the significant part of the aquafeed in the production cost which can reach 65 % and 68 %,
respectively for seabream and seabass. On the other hand, according to interviewed farms
the feed conversion ratios (FCR) of the finfish production system of the interviewed farms can
reach 2.3. According to FAO, intensive systems for sea bream have a much better FCR of 1.3.
Consequently, the high FCR in Tunisian finfish mariculture can be improved through the
optimization of feed management which will enhance not only the financial profitability of the
aquafarm, but also reduce the environmental impact of the aquaculture activities.
Besides to the above-mentioned issue of feed management and the possibility of improvement
efficiencies, 78 % of interviewed farmers confirm that the pre-fattening stage (first stage after
seeding cages) is the most critical stage (Fig. 10).
Critical stages
No critical stage 22%
Pre-fattening Stage 78%
Fattening stage 11%
0% 10% 20% 30% 40% 50% 60% 70% 80% 90%
Figure 10: critical stages of finfish production
In terms of the most problematic season, 73 % of interviewed farms indicate autumn season
in which fish diseases and fish mortality occurred (Fig. 11).
1680%
70%
60% 73%
50%
40%
30%
20%
10%
9% 9% 9%
0%
Hiver Printemps Eté Automne
Figure 11: most critical season of finfish production
In intensive finfish net cage production, two main aspects can affect mortality and fish stress
(welfare fish): fish diseases and fouling phenomena.
Regarding fish diseases, all farms are in accordance that the most encountered disease are:
• Virus: Nodavirus, Lymphocystis
• Bacteria: Pasteurellosis, Vibriosis
• Parasites : Enteromyxum (Myxozoa), Sparicotyle (Monogenea)
For fouling phenomena, aquaculturists proceed regularly by changing nets. As indicated in the
following figure (Fig. 12), 91% of farms change nets more than 4 times, and 55 % of farms
change nets more than 6 times during a production cycle, causing high handling costs.
Associated mortality events to this practice are relatively low, as demonstrated in the figure
13. In fact, only 27% of interviewed farms indicate fish mortality associated to the net change.
According to all interviewed aquafarms, the cumulative mortality associated with the process
of changing nets during a production cycle do not exceed 5% in all farms.
During the production cycle, when producers are faced to some technical/environmental
problems, 82 % of aquafarms contact research institutes to deal with these problems (Fig. 14
a). As indicated by figure 14 b, the most contacted institutes are: INSTM (contacted by 73% of
aquafarms), followed by ISBM (contacted by 27 % of aquafarms). The geographical position
of these two institutions (Both in Monastir region) and their proximity to the potential
aquaculture production areas in Tunisia facilitate and justify these cooperative contacts with
marine aquaculture farms.
It is worth to note that besides research institutes, aquafarms contact the CTA (Technical
center for Aquaculture) to deal with some technical problems.
1760%
50%
40%
30% 55%
20% 36%
10%
9%
0%
1-3 times 4-6 times Over 6
Figure 12: Mean Frequency of changing nets during a production cycle to deal with the fouling phenomenon.
No 73%
Yes 27%
0% 20% 40% 60% 80%
(a) (b)
Figure 13: Encountered mortality in aquafarms (a) and mortality rate (b)
(a) (b)
Figure 13: Relationships between aquafarms and research institutes: Fig a: Yes/No: existing /not existing
technical cooperation relationship. (b): most contacted institutes to deal with encountered problems.
Regarding the quantity and costs of used energy by aquafarms, results are indicated in the
following table (Table 2). Generally, there is no clear trend in the quantity of used energy and
production capacity of aquafarms. As indicated in the below table 33% of the interviewed
aquafarms are aware of the high energy use and suggest using photovoltaic installation as an
initiative to reduce the costs of energy.
18For freshwater use (Table 3) there is no clear trend regarding the production capacity or current
production with the used quantity or costs. It is worth to note that, except one aquafarm (farm
10), the used water is treated following standards processes by the National Sanitation Utility
(ONAS) before releasing them into the natural ecosystems. Also, the grow out takes place in
seawater, so the water saving potential is limited.
Table 2: Estimation of quantity of used energy and initiative to reduce their costs
Aquafarm Quantity Cost (Dt) Initiative to reduce the
(KW/month) cost
Farm 1 92 000 No initiative
Farm 2 30 955 149 533 No initiative
Farm 3
Farm 4 11616 44 367 photovoltaic installation
Farm 5 141 404 solar panels
Farm 6 6000 80 000 No initiative
Farm 7
Farm 8 27948 71 500 photovoltaic installation
Farm 9 32052 82 000 No initiative
Farm 10 19200 60 000 No initiative
Farm 11 240 Tons de fuel 250 000 No initiative
Table 3: Estimation of freshwater use
Farm Quantity Source Annual Destination Initiative to reduce
Cost (DT) consumption
Farm 1 SONEDE 17 000 ONAS Currently: No/
treatment will be
implemented
Farm 2*
Farm 3 337 SONEDE 18 358 ONAS treatment processes
will be implemented
soon
Farm 4 SONEDE 2 645,4 ONAS Using water well
Farm 5 1550 SONEDE 2 690,0 ONAS No Initiative
Farm 6 100 SONEDE 3 600,0 ONAS No Initiative
Farm 7*
Farm 8 4059 SONEDE 10 000 ONAS No Initiative
Farm 9 8441 SONEDE 20 800 ONAS No Initiative
Farm 10 2940 SONEDE 2 646,0 Earth treatment and reuse
septic
system
Farm 11*
• *Aquafarms don’t have reliable information in this matter.
According to the interviewed aquafarms the generated waste quantity ranged between 3 to 10
tons per aquafarm. The main generated waste is plastic bags used for aqua feed. Generally,
no cost charge was attributed by aqua farms to collect and process the generated waste, since
19specific companies were interested by collecting plastic aquafeed bags for further re-use in
other industrial sectors. This means that in the case of plastic, the loop is practically closed.
Table 4: Waste generated by production systems.
Aquafarm Quantity (Tons per year) Treatment Initiative to reduce
cost/collection cost quantity
(DT)
Farm 1 10 Not estimated
Farm 2 No response
Farm 3 10 Specific companies
(waste collector)
Farm 4 No response
Farm 5 4 0 Agreement with
companies of plastic
recycling
Farm 6 3 Selling waste to
recycling companies
Farm 7 No response
Farm 8 5 Recycling plastic
Farm 9 5 Recycling plastic
Farm 10 2000 Selling waste to
recy-cling
companies
Farm 11 20
The last Investments made by the interviewed aquafarms are indicated in the following table
(Table 5). The main investments made are:
• Extension of production capacity by adding new cages
• Acquisition of net cleaner
• Acquisition of feed spreader
According to interviewed aqua farms, the reasons for these investments are indicated in figure
15. Results demonstrate that for 80% of the aquafarms, the main reason is to enhance financial
profitability and only 20% with regard to environmental perspectives (feed spreader to reduce
uneaten feed that constitutes a potential pollution source).
20Table 5: The last investments made by aqua farms.
Aquafarm Type Cost (Thousand
Dinars)
Farm 1 No response
Farm 2 Extension production (adding cages) 1200
Farm 3 Buying nets and freezer unit 400
Farm 4 Buying boot and feed spread 300
Farm 5
Farm 6 No response
Farm 7
Farm 8 Feed spread and net cleaner
Farm 9 Net cleaner
Farm 10 Extension production (adding cages) 1000
Farm 11 Extension production (adding cages) 1100
Reputation 20%
Regulatory constraints / needs 0%
Environmental issues 20%
Financial profitability - return on investment 80%
0% 10% 20% 30% 40% 50% 60% 70% 80% 90%
Figure 14: The reason of the last investments made by aqua farms
Scenario for sustainability improvement
Figure 16 synthetize the different streams of inputs and outputs within the subsector, and the
interrelations with upstream/downstream subsectors.
Figure 15: Interaction of Subsector of finfish net cage culture with other subsectors
21The main quantitative results of this subsector are summarized as following: Average FCR of
Tunisian aquaculture farms are ranged between 2.1 and 2.4 versus 1.5-1.8 (benchmarking).
This leads to:
• Significant economic loss (Feed is the main cost factor!)
• Significant environmental impact (The unconverted feed is waste!)
The FCR is influenced and can be optimized by the following technologies / approaches:
• Environmental monitoring (Catalogue T1/T2)
• Optical surveillance systems (T5)
• Feeding systems (T6)
• Feed composition, Feed additives (T7)
Each of these measures provides a potential of ~ 5 – 10 % FCR optimization. The
implementation of these measures enables bigger production quantities of up to 78 % with the
same feed input and the same environmental impact without exploring new areas for
aquafarms, which also avoids potential stakeholder conflicts. Or the other way round: In the
ideal case, the same production could be achieved with only ~ 56 % of the currently used feed
In addition, an optimized FCR would provide more independence from imports and reduce
directly the highest cost factor.
Progressive FCR-Optimisation within 10 years: Same quantity, reduced feed use, augmented
production, same feed use
To improve FCR, the recommendation is the optimization of feed management, this by:
• Adjustment of the food ration according to the new biomass
• Adjustment according to environmental parameters
This is ensured through using of the following SMART technologies:
• Optical system for monitoring and adjusting the feed ration according to
environmental conditions and fish behaviour.
• Environmental control system
22Scenario for sustainability improvement: Using SMART technologies to optimize feed
management and thus to improve feed conversion efficiency (FCR)
SMART:
- Optical system for feed
management (Actual
Biomass/environmental
conditions
Knowledge – Knowledge transfer from academia
into practice Aquafarm
Recherche (INSTM) /technical assistance service
(e.g. CTA) :
- Environment assessment
- Technico-economic assessment
Figure 16: Scenario of using SMART to optimize feed management
The Tunisian aquaculture is expected to grow based on the intensification and increase of
mariculture net cage systems for the two most relevant finfish species, Sea bream (Sparus
aurata) and Sea bass (Dicentrachus labrax). However, already today stakeholder conflicts and
increasing environmental awareness of the public require involvement of all potential users of
the coastal zones. Strict environmental monitoring under application of the best possible
practice can help to reduce stakeholder conflicts and increase sustainable mariculture
production in Tunisian coastal waters.
233.2. Aquaculture Feed
Currently there are 3 aquafeed manufacturers in Tunisia (see Desk review). Their total
production capacity is around 90,000 tons. Following the questionnaire of the previous phase,
we selected the 3 existing factories for this questionnaire. Finally, only 2 companies
participated in this questionnaire: The SOTUPAP company and the NutriFish company (Table
6).
Table 6: The selected aquafeed companies
Aquafeed company Production capacity Actual Production % of Actual
(Tons/year) (Tons/year) production
Nutrifish 30 000 11175 37,2%
Sotupap 30 000 10530* 35,1%
• Means of the five last years.
As indicated in the above table, both companies produce far below their production capacity
(37 and 35 %, respectively for Nutrifish and SOTUPAP companies). These values corroborate
with Figure 4A, in which 49 % of the needed aquafeed is imported. This situation reduces the
efficiency of the two companies. In this context the future strategy of both companies at the
short and medium terms is summarized in the following figure (Fig. 18).
Both companies have the same goals:
• Increase feed production.
• Identify local ingredients as alternative of conventional sources
• Improved product quality
• Explore new foreign markets (export)
The three goals potentially contribute to a rise in the sustainability of these companies. In fact,
increasing feed production can enhance the financial profitability of these companies and thus
valorise the high investment. Regarding the two remaining goals, it is obvious that improving
production quality is a perquisite to explore new foreign markets for export.
Figure 17: Strategy of company at short and medium terms
24To reach these goals, the aquafeed companies must overcome the encountered problems to
extend their activities by increasing the current production and thus increase the rate of their
contributions to the feed needs of Tunisian aquafarms.
According to interviewed aquafeed companies, the main problems hindering the expansion of
their activities are:
• High customs duty and VAT for some raw materials
• Limitation of local raw materials (by-product; animal and vegetal sources)
authorized by regulation
• Increased costs of raw materials
• Increased production costs
• Competition from feed imports
Besides the above-mentioned factors, aquafeed producers encountered some other difficulties
when procuring input feeds (ingredients such as: fish meal, fish oil, soybean meal etc.). Some
of these ingredients are imported, which can further complicate their acquisition. These
difficulties are summarized in the following figure (Fig 19).
Difficulties encountered when procuring inputs
Quality not assured 50%
Administrative procedures 100%
Import dependence 100%
High custom taxes 100%
Irregularity of availability 100%
High price 100%
0% 20% 40% 60% 80% 100% 120%
Figure 18 : Difficulties encountered when procuring inputs for aqua feed.
According to the aquafeed producers, the main obstacles to innovation/use of technologies
are indicated in the following figure (Fig. 20). High investment costs to implement technologies
remain the main problem (selected by the two interviewed aquafeed companies). In this
context, both interviewed companies are unaware of the incitement decree (N° 2017-389 of
March 9, 2017) dedicated to introducing new/innovation technologies (Fig. 21). The potential
areas for aquafeed companies in applying innovation related to the environmental issues is to
reduce air pollution released in the atmosphere.
25Figure 19: The main obstacles to innovation / use of technologies
Figure 20: The awareness of the financial incentives for investing in mastering and introducing new technologies.
When aquafeed producers are faced to some technical/scientific aspects, both interviewed
companies already established a scientific relationship with INSTM and ISBM (Fig. 22). It is
worth to note that the two companies and the two research institutes are all in the region of
Monastir. As explained above, the geographical location plays an important role of building the
cooperation between companies and the two research institutes.
Figure 21 : Relationships between feed companies and contacted institutes to deal with encountered problems.
26Regarding the quantity and costs of energy use by aquafeed companies, results are indicated
in the following table (Table 7). Generally, both companies are aware of the significant financial
amount allocated for the used energy, and thus some initiatives to reduce costs of energy are
in course. The estimated quantity and costs of freshwater are indicated in table 8. It is worth
to note that there is no release of used water into the environment since they evaporate in the
processes of aquafeed fabrication. The evaporation process is accompanied by an unpleasant
odour.
Table 7: Estimation of the quantity of energy used and initiatives to reduce the costs.
Companies Quantity of Energy Costs (DT) Initiative to reduce costs
Company 1 Electricity: 3360000 145000 - Installation of an energy
kwh / an consumption control system by
Gaz: 264000 m3/ an machine group.
- Add speed variators to
machines with a power greater
than 15 KW.
- Improvement of the power
factor (COS phi) towards 1: add
a capacitor bank.
Company 2 90 218 Yes
Table 8: Estimation of freshwater use
quantity Source Cost Destination Initiative
m3 / an (Dt)
Company 1 15 000 Water from Sonede 12 000 Evaporation No
Company 2 16 000 Water from Sonede 17 823 Evaporation No
In both aquafeed companies, the generated waste quantity ranged between 6 to 8 tons per
year and exclusively concerns the plastic bags (Table 9). According to the feed producers, no
cost charge was attributed to the treatment of the generated waste since specific companies
are interested to collect plastic aquafeed bags for further re-use in other industrial sectors.
Table 9: Waste generated by production systems.
Quantity/an Treatment cost Initiative
Company 1 6-8 tons of plastic bags 0 No
Company 2 7 tonnes of plastic bags 0 No
The last investments made by the two aquafeed companies are indicated in the following
table (table 10). The main investments made are:
• Installation of storage silos
• Odor treatment unit
According to the interviewed aquafarms, the reasons for these investments are indicated in
figure 23. Results demonstrate that in both aquafeed companies, the reasons for these
investments are:
• Reputation
• Regulatory constraints
• Environmental issues
27Both companies confirm that they are already seeing the expected benefits of these
investments.
Table 10: The last Investments made by the two aquafeed companies.
Investment Cost
Company 1 - Installation of storage silos 1,320 million de Dt
- odour treatment unit
Company 2 - odour treatment unit 265 000 Dt
Reputation 100%
Regulatory constraints / needs 100%
Environmental issues 100%
Financial profitability - return on investment 50%
0% 20% 40% 60% 80% 100% 120%
Figure 22: The reason of the last investments made by aqua farms.
Scenario for sustainability improvement: Improving locally produced ingredient to
reduce dependence to imports and create sustainable fish feed supply chain in
Tunisia
Figure 24 synthetize the different streams of inputs and outputs within the subsector, and the
interrelations with upstream/downstream subsector.
28Figure 23 : Interaction of Subsector of Aquafeed production with other subsectors
• Food represents a significant part of the production cost (60%)
• 50% of aquafeed requirements are imported
• The 50% of locally produced foods are based on imported ingredients (not locally
produced).
•
This leads to the:
• Increase of production cost
• Low competitiveness of the aquaculture sector
To overcome these issues:
• Substitute (total, if possible or partial) expensive and imported ingredients with local raw
materials and / or by-products rich in proteins (e.g., Tuna by-product meal / Insect meal)
• Use of food additives (antioxidants, immunostimulants etc.)
This allows to:
• Valorisation of waste from seafood processing units (Tuna, Shrimp, etc.)
• Valorisation of waste through their conversion (recycling) to produce insects
• Reduce the impact of this waste on the environment
• extension of the value chain to produce animal proteins of high nutritional value
• Valorisation of seafood processing by-products for integration into aquaculture feed
• Reduce the cost of aquaculture feed
29Alternative scenario: Substitution of conventional ingredients by alternative source of
nutrients, such as insects-based proteins.
Figure 24: Scenario of identification of alternative ingredients in aquafeed.
The actual annual production capacity of the Tunisian feed industry could reach 90,000 tons
according to the listed companies’ profiles. Nevertheless, to date the aquaculture producers
import around 30,000 tons aquafeed, and the input of feed in combination with imports of the
seedlings represent 80 to 85% of the total production costs. It is obviously contradictory that
aquaculture feed is imported despite significantly higher national production capacities.
Besides availability of the raw materials, feed quality might be an important factor that still
forces the fish producers to rely on international feed companies. Consequently, it is of
importance to enable the Tunisian fish feed industry to develop and apply locally produced
high quality fish feed products according to the needs of the producers.
303.3. Hatcheries
In Tunisia, currently only one hatchery is in activity, which responded to our questionnaire.
The interviewed hatchery is the “Aquaculture Tunisienne” and has a production capacity of 25
million fingerlings.
According to this hatchery, their strategies at the short and medium terms are:
• Increase production
• Diversification of production
• Improved production quality
• New market exploration (Export)
•
As indicated in the above response, the top priority of the hatchery is to increase production.
This needs to extend their business. However, according to this hatchery the difficulties that
limit this extension are indicated below:
• Financial aspects
• Production capacity at Weaning and Nursery levels
• competitive fry price
•
The hatchery is aware of the financial incentives for investing in mastering and introducing new
technologies and improving productivity. However, they consider that High investment cost
and Lack of technical / scientific knowledge are the main obstacles to beneficiate of theses
valuable tools.
According to the responsible staff of the hatchery, the first larval and the weaning stage are
the most problematic in the production. This early part of the life cycle is accompanied by high
mortalities and morpho-anatomical malformations. In fact, at the end of this stage the survival
rates are as following:
• 35% for Sea bream
• 25% for Sea bass
The encountered morpho-anatomical malformations are indicated below:
• Skeletal deformities (fusion of vertebrae, lordosis and scoliosis): rate = 5 to 10%
• Absence of the swim bladder: rate = 5 to 10%
• Short opercula: Rate = 12 to 15%
If the hatchery is faced some technical/environmental problems, there is a permanent
cooperation and contact of the hatchery with research institutes through agreements and MoU.
According to the hatchery responsible staff both INSTM and IRVT institutes are the most
contacted institutes.
Regarding energy use, although we don’t have a comparison tool, owing we have only one
interviewed hatchery, we consider that the consumed energy level (5 106 KWh/an) is relatively
high since the costs reached 1,5 million dinars. The responsible staff of the hatchery is aware
of this high energy consumption and therefore planned some initiatives as urgent measure to
reduce the energy use as much as possible. According to the interviewed hatchery, these
measures are:
• internal awareness-raising policy to rationalize energy consumption
• External energy audit by a study office
• implementation of photovoltaic projects to reduce the energy consumption to 50%
31Scenario for sustainability improvement: Reducing the energy consumption via
resource-efficiency programme and/or renewable source of energy
Tunisia has only 2 productive hatcheries which supply only no more than 15 million fries.
Aquafarmers therefore import 87 million fry to reach current annual production. Fry is the 2 nd
major cost drivers (after feed) and the Tunisian government intends to increase inland hatchery
production. The two major species Sea bream (Sparus aurata) and Sea bass (Dicentrachus
labrax) are widely produced around the Mediterranean and are the most promising candidates
for a future mariculture finfish production increase. It’s worth to note that high energy was
consumed in the hatchery, which can significantly increase the production cost of fry.
Therefore, the reduced energy consumption or identifying alternative more sustainable
sources is a prerequisite.
Figure 25 : Interaction of Subsector of finfish net cage culture with other subsectors
323.4. Shellfish Farming
Through the preliminary questionnaire of the first phase, we selected 8 shellfish farms for the
2nd phase. We received feedback from 5 shellfish farms (i.e., 62.5 %) as indicated in the table
below (Table 11).
Table 11: The shellfish farms participating in the questionnaire.
Aquafarms Production capacity
Promer 180
Prodmer 180
Biomarine 350
Sté Cosirenne 200
Aquacompany 80
The strategies of these farms at short and medium terms are indicated in figure 27. As
indicated in this figure, increased production and new market exploration are the top priorities
of the interviewed farms, followed by improved production quality.
Figure 26 : Strategy of the aquafarms at short and medium terms
The interviewed farms elucidated that the main factors limiting the expansion of their
business are indicated in the following figure (Fig. 28).
• High investment cost (indicated by all farms of the interviewed aquafarms)
• Limitation of local market capacity (also indicated by all farms)
• Lack of financial investment (indicated by 80 % of farms)
33No significant local market 100%
Lack of investment 80%
Lack of security in the lagoon 60%
High investment cost 100%
0% 20% 40% 60% 80% 100% 120%
Figure 27 : The main factors limiting the expansion of the shellfish activities.
It is worth to note that through the first questionnaire we noticed the lack of using
technologies/innovation tools by the shellfish farms. According to the recorded data of the
present survey, the main obstacles to innovation/use of technologies are indicated in the
following figure (Fig 29). According to all farmers, high investment cost to implement new
technologies remain the main problem (100 % of the interviewed producers), particularly
regarding harvest and sorting products techniques. Also, the lack of government incentives is
indicated by 20 % of the shellfish producers.
The government is aware of the useful technologies to improve production efficiency. For this
reason, a financial incitation (the decree N° 2017-389 of March 9, 2017 of financial incitation
when introducing new/innovation technologies) was disposed to the farmers. However, as
indicated by figure 23, 80 % of the interviewed shellfish farms were unaware of this incitation.
So, an effort should be placed on raising aquaculturists awareness to benefit from this
opportunity.
Figure 28: The main obstacles for innovation / use of technologies
34Yes 20%
No 80%
0% 20% 40% 60% 80% 100%
Figure 29 : The awareness of the financial incentives for investing in mastering and introducing new technologies.
Main part of mussel and oyster production occurs in Bizerte lagoon. This large lagoon is
sheltered and has large shallow regions, higher temperatures, and significant nutrient inputs.
This activity remains underdeveloped due to strong anthropogenic pressures on the lagoon
and health constraints. In this specific context, 80 % of shellfish producers indicate that the
environmental conditions of the production sites constitute a serious constraint for their farms
(Fig. 31).
Regarding self-monitoring of the environment parameters by shellfish producers and
availability of the environmental database of their production sites, only 20 % of the aquafarms
already disposed a database. In this context, it is worth to increase awareness of the producers
to build a specific environmental database for each farm for best management practices and
optimisation of the planned activities that anticipate critical events encountered throughout the
production cycle.
Yes 80%
No 20%
0% 20% 40% 60% 80% 100%
Figure 30: Presence (Yes) or absence (No) of environmental constraints for shellfish farms
According to the interviewed shellfish farm, the most problematic stages of the production cycle
are:
• The natural spat collection/fixation
• Harvesting and marketing the harvested products
• The marketing of harvested products because of blockages by veterinarians when
sanitary analysis is not compliant with the suitable level for human consumption.
35According to the interviewed shellfish farms, 80 % of the producers considered the hot season
as the most problematic season in which, associated with poor water quality, a high mortality
level occurs (Figure 32).
Hot season (summer) 80%
Coled season (Winter) 20%
0% 10% 20% 30% 40% 50% 60% 70% 80% 90%
Figure 31: Most critical season of shellfish production
In shellfish production, only 20% of the producers encountered diseases (Fig. 33). Oyster’s
parasites are the main obstacle, which can affect the production efficiency.
Yes 20%
No 80%
0% 10% 20% 30% 40% 50% 60% 70% 80% 90%
Figure 32: Frequency of the encountered disease in shellfish production
During the production cycle, when producers are faced with some technical/environmental
problems, 80 % of the shellfish farms contact research institutes to deal with these problems
(Fig. 34 a). As indicated by figure 34 b, the INSTM and Pasteur Institute (IP) are the main
contacted research institutes.
36You can also read