Hydropower Value Study: Current Status and Future Opportunities - PNNL-29226 January 2021
←
→
Page content transcription
If your browser does not render page correctly, please read the page content below
Hydropower Value Study:
Current Status and Future
Opportunities
January 2021

PNNL-29226
Hydropower Value Study: Current Status and
Future Opportunities

A Somani1
N Voisin 1
R Tipireddy 1
S Turner1
TD Veselka 2
Q Ploussard 2
V Koritarov 2
TM Mosier3
M Mohanpurkar3
MR Ingram4
S Signore 5
B Hadjerioua 5
BT Smith 5
PW O’Connor5
R Shan 5

January 2021

1 Pacific Northwest National Laboratory
2 Argonne National Laboratory
3 Idaho National Laboratory
4 National Renewable Energy Laboratory
5 Oak Ridge National Laboratory
Acknowledgments

This work was authored by Argonne National Laboratory, operated by UChicago Argonne, LLC, for the
US Department of Energy under Contract No. DE-AC02-06CH11357; Idaho National Laboratory,
operated by Battelle Energy Alliance, LLC, under DOE Contract No. DE-AC07-05ID14517; National
Renewable Energy Laboratory, operated by Alliance for Sustainable Energy, LLC, under Contract No.
DE-AC36-08GO28308; Oak Ridge National Laboratory, operated by UT-Battelle, LLC, under DOE
Contract No. DE-AC05-00OR22725; and Pacific Northwest National Laboratory, operated by Battelle
under DOE Contract No. DE-AC05-76RL01830, and supported by the HydroWIRES Initiative of the
Department of Energy’s Water Power Technologies Office (WPTO).

The authors extend their sincere gratitude to various internal reviewers at the respective laboratories and
external reviewers from various utilities and ISOs. They also extend their gratitude to Dr. Samuel
Bockenhauer and Dr. Kathryn Jackson of DOE’s Water Power Technologies Office for their support
throughout the project.

HydroWIRES

In April 2019, WPTO launched the HydroWIRES Initiative6 to understand, enable, and improve
hydropower and pumped storage hydropower’s (PSH’s) contributions to reliability, resilience, and
integration in the rapidly evolving US electricity system. The unique characteristics of hydropower,
including PSH, make it well suited to provide a range of storage, generation flexibility, and other grid
services to support the cost-effective integration of variable renewable resources.

The US electricity system is rapidly evolving, bringing both opportunities and challenges for the
hydropower sector. While increasing deployment of variable renewables such as wind and solar have
enabled low-cost, clean energy in many US regions, it has also created a need for resources that can store
energy or quickly change their operations to ensure a reliable and resilient grid. Hydropower (including
PSH) is not only a supplier of bulk, low-cost, renewable energy but also a source of large-scale flexibility
and a force multiplier for other renewable power generation sources. Realizing this potential requires
innovation in several areas: understanding value drivers for hydropower under evolving system
conditions, describing flexible capabilities and associated tradeoffs associated with hydropower meeting
system needs, optimizing hydropower operations and planning, and developing innovative technologies
that enable hydropower to operate more flexibly.

HydroWIRES is distinguished in its close engagement with the DOE National Laboratories. Five
National Laboratories—Argonne National Laboratory, Idaho National Laboratory, National Renewable
Energy Laboratory, Oak Ridge National Laboratory, and Pacific Northwest National Laboratory—work
as a team to provide strategic insight and develop connections across the HydroWIRES portfolio as well
as broader DOE and National Laboratory efforts such as the Grid Modernization Initiative.

Research efforts under the HydroWIRES Initiative are designed to benefit hydropower owners and
operators, independent system operators, regional transmission organizations, regulators, original
equipment manufacturers, and environmental organizations by developing data, analysis, models, and
technology research and development that can improve their capabilities and inform their decisions.

More information about HydroWIRES is available at https://energy.gov/hydrowires

6   Hydropower and Water Innovation for a Resilient Electricity System (“HydroWIRES”)

                                                       1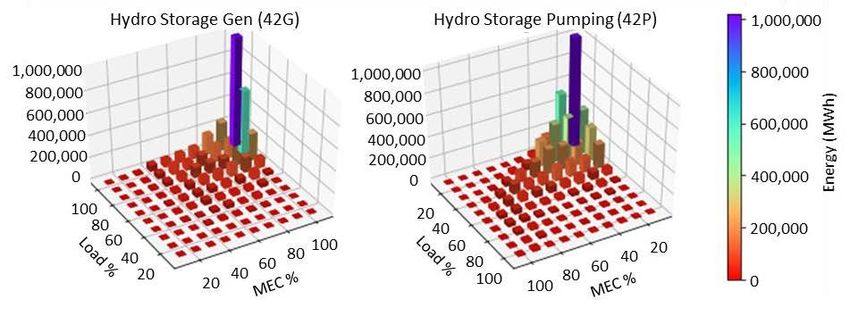
Acronyms and Abbreviations

AGC          Automatic Generation Control
BPA          Bonneville Power Administration
CAISO        California Independent System Operator
DOE          U.S. Department of Energy
EFC          Effective Flexible Capacity
EIM          Energy Imbalance Market
EQR          Electric Quarterly Report
FERC         Federal Energy Regulatory Commission
FRA          Flexibility Resource Adequacy
GCD          Glen Canyon Dam
GW           Gigawatt(s)
HVS          Hydropower Value Study
HydroWIRES   Hydropower and Water Innovation for a Resilient Electricity System
ISO-NE       Independent System Operator – New England
LAP          Loveland Area Projects
LMP          Locational Marginal Price
LTEMP        Long-Term Experimental and Management Plan
M&I          Municipal and Industrial
MISO         Midcontinent Independent System Operator
MW           Megawatt(s)
Mid-C        Mid-Columbia Trading Hub
NERC         North American Electric Reliability Corporation
PFR          Primary Frequency Response
PG&E         Pacific Gas & Electric Co.
PPA          Power Purchase Agreement
PSH          Pumped Storage Hydropower
PUD          Public Utility District
RA           Resource Adequacy
ROD          Record of Decision
RM           Reserve Margin
RPS          Renewable Portfolio Standard
SFR          Secondary Frequency Regulation
US           United States
VRE          Variable Renewable Energy
WAPA         Western Area Power Administration
WECC         Western Electricity Coordinating Council
WPTO         Water Power Technologies Office

                                       2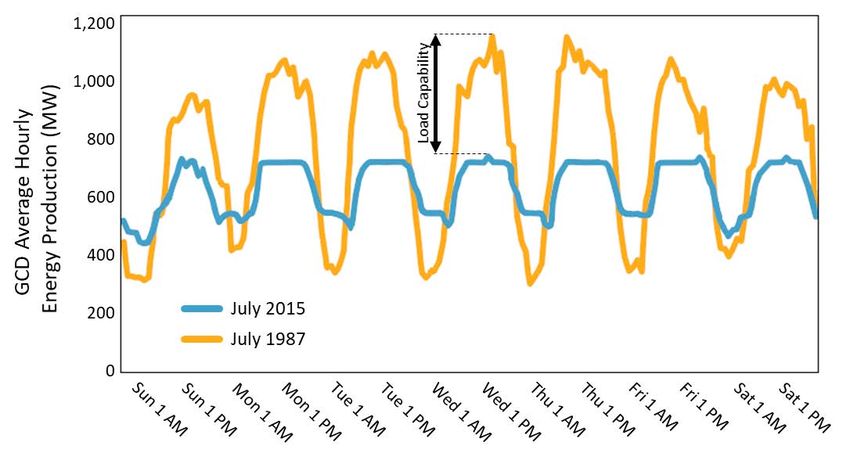
Contents
Acknowledgments ......................................................................................................................1
Acronyms and Abbreviations........................................................................................................2
Figures......................................................................................................................................5
Tables .......................................................................................................................................7
1.0 Introduction........................................................................................................................8
2.0 Results ............................................................................................................................. 11
    2.1 Hydropower operations are changing in some parts of the country because of changing grid
         conditions ................................................................................................................. 11
         2.1.1 The increasing penetration of VRE resources has negatively influenced energy prices . 11
              2.1.2 Pumping patterns of pumped storage hydropower have changed in some parts of the
                    country to optimize opportunities to pump during low and generate at high energy price
                    times across the day........................................................................................... 12
              2.1.3 In other parts of the country, notably in the Pacific Northwest, resources continue to
                    operate predominantly in load-following (gross load) mode..................................... 15
           2.1.4 Even with these changing conditions, the capacity factor for hydropower resources in
                 the US has stayed relatively constant through the years, between 35 and 45%............. 16
       2.2 Hydropower generators are important contributors to grid reliability .................................. 17
              2.2.1 Hydropower capacity contributes, and will most likely continue to contribute, to
                    resource adequacy (RA) requirements at a higher percentage versus capacity compared
                    to other resources to ensure reliable operations of the grid ....................................... 17
              2.2.2 Hydropower resources provide operating reserves, such as spinning reserves and total
                    Regulation Reserve requirements (up to 60% and 25%, respectively, despite being
                    approximately 10% of generation in CAISO) that ensure the stability and reliability of
                    grid operations.................................................................................................. 19
           2.2.3 Hydropower resources provide essential reliability services, such as inertial and primary
                  frequency response............................................................................................ 21
       2.3 There is a wide variation in hydropower plant conditions and capabilities to provide grid
           services..................................................................................................................... 22
              2.3.1 Hydropower resources’ ability to provide grid services depends on the electro-
                    mechanical (physical) attributes, which are in turn governed by the hydrological and
                    geological conditions at a location. ...................................................................... 23
              2.3.2 Environmental operating criteria can constrain the flexibility of hydropower operations24
              2.3.3 The seasonal variations in water availability from year to year and the prevailing water
                    management practices, due to environmental and other requirements, can imply a great
                    variation in the provision of energy and other essential reliability services by
                    hydropower resources. ....................................................................................... 26
       2.4 Traditional economics for hydropower plants may not provide stable revenue into the future . 26
           2.4.1 The average annual wholesale electricity prices across various parts of the country have
                  declined substantially since 2008. ........................................................................ 27
              2.4.2 Changing market prices have negatively impacted estimated revenues of hydropower
                    resources in the Northeastern states (ISO-NE) ....................................................... 29

                                                                      3
2.4.3 Changing market prices have also negatively impacted estimated revenues of PSH
                   resources in MISO ............................................................................................ 30
             2.4.4 The major revenue source in most markets is still energy generation, followed by long-
                   term capacity payments and ancillary services, including uplift, which contributes to
                   only a small part of the total revenue.................................................................... 33
          2.4.5 While most hydropower is technically capable of providing ancillary services, there is
                often an opportunity cost due to the small size and value of the ancillary service market34
      2.5 Emerging new market mechanisms could compensate hydropower flexibility ...................... 36
             2.5.1 Not all grid services are currently compensated ..................................................... 36
             2.5.2 Changing grid conditions are likely to put a premium on fast-acting and flexible
                   resources such as hydropower ............................................................................. 37
             2.5.3 The evolving flexibility requirements have led some ISOs, such as the CAISO to define
                   new flexibility resource adequacy capacity constructs, and hydropower is already
                   helping meet some of these requirements .............................................................. 38
3.0 Path Forward .................................................................................................................... 40

                                                                   4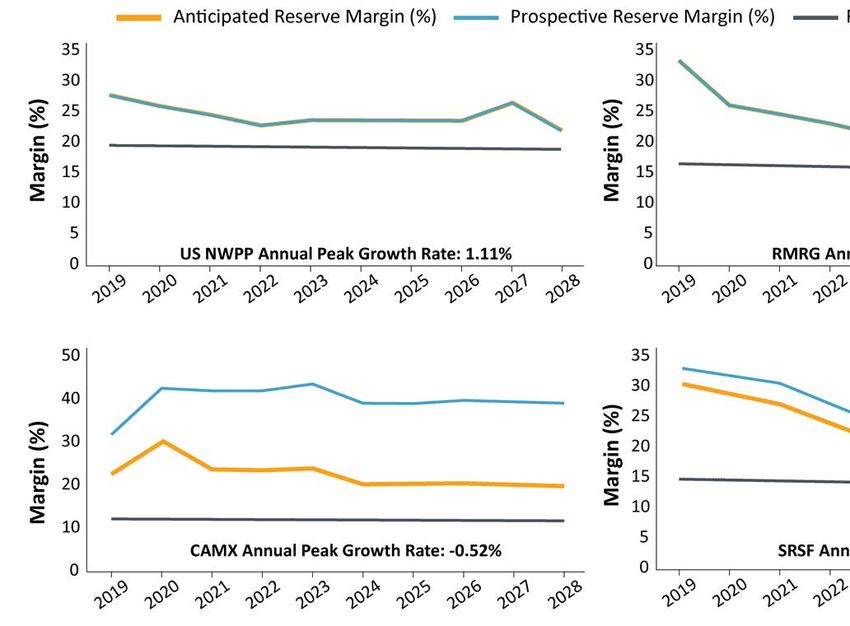
Figures
Figure 2-1. The maximum amount of load served by renewables in CAISO. (Data source: CAISO) ... 11
Figure 2-2. Percentage of negative price 5-minute intervals in 2013, 2015, and 2017 in the CAISO
during the hours of a day. (Data source: CAISO) .................................................................... 12
Figure 2-3. Pumping operations of PSH plants in MISO over the years. (Data source: MISO) ........... 12
Figure 2-4. The changes in annual pumping schedules of the Helms PSH plant in CAISO. (Data source:
PG&E) 13
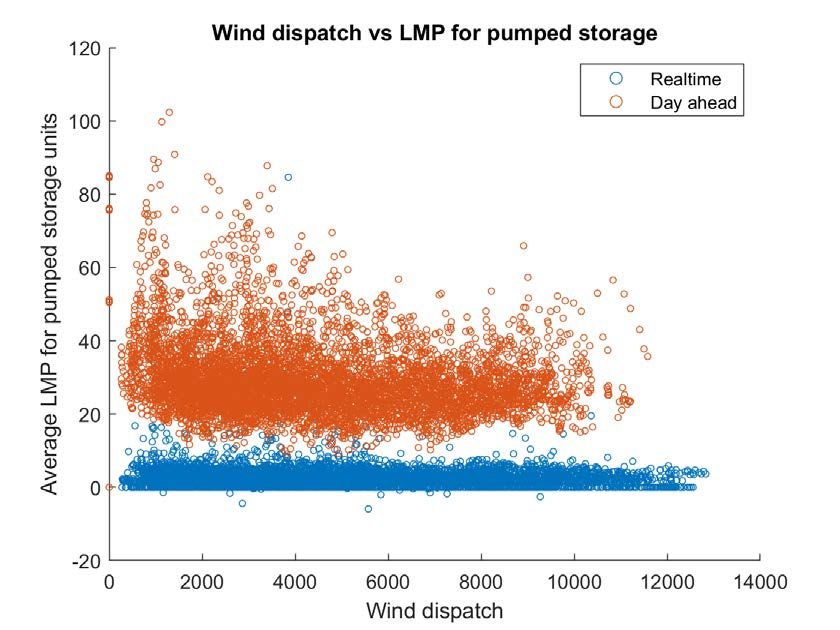
Figure 2-5. PSH generation and pumping relative to wind generation. (Data source: MISO) ............. 14
Figure 2-6. Wind generation does not affect LMPs at the PSH locations in MISO. (Data source: MISO)14
Figure 2-7. PSH generation and pumping relative to system prices (LMPs). (Data source: MISO) ..... 15
Figure 2-8. Comparison of PSH operations in pumping vs. generation modes in MISO (2015–2017).
Marginal Energy Charge (MEC) is the energy component of the LMP. (Data source: MISO) ........ 15
Figure 2-9. Typical pattern of hydropower operations in the Pacific Northwest compared to gross load
in March 2016. Hydropower is continuing to operate in gross load-following patterns as designed.
(Data source: EIA) ............................................................................................................. 16
Figure 2-10. Capacity factor of conventional hydropower resources in the US. (Data source: EIA) ...... 16
Figure 2-11. Capacity factors of conventional hydro resources in ISO-NE. (Data source: FERC Electric
Quarterly Report [EQR])..................................................................................................... 17
Figure 2-12. NERC subregions in the Western Interconnection. ..................................................... 18
Figure 2-13. Capacity RMs between 2019 and 2008 in the four NERC subregions. ........................... 19
Figure 2-14. Percentage of spinning reserve provided by conventional hydropower resources in MISO.
Hydropower’s total capacity ranges from 3–5% of total the installed generation capacity. (Data
source: MISO)................................................................................................................... 20
Figure 2-15. Contribution of hydropower resources for essential reliability services in CAISO.
Hydropower’s total capacity ranges from 10–15% of total capacity in CAISO. (Data source: CAISO)21
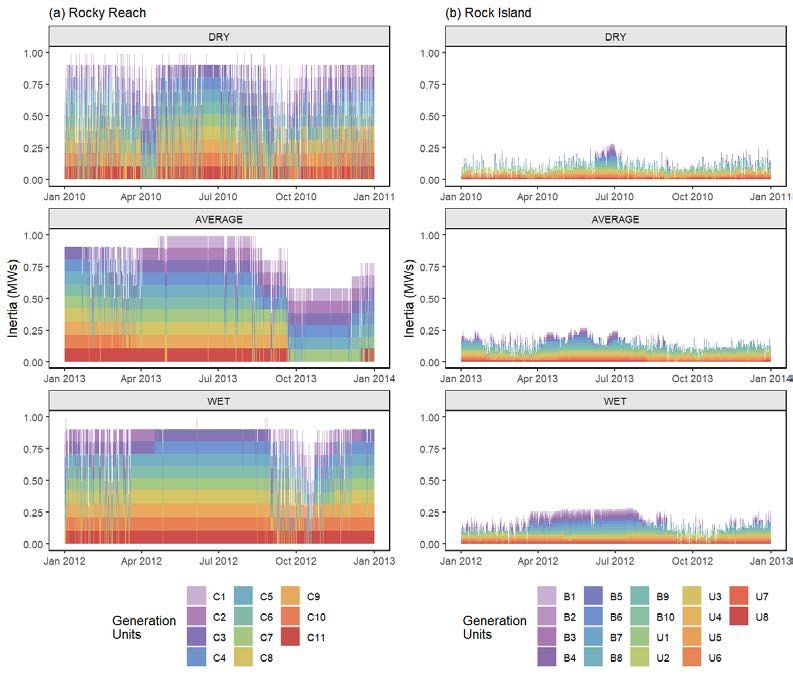
Figure 2-16. Hourly average inertia (MWs) contributed by all generating units for (a) Rocky Reach and
(b) Rock Island run-of-river projects across dry, average, and wet years. Inertia response capabilities
depend on water availability throughout the year, and the most generation during summer of wet
years. 22
Figure 2-17. Hourly energy production at the GCD powerplant during a July week in 1987 and 2015.
Flexibility was restrained with the implementation of new environmental restrictions................... 25
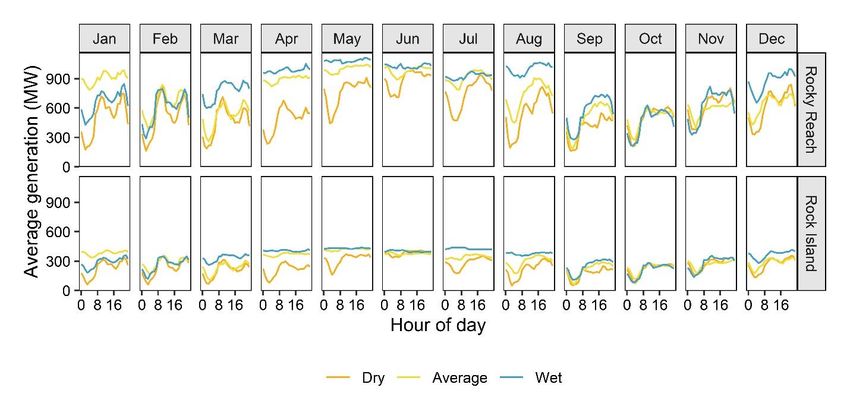
Figure 2-18. Comparison of average hourly generation during dry, average, and wet years at Rocky
Reach and Rock Island Dams. During spring and early summer months of wet years at both Rocky
Reach and Rock Island, the flexibility of operations is restricted due to high flow conditions. (Data
source: Chelan PUD).......................................................................................................... 26
Figure 2-19. Average annual energy prices at select price hubs in US ISO/RTO markets. Wholesale
electricity prices are highly correlated with natural gas prices. .................................................. 27
Figure 2-20. The Citygate natural gas price is positively correlated with the Mid-C wholesale price.
(Data source: EIA) ............................................................................................................. 28
Figure 2-21. Hydropower generation is negatively correlated with Mid-C wholesale price. (Data source:
EIA) 29
5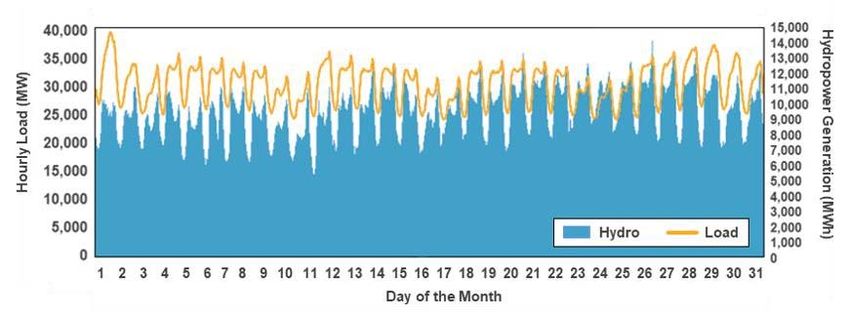
Figure 2-22. The revenue of peaking and run-of-river plants in ISO-NE has been decreasing since 2008.
    (Data source: FERC EQR) .................................................................................................. 30
Figure 2-23. Annual generation vs. pumping load for PSH resources in MISO. Total generation and
    pumping have decreased since 2010. (Data source: MISO) ....................................................... 31
Figure 2-24. The LMP spread between peak and off-peak hours in MISO shows a decreasing arbitrage
    spread. 32
Figure 2-25. Comparison of annual revenue and pumping costs for PSH units in MISO. Net revenue has
    decreased since 2010 but increased slightly in 2016. (Data source: MISO).................................. 32
Figure 2-26. Total cost of serving load in ISO-NE from 2013 to 2017. Energy is still the bulk of costs
    but is decreasing. This can indicate an opportunity cost in providing other services over energy.
    (Data source: FERC EQR) .................................................................................................. 33
Figure 2-27. The total cost of serving load in CAISO from 2014 to 2018. Energy is still the bulk of
    costs. This can indicate an opportunity cost in providing other services over energy. (Data source:
    CAISO) 34
Figure 2-28. Opportunity costs associated with carrying operating and contingency reserves at LAP
    hydropower resources in the Western Area Power Administration, Colorado-Missouri Region
    balancing authority area of the Rocky Mountain Transmission Group joint-tariff market, for
    simulation year 2024. ......................................................................................................... 35
Figure 2-29. Monthly projected generation for Yellowtail hydropower facility during a sample year. ... 36
Figure 2-30. The generation mix (MW) on March 18, 2019 in CAISO. (Data source: CAISO) ............ 37
Figure 2-31. FRA capacity provided by different resources in CAISO. (Data source: CAISO) ............ 38

                                                                  6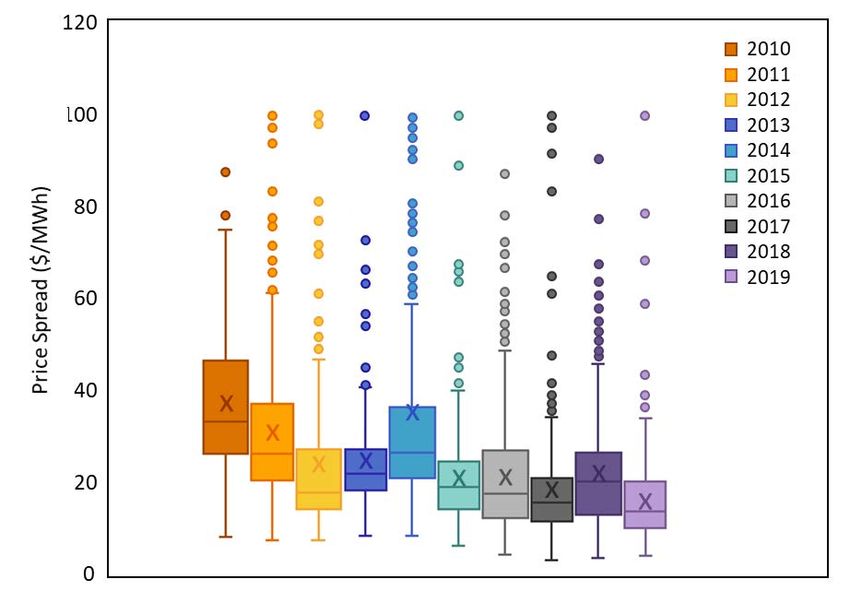
Tables

Table 2-1.   Hydropower capabilities that enable or assist in provision of services and products. ........ 23
Table 2-2.   Constraints on hydropower capabilities from multipurpose benefits. ............................. 24
Table 2-3.   Evolution of GCD operating constraints.................................................................... 25
Table 2-4.   Comparison of estimated revenue from regulation vs. energy service in MISO (2015–
    2017).   34
Table 2-5.   Flexible resource adequacy constructs in CAISO. ...................................................... 38

                                                          7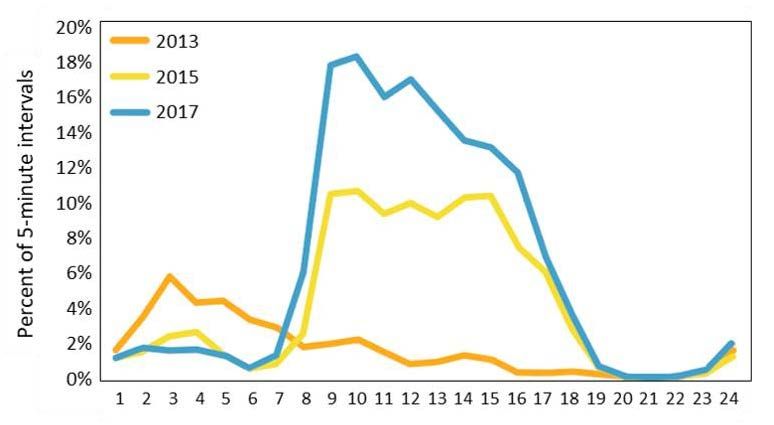
1.0 Introduction
To reveal the current landscape and prospective role and influence of hydropower operations on the
nation’s electric grid, the U.S. Department of Energy’s (DOE’s) Water Power Technologies
Office (WPTO) commissioned the Hydropower Value Study (HVS). The primary purpose of the study
was to gain a comprehensive understanding of current hydropower operations and resulting value across
the country.

Hydropower and pumped storage hydropower (PSH) compose a significant fraction of renewable
generation and electrical storage in the United States, respectively. The US has approximately 101 GW of
nameplate hydropower capacity, including 80 GW of conventional hydropower and 21 GW of pumped
storage. 7 Hydroelectric generation in the US represented 41% of all renewable energy generation and
6.8% of the total generation in the US in 2018. 2 At least 40% of the hydropower capacity is composed of
PSH and “peaking” hydropower plants, which can store water to produce electricity at times of greatest
need and value, and at least 18% is composed of run-of-river plants, which can only produce electricity at
the time water is flowing. 8 Pumped storage hydropower represents 95% of grid-scale energy storage in
the US. Total hydropower capacity appears to be growing due to retrofits, 9 though annual generation
values from hydropower resources appear to be flat for at least the last 20 years. 10 Proportionately,
hydropower resources are decreasing in dominance. In 2019, annual wind generation surpassed annual
hydroelectric generation. 11 Battery storage growth domestically is growing rapidly, while only one
pumped storage facility has been built in the last 15 years. 12

Yet these static annual generation and total capacity values for hydropower resources do not reflect
the dynamic contributions of this sector to electric grid reliability, economic efficiency, and
resilience. The economic and financial context for hydropower resources has undergone significant
changes in recent years due to changing power grid conditions, such as low natural gas prices and low
load growth leading to reduction in energy prices. The rapid growth of renewable energy resources has
led to displacement of some baseload-scheduled energy generators while putting a greater emphasis on
ancillary services. Further changes are on the horizon—technical, technological, sociopolitical, market
structures—that can substantially change the operational requirements of the power grid. The varying
degrees to which these changes eventually manifest will affect the value drivers for hydropower resources
differently. Evaluating the changing value landscape for hydropower resources and understanding the
ability of different resources to provide power system services will enable prudent decisions regarding
changes in operating paradigms and capital investments.

The new operating paradigms are creating opportunities well suited for hydropower installations to
provide valued power system services. The flexibility of hydropower plants is already being used in many

7 US DOE. (2016). “Hydro Vision: A New Chapter for America’s 1 st Renewable Electricity Source.” Department of
Energy Wind and Water Power Technologies Office.
8 ORNL, ORNL’s HydroSource, 2018 https://hydrosource.ornl.gov/
9 Hydropower Market Report, 2018 update. https://www.energy.gov/sites/prod/files/2019/05/f62/2018-updates-

hydropower-market-report.pdf
10 HMR 2017. “US hydropower capacity has increased by 2,030 MW from 2006 to 2016 bringing installed capacity

to 79.99 GW across 2,241 separate plants. Of this net increase, 70% (1,435 MW) resulted from refurbishments and
upgrades (R&U) to the existing fleet.”
11 “Annual wind generation totaled 300 million megawatt-hours (MWh) in 2019, exceeding hydroelectric generation
by 26 million MWh.” US Energy Information Administration. “Wind has surpassed hydro as most-used renewable
electricity generation source in US” February 2020. https://www.eia.gov/todayinenergy/detail.php?id=42955
12 HMR 2017, referencing Lake Hodges, 40 MW, in southern California.

                                                      8
regions of the country to provide services needed to integrate renewables and maintain the reliability of
grid operations. The opportunities, however, may also present additional costs, such as accelerated
machine wear and tear due to frequent cycling and start-stop operations. This implies that asset
management and reinvestment programs need to consider the changing operational paradigms in order to
ensure prudent long-term investments. These changing conditions also require new research into
technology innovation, data development, analytical tools, and operational strategies to preserve and
enable important hydropower capabilities and contributions into the future.
The HVS focused on two primary objectives:
1. Review of the Current Hydropower Operations Landscape
The value of a resource can be discerned from the composition of the portfolio of services (energy,
capacity, and ancillary services) it provides, and the relative value of each of those services. This task
illustrated the recent trends in provision of grid services by hydropower resources based on a
comprehensive, data-driven analysis of hydropower operations in various markets across the country.
These trends shed some light on the impacts of further changes on the horizon relative to hydropower
operations and value. The work also identified and estimated the value of grid services provided by
hydropower that are not currently monetized, such as inertia.
2. Hydropower Capabilities and Operations in Future Grid States
The ability of hydropower resources to provide value to the power system will require a
comprehensive understanding of the resources’ technical and technological capabilities, costs, and
constraints. Hydropower’s capabilities to provide valued grid services, and the factors influencing
how these capabilities vary unit-to-unit and plant-to-plant, are qualitatively and quantitatively
different. This task was designed to analyze the capabilities and constraints that affect a hydropower
facility’s ability to provide various grid services, both now and in future.
The HVS team comprises experts in the fields of economics, statistics, data analytics, power market
design and analysis, hydrology and hydraulics, plant-level controls and operations, as well as power
systems engineers. The project was led by Pacific Northwest National Laboratory (PNNL), with support
from the Argonne (ANL), Idaho (INL), Oak Ridge (ORNL), and National Renewable Energy (NREL)
national laboratories. In collaboration with industry, the HVS looked at the two objectives for hydropower
across varying geographic regions of the US, including the California Independent System Operator
(CAISO), Mid-Continent Independent System Operator (MISO), Independent System Operator New
England (ISO-NE), Western Electricity Coordinating Council (WECC), and the Chelan Public Utility
District (PUD). The study included robust review by industry and other external experts.
The key findings across the HVS are summarized below.
Finding 1: Hydropower operations are changing in many parts of the country because of changing
grid conditions. The changes, however, differ regionally based on the prevailing value drivers, such as
changing arbitrage patterns due to increasing penetration of solar resources. In some regions, these
changes manifest as new market opportunities, such as the western Energy Imbalance Market (EIM),
which is designed to better incorporate the penetration of variable renewable energy (VRE). However, in
some parts of the country, like the Pacific Northwest, hydropower resources continue to operate primarily
in load-following mode. Even with these changing conditions, the capacity factor for conventional
hydropower resources across the US has remained relatively consistent through the years, between 35 and
45%.
Finding 2: Hydropower generators are important contributors to grid reliability. Even in a changing
power system, hydropower continues to be a significant contributor to system reliability through inertial
9and primary frequency responses, reactive power support, and black-start capabilities. 13 Approximately
40% of units maintained and tested for providing black start in the US are hydropower turbines, even
though hydropower makes up only approximately 10% of overall US generating capacity. 1 In addition, in
CAISO, hydropower resources have been observed to contribute up to 25% of the total Regulation
Reserve (up and down) requirements, as well as up to 60% of the total Spinning Reserve requirements
even though hydropower constitutes approximately 15% of installed capacity. Not all generators currently
have these capabilities; the ability of inverter-based resources is currently being evaluated in laboratory
and field demonstrations, and other traditional generators that supply these services may retire from
service in the future, which may increase the demand for certain reliability services from hydropower.
Finding 3: There is wide variation in hydropower plant conditions and capabilities to provide grid
services. Hydropower’s contributions to the grid are multifaceted, in that hydropower may serve several
roles in a generating stack. At least 40% of hydropower resources, by capacity, comprises pumped storage
and “peaking” hydropower plants that can store water to produce electricity at times of greatest need and
value, and at least 18% comprises run-of-river plants, which may have some operational flexibility but
typically cannot impound and store additional water beyond inflows. 14 Even within a given resource class,
i.e., peaking or run-of-river, the ability to provide grid services depends on the site-specific electro-
mechanical (physical) attributes, which are in turn governed by the hydrological and geological
conditions. For a given plant, these capabilities will vary naturally over seasons and over water years
(wet/average/dry). In addition, institutional factors such as existing contracts and Federal Energy
Regulatory Commission (FERC) licenses determine a resource’s ability to provide grid services. In many
cases, non-power services such as flood control or environmental flows govern the ability of a
hydropower plant to supply energy. The value of these services is not always accounted for in the overall
value of hydropower. Additionally, the value of these non-power services is locational, based on
stakeholder perspectives and the valuation methodologies that are employed.
Finding 4: Traditional economics for hydropower plants may not provide stable revenue into the
future. Conventional value streams, such as energy and ancillary services prices, are exhibiting declining
trends in some parts of the country, and these changes have affected hydropower resources adversely.
This trend is evident in conventional hydropower plants in the Northeast, as well as in pumped storage
hydropower plants in the Midwest. Energy generation remains the primary source of revenue for many
hydropower plants, and while most hydropower is technically capable of providing ancillary services, this
provision often includes opportunity costs associated with reduced capacity.
Finding 5: New market mechanisms are emerging that could compensate hydropower flexibility.
While not all services that hydropower provides are currently monetized, new markets for grid services
are emerging that can offer alternative revenue streams. Evolving flexibility requirements have led some
ISOs, such as CAISO, to define new flexibility resource adequacy (FRA) capacity constructs, and
hydropower is already helping meet some of these requirements. New market mechanisms are emerging
for inertia and primary frequency response, and hydropower resources are already being compensated.
For example, CAISO recently signed contracts with the Bonneville Power Administration (BPA) and
Chelan Public Utilities District for explicit compensation for inertial and primary frequency response
provided by hydropower resources.
Highlights from these findings are captured in Section 2: Results. Recommendations for future research to
support the HydroWIRES research roadmap are provided in Section 3: Path Forward.
13 ORNL. (2019). “Hydropower Plants as Blackstart Resources.” ORNL/SPR-2018/1077.
https://www.energy.gov/sites/prod/files/2019/05/f62/Hydro-Black-Start_May2019.pdf
14 ORNL, ORNL’s HydroSource, 2018 https://hydrosource.ornl.gov/
102.0 Results
2.1 Hydropower operations are changing in some parts of the
country because of changing grid conditions
The changes, however, differ regionally based on the prevailing value drivers, such as changing arbitrage
patterns due to the increasing penetration of solar resources. In some regions, these changes manifest as
new market opportunities, such as the western EIM, which is designed to better incorporate the
penetration of VRE. However, in other parts of the country, like the Pacific Northwest, hydropower
resources continue to operate primarily in load-following mode. Even with these changing conditions, the
capacity factor for conventional hydropower resources across the US has remained relatively consistent
through the years, between 35 and 45%.
2.1.1 The increasing penetration of VRE resources has negatively influenced
energy prices
The maximum amount of load served by renewables in CAISO during certain times of the year can be as
high as 70% (Figure 2-1). Because VRE resources are inherently variable, the market operators procure
reserve capacity to ensure supply-demand balance. The procurement of regulation and spinning reserve
capacity can sometimes lead to over-supply of generation, and hence, negative energy prices. Figure 2-2
shows that the occurrence of negative prices in CAISO has increased substantially over the years. 15
Figure 2-1. The maximum amount of load served by renewables in CAISO. (Data source: CAISO)
15Similar trends have been observed in other ISO/Regional Transmission Organization regions as well, NREL -
2018 Renewable Energy Grid Integration Data Book
11Figure 2-2. Percentage of negative price 5-minute intervals in 2013, 2015, and 2017 in the CAISO
during the hours of a day. (Data source: CAISO)
2.1.2 Pumping patterns of pumped storage hydropower have changed in some
parts of the country to optimize opportunities to pump during low and
generate at high energy price times across the day
PSH plants have conventionally operated in day-night arbitrage patterns, i.e., resources typically pump
during nighttime hours in concurrence with low energy prices (due to low load levels) and generate
during evening peak-load hours in concurrence with high energy prices. Figure 2-3 below shows that the
PSH units in MISO continue to pump during the nighttime hours.
Figure 2-3. Pumping operations of PSH plants in MISO over the years. (Data source: MISO)
12The increasing occurrences of negative price hours during day times in CAISO have changed the
arbitrage pattern for the region’s PSH resources. The change in operations of PSH resources is
exemplified by changes in the pumping schedule (Figure 2-4) of the Helms PSH plant, owned by the
Pacific Gas & Electric Co. (PG&E).
Figure 2-4. The changes in annual pumping schedules of the Helms PSH plant in CAISO. (Data source:
PG&E)
Unlike CAISO, the operations of PSH resources in MISO are not driven by the total VRE generation in
the system. 16 Figure 2-5 shows that the total amount of generation and pumping at the MISO PSH plants
from 2015–2017 remains relatively same at different percentiles of wind generation. The finding is
further supported by the fact that locational marginal prices (LMPs) at PSH locations are not affected by
wind generation in MISO (Figure 2-5). This implies that the underlying value driver for PSH operations
at this particular location within MISO—arbitrage price spread between peak and off-peak prices—is not
affected by wind generation, unlike CAISO where the price formation and spread have indeed been
affected by increasing VRE capacity. Instead, the PSH pumping and generation schedules in MISO are
still driven by total system load, which is also positively correlated with the system prices (Figure 2-6 to
Figure 2-8).
16It has been observed that wind power is consistently under-scheduled in the day-ahead markets, relative to actual
production levels. In recent years, the amount of wind power under-scheduled has been observed to be as high as
1000 MW/h (Potomac Economics, “2018 State of the Market Report for the MISO Electricity Markets,” June 2019).
13Figure 2-5. PSH generation and pumping relative to wind generation. (Data source: MISO)
Figure 2-6. Wind generation does not affect LMPs at the PSH locations in MISO. (Data source: MISO)
14Figure 2-7. PSH generation and pumping relative to system prices (LMPs). (Data source: MISO)
Figure 2-8. Comparison of PSH operations in pumping vs. generation modes in MISO (2015–2017).
Marginal Energy Charge (MEC) is the energy component of the LMP. (Data source: MISO)
2.1.3 In other parts of the country, notably in the Pacific Northwest, resources
continue to operate predominantly in load-following (gross load) mode
Resources that have limited storage capabilities, or those not operating in organized power markets, such
as the Pacific Northwest (Figure 2-9) continue operating in the gross load-following mode as they were
designed to operate. When the same time period is superimposed with a time series of prices from an EIM
pricing node, it is observed that there is no correlation with hydropower generation. 17 This pattern of
operations is most prominently seen in the utilities and balancing authorities, such as BPA, that have yet
to join the EIM.
17 Plant designs and operations, and utility contracts for hydropower facilities were conventionally designed for
load-following purposes because markets did not exist at the time. However, many utilities in the WECC have now
joined the EIM, which has led to changes in operations due to (1) exposure to prices, and (2) centralized dispatch by
CAISO (Croft, Chad, 2019. Industry Changes Affecting Operations. Hydrovision International, Portland, OR).
15Figure 2-9. Typical pattern of hydropower operations in the Pacific Northwest compared to gross load in
March 2016. Hydropower is continuing to operate in gross load-following patterns as designed. (Data
source: EIA)
2.1.4 Even with these changing conditions, the capacity factor for hydropower
resources in the US has stayed relatively constant through the years,
between 35 and 45%
Figure 2-10 shows that the capacity factors of conventional hydropower resources have ranged between
35 and 45%, while accounting for annual water availability, and scheduled and unscheduled plant
outages. However, resources in some parts of the country, such as ISO-NE (Figure 2-11) have been
observed to operate at lower capacity factors over the years. The exact reasons for the decrease in
capacity factors of resources in the ISO-NE region are not well understood.
Figure 2-10. Capacity factor of conventional hydropower resources in the US. (Data source: EIA)
16Figure 2-11. Capacity factors of conventional hydro resources in ISO-NE. (Data source: FERC Electric
Quarterly Report [EQR])
Although there have been changes in the operational patterns of hydropower resources due to evolving
grid conditions, hydropower resources continue to be large contributors to grid reliability. The next
section presents the volumes and types of grid reliability services hydropower provides.
2.2 Hydropower generators are important contributors to grid
reliability
Even in a changing power system, hydropower continues to be a significant contributor to system
reliability through inertial and primary frequency responses, reactive power support, and black-start
capabilities. 18 Approximately 40% of units maintained and tested for providing black start in the US are
hydropower turbines, even though hydropower makes up only approximately 10% of overall US
generating capacity. 1 Not all generators have these capabilities currently; the ability of inverter-based
resources is currently being evaluated in laboratory and field demonstrations, and other traditional
generators that supply these services may retire from service in the future, which may increase the
demand for certain reliability services.
2.2.1 Hydropower capacity contributes, and will most likely continue to
contribute, to resource adequacy (RA) requirements at a higher
percentage versus capacity compared to other resources to ensure
reliable operations of the grid
Resource adequacy standards ensure that utilities carry enough capacity with adequate reserve margins
(RMs) to ensure reliable operations of the power system. In the US power grid’s western interconnection
there is currently deemed to be enough firm capacity resources to reliably meet peak loads in the four
18 ORNL. (2019). “Hydropower Plants as Blackstart Resources.” ORNL/SPR-2018/1077.
https://www.energy.gov/sites/prod/files/2019/05/f62/Hydro-Black-Start_May2019.pdf
17North American Electric Reliability Corporation (NERC)19 subregions (Figure 2-12). As shown in Figure
2-13, capacity RMs computed by each individual WECC region of NERC are well above the reference
RM that NERC deems to be enough from a reliability perspective in two of the four subregions though
the year 2028. It is not until the end of this period that the Rocky Mountain Reserve Group and the
Southwest Reserve Sharing Group subregions dip slightly below the reference RM. As a result, the
bilaterally contracted values of RA capacity in the WECC remain extremely low.
Figure 2-12. NERC subregions in the Western Interconnection.
A study of 2016 bilateral contracts for RA capacity in California showed that the weighted average price
for all capacity was $3.10/kW-month, although the individual contracts ranged from $0.5$/kW-month to
$35/kW-month. 20 However, the recent legislatively mandated requirements to achieve a 100% carbon-free
energy mix by 2045 in California and Washington will require those states’ utilities to switch from fossil-
fuel-based energy resources completely. The impact of these legislatively mandated requirements on the
RMs and the associated RA needs are not fully understood. Hydropower capacity will most likely
continue to provide the essential reliability services in such future grid scenarios.
NERC Reliability Assessments, 2019 https://www.nerc.com/pa/RAPA/ra/Pages/default.aspx
19
California Public Utilities Commission (CPUC). The 2016 Resource Adequacy Report. June 2017.
20
www.cpuc.ca.gov/WorkArea/DownloadAsset.aspx?id=6442453942
18Figure 2-13. Capacity RMs between 2019 and 2008 in the four NERC subregions.
2.2.2 Hydropower resources provide operating reserves, such as spinning
reserves and total Regulation Reserve requirements (up to 60% and 25%,
respectively, despite being approximately 10% of generation in CAISO)
that ensure the stability and reliability of grid operations
Conventional hydropower resources contribute, on average, approximately 15–25% of MISO’s hourly
spinning reserve requirements (Figure 2-14). The contribution can be as high as 35% during some hours
of the year. It should be noted that the resources providing spinning reserves also contribute to a system’s
online inertia and primary frequency response ability.
19Figure 2-14. Percentage of spinning reserve provided by conventional hydropower resources in MISO.
Hydropower’s total capacity ranges from 3–5% of total the installed generation capacity.
(Data source: MISO)
In CAISO, hydropower resources have been observed to contribute up to 25% of the total Regulation
Reserve (up and down) requirements, as well as up to 60% of the total Spinning Reserve requirements
(Figure 2-15).
20Figure 2-15. Contribution of hydropower resources for essential reliability services in CAISO. 21
Hydropower’s total capacity ranges from 10–15% of total capacity in CAISO. (Data
source: CAISO)
2.2.3 Hydropower resources provide essential reliability services, such as
inertial and primary frequency response
However, the amount of inertial response provided by a hydropower plant depends on the number of units
that are online and operating synchronously with the rest of the grid. The number of units operating at a
given time, in turn, depends on the prevailing hydrological conditions—dry vs. average vs. wet year.
Figure 2-16 shows that Chelan PUD’s peak inertia contribution is consistent from year to year, but the
amount of time it provides that peak contribution varies considerably based on water conditions. The peak
inertia contribution corresponds to the portion of the year when water flow peaks in the Columbia River
because of snowmelt and correspondingly when all units are online. During the example dry year, Rocky
Reach is at peak inertia contribution from about May through July, and Rock Island is only at peak inertia
contribution for about a week. Comparatively, during the example wet year, Rocky Reach is at peak
inertia contribution from about May through September, and Rock Island still is only at peak inertia
contribution for about a week.
21 Source: CAISO State of the Market Report, 2018
21Figure 2-16. Hourly average inertia (MWs) contributed by all generating units for (a) Rocky Reach and
(b) Rock Island run-of-river projects across dry, average, and wet years. Inertia response
capabilities depend on water availability throughout the year, and the most generation
during summer of wet years.
As these examples demonstrate, a hydropower resource’s ability to provide reliability services can be
bounded by various environmental, hydraulic, electro-mechanical, and contractual constraints. The next
section further explores these constraints and the relationships between them.
2.3 There is a wide variation in hydropower plant conditions and
capabilities to provide grid services
Hydropower’s contributions to the grid are multifaceted, in that hydropower may serve several roles in a
generating stack. At least 40% of hydropower resources, by capacity, comprises pumped storage and
“peaking” hydropower plants, that can store water to produce electricity at times of greatest need and
value, and at least 18% of hydropower resources comprises run-of-river plants, which may have some
operational flexibility but typically cannot impound and store additional water beyond inflows.22 Even
within a given resource class, i.e., peaking or run-of-river, the ability to provide grid services depends on
the site-specific electro-mechanical (physical) attributes, which are in turn governed by the hydrological
and geological conditions. For a given plant, these capabilities will vary naturally over seasons and over
22 ORNL, ORNL’s HydroSource, 2018 https://hydrosource.ornl.gov/
22water years (wet/average/dry). In addition, institutional factors such as existing contracts and FERC
licenses determine a resource’s ability to provide grid services. In many cases, non-power services such
as flood control or environmental flows govern the ability of a hydropower plant to supply energy. The
value of these services is not always accounted for in the overall value of hydropower. Additionally, the
value of these non-power services is locational, based on stakeholder perspectives and the
valuation methodologies that are employed.
2.3.1 Hydropower resources’ ability to provide grid services depends on the
electro-mechanical (physical) attributes, which are in turn governed by
the hydrological and geological conditions at a location.
In this study, the team developed a framework to understand the relationship between various attributes of
hydropower resources and their abilities to provide various grid services (Table 2-1).
Table 2-1. Hydropower capabilities that enable or assist in provision of services and products.
Large Reactive Synch. Flexible Fast Fast Isolated
Services/ Inertial Power Cond. Power Cold Ramp Unit
Attributes Constant Control Mode Dispatch Start-up Rate Start-up
Must Inertial support ✓✓✓ ✓✓✓
Provide PFR ✓
Voltage control ✓✓✓ ✓✓✓
SFR (AGC) ✓✓✓
Spinning
Chosen to ✓✓✓ ✓✓✓
reserves
Provide
Non-spinning
✓✓✓ ✓✓✓ ✓✓✓
reserve
Black start ✓✓ ✓✓✓ ✓✓✓
✓✓✓ well-understood relationship; ✓✓ possible relationship; ✓ relationship exists, but is not well understood.
The attributes of the hydropower resources, and hence, the capability to provide grid services are often
based on site-specific design criteria, governed by hydrological and geological conditions, environmental
regulations, and multi-use benefits of water at the location. The design criterion for most resources,
historically, has been to maximize energy generation around the maximum efficiency points. However, as
the operational paradigms change and hydropower resources are increasingly needed to provide essential
support services, this framework can be used to evaluate the flexibility of existing resources, as well as
the retrofits needed to ensure that the resources are able to provide those services (Table 2-2). The costs
of making the necessary adjustments, or the additional wear and tear associated with flexible operations,
need to be weighed against the benefits of providing the needed grid services.
23Table 2-2. Constraints on hydropower capabilities from multipurpose benefits.
Constraints Involved
Water Use Min Pool Max Pool Flow Max
Priorities Elevation Elevation Min Flow Ramp Rate
Multipurpose
M&I water supply ✓✓✓ ✓✓✓
Benefits
Irrigation ✓✓✓ ✓✓✓ ✓
Reservoir recreation ✓✓✓ ✓✓✓ ✓✓✓
Stream reach
✓✓✓
recreation
Seasonal flood
✓✓✓ ✓✓✓
control
Navigation ✓✓✓ ✓✓✓ ✓✓✓ ✓✓✓
Fish and wildlife ✓✓✓ ✓✓✓
Capabilities Large inertial
Restricted constant
Reactive power
control
Synchronous
condensing mode
Fast cold start-up ✓✓✓
Flexible power
✓✓✓ ✓✓✓ ✓✓✓ ✓✓ ✓✓
dispatch
Fast ramp rate ✓✓✓
Isolated Unit start-up ✓✓✓
✓✓✓ well-understood relationship; ✓✓ relationship exists, but is not well understood; ✓possible relationship.
2.3.2 Environmental operating criteria can constrain the flexibility of
hydropower operations
For example, there were fewer environmental restrictions at Glen Canyon Dam (GCD) prior to 1991.
Table 2-3 shows that power plant water releases could range from 1,000 cfs to 31,500 cfs, with no limit
regarding the daily fluctuations or ramp rates. 23 Such flexibility caused significant environmental damage,
such as the disappearance of native fishes mainly due to changes in downstream water temperatures.
From August 1991 to January 1997, temporary restrictions called “Interim Flow Restrictions” were put in
place before the release of a final environmental impact statement. Since 1997, the water release range
has been reduced to a range from 5,000 to 25,000 cfs, and daily fluctuations and ramp rates have been
limited. More recently, in January 2017, a new Record of Decision (ROD) mandating the preferred
alternative prescribed by the Long-Term Experimental and Management Plan (LTEMP) has been adopted
and was first implemented in October 2017. 24
23 Bureau of Reclamation, “Record of Decision, Operation of Glen Canyon Dam, Final Environmental Impact
Statement, Appendix G,” October 1996.
24 U.S. Department of the Interior, Record of Decision for the GCD LTEMP Final Environmental Impact Statement,
2016. http://ltempeis.anl.gov/documents/docs/LTEMP_ROD.pdf
24Table 2-3. Evolution of GCD operating constraints.
Operational Historical Flows 1996 ROD Flows 2016 ROD Flows
Constraint (before 1991) (from 1997 to 2017) (after 2017)
3,000 (summer) 8,000 (7 a.m. - 7 p.m.) 8,000 (7 a.m. - 7 p.m.)
Minimum flows
(cfs)
1,000 (rest of year) 5,000 (at night) 5,000 (at night)
Maximum non-
experimental flows 31,500 25,000 25,000
(cfs)(a)
Equal to 10 X monthly water release
28,500 (summer) 5,000, 6,000, or 8,000
(in thousands of acre-feet) during
Daily fluctuations depending on release
June-August, and equal to 9 X
(cfs/24 h) 30,500 (rest of year) volume
monthly water release the rest of the
year, but never exceeding 8,000 cfs
4,000 up 4,000 up
Ramp rate (cfs/h) Unrestricted
1,500 down 2,500 down
(a) Except during experimental releases .
Because water flow rate and power are closely related, power capability at GCD has been also
significantly reduced (Figure 2-17). Before the environmental restrictions, during the week from July 19
to July 25, 1987, GCD was able to produce a peak of power of 1,164 MW, that is, 90% of the rated
capacity of this period. After the 1996 ROD, during the same week of the year 2015, this peak generation
dropped to 746 MW, that is, only 56% of its current nameplate capacity.
Figure 2-17. Hourly energy production at the GCD powerplant during a July week in 1987 and 2015.
Flexibility was restrained with the implementation of new environmental restrictions.
252.3.3 The seasonal variations in water availability from year to year and the
prevailing water management practices, due to environmental and other
requirements, can imply a great variation in the provision of energy and
other essential reliability services by hydropower resources.
In the case of the Chelan PUD, the flexibility of operations is significantly hampered during early summer
(i.e., April through July) high flow conditions when energy generation is maximized in order to minimize
water spillage. This practice helps avoid increasing the levels of dissolved oxygen. This behavior was also
evident even during a relatively dry summer even though the intra-day generation patterns differed
markedly during the early summer months between dry and wet weather years. Conversely, dry winter
and early spring conditions create the opportunity for increased flexibility and significant reserves (Figure
2-18). Increased water availability during the months of spring run-off and summer results in a flatter
daily generation profile with increased overall generation, and lower reserve. As operated, plants showed
reduced variability, and flexibility, in hourly generation during spring and early summer—April to July—
and high flow conditions in general.
Figure 2-18. Comparison of average hourly generation during dry, average, and wet years at Rocky
Reach and Rock Island Dams. During spring and early summer months of wet years at both
Rocky Reach and Rock Island, the flexibility of operations is restricted due to high flow
conditions. (Data source: Chelan PUD)
These complex constraints on hydropower operations, together with changes in market and power system
conditions, can have significant impacts on revenues earned by hydropower. The next section presents
some of the observed revenue trends in different parts of the country.
2.4 Traditional economics for hydropower plants may not provide
stable revenue into the future
Conventional value streams, such as energy and ancillary services prices, are exhibiting declining trends
in some parts of the country, and these changes have affected hydropower resources adversely. This trend
is evident in conventional hydropower plants in the Northeast, as well as in pumped storage hydropower
26plants in the Midwest. Energy generation remains the primary source of revenue for many hydropower
plants, and while most hydropower is technically capable of providing ancillary services, this provision
often includes opportunity costs associated with reduced capacity.
2.4.1 The average annual wholesale electricity prices across various parts of
the country have declined substantially since 2008.
Figure 2-19 shows the average of annual wholesale prices across selected pricing hubs in the US
ISO/RTO regions. The data25 show a sharp drop in prices after 2008, and a relatively small spike in 2014.
Oft-noted causes for these price patterns include the steep reduction in natural gas prices, 26 and increasing
penetration of VRE resources. Analysis of historical natural gas and wholesale electricity prices shows a
strong positive correlation between the two data sets in every US ISO/RTO region.
Figure 2-19. Average annual energy prices at select price hubs in US ISO/RTO markets. Wholesale
electricity prices are highly correlated with natural gas prices.
The positive correlation between energy and natural gas prices is also observed in areas that have no
restructured power markets, such as in the Pacific Northwest. Figure 2-20 shows a strong positive
correlation between gas prices at the Citygate trading hub and the wholesale energy prices at the Mid-C
25Data were obtained from Wiser et al. 2019, downloaded using ABB’s Velocity Suite.
26DOE’s “Staff Report to the Secretary on Electricity Markets and Reliability,” 2017 noted that “Shale gas
development has significantly expanded the availability of natural gas and lowered its cost across the United State s
and the world. Before the widespread use of horizontal drilling techniques in the past decade, US natural gas prices
averaged more than $7 per million British thermal unit (MMBtu) between 2003 and 2008, and approached
$14/MMBtu in several short periods (including in 2005 after Hurricanes Katrina and Rita reduced production and
delivery from Gulf of Mexico sources). Hydraulic fracturing practices spread and made previously inaccessible gas
sources economic, causing natural gas prices to fall, averaging less than $3.20/MMBtu between 2012 and 2016.”
27trading hub. In contrast, hydropower generation in the region has been observed to have an inverse
relationship with wholesale energy prices at the Mid-C trading hub. Figure 2-21 shows a moderate
negative correlation between monthly hydropower generation and average monthly wholesale prices in
the Pacific Northwest region. 27
Figure 2-20. The Citygate natural gas price is positively correlated with the Mid-C wholesale price.
(Data source: EIA)
27 Hydropower is the dominant source of electrical energy supply in the region, which impacts the supply from other
resources along with the region’s energy prices. The relationship between hydropower and wholesale market prices
in other parts of the country will depend on the amount of hydropower generation and the mix of other generation
resources in the region.
28Figure 2-21. Hydropower generation is negatively correlated with Mid-C wholesale price. (Data source:
EIA)
2.4.2 Changing market prices have negatively impacted estimated revenues of
hydropower resources in the Northeastern states (ISO-NE)
The changes in market prices can affect the revenues directly, such as for market-based merchant
generators, or through the influence on long-term bilateral transaction prices. Figure 2-22 shows that ISO-
NE’s average energy prices have been decreasing over the past 10 years, except for a sharp spike in 2014,
which coincided with a sharp spike in natural gas prices. As a result, the total revenues28 realized by
hydropower plants are estimated to have also decreased over the years (Figure 2-22). The capacity factors
for run-of-river resources tend to be higher than peaking resources because peaking resources typically
operate only during periods of peak load to take advantage of higher prices. The difference in operating
strategies is also reflected in the total revenue (normalized by total plant capacity in MW), observed for
the two sets of plants. The revenue, as measured in capacity terms ($/kW), is observed to be greater for
run-of-river plants due to their higher capacity factors.
28 The revenues numbers are estimates, based on locational marginal prices (LMPs) and market clearing prices
(MCPs) for energy and ancillary services, respectively. It should be noted though that the actual revenues are likely
to differ because the terms of power purchase agreements (PPAs) are likely to differ from market-based prices.
29You can also read