Overcoming the Bottleneck of Unreliable Grids: Increasing Reliability of Household Supply with Decentralized Backup Systems - Hapres-An Academic ...
←
→
Page content transcription
If your browser does not render page correctly, please read the page content below
sustainability.hapres.com

 Case Study

 Overcoming the Bottleneck of Unreliable Grids:
 Increasing Reliability of Household Supply with
 Decentralized Backup Systems
 Martha M. Hoffmann *, Setu Pelz, Òscar Monés-Pederzini,
 Michele Andreottola, Philipp Blechinger

 Reiner Lemoine Institut, Rudower Chaussee 12, 12489 Berlin, Germany
 * Correspondence: Martha M. Hoffmann,
 Email: martha.hoffmann@rl-institut.de; Tel.: +49-030-120-843-488.

 ABSTRACT

 Electrification efforts have long been a centralized, politicized and
 bureaucratic process heavily dependent on central grid extension.
 However, grid connection may not guarantee reliable supply and even
 grid-connected households can remain in lower tiers of electrification. By
 promoting the integration of solar home systems (SHS) in electrification
 plans, consumers could bridge blackout times and climb the ladder of
 electrification. To evaluate this potential, we perform a case study in
 Gauriganj district in Nepal based on primary survey data (2018), including
 real-time measurements of actual blackout occurrences. Offgridders, a
 self-coded open-source simulation tool based on the Open Energy
 Modelling Framework, is applied to determine the optimal grid-
 supporting capacities of multiple backup systems, including SHS and
 batteries. As a simplification, batteries are assumed to have a fixed lifetime
 of 5 years, while future fuel or electricity price changes are not considered.
 To compare the solutions, we propose the Effective Energy Supply Costs
 (EESC), calculated from the system’s annuity and supply reliability. For
 households of lower electricity demand (Tier 2) an SHS of approx. 10 Wp
 PV and 100 Wh battery powering a secondary DC circuit is the cheapest
 backup-up option at 21 €/a, supplying all daily demand not met by the grid.
 A household with higher electricity demand (Tier 4) is most cost-effectively
 served by a backup diesel generator, however the next cheapest solution
 Open Access
 is an SHS of approx. 40 Wp PV and 160 Wh battery, powering a secondary
 DC circuit during blackouts at 160 €/a. Encouraging investments in these
Received: 31 October 2019
 decentralized renewable energy systems can support efforts towards
Accepted: 09 January 2020
 achieving SDG7.
Published: 17 January 2020

 KEYWORDS: electrification; solar home systems; supply reliability; power
Copyright © 2020 by the
 outages; Nepal; SDG7
author(s). Licensee Hapres,
London, United Kingdom. This is
an open access article distributed ABBREVIATIONS
under the terms and conditions
of Creative Commons Attribution
 SHS, solar home systems; MTF, multi-tier framework of electrification
4.0 International License.

J Sustain Res. 2020;2(1):e200009. https://doi.org/10.20900/jsr20200009
Journal of Sustainability Research 2 of 26

 INTRODUCTION

 Electrification in General

 It is widely recognized that access to modern forms of energy is an
 essential prerequisite for overcoming poverty and promoting human
 development [1]. Improved living conditions by energy services are
 proven, but also social benefits and positive impacts on health and
 education can be observed [2–4]. Recognizing such benefits, the United
 Nations (UN) defined Sustainable Development Goal 7 (SDG7) [5], aiming
 at access to affordable, reliable, sustainable and modern energy for
 everyone by 2030.
 Despite considerable progress in some regions, the goal of sustainable
 universal energy access is still far from being achieved. In fact the number
 of people without access to electricity was slightly below 1 billion (13% of
 the worldwide population) in 2017 [6,7]. Efforts to improve household
 access to modern energy supply have posed challenges to central grid
 infrastructure reliability. In regions with developing electrical
 infrastructure, the push for improving household access has been plagued
 by low quality electricity supply and blackouts [6,8]. For instance,
 according to [9] households connected to the grid in Uganda experience on
 average more than 100 hours of outages per month from an average of
 10.7 outages per month, with mean outage duration of 10.1 h. Similarly, in
 Ethiopia, there are 8.2 electrical outages in a typical month with an
 average outage duration lasting 5.8 h [10]. In most sub-Saharan African
 countries, SHS can be a more reliable and more cost-effective solution for
 power supply compared to the central grid assuming future cost decreases
 of SHS [11].
 While not the focus of this study, unreliable electricity supply also
 affects the operation of schools, hospitals and businesses negatively, and
 can potentially damage sensitive equipment [12]. Businesses specifically
 can experience power outages as limiting their economic growth.
 According to [13], electrical outages were perceived as constraining
 business growth in about 30% of developing countries in 2016, resulting in
 revenue losses of up to 2% of gross domestic product (GDP).
 In the last decades, decentralized solutions such as mini-grids and solar
 home systems (SHS) have emerged as a viable complementary technology
 and are now included into electrification planning [14]. Independently of
 top-down electrification efforts, many consumers already pursue these
 solutions either to gain access for the first time or to increase supply
 reliability. Despite their role in providing access to rural households,
 decentralized renewable energy supply solutions are typically not counted
 in government electricity access statistics that instead focus on household
 connection to the national grid. To overcome the deficiency of binary
 electricity access measurement, the multi-tier framework (MTF) has been
 developed, measuring access to electricity according to seven attributes,
 namely peak available capacity, duration of service, affordability, legality,

J Sustain Res. 2020;2(1):e200009. https://doi.org/10.20900/jsr20200009
Journal of Sustainability Research 3 of 26

 quality of voltage, reliability and health and safety [15]. The multi-
 dimensional measurement of electricity access enables the counting of
 household access to electricity from all sources, encouraging the inclusion
 of decentralized renewable energy technologies in planning efforts
 towards achieving SDG7.
 With our paper we want to address several of the aforementioned
 issues in the provision of reliable energy supply. First, we see that often
 grid connected households have low power qualities and require backup
 solutions. Second, we see that the quality of supply should match the
 respective demand levels according to the MTF. There exist a research gap
 in assessing backup solutions or even off-grid SHS as viable options to
 improve household electricity supply levels based on the different levels
 of the MTF. We tackle this gap with a specific case study for Nepal.

 Research Scope

 Nepal is a landlocked country at the foot of the Himalayas, between the
 People's Republic of China and India. It has a total population of 26.5
 million [16] and is, based on the per capita gross domestic product, one of
 the least developed countries in South East Asia [17]. Around 81% of the
 total population live in rural areas, with only 72% of the people having
 access to electricity in these areas compared to 97% in the urban areas [18].
 The national grid has a low supply reliability: On average 8.7 outages per
 month occur lasting about 3.6 h each (2013) [19]. As Nepal has abundant
 hydro-power and solar energy resources the government promotes
 programs for the electrification of rural areas based on renewable
 energies [20]. Both grid-strengthening and off-grid electrification with
 renewables is pursued, the latter mostly in the form of off-grid micro-
 hydro mini-grids and solar home systems (SHS). The location of our case
 study is the rural municipality of Gauriganj, in Province 1, far-eastern
 Nepal. It is characterized by a particularly high penetration of the grid (85%
 of households are estimated to be connected to the national grid [21]),
 while at the same time experiencing frequent grid outages.
 Our work tackles the broad question of how to cost-effectively
 overcome grid outage issues from a bottom-up perspective in Gauriganj
 municipality. We use the MTF in order to define minimum electricity
 access requirements for two representative household demand profiles,
 classifying these as Tier 2 and Tier 4. We then define five different supply
 options, which are compared according to reliability and cost of supply: (1)
 Grid connection, (2) diesel backup, (3) battery backup, (4) solar home
 system backup, and (5) off-grid solar home system. In order to analyze and
 compare these options, we define the following research questions:

 1. What are optimal system capacities of backup and off-grid solutions to
 satisfy currently unmet household electricity demand?
 2. What specific costs are assigned to the different supply options based
 on different reliability levels?

J Sustain Res. 2020;2(1):e200009. https://doi.org/10.20900/jsr20200009
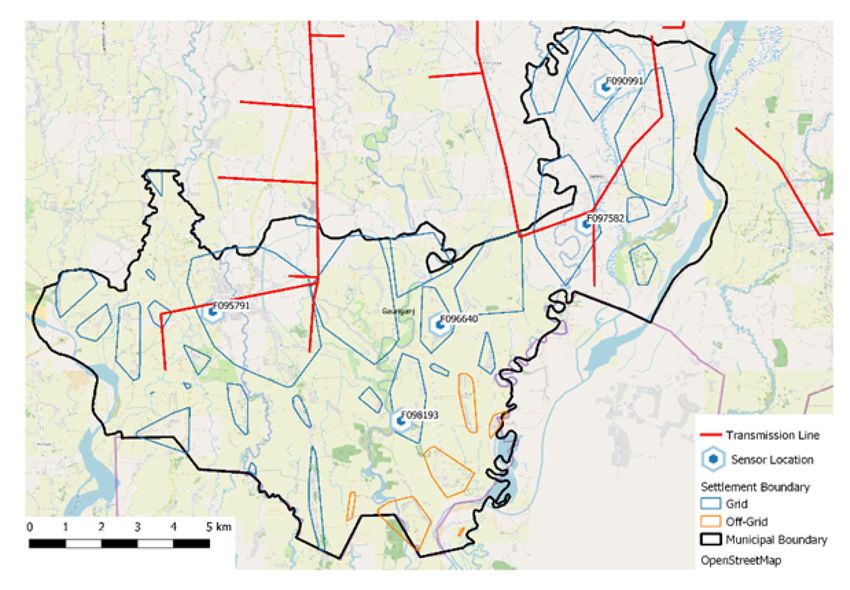
Journal of Sustainability Research 4 of 26

 In order to address these questions, we use primary survey data and
 real-time grid availability measurements collected in Gauriganj in 2018
 [21]. Applying Offgridders [22], a self-coded open-source simulation tool
 based on the Open Energy Modelling Framework [23], to the two
 representative household demand profiles, we determine optimal grid-
 supporting capacities of different backup solutions, namely SHS, batteries
 and diesel generators, and calculate the respective reliability and costs.

 MEASUREMENTS ON NATIONAL GRID AVAILABILITY

 Real-time grid measurements were used to generate representative
 hourly grid availability profiles in the case study. Five Electricity Supply
 Monitoring Initiative (ESMI) data measurement devices [24] were installed
 across five locations in Gauriganj municipality. Specific locations were
 selected to represent peri-urban and rural areas of the municipality, as
 well as both central branches and fringes of the grid (see Figure 1). The
 installation took place in collaboration with the GIZ Nepal—Renewable
 Energy for Rural Areas Programme (GIZ-RERA). The measurement
 campaign was conducted for one full month, from 2018 Jul 1st until July
 31st. The ESMI devices measured grid voltage at a household socket in 1-
 minute resolution.
 For each ESMI sensor data time series, the 1-minute grid voltage data is
 converted into a binary grid availability variable. This is based on the
 assumption that electricity from the grid can be used to power appliances
 if the voltage stays between 180 and 240 V. Thus, voltage levels in that
 range indicate grid availability, voltages outside that range indicate
 blackouts or surges.

Figure 1. ESMI sensor locations, in Gauriganj municipality, far eastern Nepal.

 The hourly average of the binary grid availability variable is then
 calculated to reach the needed time scale of hourly profiles. Finally, the
 binary ESMI sensor datasets are merged, resulting in municipality-wide

J Sustain Res. 2020;2(1):e200009. https://doi.org/10.20900/jsr20200009
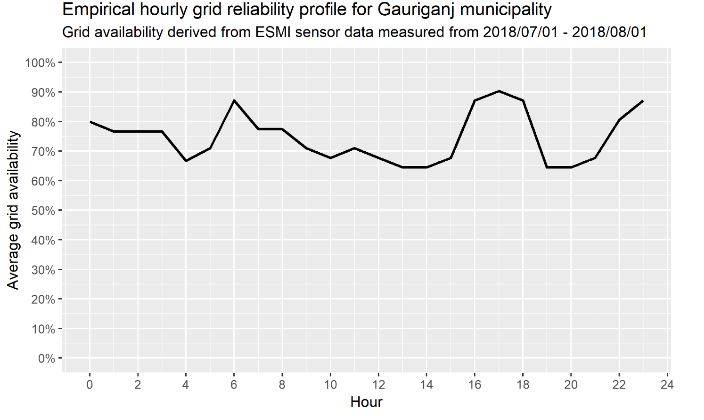
Journal of Sustainability Research 5 of 26

 binary grid availability at 1-hour resolution for the month of July. From
 that, the likelihood of grid availability at each hour of a typical day is
 derived by grouping the resulting data set by hour of the day and taking
 the simple average. The resulting empirical grid reliability profile over a
 typical day, is visualized in Figure 2 (left). This typical daily profile is used
 as an input to generate a stochastic grid reliability profile for 365 days,
 resulting in a time series of Boolean values (1 = grid is available; 0 = grid is
 not available) for each hour of one reference year.
 We compared the modelled annual grid reliability profile against the
 measured profile for the month of July 2018 using the root-mean-squared
 error (RMSE), mean absolute error (MAE), mean percentage error (MPE)
 and Theil’s U2 statistic [25], finding a reasonable fit (comp. Figure 2, right).
 Still, there are limitations to this methodology as the measurements only
 spread over a single month and seasonal or annual variations of blackout
 occurrences are not considered. Further, measurement errors might be
 included in the data series as households were told not to unplug the ESMI
 but still may have done so. This random effect is reduced by the fact that
 we use five sensors and aggregate the data across all of these.

 (A) (B)

Figure 2. (A) Measured hourly grid reliability over a typical day. (B) Stochastic grid reliability model
validation.

 SURVEYS AND DEMAND ESTIMATION

 Survey Design and Implementation

 In early 2018, funded by GIZ Nepal under the RERA program in
 collaboration with the Alternative Energy Promotion Centre (AEPC), the
 Reiner Lemoine Institut (RLI) developed a detailed household energy
 access survey for application in rural Nepal, aligned with the MTF survey
 approach [21]. The main objective of the survey was the collection of
 primary data to support municipal energy planning through the
 assessment of current energy access, energy demand and household
 characteristics [21]. The survey was applied across 15 municipalities of
 Province 1 and Province 7 in rural Nepal between March and August 2018.
 As a result of the implemented sampling strategy, each sample of 400

J Sustain Res. 2020;2(1):e200009. https://doi.org/10.20900/jsr20200009
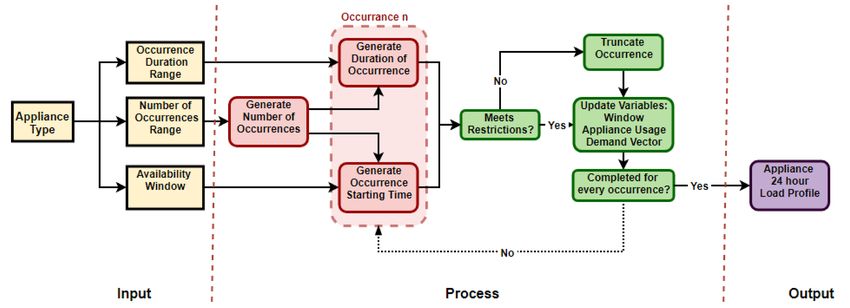
Journal of Sustainability Research 6 of 26

 households was representative at the municipal level [21]. This study
 focuses solely on the municipality of Gauriganj.

 Demand Profile Generation

 Representative basic and high demand household demand profiles
 were characterized based on the surveyed ownership rates of typical
 appliances. The basic demand profile includes all appliances owned by
 more than 50% of the respondents. The high demand profile includes all
 appliances that are owned by at least 15% of the respondents. In alignment
 with the energy access levels defined in the MTF these two profiles are
 labelled Tier 2 and Tier 4 in the following sections. The necessary
 assumptions regarding the appliances, including the quantity of a type
 owned by a household and AC as well as DC power ratings were defined
 based on a market study and literature review (Table 1).

Table 1. Appliance quantity and power rating definition. Quantity based on [15,26–28] and power ratings
based on [15,29–34].

 Appliance Type Ownership Power Rating (W) Appliance Quantity
 DC AC Tier 2 HH Tier 4 HH
 LED Room Lighting 97% 2 6 4 8
 Fan 91% 15 40 1 2
 TV 80% 12 40 1 1
 Smart Phone/Tablet 59% 4 12 1 2
 Mobile Phone 55% 3 5 2 3
 Water Pump 27% 450 500 0 1
 Rice Cooker 21% 200 400 0 1
 Fridge 19% 20 50 0 1

 All load profiles were generated with the aid of a stochastic load
 modelling function, written in R [21]. For each appliance the input consists
 of its availability window as well as the range of number of occurrences
 in the course of one day and each occurrence’s range of utilization
 duration. The parameters were defined based on a literature review on
 similar tools and appliance usages [26,35]. The stochastic load modelling
 function determines how often an appliance is used as well as the
 durations and starting time, from which it generates a 24-hour load profile.
 To account for high-power appliances being used for shorter periods, the
 profile is generated for 30-minute time steps and then averaged to hourly
 values. The flowchart in Figure 3 conveys the stochastic modelling process
 for a single appliance.

J Sustain Res. 2020;2(1):e200009. https://doi.org/10.20900/jsr20200009
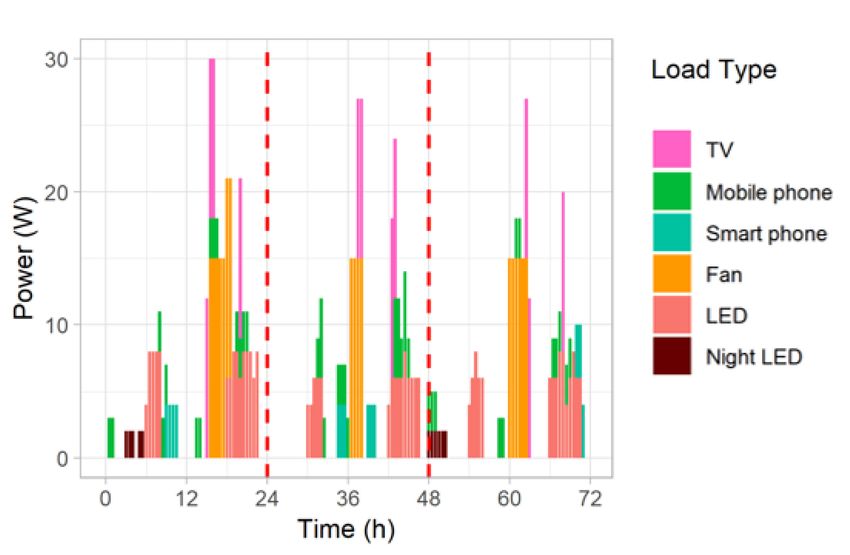
Journal of Sustainability Research 7 of 26

Figure 3. Stochastic load modelling process flow chart for one appliance, source: [16].

 The demand profile of a household results from the aggregation of the
 hourly load requirements of each appliance. To achieve an annual load
 profile this process is repeated automatically for each day in the year.
 The generated profiles confirm the definition of basic and high demand
 households as Tier 2 and Tier 4 according to the MTF based on their daily
 average AC demand: The average consumption of the basic household
 amounts to 394 Wh AC/d (149 Wh DC/d), and the high demand profile
 amounts 3951 Wh AC/d (1377 Wh DC/d). Tier 2 is defined as consumption
 of around 200 Wh per day and Tier is defined as consumption of around
 3400 Wh per day. The DC demand profiles generated are far lower than
 the AC profiles due to the assumed efficiency of DC appliances. Figure 4
 shows an example DC demand profile of a Tier 2 household for a 3-day
 period in 30-minute time steps. The appliances are turned on
 stochastically in their assigned availability windows, generating a
 different load curve for each day.

Figure 4. DC demand profile of Tier 2 in 30-minute time steps.

 Nevertheless, the stochastic load modelling function has limitations in
 its methods and application. Firstly, an hourly demand profile relies on a
 simplification of high-power appliances’ power demand, either

J Sustain Res. 2020;2(1):e200009. https://doi.org/10.20900/jsr20200009
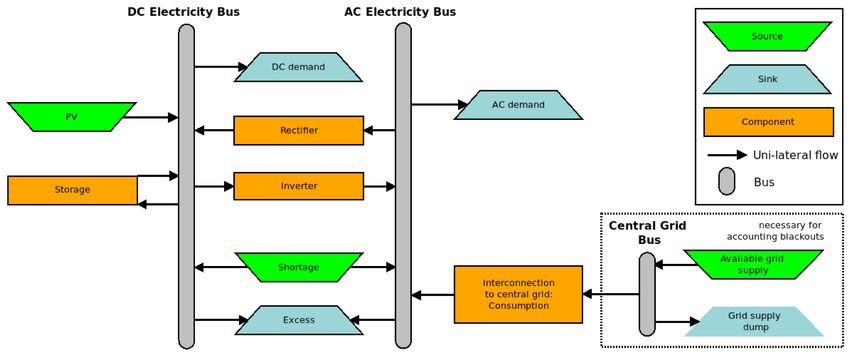
Journal of Sustainability Research 8 of 26

 underestimating peak demand or overestimating consumption.
 Additionally, no seasonal variation has been included in the appliance
 usage parameters. Finally, while the availability windows and usage
 parameters are based on the survey data, it could be argued that there are
 still several levels of uncertainty regarding the accuracy of using survey
 data for demand assessment. This uncertainty is also subject of current
 research discussion. For example, [36] states that estimation based on
 survey data leads to an underestimation of the true electricity demand due
 to an unforeseen night base load and data gaps regarding morning peaks.
 On the other hand, [37] suggests that demand profiles based on survey
 data can overestimate true demand as users know the window of hours
 when appliances can be used, but not the actual average hours of
 utilization.

 SIMULATING THE ENERGY SYSTEMS OF THE CASE STUDY

 Description of the Used Simulation Tool Offgridders

 To determine the optimal backup capacities necessary to support an
 unreliable grid, the self-coded simulation tool Offgridders [22,38] is
 applied. It is based on the python-library Open Energy Modelling
 Framework (oemof) [23,39], which offers a platform to model various
 energy systems. oemof is a validated framework which has been applied
 for large system modelling of Europe [40] as well as for smaller case-
 studies [41]. Each model created with oemof builds up on basic
 components, consisting of sinks, sources, transformers and storages, all
 connected through unilateral (energy) flows with respective busses. Each
 component has several parameters describing its behavior and assigning
 costs or efficiencies to its flows. oemof transposes the model to a set of
 linear equations. The problem can then be optimized using different
 solvers resulting in the cost-optimal solution. For this paper, the cbc solver
 was used to solve the optimization problem.
 The general energy system created with Offgridders is displayed in
 Figure 5. The components—grid connection, PV, battery, AC or DC demand,
 inverters and rectifiers—are included according to the respective scenario
 definition. An extended description of the linear equation system
 generated can be found in the Appendices.

J Sustain Res. 2020;2(1):e200009. https://doi.org/10.20900/jsr20200009
Journal of Sustainability Research 9 of 26

Figure 5. Energy system modelled with Offgridders. Components are (de-) activated depending on the
scenario analyzed.

 While the optimal capacities of the backup systems’ components are a
 direct simulation output, other indicators are calculated to ease scenario
 comparison. The equations are presented below. The supply reliability η
 is the ratio of annual electricity demand to supplied electricity :

 = (1)

 The renewable factor RF is the ratio of electricity from renewable (PV)
 sources and fossil (grid) consumption :

 = (2)
 +

 In addition to that, the levelized cost of electricity (LCOE) is calculated.
 It is based on the net present value (NPV) which monetizes all costs
 connected to the supply system, including the first-time investment costs
 C and all future cash flows CF composed of expenditures for operation,
 maintenance and fuel as well as asset replacement costs. The capital
 recovery factor CRF is used to determine the present value of a cash flow
 in year t and translates the NPV into an annuity, using discount factor d
 and project lifetime T.
 ⋅ (1 + )
 ( ) = (3)
 (1 + ) − 1
 ( )
 = ∑ + ∑ + NPVfix (4)
 ( )

 ∙ ( )
 = (5)

 It must be emphasized that the actual supplied electricity is used as the
 reference value, not the initially intended consumption. This implies an
 interdependence between system reliability factor and LCOE, but avoids
 that unreliable systems are assigned an unreasonable low LCOE due to
 high but potentially unsupplied demand in the denominator.

J Sustain Res. 2020;2(1):e200009. https://doi.org/10.20900/jsr20200009
Journal of Sustainability Research 10 of 26

 Scenario Development

 To evaluate the potential of a number of system configurations that can
 provide backup to the unreliable national grid in Gauriganj, the following
 scenarios are evaluated:

 1. Sole national grid. The households are supplied only by the national
 grid, i.e., this scenario is the status-quo of electricity supply. As such, the
 current household demand is AC. As blackouts occur in the national
 grid the expected supply reliability may be far below 100%.
 2. Diesel generator. In case of blackout, a diesel generator is turned on
 instantaneously and supplies the demand of the household.
 3. Backup battery. A battery is charged fully when the grid is available.
 In case of blackout, the battery is discharged and supplies AC demand.
 This type of backup system is common throughout Nepal and
 colloquially called “inverters”.
 4. Backup SHS (PV and battery). A solar home system is installed,
 charging a battery.

 a) AC Backup. When a blackout occurs, users manually switch on an
 inverter, which is connected to the battery, and supply AC demand
 by discharging the battery.
 b) Secondary DC circuit. When a blackout occurs, users utilize a
 secondary electricity circuit that supplies electricity to DC
 appliances directly from the SHS. This secondary circuit is
 connected to additional investment costs into the specific DC devices.
 Due to availability issues, only Tier 2 appliances can be bought in DC.

 5. Off-grid SHS (PV and battery). In case a household is not yet
 connected to the national grid, an investment into an off-grid SHS is
 possible.

 a) AC supply. Investing into an inverter, the SHS can supply AC
 demand.
 b) DC supply. Limiting demand to Tier 2 appliances, a SHS can supply
 a household’s DC demand. The costs into DC devices are not taken
 into account, as in this case they are not in addition to AC devices.

 For Scenarios 4b and 5b we limit Tier 4 households to Tier 2 DC
 appliances as Tier 4 appliances are typically not available in the required
 DC form in Nepal. As a result, Tier 4 households are supplied less energy
 during blackout times in these scenarios (0.4 kWh/d DC), effectively
 experiencing supply shortage compared to their initial demand (1.4 kWh/d
 DC). All backup solutions are solely utilized to provide electricity to the
 consumers in case of a national grid blackout. Without a backup system
 (Scenario 1), the household’s electricity demand cannot be supplied during
 a blackout.
 While electrification scenarios are typically compared based on their
 LCOE, we also compare these based on the system’s annuities, which are
 in form of annual payments for electricity supply. However, as in case of

J Sustain Res. 2020;2(1):e200009. https://doi.org/10.20900/jsr20200009
Journal of Sustainability Research 11 of 26

 the national grid and in case of DC supply of T4 households, it is possible
 that an electricity supply solution cannot meet actual demand, which
 would not be considered in a comparison based on annuity alone. To
 overcome this shortcoming, we introduce the Effective Electricity Supply
 Costs (EESC) per year, which are calculated based on annuity A and the
 supply system’s reliability:
 NPV ⋅ CRF A
 = = (6)

 Assumptions and Input Data

 Two additional constraints were added into Offgridders prior to
 simulation (see supplementary materials). Firstly, the backup systems can
 only be used when the grid is experiencing a blackout, ensuring that the
 components are only used as backup devices but not as an electricity
 supply option equal to grid consumption. Secondly, a constraint for forced
 battery charge is introduced for the backup battery in “inverter” mode,
 avoiding oemof’s built-in dispatch optimization method, which uses
 perfect foresight.
 The input for the simulation consists of the synthetic grid availability
 and demand profiles, a specific solar generation time series, system
 component costs (Table 2) as well as technical parameters (Table 3). The
 storage system represents a cheap lead-acid battery available at local
 markets. It has a constant throughput efficiency of 80%, and is operated
 with a DOD of 70%, resulting in a low lifetime of 5 years. Battery aging
 processes based on cycling are neglected. The PV system configuration was
 adapted to the Nepalese context and used to generate a specific generation
 profile from [42]. PV degradation is not considered.

Table 2. System component costs, according to [43] and market study.

 Component unit Investment costs O&M costs Lifetime
 (€/unit) (€/unit) (a)
 Inverter (DC/AC) kW 400 50 15
 Rectifier (AC/DC) kW 150 5 15
 Storage kWh 230 15 5
 PV kWp 650 8 20

J Sustain Res. 2020;2(1):e200009. https://doi.org/10.20900/jsr20200009
Journal of Sustainability Research 12 of 26

Table 3. Technical input parameters.

 Efficiencies
 Inverter (DC/AC) 0.98
 Connection to national grid 0.95
 Rectifier (AC/DC) 0.8
 Storage
 Crate 0.3
 Efficiency 0.8
 DOD 0.7
 Max charge 0.95
 PV system
 Azimuth 180
 Tilt 29°
 Location 26.447, 87.7267
 System loss 5.00%

 A project duration of 20 years is assumed with a discount factor of 9%.
 For grid-connected Scenarios 1 to 4, it is assumed that the household’s grid
 interconnection has already taken place and possible connection costs are
 not included in the economic calculations. As the electricity tariff of the
 Nepalese national grid depends on the monthly consumption [44], an
 electricity price of 2.4 €ct/kWh is used for Tier 2 and of 7.9 €ct/kWh for Tier
 4. In addition, the annual fixed connection fee of 2.8 € (T2) and 9.4 € (T4),
 respectively, are considered. For Scenario 4b additional DC devices for the
 secondary electricity circuit have to be bought. The costs are listed in
 Table 4, and sum up to a single investment of approximately 58 € for Tier
 2 households and approximately 84 € for Tier 4 households. A diesel fuel
 price of 0.76 €/L is considered. Fuel and electricity tariff price changes are
 neglected as it is assumed that a decision regarding a backup system
 needed in the near future would be based on current energy costs.

Table 4. Costs of DC appliances (limited to Tier 2 devices), based on local market research *.

 Device (DC) Price Number of devices
 (€) T2 T4
 LED 1.6 4 8
 Fan 15.9 1 2
 Mobile phone 1.6 2 3
 Smartphone/Tablet 2.2 1 2
 TV 30 1 1
 Cost of secondary circle (€) 57.7 83.8
* Nepalese companies’ websites were visited or were directly approached to understand local prices for the components
 considered in Offgridders.

J Sustain Res. 2020;2(1):e200009. https://doi.org/10.20900/jsr20200009
Journal of Sustainability Research 13 of 26

 Simulation Results for Different Supply Scenarios

 We simulate the optimal (backup) system capacities, their reliability,
 LCOE and NPV using Offgridders. The detailed results are shown in Table 5
 (Tier 2) and Table 6 (Tier 4). Supply solely through the main grid effects
 daily life heavily due to blackouts. The reliability of AC demand supply for
 Tier 2 consumers lies at 75%, while Tier 4 households have a slightly lower
 supply reliability of 72%. In terms of LCOE, a SHS with a secondary DC
 circuit (4b) appears to be the cheapest backup system for an unreliable
 national grid for a Tier 2 household. While this is also true for a Tier 4
 household (5b), this configuration can by design cover only supply Tier 2
 DC appliances during blackouts. The ranking of investment options
 however shifts, in case that system annuity or EESC are used for scenario
 comparison.

 LCOE

 While supply through the national grid proves to be the cheapest
 solution for both households costing 5 and 9 €ct/kWh respectively, it
 cannot guarantee reliable supply and leaves about a quarter of demanded
 electricity unsupplied. Searching for solutions ensuring reliable supply is
 therefore important.
 An autonomous off-grid SHS system would be the most expensive
 supply solution. For a Tier 2 consumer, AC supply could be realized at
 52 €ct/kWh and DC supply at 41 €ct/kWh. A Tier 4 consumer could realize
 AC supply with an LCOE of 41 €ct/kWh, while supplying only DC demand
 is cheaper with 37 €ct/kWh. This, however, limits demand to Tier 2
 appliances, effectively suppling 31% of the required services in terms of
 kWh. It is important to note that the increased costs per kWh of AC supply
 compared to kWh DC supply result from the discrepancy between AC and
 DC load profiles and the system’s configurations. As such, installing an AC
 system for a Tier 2 household has a three times as high NPV as installing a
 DC SHS delivering the same electricity-based services.
 A battery backup system is less expensive than an off-grid SHS. Reliable
 supply can be reached with a battery capacity of 369 Wh for a Tier 2
 consumer with an LCOE of 32 €ct/kWh and for a Tier 4 consumer with
 2.6 Wh battery capacity at 29 €ct/kWh. Using a backup SHS to supply AC
 demand leads to an LCOE of 27 €ct/kWh for Tier 2 households at an optimal
 capacity of about 70 Wp PV and 216 Wh battery, resulting in a renewable
 share of 53%. A Tier 4 consumer can be lifted to reliable electricity access
 by installing 283 Wp PV and 2 kWh battery at 24 €ct/kWh with a renewable
 share of 30%. Compared to that, for both Tier 2 and Tier 4 households, a
 backup diesel generator has a lower LCOE of 18 and 19 €ct/kWh. The
 backup generators would have an optimal capacity of 160 W and 1.2 kW.
 The cheapest solution to ensure that basic Tier 2 services are always
 supplied in blackout times is a SHS backup that supplies a secondary
 electricity circuit with DC appliances. The LCOE, even including the first-

J Sustain Res. 2020;2(1):e200009. https://doi.org/10.20900/jsr20200009
Journal of Sustainability Research 14 of 26

 time investment costs into DC appliances, decreases to 17 €ct/kWh for
 Tier 2 and 11 €ct/kWh for Tier 4 households. An installation of 11 Wp PV
 and 101 Wh battery is required for a Tier 2 household, and for an Tier 4
 household 38 Wp and 241 Wh battery. It is necessary to remark, however,
 that DC supply of a Tier 4 household can, due to the limited availability of
 DC devices, not power electricity-intensive Tier 4 appliances like fridges,
 rice cookers and water pumps. Therefore, although access to basic
 appliances is ensured, a large share of demand in kWh remains
 unsupplied (76%).

Table 5. Optimized systems and their performance—Tier 2.

 Nr Topology Demand Reliability LCOE Annuity EESC PV Battery
 % demand €ct/kWh €/a €/a Wp Wh
 1 Sole main grid AC 74.8 5 5.4 7.2 0 0
 2 Backup diesel AC 100 17.5 25.1 25.1 0 0
 3 Backup battery AC 100 32.3 46.4 46.4 0 369
 4a Backup SHS AC 100 26.9 38.6 38.6 70 216
 4b Backup SHS AC + DC 100 17.3 20.9 20.9 11 101
 5a Off-grid SHS AC 100 52.4 75.3 75.3 259 596
 5b Off-grid SHS DC 100 41.4 22.5 22.5 100 198

Table 6. Optimized systems and their performance—Tier 4.

 Nr Topology Demand Reliability LCOE Annuity EESC PV Battery
 % demand €ct/kWh €/a €/a Wp Wh
 1 Sole main grid AC 72.1 8.7 89.9 124.7 0 0
 2 Backup diesel AC 100 18.8 270.6 270.6 0 0
 3 Backup battery AC 100 29.2 420.5 420.5 0 2612
 4a Backup SHS AC 100 24.3 350.4 350.4 283 1995
 4b Backup SHS AC + DC 75.7 11.2 121.6 160.6 38 241
 5a Off-grid SHS AC 100 41.3 595.9 595.9 2296 4470
 5b Off-grid SHS DC 31 37.1 57.9 186.5 309 451

 Annuity and Effective Electricity Supply Costs (EESC)

 The system LCOE is a relative value based on the specific costs and
 electricity consumption in kWh per customer. This comparison can
 confound us if systems provide the same electricity service levels, i.e.,
 power the same types of appliances, at different kWh consumption levels.
 This is especially important when comparing AC and DC systems. In
 contrast, an estimation of the annual costs of delivering electricity services,
 i.e., the system’s annuity, can ease communication and comparison of
 systems.
 Based on their annuity, sole main grid supply continues to be by far the
 most cost-competitive option, resulting in annual electricity expenditures
 of 5 €/a (Tier 2) and the second best for Tier 4 at 90 €/a respectively. A
 backup SHS supplying DC in times of blackout (4b) is the best reliable

J Sustain Res. 2020;2(1):e200009. https://doi.org/10.20900/jsr20200009
Journal of Sustainability Research 15 of 26

 option to ensure Tier 2 level of energy services, resulting in 21 €/a supply
 costs for a Tier 2 household and the backup diesel is the best reliable
 option for Tier 4. Off-grid SHS DC supply increases in importance and
 outruns a diesel backup system for Tier 2 households. For Tier 4
 households, its annuity is significantly the lowest, while their electricity
 services provided would not satisfy the household’s initial demand. The
 backup battery performs worse when comparing the annual electricity
 expenditures and not the LCOE.
 With blackouts occurring in the national grid and DC systems not
 properly supplying Tier 4 appliances, the different scenario’s annuities are
 not necessarily comparable. Therefore, the EESC is calculated, including
 the reliability of a supply system. The ranking of options is displayed in
 Figure 6. Looking at reliability adjusted annuity costs, the sole grid supply
 is the best solution at 7 €/a for Tier 2 and at 125 €/a for Tier 4 customers. In
 the Tier 4 case the advantages of DC based backup solutions are reduced
 by the EESC, as they are not 100% reliable as well.

 (A) (B)

 Off-grid SHS, AC Off-grid SHS, AC
 Backup battery, AC Backup battery, AC
 Backup SHS, AC Backup SHS, AC
 Backup diesel, AC Backup diesel, AC
 Off-grid SHS, DC Off-grid SHS, DC
 Backup SHS, AC+DC Backup SHS, AC+DC
 Sole main grid, AC Sole main grid, AC
 0 20 40 60 80 0 200 400 600
 EESC in €/a EESC in €/a

Figure 6. EESC ranking of (A) Tier 2 supply solutions (B) Tier 4 supply solutions.

 DISCUSSION AND CONCLUSION

 This study presented and evaluated the potential of multiple supply
 configurations, with special focus on solar home systems (SHS), to meet
 the reliability issues of the Nepalese national grid in the municipality of
 Gauriganj from a bottom-up perspective. We used real-time grid reliability
 measurements to emulate blackout occurrences and survey data to define
 the two representative household electricity demand profiles. According
 to the used appliances and the energy consumption, these two households
 can be categorized as Tier 2 and Tier 4 consumers according to the multi-
 tier framework for measuring electricity access. The demand profiles were
 used to evaluate possible backup supply scenarios improving electricity
 supply reliability.
 While the status-quo sole national grid supply is by far the cheapest
 option for electricity supply in terms of LCOE, it does not provide reliable
 supply for rural households and leaves about a quarter of the intended
 demand unsupplied. Off-grid SHS cannot compete on cost because the
 electricity from the grid is cheap and the analysis does not consider the

J Sustain Res. 2020;2(1):e200009. https://doi.org/10.20900/jsr20200009
Journal of Sustainability Research 16 of 26

 capital cost of grid extension. To improve supply reliability from the
 bottom-up, consumers can acquire backup systems to bridge blackout
 times. As the backup solutions consider both AC and DC supply during
 blackout times, their LCOE relative to the energy demand in kilowatt-
 hours is not well-comparable. Additionally, the LCOE can be less intuitive
 than communicating the annual electricity supply costs, i.e., the system
 annuity. To consider the supply reliability of a solution as well, the
 Effective Electricity Supply Costs (EESC) are introduced.
 Installing a backup battery, as it is common practice, helps to ensure
 reliability but is comparably expensive in terms of LCOE and annual
 expenditures, with annual costs of 46 €/a (Tier 2) and 420 €/a (Tier 4). A
 backup diesel generator outperforms a backup SHS supplying AC demand
 with an EESC of 25 €/a (Tier 2) and 271 €/a (Tier 4), while the SHS supplying
 AC electricity has an EESC of 39 €/a (Tier 2) and 350 €/a (Tier 4). A backup
 SHS supplying a secondary DC electricity circuit and only covering Tier 2
 services is the cheapest supply option for both Tier 2 and Tier 4 households.
 With an SHS consisting of a 10 Wp PV panel and 100 Wh battery, a Tier 2
 household can ensure supply of all currently unmet energy demand at 21
 €/a. If the Tier 4 household accepts not using the fridge, water pump and
 rice cooker at blackout times, it can power basic Tier 2 appliances during
 blackout times using an SHS with a 40 Wp PV panel and a 240 Wh battery
 at an EESC of 161 €/a. All scenarios considering batteries could profit
 strongly from potential improvements and cost decreases of lithium-ion
 batteries in the near future [45,46].
 By including the reliability, the EESC increases the annual costs of the
 sole main grid as well as the annual costs of the off-grid SHS with DC
 supply of a Tier 4 household substantially. Thus, the relative differences
 change comparing the unreliable grid with other, 100% reliable, options:
 For Tier 2 customers, the LCOE of a 100% reliable DC off-grid SHS is eight
 times higher than the national grid’s LCOE. Its annuity, in comparison, is
 only four times higher, while the EESC is only three times higher than the
 cost of national grid supply. This underlines the importance of the right
 formula to fairly compare different energy supply options considering
 different service levels, AC and DC differences, and different reliabilities.
 Taking the EESC for comparative purposes, the sole main grid supply is the
 cost optimal solution for both Tier 2 and Tier 4 customers. If households
 would weight reliability with higher value than we did in the EESC
 equation, the 100% reliable backup or off-grid options would become
 more attractive. As this parameter enables an assessment of annual
 electricity costs while taking into account reliability issues, it should be
 further developed in future studies.
 Our study has shown the associated costs of bottom-up approaches to
 bridge the reliability gap of the central system via diesel generators, SHS
 or backup batteries. Compared to the electricity tariff of the national grid,
 however, the costs of reliable supply with decentralized renewable
 technologies might outweigh the perceived benefit for some consumers.

J Sustain Res. 2020;2(1):e200009. https://doi.org/10.20900/jsr20200009
Journal of Sustainability Research 17 of 26

 Longer-term financing schemes for SHS could make these more cost-
 competitive and reduce economic barriers hindering consumers from self-
 reliantly improving their supply. This will most certainly require the
 support of policies incentivizing investment in decentralized renewable
 energy technology distribution and market development. Examples from
 neighboring Bangladesh include the development of technical standards
 and quality requirements linked to results-based-finance for technology
 providers.
 The challenge of unreliable grid supply is common across many
 developing economies. While our study focusses on a specific municipality
 in rural Nepal, it highlights the potential for decentralized renewable
 energy supply as a complementary solution to the central grid-based
 supply in other country contexts with similar challenges. Encouraging
 bottom-up investment in decentralized renewable energy technologies to
 satisfy growing energy demand is linked to development outcomes beyond
 SDG7 [47,48]. For example, the development of a renewable energy private
 sector can bring investment and employment into rural areas and
 increase the local accountability of public utilities by providing the
 population with a viable alternative. Furthermore, although we do not
 consider rural enterprise energy needs, the motivation and direct
 economic returns of improving supply for enterprises using decentralized
 renewable energy supply technologies may well outweigh those for rural
 households. Reliable electricity supply is crucial for many businesses
 which would often use expensive and polluting backup generators.
 Moving beyond the on/off-grid dichotomy is necessary to take advantage
 of technological innovation and deliver added value complimenting
 governmental electrification plans. Our contribution describes a first
 techno-economic analysis of integrating SHS to reach higher tiers of
 electrification and close in on SDG7 faster than waiting on national grid
 expansion alone.

 APPENDICES

 Main Objective Function

 The the optimization of the supply scenarios can be described as a
 minimization problem based on a linear equation system. Offgridders
 automatizes the parameterization of this linear equations system and
 generates it using the python library oemof. The optimal solution is
 determined using the cbc solver, resulting in optimal capacities of the
 optimized assets as well as their optimal dispatch. The equations
 describing the optimization problem are presented below.
 The objective value that is to be minimized are the annual electricity
 supply costs A:
 (7)
 min = � · + � � , · ( )

 With Capacity of asset i [kW, kWh, kWp]

J Sustain Res. 2020;2(1):e200009. https://doi.org/10.20900/jsr20200009
Journal of Sustainability Research 18 of 26

 ( ) Dispatch of asset i in time step t [kWh]
 All of the system’s assets
 Time steps of hourly duration, for simulation period of
 one year

 For each optimization asset i, both capacity and dispatch in each time
 step are optimization variables which have a limited solution space:

 ≥ 0 (8)
 ( ) ≥ 0 (9)

 Considered Assets

 The considered assets i for this case study are listed below:

 PV panels [kWp]
 Diesel generator [kW]
 Battery storage system, capacity [kWh] and charge/discharge
 power [kW]
 Inverter (DC/AC), [kW]
 Rectifier (AC/DC), [kW]
 Connection to national grid [kW]

 Supply through those assets can have both specific capital and
 operational costs:

 Specific annual costs per installed unit, including investment and
 fix operation and management costs [€/kWh/a, €/kWp/a, €/kW/a]
 Variable operational costs or expenditure, here only electricity
 [€/kWh] and fuel price [€/L]

 Annual Cost Function

 The specific annual costs are calculated in a pre-processing step within
 Offgridders, and include both replacement as well as operation and
 management costs over the whole project lifetime T and the residual value
 of the asset after project end.
 n (10)

 = � + � − , � ∗ (T) +
 (1 + ) ∗
 n=1

 ⋅ (1 + ) (11)
 (t) =
 (1 + ) − 1

 With Specific investment costs [€/unit]
 Number of replacements of an asset within project
 duration
 Asset lifetime [a]
 ( ) Capital recovery factor for year
 Specific residual value of an asset at end of project
 lifetime [€/unit]

J Sustain Res. 2020;2(1):e200009. https://doi.org/10.20900/jsr20200009
Journal of Sustainability Research 19 of 26

 Annual specific operation and management costs
 [€/unit/a]
 Discount factor
 Project duration [a]

 The number of replacements is calculated with:
 (12)
 = � + 0.5� − 1

 The residual value of the asset after project end is calculated and later
 on deducted from the investment costs over the project lifetime. It
 considers linear depreciation of the investment value.
 ⋅ − (13)
 = ⋅
 (1 + ) ∗

 Dispatch Function

 The assets have to be dispatched in a way that both AC and DC
 electricity bus are balanced in each time step:

 ( ) + ( ) ⋅ + ( ) + ℎ ( ) − (14)
 ( ) − ( ) = , ( ) ∀

 ( ) + , ( ) ⋅ + ( ) ⋅ + ℎ ( ) − (15)
 ( ) − , ( ) − ( ) = , ( ) ∀

 With Energy flow from asset i [kWh]
 , Energy demand, AC [kWh]
 , Energy demand, DC [kWh]
 ℎ Energy flow from symbolic source to balance out
 supply shortage [kWh]
 Energy flow into symbolic sink to balance out excess
 generation [kWh]
 , Energy flow from battery, i.e., battery discharge after
 discharge losses [kWh]
 , Energy flow into battery, i.e., battery charge before
 charge losses [kWh]
 Conversion efficiency

 As PV generation is not dispatchable, it is determined by the optimized
 capacity of the PV system and not a decision variable:

 ( ) = ⋅ ( ) (16)

 With Specific PV generation per installed capacity PV [kWh/kWp]

 Battery Model

 The electricity that can be stored in the battery is limited with a
 minimal and maximal storage level:

 , ℎ ⋅ ≤ , ( ) ≤ , ℎ ⋅ ∀ (17)

J Sustain Res. 2020;2(1):e200009. https://doi.org/10.20900/jsr20200009
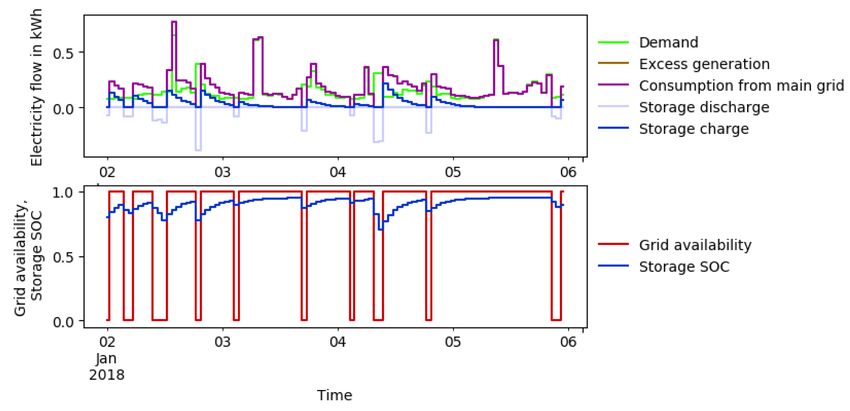
Journal of Sustainability Research 20 of 26

 The electricity stored in the battery changes with battery charge and
 discharge as well as self-discharge losses:

 , ( ) = , ( − 1) · (1 − ) + · , ( ) (18)
 , ( )
 −

 With Self-discharge losses of the battery per time step
 Battery charge efficiency
 Battery discharge efficiency

 Charge as well as discharge of the battery are limited with a C-rate and
 the optimized charge and discharge power of the battery. Note that, for the
 case study, battery power is not connected to any costs.

 , ( ) ≤ , ℎ ⋅ ∧ , ( ) ≤ , , ∀ (19)

 , ( ) ≤ , ℎ ⋅ ∧ , ( ) ≤ , , ∀ (20)

 The electricity stored in the battery in the first and last time step are
 defined to be equal:

 , (0) = , ( ) (21)

 Constraints Specific to the Presented Case Study

 Blackouts

 Due to blackouts, consumption from the national grid through the
 transformer station is limited to its hours of availability. This constraint
 has to be added for all scenarios that include a connection to the national
 grid, i.e., Scenarios 1 to 4.

 ( ) ≤ ⋅ ( ) (22)

 With Timeseries of national grid availability, with 1 indicating
 availability and 0 indicating a blackout.

 Backup supply from battery and PV system

 For Scenario 3, which includes a backup battery, and Scenario 4, which
 additionally includes a PV panel, a constraint is added to ensure that AC
 electricity demand is only met by battery discharge or PV generation when
 the national grid experiences a blackout. This is ensured by prohibiting an
 energy flow through the inverter when the grid is available.

 ( ) ≤ ⋅ �1 − ( )� (23)

 Forced battery charge

 In Scenario 3, the battery is charged from the national grid to provide
 backup supply at blackout times. To circumvent the effect of perfect
 foresight, a constraint is introduced to force battery charge. As such, in
 reality, the battery should charge as much as possible in each time step.
 The enforced battery charge would be a step-wise defined function:

J Sustain Res. 2020;2(1):e200009. https://doi.org/10.20900/jsr20200009
Journal of Sustainability Research 21 of 26

 ( ( )) = ∀ [ , 1 − ] (24)

 ( ( )) = , ℎ ⋅ ( − ( )) ∀ [1 − (25)
 , ]

 To introduce this operational constraint to the oemof model, this
 problem has to be linearized. For this, following two boundaries are
 defined:

 � , ℎ ⋅ � = ⋅ , ℎ (26)

 � , ℎ ⋅ � = 0 (27)

 Resulting in following linearization of forced battery charge:

 � , ℎ , , ( ) � (28)

 =
 −
 ⋅ � ⋅ , ℎ − , ( )�

 The full constraint therefore reads as follows:

 , ℎ ( ) ≥ ( ) ⋅ � , ℎ , , ( )� ∀ (29)

 After optimization, the constraint’s effect on the battery’s charging
 behaviour was validated (see Figure A1).

Figure A1. Effect of criterion introducing forced battery charge (Scenario 3, T4 household with AC demand).

 DATA AVAILABILITY

 The simulation tool Offgridders is available online [22]. Requests
 regarding the voltage measurement data as well as household survey data
 set can be forwarded to Setu Pelz.

J Sustain Res. 2020;2(1):e200009. https://doi.org/10.20900/jsr20200009
Journal of Sustainability Research 22 of 26

 AUTHOR CONTRIBUTIONS

 The study was designed by MH and SP. MH developed the simulation
 tool Offgridders, conducted all simulation and scenario analysis, provided
 the overarching structure and posed as the editor/corresponding author
 of the study. SP developed the initial concept, and provided the survey data,
 grid voltage measurement data, evaluation and discussion. ÒM-P
 developed the stochastic load modelling function together with SP, and
 simulated, evaluated and described the households’ electricity demands.
 MA wrote most of the introduction and the section describing the
 household surveys. PB worked with the authors on the scenarios
 definition, contextualization and discussion of the respective sections.

 CONFLICTS OF INTEREST

 The authors declare that there is no conflict of interest.

 FUNDING

 The household survey was funded by GIZ Nepal under the RERA
 program in collaboration with the Alternative Energy Promotion Centre
 (AEPC). We thank the Reiner Lemoine Foundation (RLS) for providing Setu
 Pelz with a PhD scholarship, during which the household survey was
 designed and implemented and grid availability data was collected.

 ACKNOWLEDGMENTS

 The subject of this paper was first presented under the title
 “Overcoming the bottleneck of weak grids: Reaching higher tiers of
 electrification with Solar Home Systems for increased supply reliability”
 at the international conference “Energising the SDGs through appropriate
 technology and governance”, organized by the Institute of Energy and
 Sustainable Development, De Montfort University. The conference took
 place in Leicester, UK from 2019 Jul 4–5. We thank the organizers of the
 conference and all the participants for the opportunity to present and for
 the feedback helping us to improve the study.

 REFERENCES

 1. Barnes D, Khandker S, Samad H. Energy access, efficiency, and poverty: How
 many households are energy poor in Bangladesh? 2010 Jun. World Bank
 Policy Research Working Paper No. 5332. Available from:
 https://ssrn.com/abstract=1620783. Accessed 2019 Mar 15.
 2. Bazilian M, Nussbaumer P, Rogner H-H, Brew-Hammond A, Foster V, Pachauri
 S, et al. Energy access scenarios to 2030 for the power sector in sub-Saharan
 Africa. Util Policy. 2012;20(1):1-16. doi: 10.1016/j.jup.2011.11.002
 3. Aklin M, Bayer P, Harish SP, Urpelainen J. Economics of household technology
 adoption in developing countries: Evidence from solar technology adoption
 in rural India. Energy Econ. 2018;72:35-46. doi: 10.1016/j.eneco.2018.02.011

J Sustain Res. 2020;2(1):e200009. https://doi.org/10.20900/jsr20200009
Journal of Sustainability Research 23 of 26

 4. Shirley R, Lee C-J, Njoroge HN, Odera S, Mwanzia PK, Malo I, et al. Powering
 Jobs: The Employment Footprint of Decentralized Renewable Energy
 Technologies in Sub Saharan Africa. J Sustain Res. 2019;2(1):e200001.
 doi: 10.20900/jsr20200001
 5. United Nations. Transforming our world: The 2030 Agenda for Sustainable
 Development: Sustainable Development Knowledge Platform. New York (NY,
 US): United Nations; 2015. Available from:
 https://sustainabledevelopment.un.org/post2015/transformingourworld.
 Accessed 2019 Jan 12.
 6. IEA. Africa Energy Outlook. Paris (France): IEA; 2014. Available from:
 https://www.iea.org/reports/africa-energy-outlook-2014. Accessed 2018 Oct 3.
 7. IEA. World Energy Outlook 2018. Paris (France): IEA; 2018. Available from:
 https://www.iea.org/reports/world-energy-outlook-2018. Accessed 2018 Oct 3.
 8. Wiemann M, Rolland S, Glania G. Hybrid Mini-Grids for Rural Electrification.
 Lessons Learned. Brussels (Belgium): USAID and ARE; 2011. Available from:
 https://ruralelec.org/sites/default/files/hybrid_mini-grids_for_rural_electrification_
 2014.pdf. Accessed 2017 May 15.
 9. Murphy PM, Twaha S, Murphy IS. Analysis of the cost of reliable electricity: A
 new method for analyzing grid connected solar, diesel and hybrid distributed
 electricity systems considering an unreliable electric grid, with examples in
 Uganda. Energy. 2014;66:523-34. doi: 10.1016/j.energy.2014.01.020
 10. Azerefegn TM, Bhandari R, Ramayya AV. Techno-economic analysis of grid-
 integrated PV/wind systems for electricity reliability enhancement in
 Ethiopian industrial park. Sustain Cities Soc. 2020;53:101915.
 doi: 10.1016/j.scs.2019.101915
 11. Lee J, Callaway D. The cost of reliability in decentralized solar power systems
 in sub-Saharan Africa. Nat Energy. 2018;3:960-8. doi: 10.1038/s41560-018-
 0240-y
 12. Greacen C, Engel R, Quetchenbach T. A Guidebook on Grid Interconnection
 and Islanded Operation of Mini-Grid Power Systems Up to 200 kW. Berkeley
 (CA, US): Lawrence Berkeley National Laboratory; 2013. Report No.: LBNL–
 6224E, 1171616. doi: 10.2172/1171616
 13. IEA. Energy Access Outlook 2017. From Poverty to Prosperity. Paris (France):
 IEA; 2017. doi: 10.1787/9789264285569-en
 14. Blechinger P, Cader C, Bertheau P. Least-Cost Electrification Modeling and
 Planning. A Case Study for Five Nigerian Federal States. Proc IEEE.
 2019;107(9):1923-40. doi: 10.1109/jproc.2019.2924644
 15. Bhatia M, Angelou N. Beyond Connections: Energy Access Redefined.
 Washington, DC (US): World Bank; 2015. Report No.: 008/15. Available from:
 https://openknowledge.worldbank.org/handle/10986/24368. Accessed 2018
 Dec 15.
 16. Central Bureau of Statistics. National Population and Housing Census Report.
 Government of Nepal (Nepal): Government of Nepal, National Planning
 Commission Secretariat; 2011. Available from:
 https://unstats.un.org/unsd/demographic-social/census/documents/Nepal/
 Nepal-Census-2011-Vol1.pdf. Accessed 2019 Feb 15.

J Sustain Res. 2020;2(1):e200009. https://doi.org/10.20900/jsr20200009
Journal of Sustainability Research 24 of 26

 17. World Bank. The World Bank Data Available from:
 http://data.worldbank.org/indicator/NY.GDP.PCAP.PP.CD. Accessed 2019 Feb
 28.
 18. IEA. World Energy Outlook 2016. Paris (France): IEA; 2016. p. 684.
 doi: 10.1787/weo-2016-en
 19. World Bank. Enterprise Surveys. Available from:
 http://www.enterprisesurveys.org/data/exploretopics/infrastructure#south-asia.
 Accessed 2019 Jan 19.
 20. Asian Development Bank. Nepal Energy Sector Assessment, Strategy, and
 Roadmap. Manila (Philippines): ADB; 2017 Jul. doi: 10.22617/tcs178936-2
 21. Pelz S. Understanding household energy access and energy demand for
 bottom-up municipal energy planning in rural Nepal. Energy Sustain Dev.
 Forthcoming 2019.
 22. Hoffmann MM; Reiner Lemoine Institut (RLI). Offgridders github reprository.
 2019. Available from: https://github.com/smartie2076/offgridders. Accessed
 2019 Jul 1.
 23. Oemof Developer Group. Oemof—Open Energy Modelling Framework
 (V0.2.2). Zenodo. 2018. doi: 10.5281/zenodo.1302372
 24. Prayas Pune. Electricity Supply Monitoring Initiative. Available from:
 http://www.watchyourpower.org/. Accessed 2019 Feb 25.
 25. Signorell A. DescTools: Tools for Descriptive Statistics. 2019. Available from:
 https://cran.r-project.org/package=DescTools. Accessed 2019 Nov 28.
 26. Mandelli S, Merlo M, Colombo E. Novel procedure to formulate load profiles
 for off-grid rural areas. Energy Sustain Dev. 2016;31:130-42.
 doi: 10.1016/j.esd.2016.01.005
 27. Narayan N, Qin Z, Popovic-Gerber J, Diehl J-C, Bauer P, Zeman M. Stochastic
 load profile construction for the multi-tier framework for household
 electricity access using off-grid DC appliances. Energy Effic. 2018.
 doi: 10.1007/s12053-018-9725-6
 28. Sandwell P, Chambon C, Saraogi A, Chabenat A, Mazur M, Ekins-Daukes N, et
 al. Analysis of energy access and impact of modern energy sources in
 unelectrified villages in Uttar Pradesh. Energy Sustain Dev. 2016;35:67-79.
 doi: 10.1016/j.esd.2016.09.002
 29. Daft Logic. List of the Power Consumption of Typical Household Appliances.
 2017. Available from: https://www.daftlogic.com/information-appliance-
 power-consumption.htm. Accessed 2019 Sep 28.
 30. Garbesi K, Vossos V, Shen H. Catalog of DC Appliances and Power Systems.
 Berkeley (CA, US): Lawrence Berkeley National Laboratory; 2017.
 31. Kamran M, Bilal M, Mudassar M. DC Home Appliances for DC Distribution
 System. Mehran Univ Res J Eng Technol. 2017;36:881-90.
 doi: 10.22581/muet1982.1704.12
 32. Shivakumar A, Normark B, Welsch M. Household DC networks: State-of-the-
 art and future prospects. Rapid Response Energy Brief. Stockholm (Sweden):
 InsightE; 2015.
 33. Thumba AgroTechnologies. AC led bulbs 220 V. Palani (India): Thumba
 AgroTechnologies; 2014.

J Sustain Res. 2020;2(1):e200009. https://doi.org/10.20900/jsr20200009
Journal of Sustainability Research 25 of 26

 34. Vossos V, Pantano S, Heard R, Brown R. DC Appliances and DC Power
 Distribution: A bridge to the Future Net Zero Energy Homes. In: Proceedings
 of the 9th international conference on energy efficiency in domestic
 appliances and lighting (EEDAL '17); 2017 Sep 13–15; Irvine, CA, USA.
 Luxembourg (Luxembourg): Publications Office of the European Union; 2017.
 35. Boait P, Advani V, Gammon R. Estimation of demand diversity and daily
 demand profile for off-grid electrification in developing countries. Energy
 Sustain Dev. 2015;29:135-41. doi: 10.1016/j.esd.2015.10.009
 36. Hartvigsson E, Ahlgren EO. Comparison of load profiles in a mini-grid:
 Assessment of performance metrics using measured and interview-based
 data. Energy Sustain Dev. 2018;43:186-95. doi: 10.1016/j.esd.2018.01.009
 37. Blodgett C, Dauenhauer P, Louie H, Kickham L. Accuracy of energy-use
 surveys in predicting rural mini-grid user consumption. Energy Sustain Dev.
 2017;41:88-105. doi: 10.1016/j.esd.2017.08.002
 38. Hoffmann MM. Optimizing the Design of Off-Grid Micro Grids Facing
 Interconnection with an Unreliable Central Grid Utilizing an Open-Source
 Simulation Tool. Berlin (Germany): Technische Universität Berlin; 2019.
 39. Hilpert S, Kaldemeyer C, Krien U, Günther S, Wingenbach C, Plessmann G. The
 Open Energy Modelling Framework (oemof)—A new approach to facilitate
 open science in energy system modelling. Energy Strategy Rev. 2018;22:16-25.
 doi: 10.1016/j.esr.2018.07.001
 40. Pleßmann G, Blechinger P. How to meet EU GHG emission reduction targets?
 A model based decarbonization pathway for Europe’s electricity supply
 system until 2050. Energy Strategy Rev. 2017;15:19-32.
 doi: 10.1016/j.esr.2016.11.003
 41. Bertheau P, Blechinger P. Resilient solar energy island supply to support SDG7
 on the Philippines: Techno-economic optimized electrification strategy for
 small islands. Util Policy. 2018;54:55-77. doi: 10.1016/j.jup.2018.07.005
 42. Renewables.ninja. 2019. Available from: https://www.renewables.ninja/.
 Accessed 2019 Feb 28.
 43. Asian Development Bank. Sustainable energy access planning. A case study.
 Manila (Philippines): ADB; 2018. doi: 10.22617/TCS189194
 44. Nepal Energy Forum. NEA Electricity tariff rates. 2017. Available from:
 http://www.nepalenergyforum.com/nea-electricity-tariff-rates/. Accessed
 2019 Mar 21.
 45. Kittner N, Lill F, Kammen DM. Energy storage deployment and innovation for
 the clean energy transition. Nat Energy. 2017;2(9):17125.
 doi: 10.1038/nenergy.2017.125
 46. de Sisternes FJ, Worley H, Mueller S, Jenkin T. Scaling-up Sustainable Energy
 Storage in Developing Countries. J Sustain Res. 2019;2(1):e200002.
 doi: 10.20900/jsr20200002
 47. Riva F, Ahlborg H, Pachauri S, Colombo E. Electricity access and rural
 development: Review of complex socio-economic dynamics and causal
 diagrams for more appropriate energy modelling. Energy Sustain Dev.
 2018;43:203-23.

J Sustain Res. 2020;2(1):e200009. https://doi.org/10.20900/jsr20200009
You can also read