Solutions to Marine Pollution in Canary Islands' Ports: Alternatives and Optimization of Energy Management
←
→
Page content transcription
If your browser does not render page correctly, please read the page content below
resources
Article
Solutions to Marine Pollution in Canary Islands’
Ports: Alternatives and Optimization of
Energy Management
Manuel Uche-Soria           and Carlos Rodríguez-Monroy *
 Department of Industrial Organization, Business Administration and Statistics,
 Technical University of Madrid c/ José Gutiérrez Abascal, 2, 28006 Madrid, Spain; m.uche@alumnos.upm.es
 * Correspondence: crmonroy@etsii.upm.es; Tel.: +34-91-3364265; Fax: +34-91-3363005

 Received: 18 March 2019; Accepted: 29 March 2019; Published: 2 April 2019

 Abstract: The study of waste generated in ports is a vitally important issue to reduce marine pollution
 and improve port management systems. In this article, the authors study the management of solid
 waste generated in the ports of the Canary Islands. For this purpose, a waste management model
 based on the circular economy is developed. With this model, it is possible to reduce pollution in
 the port areas of the capital’s islands, increase the fraction of recycled waste and obtain additional
 energy for the ports. The interest of this study lies in the singularities of these islands with respect
 to the geographic limitations that make them weak energy environments. The proposed solution
 to solve the current problems and achieve a zone of zero waste (throughout the port of Santa Cruz
 and its industrial estate) has two main phases: the first, in which solid waste is processed and a
 part is recycled, and the second, which consists of recovering the energy of the converted fuels.
 The advantages of the application of this model are that CO2 emissions are reduced, energy savings
 are realized, waste management is improved in these environments (the recycling fraction is increased
 considerably), and new jobs are created. This model also contributes to the development of the
 Special Territorial Plan for Waste Management of the Canary Islands, in accordance with the policies
 of the European Union required for the coming years.

 Keywords: marine environment; MARPOL; isolated electricity system; circular economy; shipping
 and environment

1. Introduction

1.1. Motivation
     When analyzing the evolution of the principal energy magnitudes in electrically isolated
environments, as in the Canary Islands’ isolated electricity system (IES), it is remarkable that internal
production contributes only a tiny fraction of the primary energy. This amount refers to the total
contribution of all the main types of renewable energy available in the archipelago (wind, photovoltaic
solar, solar thermal, hydro-wind, mini-hydro, and landfill biogas). In comparison to the Spanish
mainland, the lack of major hydroelectric facilities (except for the recent start-up of a new hydro-wind
installation called “Aprovechamiento Hidroeólico de El Hierro”) limits the participation of renewable
energies. Their contribution remains low, especially when compared to other more advanced energy
generation systems around Europe.
     The total participation of these renewable energies has been stable for years [1]. This is
partly influenced by the weather conditions, which change so easily in islands with such abundant
micro-climates. Specifically, in the last year for which the Canary Islands’ Government has given

Resources 2019, 8, 59; doi:10.3390/resources8020059                          www.mdpi.com/journal/resources
Resources 2019, 8, 59                                                                                        2 of 17

official data (see Table 1), the total primary energy barely reached 1.40%, with a trend approaching this
figure in previous years.

                    Table 1. Main energy magnitude statistics in the Canary Islands. Units: (Tep).

                     Internal        Inputs-                             Stock      Primary       Final
          Year                                        Bunkers
                    Production       Outputs                            Change      Energy       Energy
          2012          60,785       6,982,391      (−) 2,416,715     204,654      4,831,116     3,349,622
          2013          63,959       7,070,635      (−) 2,354,418      50,882      4,831,059     3,341,420
          2014          66,397       6,395,707      (−) 1,977,770      77,740      4,562,073     3,366,465
          2015          67,372       7,127,494      (−) 2,392,608   (−) 271,968    4,530,291     3,358,818
          2016          68,189       7,015,082      (−) 2,452,172      97,837      4,728,936     3,504,302
          2017          70,491       7,321,567      (−) 2,321,567      15,489      4,900,683     3,634,526
                                                 Annual Variation (%)
         17/16           3.38           4.37            2.23              -           3.63           3.72

      In fact, petroleum derivatives supplied to final users absorb the majority of the final energy
demand, reaching 80.02% of the total in 2017. The remaining 19.98% is split into electricity (19.75%)
and solar thermal power (0.23%). The details of the Canary Islands energy system structure and its
development regarding factors like supply security (reliability), the restricted spread of self-supplied
energy, the share of renewable energies in the regional mix, energy efficiency and savings can be seen
in this simplified diagram of the energy balance of the Canary Islands.
      Studying Figure 1, elaborated with the latest data from the Government of the Canary Islands [1],
some interesting aspects should be pointed out. On the one hand, according to [2–6], there is a need to
plan and join forces to develop and implement new energy generation systems. These should achieve
lower costs for these isolated systems and in turn resolve issues arising from the local peculiarities.
For this, a strategic energy plan covering isolated territories like the Balearic Islands and the Canaries
is needed, that does not only focus on the context of the Spanish mainland. This must be translated
into new actions like improvements in the existing specific regulations, making reasonable electricity
charges possible [7–9] in isolated environments. On the other hand, taking studies like [10] and [11] as
references in the context of an archipelago like the Canary Islands, this strong reliance on crude-oil
based energy supplies readily brings to mind interactions between the maritime operations in these
docks and the environment. Indeed, the Canaries have a substantial sea traffic density in relation to
their population. This leads to considering the possibility of channeling the residues generated by
maritime traffic towards a mode of electrical energy production that is able to fulfill some of the needs
of the port.
      In this article, ship-generated waste refers to all waste, including waste-water (for example,
bilges), and non-loading wastes produced during ship operation. This includes those derived from
fishing boats, leisure craft, and cargo wastes. In the Canary Islands’ ports, the main wastes are
generated by cargo, machinery, and maintenance, as well as by passengers and crew. This leads to
environmental consequences viewable from different perspectives according to their three general
categories: hydrocarbon, organic, and floating litter.
      The effects of hydrocarbons are many and varied; in particular, they lower the penetration of
sunlight into the water, affecting different living organisms (most visibly in birds’ feathers, fish gills,
and sea-bottom communities). They release other toxic substances to the ecosystem, affect ship and
dock infrastructures, and finally, damage the public image of maritime transport and docks in general.
Organic matter in excess can have similar consequences on the marine ecosystem, besides others
like raising primary production and the oxygen usage rate, anoxia (oxygen debt) and other effects
on the dissolved oxygen. Floating litter is no less harmful. It has been estimated that 6,400,000 m3
is thrown into the sea annually from vessels. The waste input from land into the sea is estimated at
700,000 kg/day, and up to 30 floating objects/km2 have been counted by observation from ships. Other
Resources 2019, 8, 59                                                                                                 3 of 17

calculations estimate 150 times more plastics in marine depths than floating. In addition, 1000 items
perResources
     linear 2019,
             meter   can be found floating on the Canary Islands’ beaches. A microscopic estimation
                  8, 59                                                                          3 ofputs
                                                                                                      18
the problem on a wider range: 8,000,000 per square km.

                        Figure 1. The energy balance of the Canary Islands (2017) (source: authors).
                        Figure 1. The energy balance of the Canary Islands (2017) (source: authors).
      Problems with managing general waste in the marine environment are nothing new. Figure 2
shows In thethis   article, ship-generated
               difference                       waste refers
                             between its management           in to all and
                                                                 land   waste,
                                                                             seaincluding    waste-water
                                                                                 environments,      which (for   example,
                                                                                                             provides  some
  bilges),    and   non-loading       wastes   produced     during    ship   operation.   This
idea of the great complexity of adapting such systems between these environments. This is even  includes    those  derived
                                                                                                                        more
sofrom    fishing
   in isolated      boats, like
                  systems    leisure   craft,where
                                  islands,    and cargo
                                                     wastewastes.
                                                            flows areIn much
                                                                         the Canary
                                                                               smaller,Islands’  ports,the
                                                                                          hampering      theimplementation
                                                                                                              main wastes
  are  generated
ofResources
   efficient 2019,     by cargo,
                   8, 59
               technological        machinery,
                                 solutions         and
                                              viable  onmaintenance,
                                                         a larger scale.as well as by passengers and crew.4 of         This
                                                                                                                         18
  leads to environmental consequences viewable from different perspectives according to their
  three general categories: hydrocarbon, organic, and floating litter.
         The effects of hydrocarbons are many and varied; in particular, they lower the penetration
  of sunlight into the water, affecting different living organisms (most visibly in birds’ feathers, fish
  gills, and sea-bottom communities). They release other toxic substances to the ecosystem, affect
  ship and dock infrastructures, and finally, damage the public image of maritime transport and
  docks in general. Organic matter in excess can have similar consequences on the marine
  ecosystem, besides others like raising primary production and the oxygen usage rate, anoxia
  (oxygen debt) and other effects on the dissolved oxygen. Floating litter is no less harmful. It has
  been estimated that 6,400,000 m3 is thrown into the sea annually from vessels. The waste input
  from land into the sea is estimated at 700,000 kg/day, and up to 30 floating objects/km2 have been
  counted by observation           Differences
                        Figure 2. Differences
                                   from   ships.between                   estimatewaste
                                                          marine and terrestrial
                                                 Other calculations                        management.
                                                                                    150 times   more plastics in marine
  depths than floating. In addition, 1000 items per linear meter can be found floating on the Canary
      That
        Thatbeing
                beingsaid,
                         said,other
                                other common
                                        common marine         waste-management issues
                                                   marine waste-management              issuesmust
                                                                                                mustbebeborne
                                                                                                            borneinin  mind.
                                                                                                                     mind.
  Islands’ beaches. A microscopic estimation puts the problem on a wider range: 8,000,000 per
Firstly,
  Firstly,wastes
            wastesand  andtheir
                             theirquantities
                                    quantitiesareare heterogeneous,
                                                      heterogeneous, and   and mixes
                                                                                mixes of ofdifferent
                                                                                            differentkinds
                                                                                                       kindsofofwaste
                                                                                                                  wasteareare
  square km.
common,       making      them   more    difficult  to manage      (MARPOL       I with   rags,
  common, making them more difficult to manage (MARPOL I with rags, glass, ceramics, plastics,   glass, ceramics,    plastics,
         Problems with managing general waste in the marine environment are nothing new. Figure
wood,
  wood,  metals,
            metals,paper
                       paperandandcardboard).
                                     cardboard). Secondly,       there are
                                                    Secondly, there      are marine
                                                                              marinevessel
                                                                                       vesselwastes
                                                                                               wastesnotnotconsidered
                                                                                                              considered asas
  2 shows the difference between its management in land and sea environments, which provides
such,
  such,e.g.,  pyrotechnical
           e.g.,   pyrotechnical waste—fireworks/flares,
                                       waste—fireworks/flares,   vegetables   oils, bilge
                                                                        vegetables    oils,orbilge
                                                                                              other or
                                                                                                     polluting   substances,
                                                                                                         other polluting
  some idea of the great complexity of adapting such systems between these environments. This is
and  other   refuse    not  considered    MARPOL       (e.g., materials    such as discarded
  substances, and other refuse not considered MARPOL (e.g., materials such as discarded electricelectric  batteries, remains
  even more so in isolated systems like islands, where waste flows are much smaller, hampering
  batteries, remains of material from maintenance work carried out on board or cargo and fishing
  the implementation of efficient technological solutions viable on a larger scale.
  waste). Lastly, ship waste requiring specific management can be mishandled, which combined
  with inappropriate reception methods for small vessels often make management systems difficult
  to implement.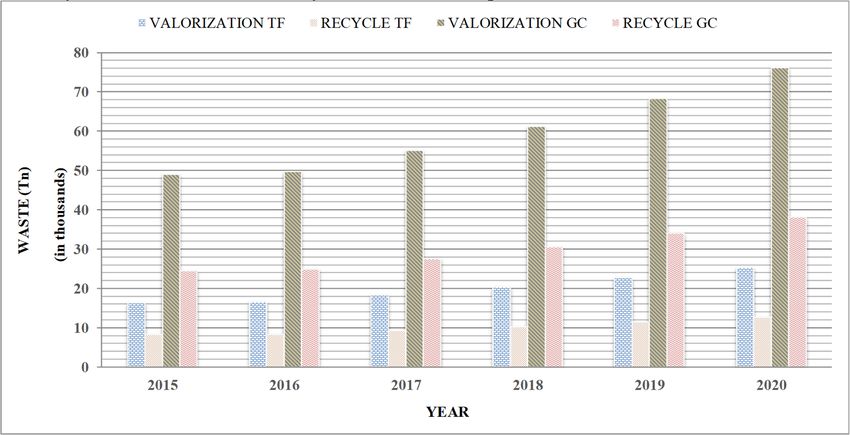
Resources 2019, 8, 59                                                                                    4 of 17

of material from maintenance work carried out on board or cargo and fishing waste). Lastly, ship waste
requiring specific management can be mishandled, which combined with inappropriate reception
methods for small vessels often make management systems difficult to implement.

1.2. Literature Review
     The existing literature on marine pollution in a broad sense is varied and abundant. However,
when the object of study is limited to the waste management systems of the ports, there are not so many
existing references. Di Vaio et al. [12] conducted a study on management control systems (MCS) to
support decision-making by the Port Authority and prevent negative environmental effects in maritime
ports. These authors focus their work on the management of information and on the relationship of
the different actors for a specific case in Italy, and they emphasize that there is still no MCS that is
focused on waste. These same authors indicate in [13] that the current regulations do not specifically
provide port operators with help on what effective management tools they can adopt to guarantee
environmental protection. On this idea, they develop a proposal of conceptual management in favor of
the environmental sustainability of the maritime ports. However, it is true that this proposal, being
purely conceptual, lacks practical validation. Also, applied in the case of Nigerian ports, in [14] an
integrated model is suggested to reinforce the weak administrative framework of control over marine
pollution in port environments. This weakness, as it happens in numerous ports of the world, is the
result of the subcontracting of waste management systems. It would be interesting to extrapolate the
study to other ports with similar characteristics.
     Concerning the existing literature there is a lack of research that evaluates the environmental
impact costs of the pollutants generated by routine shipping operations. CE Delft [15] indicates that
the external costs generated by transport are quantified for the countries of the European Union and
the idea of this study is to provide a guide that can contribute to the development of the EU transport
policy. Etkin [16] explains that the risk assessment of almost 52,000 oil spills which occurred in the
US inland waterways was carried out. The results of this study revealed that the greatest risk to
inland waterways is due to spills in the pipelines, particularly from crude oil pipelines. In this sense,
Camphuysen [17] observes that there is a shortage of long-term studies and easily available and
comparable information, which limits an understanding of the true impacts of hydrocarbon pollution
on marine wildlife. In addition, unfortunately, the available knowledge seems to play a very small role
in the orientation of the decision in the planning of the clean-up operations after the oil incidents or in
the planning of the aerial inspections of oil at sea. In this sense, a study carried out in Israel [18] analyzes
the different ways in which oil spills can affect natural ecosystems and socioeconomic resources along
the coast. In this study, it is concluded that, in general, the sensitivity of the Israeli Mediterranean
coast to oil spills could be considered moderate, in comparison with other fragile ecosystems. This is
mainly due to the morphology of sandy beaches and the high exposure of most types of beaches to
natural cleaning processes. Even so, along the south-eastern Mediterranean coast there are ecosystems,
habitats, types of coastlines and coastal resources that are sensitive to oil spills. On the other hand,
Gómez et al. [19] propose a procedure that combines rigorously selected parameters and indicators to
estimate environmental risk in national ports. In this way, port managers and local authorities can
hierarchically classify environmental hazards and proceed with the most appropriate management.
     From a more economic point of view, Liu and Wirtz [20] delved into the five main categories of
different costs after an oil spill and covered the gap from previous analyses by adding research costs.
What is clear is that the circumstances surrounding the response to an oil spill incident are complex
and unique [21], so predicting the costs of a spill is difficult and arduous.
     On the other hand, if attention is given only to what happens in ports, it is easy to see that there
are far fewer studies evaluating attractive alternatives and efficient energy management systems.
Moreno-Gutiérrez et al. [22] describe and compare various methods to calculate energy consumption
and emissions of ships. They also analyze various factors that affect the adequacy of each one and
suggest a new method, more adjusted to reality. In addition, the study presented by Kumar et al. [23]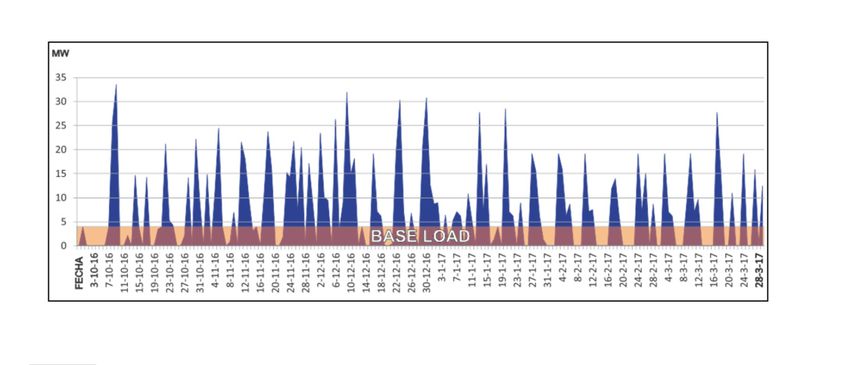
Resources 2019, 8, 59                                                                                                5 of 17

present a detailed review of the technical aspects, practices and existing standards in the modeling of
a port network for the supply of energy from land to ship. This document also mentions modeling
through smart grids to facilitate energy supply and the loading of ships’ batteries. Finally, Yigit and
Acarkan [24] suggest a new approach for the administration of electric power for vessels that use
mixed energy sources in ports, considering smart grids. In this study, combinations of photovoltaic
energy, wind turbines, energy storage, shore energy and four types of marine fuels were taken into
account. The results show that this approach will contribute to the development of concepts of smart
boats, green ports and sustainable cities.
      To study and propose alternatives for improvement in relation to the management of waste from
port environments, it is necessary to resort to the concept of the circular economy. There are many
texts that address this concept. Without a doubt, the concept of the circular economy has gained great
importance. In an analysis of this term, Kirchherr et al. [25] argued that this concept means many
different things for different people and environments. Something that seems common to all definitions
is that in order to define this concept, a combination of reduction, reuse and recycling activities are used.
On the other hand, the main objective of the circular economy is economic development, followed by
the care of environmental quality. On the other hand, Geissdoerfer et al. [26] conceptually relate the
circular economy and sustainability. The authors conclude that the circular economy is considered
a condition for sustainability, a beneficial relationship or an exchange in the literature. This can be
reduced to a different relationship. In addition, this relationship seems to be adequate in order to shed
light on the set of complementary strategies that managers and policymakers can adopt.
      Finally, delimiting one of the meanings of the circular economy concept to the port area,
Carpenter et al. [27] carry out an interesting study in the port of Gävle, Sweden, in which the
polluted dredging materials help create new land using the principles of the circular economy. It is
interesting how this document shows that the use of the principles associated with the concept of the
circular economy can be a viable way to ensure the future of the port and contribute to its sustainability
and, in addition, that of the city or region where it operates.
   Resources 2019, 8, 59
      The regulatory         framework is well-known, but it is convenient to distinguish here the                 6 ofthree
                                                                                                                         18
levels in which MARPOL wastes are classified (Figure 3). On an international level, there is the
1973   international
   protocol,   shortened convention
                              to “MARPOL to prevent
                                                73/78”.marine
                                                         The fivepollution  by ships,
                                                                    convention    annexesmodified
                                                                                             containbythe
                                                                                                       therules
                                                                                                            1978that
                                                                                                                  protocol,
                                                                                                                       are
shortened
   applicable to to
                 “MARPOL
                      the diverse 73/78”.  The of
                                      sources    five convention annexes
                                                    contamination     caused contain
                                                                                by ships.theThe
                                                                                             rules  that are applicable
                                                                                                  convention   was alsoto
the  diverse sources
   modified    by the 1997 of contamination
                                 protocol, which caused  by ships.
                                                     approved     theThe   convention
                                                                       sixth annex, butwas thisalso modified
                                                                                                 protocol  has by
                                                                                                                notthe  1997
                                                                                                                     been
protocol,
   ratifiedwhich     approvednumber
             by a sufficient       the sixthofannex,  but this
                                               countries   for itprotocol
                                                                  to comehas   not
                                                                            into    been Several
                                                                                 effect.  ratified by a sufficient
                                                                                                   revisions  havenumber
                                                                                                                     been
ofmade
    countries   for  it to come    into effect. Several   revisions   have  been   made   on  this
           on this regulation, such as the consolidated edition of 2002 [28]. Recently, several    regulation, such   as the
consolidated
   amendments to the International Convention for the Prevention of Pollution from Shipsthe
                 edition    of 2002  [28]. Recently,   several  amendments      to the International   Convention    for
Prevention
   (MARPOL)    of Pollution     from Ships
                  were introduced        and(MARPOL)
                                               entered intowere
                                                              forceintroduced
                                                                     last Marchand    entered into force last March [29].
                                                                                   [29].

                                 Figure 3. MARPOL wastes regulatory framework.

     AtAt
        thethe
            European    level,
                 European      the European
                            level,           Parliament
                                   the European          and Council’s
                                                   Parliament          2000/59/CE
                                                               and Council’s       Directive,
                                                                              2000/59/CE      27 November
                                                                                           Directive,    27
2000 [30], concerning   port installations receiving ship and cargo wastes set out a similar
  November 2000 [30], concerning port installations receiving ship and cargo wastes set out a set of internal
provisions
  similar setfor
               ofSpain  in Royal
                  internal        Decree
                           provisions  for1381/2002, 20 December,
                                           Spain in Royal           conforming
                                                           Decree 1381/2002,    the current conforming
                                                                             20 December,     national port
  the current national port regulations [31]. Each port in the country has peculiarities referring to
  wastes and planning legislation and these are summarized in their respective autonomous
  regulations. Bellas [32] describes the implementation process and discusses the institutional
  framework and the main difficulties and challenges encountered so far, in the marine strategy
  framework [33,34], with emphasis on the Spanish context.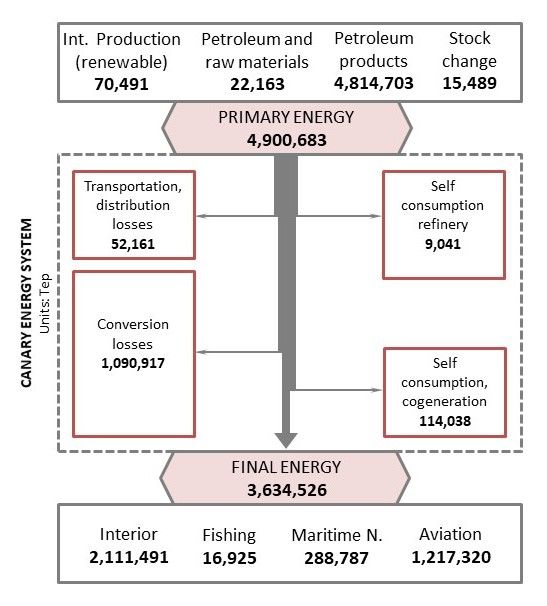
Resources 2019, 8, 59                                                                                   6 of 17

regulations [31]. Each port in the country has peculiarities referring to wastes and planning legislation
and these are summarized in their respective autonomous regulations. Bellas [32] describes the
implementation process and discusses the institutional framework and the main difficulties and
challenges encountered so far, in the marine strategy framework [33,34], with emphasis on the
Spanish context.

1.3. Main Contributions
       In this article, a review of the literature on marine pollution and its applicable regulations regarding
waste management is carried out. This review lacks the implementation of models that seek to optimize
waste management in port areas through a sustainable perspective.
       Therefore, the main contribution of this research is the proposal of a model to improve waste
management in the ports of the Canary Islands. This model is based on the concept of circular economy
and is based on the valorization of port waste in order to obtain energy. This achieves three objectives:
(i) it contributes to the conservation of the environment, (ii) it improves an aspect as relevant as the
integral management of waste, and (iii) it contributes to energy savings in isolated electrical systems.

1.4. Structure of the Article
     The article is structured as follows. Section 2 is called Materials and Methods and exposes, in
addition to the data and characterizations that have been used, the study model to improve waste
management in the port of Santa Cruz de Tenerife. In Section 3 the results of the proposed model are
shown. Section 4 corresponds to the discussion and explains the benefits and limitations of the applied
model. Finally, conclusions and some recommendations that may also be useful for future research are
presented in Section 5.

2. Materials and Methods

2.1. The Model
     The diagram in Figure 4 is proposed to explain the model and the steps of this study. The aim is
to meet the port’s demand (D) and particularly that of the cruises making a stopover there (C) through
energy generated from the collected waste (G1) by means of a gasification process. Any surplus could
be commercialized.
     The extra energy to cover peaks in cruise and other ship dockings would be provided by liquefied
natural gas (G2). This arrangement would certainly offer an optimal solution for the present waste
management needs, fulfilling the European standards regarding recycling, valorization, and elimination
of this waste. It could also lower the energy consumption of the archipelago, potentially lowering its
electricity costs.
     A model emerges that integrates solid waste management in the port environment with the
production of exploitable energy from this waste. Thus, its recyclable components can be sorted and
energy can be generated from otherwise valueless materials (cf. Table 2). In this way, an almost free
electricity generation source appears that can supply the main port demand if backed up by liquefied
natural gas transported via the virtual gas pipeline from the plant being installed at the new port in
Granadilla (southern Tenerife).
     Before continuing, it is important to explain Figure 4, since it shows the study procedure. Based on
the data obtained from the Port Authority, the waste to be treated must be quantified and characterized.
The quantities of waste classified under the Fifth MARPOL Convention annex and other associated
types collected from ships using the port, are clearly insufficient for electricity generation once valorized
as energy. For this reason, waste flows from companies operating in the port of Santa Cruz are also
included and studied here.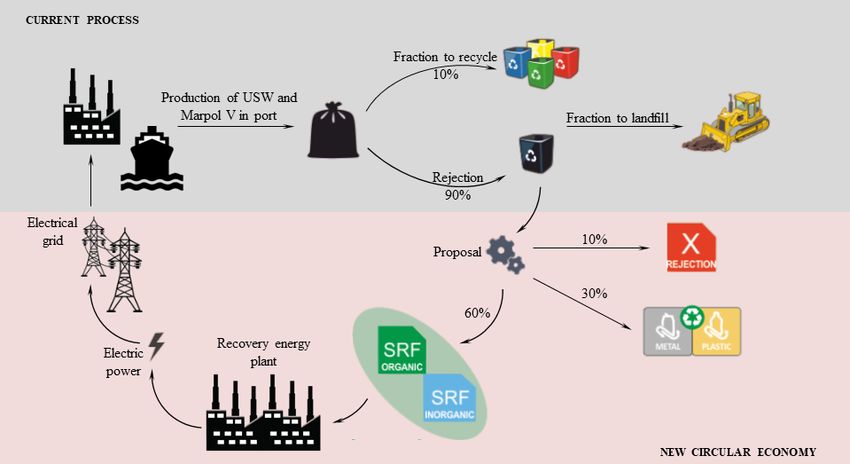
Resources 2019, 8, 59 7 of 18
The diagram in Figure 4 is proposed to explain the model and the steps of this study. The
aim is to meet the port’s demand (D) and particularly that of the cruises making a stopover there
Resources 2019, 8, 59
(C) through 7 of 17
energy generated from the collected waste (G1) by means of a gasification process.
Any surplus could be commercialized.
Figure 4. Proposed model of energy generation
Figure 4. generation from
from port
port waste.
waste.
Table 2. Annual estimate of Santa Cruz dock waste not included in the MARPOL Convention annexes
The extra energy to cover peaks in cruise and other ship dockings would be provided by
(Data provided by Canary Bionergy S.L.).
liquefied natural gas (G2). This arrangement would certainly offer an optimal solution for the
present waste management needs, fulfilling
Port of Santa Cruz dethe European
Tenerife 2015 (kg)standards regarding recycling,
valorization, and elimination Destination
Designation of Waste
of this waste. It could
Annualalso lower Totalthe energy Totalconsumption
Total Notof the
archipelago, potentially lowering its electricity costs. Estimate Recoverable Recyclable Useful
URBAN
A modelSOLID WASTE that integrates
emerges Valorization
solid waste 254,830.00
management 254,830.00 -
in the port environment - with the
PAPERBOARD Valorization 7858.00 7858.00 - -
production of exploitable energy
PAPERBOARD from this waste.
Recycling Thus, its recyclable
2040.00 - components
2040.00 can -be sorted
andPACKAGING-PLASTIC
energy can be generated from otherwise valueless
Recycling 1144.00 materials
- (cf. Table
1144.002). In this- way, an
WOOD Valorization 12,610.00 12,610.00
almost free electricity generation source appears that can supply the main port - demand- if backed
DEBRIS-LAND Environmental complex 67,238.00 - - 67,238.00
up by liquefied
ROAD natural gas
CLEANING transported
Environmental via the virtual
complex 64,700.00gas pipeline
- from the- plant being installed
64,700.00
at the new port
VEGETABLE PRUNING in Granadilla (southern
Valorization Tenerife).
10,500.00 10,500.00 - -
BeforeCABLES Valorizationto explain
continuing, it is important 11,220.00
Figure 4,11,220.00
since it shows -the study procedure.-
Based on TOTAL
the data obtained from the Port Authority, the waste 297,018.00 3184.00must 132,119.00
to be treated be quantified
and characterized. The quantities of waste classified under the Fifth MARPOL Convention annex
andTheother
refuse associated
processingtypes collected
plant’s from consist
input would ships of using the port, fractions:
the following are clearly insufficient
glass, for
rubber, rubble,
electricity generation once valorized as energy. For this reason, waste flows
disposable nappies and other cellulose, organic matter, paper and cardboard, plastic film, ferric and from companies
operating
non-ferric in the port
materials, of Santa
textiles, Cruz
wood, are also
other included
plastics, and and
batteries, studied here.
others. These fractions can be found
The refuse
in proportions processing
established plant’s
after input would
characterizing consist
samples of the following
collected over the recentfractions:
studyglass,
period.rubber,
These
rubble, disposable nappies and other cellulose, organic matter, paper and cardboard,
data aid in deciding the potential of separating each fraction, as well as the size of the plant needed. plastic film,
ferric
To and non-ferric
estimate materials,
the seasonal textiles,
nature of wood,
waste other
streams, plastics,
data batteries,
from the and Portothers. Thesehelp
Authority fractions
to see
can be found in proportions established after characterizing samples collected
the months in which there is more port traffic, that is, more waste reception and more electricity over the recent
study period.
consumption. Thesethe
Unlike data aid in deciding
Mediterranean theinpotential
coast, the Canary of separating
Islands the each fraction,
low season as wellwith
coincides as the the
size ofofthe
months May,plant
Juneneeded.
and August. In the other months, the island receives a large number of tourists,
To estimate
who temporarily the seasonal
escape from thenature
colderof waste streams, data from the Port Authority help to see
countries.
theInmonths
the case in of
which theremain
the two is more port
ports oftraffic, that is,Islands,
the Canary more wasteMARPOL reception
V data andcollected
more electricity
per year
consumption. Unlike the Mediterranean
3 coast, in the Canary Islands the
estimate an amount of 16,450.47 m for the province of Santa Cruz and 39,481.13 m for the port of Las low 3season coincides
Palmas. In Section 3 the diagram of the proposed process is described.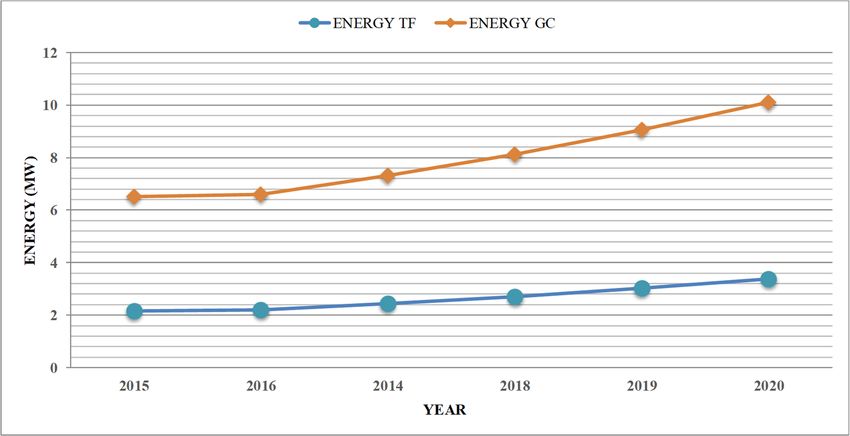
Resources 2019, 8, 59                                                                                 8 of 17

2.2. Waste Management Data
     Currently, Santa Cruz docks receive MARPOL V waste from ships using their services. Owing to
some industrial, business and service facilities also being located there, there is a solid refuse collection
network consisting of a selective pick-up of recyclables and the bulk collection of the remaining fraction.
Thus, the total flow from both currents is sent to the corresponding processing and land-fill sites.
According to the last data series from the Port of Santa Cruz Authority, the average flow is 21,020 m3 of
MARPOL V and 65,709 m3 of solid waste, generated by licensed companies within the docks. Based on
this volume, the port zone itself could be treated as an isolated waste treatment center.
     Marine and dockside ship-waste pick-up and reception services in Santa Cruz operate continuously
365 days a year. There are no treatment plants in the docks for this kind of waste, which directly
incurs disposal costs for the port authorities. According to the data compiled, there were 2927 waste
receiving services rendered in 2015 in Santa Cruz docks (without considering other associated ports in
the same province, like La Palma, El Hierro, La Gomera or Los Cristianos), with a total solid waste
volume of 15,715 m3 (MARPOL V). Likewise, for the years 2013 and 2015, there is an increasing
evolution of MARPOL V generated in the western ports of the archipelago. The average of MARPOL
V generated in the four western islands (La Gomera, La Palma, Tenerife, and El Hierro) reaches the
value of 21,019.00 m3 . In this study, waste not counted within Annex V but still to be managed has
been included. Table 2 shows the average annual collection in Santa Cruz docks and the exploitable
fraction to be evaluated (except glass and septic tank sludge, which are handled differently).
     Table 3 shows a summary of data referring to 2013–2016, categorizing waste into paper, plastic and
urban solid waste (USW) and similar. Importantly, the volume of waste generated by such companies
rose yearly, a clear sign of the trend toward growth in tourism and services on the island.

      Table 3. Wastes generated by licensed companies operating in Santa Cruz docks in the 2013–2016
      period (Data provided by Canary Bioenergy S.L.).

                        Waste (m3 )     2013        2014          2015           2016
                          Paper        4080.00     5120.00       6160.00        7558.20
                          Plastic      4264.00     4896.00       5528.00        6136.08
                          USW         52,854.40   58,281.60     65,708.80      73,593.86

2.3. Data on Energy Consumption in the Port of Santa Cruz de Tenerife
     It is necessary to make a rough forecast of demand for one year. From this, we can compile some
interesting data, for instance regarding the need for a generation source capable of meeting the peaks
of demand caused by ship dockings coinciding on the same or very close dates.
     According to data gathered by the Port Authority of Santa Cruz de Tenerife, the average estimate
of consumption per cruise-ship is 3.9 MW, which corresponds to an average berth of 11.4 h and
1.6 cruises per day. As seen in Figure 5, depending only on the demand from the docked ships,
energy consumption varies greatly from 5.8 MW/day minimum to a 33.3 MW/day maximum when the
cruise-ships coincide in the port, stimulating more activity. Taking this into account, a base load of
4 MW is needed to keep the facilities running.
Resources 2019, 8, 59 9 of 17
Figure 5. Estimated base load and energy peaks for a one-year period in the port of Santa Cruz
de Tenerife.
3. Results
Figure 6 shows a comparison between the current waste management in the port and this proposal
based on the concept of the circular economy, as put forward by other authors like Pauli [35] and
Cubiñá [36]. The model is based on not sending all the waste out to a general processing center,
so as to create a micro-circular economy based on it. After processing, around 56% would be used to
produce electrical energy for the port’s own consumption and when needed, for the ships (Figure 6).
The expression that guides the model according to the hours of operation, the density of the waste and
the fraction destined for recovery, is the following:
E = MWtE × PCI/Hf (1)
where: E is the energy from the recovery of MARPOL waste (MW); MWtE is the fraction of waste that
is converted annually (tons); PCI is the lower calorific value of the waste stream (Kcal/kg), and Hf is
the equivalent
Resources 2019,hours
8, 59 of operation of the plant. 10 of 18
Figure6.6.Suggested
Figure Suggested model,
model, based on
on the
the ‘circular
‘circulareconomy’
economy’concept.
concept.
The The
following
followingresults have
results taken
have takeninto account
into account the
themethodology
methodologydescribed
described inin Section
Section 2.2. For
For the
the prediction
prediction of the of the generation
generation of energy
of energy and, and, therefore,the
therefore, the generation
generation ofofwaste
waste in the portport
in the area,area,
two two premises
premises havehavebeenbeen considered:
considered: the the
firstfirst
oneone is the
is the evolution
evolution of the
of the arrival
arrival of cruises
of cruises to to
thethe
island
overisland over
the last fivethe last and,
years five years and, the
the second onesecond
is theone is theforecast
existing existing offorecast
cruisesoffor
cruises for the coming
the coming years in the
years
islands in the
(these areislands (these
facts that the are facts
ports havethat theinports
well havein
advance well in advance
order to foreseeinthe
order to foresee
demand the
for services).
demand for services). Table 4 shows a summary of the statistics and parameters
Table 4 shows a summary of the statistics and parameters considered in the study. Certain premises considered in
the study. Certain premises are necessary for 1 replicating this study and applying it to other
comparable isolated environments, which contribute positively to enriching it.
Table 4. Estimated results of waste treatment according to the flow processed.
Estimation of Results According to the Data and Characterizations Carried OutResources 2019, 8, 59 10 of 17
are necessary for replicating this study and applying it to other comparable isolated environments,
which contribute positively to enriching it.
Table 4. Estimated results of waste treatment according to the flow processed.
Estimation of Results According to the Data and Characterizations Carried Out
Waste stream Density (kg/m3 ) Calorific value (Kcal/kg) Moisture (%) Quantity (Tn)
MARPOL V 300 741.19 45% 4935.14
Other solid waste from ships 300 741.19 45% 297.02
Urban Solid Waste (USW) 335 1258.81 40% 22,012.49
TOTAL 27,244.65
Processed flow Percentage (%) Energy capacity (MW) Quantity (Tn)
Fraction to recycle 30 - 8173.40
Fraction to rejection 10 - 2669.98
Energy fuel 60 2.30 16,401.27
TOTAL 100 2.30 27,244.65
Average waste density values have been taken from the characterizations performed, and match
the interval corresponding to non-compact waste, as described in the CRC Handbook of Environmental
Control [37]. For the study, a round figure for the average refuse density of 1000 kg/m3 has been
used, corresponding to waste compacted during the collection process, since factors such as water
content affecting such refuse are highly variable. The reason lies in their dependence on organic
content, the local weather conditions, on the way they are contained or presented and on their origin.
Characterization of the non-compact wastes indicates a humidity content varying from 40% to 60%
by weight.
The data point to a capability of extracting 2.3 MW of electricity for the port’s own consumption,
generated only from waste not currently recycled, which moreover currently incurs financial losses
through disposal costs.
However, these results need an extrapolation in two directions. First, and following the marked
evolution of previous years, it is useful to quantify energy savings in a five-year perspective. Second,
it is useful to extend the study to at least the other provincial capital, Las Palmas de Gran Canaria.
It is necessary to clarify some previous premises. There is not much data available from the port
authority of the province of Las Palmas. Nevertheless, it is accepted, according to data from the
published archives of State Ports of the Ministry of Public Works of Spain [38], that the activity of
garbage collection in the docks of the port of the Gran Canaria capital is about three times as much as
that of the port of Santa Cruz de Tenerife. Hence, with the same calculation assumptions as before,
the quantities of garbage estimated by the provincial capital are shown in the range of years between
2015 and 2020 (see Table 5).
Table 5. Estimated waste generated between 2015–2020 for Santa Cruz de Tenerife and Las Palmas de
Gran Canaria (Tn).
Santa Cruz de Tenerife Las Palmas de Gran Canaria
Other solid Total Other solid Total
MARPOL MARPOL
Year waste from USW quantity waste from USW quantity
V V
ships per year ships per year
2015 4935.14 297.20 19,712.64 24,944.98 14,805.42 891.60 59,137.92 74,834.94
2016 5231.25 326.92 22,078.16 27,636.33 15,693.75 980.76 66,234.48 82,908.99
2017 5545.12 362.88 24,727.53 30,635.53 16,635.36 1088.64 74,182.59 91,906.59
2018 5933.30 395.54 27,694.84 34,023.68 17,799.90 1186.62 83,084.52 102,071.04
2019 6467.28 431.14 31,018.22 37,916.64 19,401.84 1293.42 93,054.66 113,749.92
2020 7114.00 465.63 34,740.40 42,320.03 21,342.00 1396.89 104,221.20 126,960.09
Total 197,477.19 592,431.57Resources 2019, 8, 59 11 of 17
In a more compact way, and with the same previous characterization assumptions, Table 6 shows
the estimate for both provinces once the model for the period 2015-2020 has been applied.
Table 6. Estimated results of waste treatment for both islands.
Santa Cruz de Tenerife 2015 2016 2017 2018 2019 2020 TOTAL
Fraction to recycle (Tn) (30%) 8173.45 8290.90 9190.66 10,207.10 11,374.99 12,696.01 59,243.16
Fraction to rejection (Tn) (10%) 2724.47 2763.63 3063.55 3402.37 3791.66 4232.00 19,977.69
Energy fuel (Tn) (60%) 16,364.79 16,581.80 18,381.32 20,414.21 22,749.98 25,392.02 119,392.02
Total Energy (MW) 2.17 2.20 2.44 2.71 3.02 3.37 15.91
Las Palmas de Gran Canaria 2015 2016 2017 2018 2019 2020 TOTAL
Fraction to recycle (Tn) (30%) 24,520.19 24,872.70 27,571.98 30,621,31 34,124.98 38,088.03 179,799.17
Fraction to rejection (Tn) (10%) 8173.40 8290.90 9190.66 10,207.10 11,374.99 12,696.01 59,933.06
Energy fuel (Tn) (60%) 49,040.37 49,745.39 55,143.95 61,242.62 68,249.95 76,176.05 359,598.35
Total Energy (MW) 6.51 6.60 7.32 8.13 9.06 10.11 47.74
Similarly, in Figures 7 and 8, it is possible to compare the evolution of the energy contribution for
Resources 2019, 8, 59 12 of 18
self-consumption in a five-year interval, the waste that is destined for the recovery and the fraction
that is recycledSimilarly,
in each of in the provinces.
Figures 7 and 8, it is possible to compare the evolution of the energy
contribution for self-consumption in a five-year interval, the waste that is destined for the
recovery and the fraction that is recycled in each of the provinces.
7. Estimated
Figure Figure results
7. Estimated of of
results waste
wastetreatment
treatment inin both
both islands
islands aboutabout valorization.
valorization.
Figure 8. Estimated results of waste treatment in both islands about recycling.
Figure 8. Estimated results of waste treatment in both islands about recycling.
4. Discussion
The data coming from these islands, where transport and recycling are a serious problem in
the management of waste, are very encouraging. As explained by Rodríguez [39] and Uche-Soria
and Rodríguez-Monroy [40], their isolated condition and the few infrastructures of these
subsystems require a constant study of alternatives for improvement. According to this model,
the capital port of Las Palmas can get up to 47.74 MW of waste energy per year from Marpol V.
In the province of Santa Cruz de Tenerife the results are more modest (15.91 MW per year).Resources 2019, 8, 59 12 of 17
4. Discussion
The data coming from these islands, where transport and recycling are a serious problem in
the management of waste, are very encouraging. As explained by Rodríguez [39] and Uche-Soria
and Rodríguez-Monroy [40], their isolated condition and the few infrastructures of these subsystems
require a constant study of alternatives for improvement. According to this model, the capital port
of Las Palmas can get up to 47.74 MW of waste energy per year from Marpol V. In the province of
Santa Cruz de Tenerife the results are more modest (15.91 MW per year). However, it is important to
note that this energy comes from an improvement in current waste management and provides many
advantages: reduction of waste transport to the landfill, lower emission of greenhouse gases, reduction
of CO2 generated by transport and an increase in the recycling fraction.
It is interesting to compare the proposed solution to others that could be applied in this isolated
environment. The first alternative consists of leaving things as they are, implementing no improvements.
The second is to apply in practice the model deriving from the present study, and finally, a third
intermediate situation where only waste management is improved (investment in recycling) but waste
is not valorized as energy. Based on the current legislation, economic, functional, environmental and
social indicators have been used in this analysis.
This multicriteria analysis (Table 7) is inclined favorably towards the proposed model, bearing in
mind the limitations to precision derived from this being a modest study in scale and means, and from
the selected methodology. With the exception of the functional point of view within which the three
options are found in the same legal and administrative framework, from the rest it seems that the second
model shows the best approach. From the economic point of view, our proposal is the least arduous
alternative for the port of Santa Cruz and would mean a substantial reduction in its current waste
management costs. With this alternative, most of the waste produced can be valorized, considering
that on one hand, recyclable materials are recovered, and on the other, electricity is produced for
self-consumption. Additionally, more jobs would be created.
From an environmental point of view, the impact caused during the construction phase is minor.
In the working phase, it could be minimized by applying the appropriate preventive and remedial
measures. The current CO2 emissions coming from transport by road to the refuse processing and
land-fill site would be reduced. From the social point of view, unpleasant odors or other annoyances to
the population are not likely.
Based on the simulated results, several policy recommendations for the Canary Islands’ ports can
be provided. First, in isolated environments such as the Canary archipelago, the optimization of waste
management can have significant positive effects, not only on aspects related to environmental pollution,
but also on energy policy, helping to implement new solutions that allow more sustainable models.
Second, especially in isolated systems such as the Canary Islands, it is necessary to align the
strategic thinking of the archipelago in energy and environmental matters with the development
of legislation so that, far from penalizing, it contributes to investments to implement these and
other measures that help improve the complex energy scheme of isolated electricity systems [41,42].
A clear example is the investment in circular economy policies taking advantage of the singularities of
each island.
Third, this energy management would be an obvious improvement in the waste management
service of Tenerife, according to the revised text of the Special Territorial Plan for the Management of
Waste in Tenerife [43]. This entails a lower financial cost for the Port Authority and a great reduction in
waste transport volume to the processing center (with the social and environmental repercussions that
this currently implies).Resources 2019, 8, 59 13 of 17
Table 7. Multicriteria analysis of waste-disposal alternatives for Tenerife’s main port, Santa Cruz.
Study Criteria
Alternatives Economic Environmental Functional Social
Overloading of the landfill.
With the current management system,
It is estimated that, given the number of The current management
25,000 tons of waste coming from the port, are Risks of accidents and withholdings
1/Current situation: waste, a total number of 2500 journeys of system of Santa Cruz’s port
being taken to the environmental complex. due to the journeys to the landfill.
without the garage trucks per year would be is viable from the technical
Its cost is around 1,500,000 € per year. Increase of municipal taxes of the
intervention necessary, which implies 250 tons of CO2 and legal/administrative
New employment opportunities would not landfill due to clogging.
emissions per year. point of view.
be created.
There is no visual environmental impact.
Only 2500 tons of waste (reduction of the 90%), Less accident risks and retentions
There is not landfill overloading. The management system of
are moved to the environmental complex, due to the journeys to the landfill.
Reduction of truck journeys down to 150, waste of recovery proposed
which causes a decrease in the cost associated Improvement of the management
2/Recovery of waste with 15.36 tons of CO2 emissions per year. is viable from the technical
to the charges of entry of the landfill. system of waste in line with the
Recycling of 30% of the products. and legal/administrative
New employment opportunities would Tenerife’s Special Territorial Waste
There is visual environmental impact. point of view.
be created. Management Plan (PTEOR).
19,071.25 tons of rejections of end of line per
year are moved to the environment complex The junkyard elimination gets reduced The management system of
after the separation for recycling (reduction of when compared to the current situation. waste of separation
3/Separation in
the 30%). Reduction of the trucks to 1076 journeys, proposed is viable from the Traffic caused by the waste
origin of recyclable
Its cost would be about 2,000,000 € per year. with 110.3 tons of CO2 emissions per year. technical and transport is reduced by 43%.
materials
New employment opportunities would be Recycling of 30% of the waste. legal/administrative point
created (although they would be less than in There is visual environmental impact. of view.
option 2).Resources 2019, 8, 59 14 of 17
Fourth, applying the proposed model the island’s general waste management system is largely
liberated of responsibility, overcoming difficulties such as coordination with its management network.
This involves considerable daily transport costs to the Port Authority (nearly 60 km daily for
each journey).
Fifth, considering that the annual amount of waste produced is nearly 30,000 tons, it is of vital
importance to have a total control over the management of that flow. This opens the door to reaching
higher levels of efficiency in terms of recycling the waste materials produced that would considerably
benefit the main port of Tenerife and its activity. This proposal implies that the port recovers nearly 30%
of the reusable materials from the total waste accumulated, as well as providing better management of
MARPOL V waste from the ships using its facilities. Additionally, the proportion of journeys carried
out for transporting waste to the landfill is greatly reduced (by nearly 90%).
Sixth, it is a good opportunity to study the peculiarities of the isolated systems in more detail,
regarding technologies, plans for development in small systems and the legislative framework in
force. The regulations, technology, and investment levels are lacking appropriate adaptation to these
isolated environments. As an example, although in this article the isolated system of the port of Santa
Cruz was analyzed, the authors consider that replicating this study and others related to the energy
planning of each subsystem in the Canary Islands’ IES would also be of great value. Smaller islands in
the archipelago like La Gomera, El Hierro or La Palma would be of special interest since the cost of
electricity generation there is even higher and there are as yet no optimized solutions in the field of
waste processing and disposal providing guidelines in pursuing a circular economy.
Beyond the technology or the money available to invest in infrastructure, the main limitation
that authors find to carry out this model of energy management is the short-term vision of the actors
involved in the energy planning of countries, cities, ports and small subsystems. The development of
energy policies in these environments consists of short-term measures that, while solving a current
need, at the same time create a problem in the medium term through policies that negatively influence
an energy transition. As Fusco [44] points out in his study on smart sustainable development in
cities and port areas, information and communication technology (ICT), innovative technologies and
approaches such as the circular economy to implement new policies cannot be missed. However,
it must be admitted that this new approach requires a considerable cultural change on the side of
society and of the companies and authorities that intervene in the transition.
5. Conclusions
This study shows the authors’ interest in searching for alternatives to improve the current issue
of waste management and energy sustainability in isolated systems, with a special emphasis on the
Canary Islands and other non-mainland locations.
Furthermore, this study is focused on the need to improve Tenerife’s energy planning, in order to
arrive at a model that can be replicated in other similar isolated systems like the Cape Verde Islands or
the Azores Islands, which, like the Canary Islands, have similar problems related to the security of
supply, the price of energy and waste management. For this reason, the possibility of the port of Santa
Cruz being an autonomous system regarding its own waste management and energy supplies, for both
dockside facilities and cargo ships, ferries and cruise liners stopping over the island, is a relevant
study. A key advance would be a preliminary study to clarify the current energy situation, quantifying
and characterizing the existing waste flows, and to design a configuration integrating the different
solutions available for each aspect.
Author Contributions: Both authors have participated directly in performing this research. M.U.-S. has been
responsible for gathering the relevant data, processing these data, and writing the original draft. C.R.-M. has been
responsible for the design of the research project and the supervision of its development.
Funding: There was no financial founding to support this research.
Acknowledgments: This study is partly supported by Canary Bioenergy, S.L. (CANBE) that works on projects of
energy solutions for the islands, especially focused on the Canary Islands’ needs.Resources 2019, 8, 59 15 of 17
Conflicts of Interest: The authors declare no conflict of interest.
References
1. Gobierno de Canarias. Canary Islands Energy Yearbook 2017. Available online: http://www.
gobiernodecanarias.org/ceic/energia/doc/Publicaciones (accessed on 26 February 2019).
2. Guerrero-Lemus, R.; González-Díaz, B.; Ríos, G.; Dib, R.N. Study of the new Spanish legislation applied to
an insular system that has achieved grid parity on PV and wind energy. Renew. Sustain. Energy Rev. 2015, 49,
426–436. [CrossRef]
3. Marrero, G.A.; Ramos-Real, F.J. Electricity generation cost in isolated systems: The complementarities of
natural gas and renewables in the Canary Islands. Renew. Sustain. Energy Rev. 2010, 14, 2808–2818. [CrossRef]
4. Mendoza-Vizcaino, J.; Sumper, A.; Sudria-Andreu, A.; Ramirez, J.M. Renewable technologies for generation
systems in islands and their application to Cozumel Island, Mexico. Renew. Sustain. Energy Rev. 2016, 64,
348–361. [CrossRef]
5. Fokaides, P.A.; Kulili, A. Toward grid parity in insular energy systems: The case of photovoltaics (PV) in
Cyprus. Energy Policy 2013, 65, 223–228. [CrossRef]
6. Kuang, Y.; Zhang, Y.; Zhou, B.; Li, C.; Cao, Y.; Li, L.; Zeng, L. A review of renewable energy utilization in
islands. Renew. Sustain. Energy Rev. 2016, 59, 504–513. [CrossRef]
7. Royal Decree 738/2015, of July 31, Which Regulates the Activity of Electric Power Production and the
Dispatch Procedure in the Electrical Systems of the Non-Peninsular Territories. Official State Bulletin, N. 183
of 1 August 2015. BOE-A-2015-8646. Available online: https://www.boe.es/eli/es/rd/2015/07/31/738 (accessed
on 25 June 2018).
8. Royal Decree 413/2014, of June 6, Which Regulates the Activity of Production of Electric Power from
Renewable Sources of Energy, Cogeneration and Residues. Official State Bulletin, N. 140 of 10 June
2014. BOE-A-2014-6123. Available online: https://www.boe.es/eli/es/rd/2014/06/06/413/con (accessed on 30
June 2018).
9. Royal Decree 900/2015, of October 9, Which Regulates the Administrative, Technical and Economic Conditions
of the Modalities of Electric Power Supply with Self-consumption and Production with Self-consumption.
Official State Bulletin, N. 243 of 10 October 2014. BOE-A-2015-10927. Available online: https://www.boe.es/
eli/es/rd/2015/10/09/900 (accessed on 26 June 2018).
10. Iñiguez, M.E.; Conesa, J.A.; Fullana, A. Marine debris occurrence and treatment: A review. Renew. Sustain.
Energy Rev. 2016, 64, 392–402. [CrossRef]
11. Adolf, K.Y.; Song, S. The environmental impacts of pollutants generated by routine shipping operations on
ports. Ocean Coast. Manag. 2010, 53, 301–311.
12. Di Vaio, A.; Varriale, L.; Trujillo, L. Management Control Systems in port waste management: Evidence from
Italy. Util. Policy 2019, 56, 127–135. [CrossRef]
13. Di Vaio, A.; Varriale, L. Management Innovation for Environmental Sustainability in Seaports: Managerial
Accounting Instruments and Training for Competitive Green Ports beyond the Regulations. Sustainability
2018, 10, 783. [CrossRef]
14. Onwuegbuchunam, D.E.; Ebe, T.E.; Okoroji, L.I.; Essien, A.E. An Analysis of Ship-Source Marine Pollution
in Nigeria Seaports. J. Mar. Sci. Eng. 2017, 5, 39. [CrossRef]
15. External Costs of Transport: Accidents, Environmental and Congestion Costs of Transport in Western Europe;
INFRAS/IWW; International Union of Railways: Paris, France, 2000.
16. Etkin, D.S. Modeling oil spill response and damage costs. In Proceedings of the 2003 International Oil Spill
Conference; American Petroleum Institute: Washington, DC, USA, 2003.
17. Camphuysen, C.J. Chronic Oil Pollution in Europe; A Status Report; IFAW: Brussels, Belgium, 2007.
18. Adler, E.; Inbar, M. Shoreline sensitivity to oil spills, the Mediterranean coast of Israel: Assessment and
analysis. Ocean Coast. Manag. 2007, 50, 24–34. [CrossRef]
19. Gómez, A.G.; Ondiviela, B.; Puente, A.; Juanes, J.A. Environmental risk assessment of water quality in
harbour areas: A new methodology applied to European ports. J. Environ. Manag. 2015, 155, 77–88.
[CrossRef] [PubMed]
20. Liu, X.; Wirtz, K.W. Total oil spill costs and compensations. Marit. Policy Manag. 2006, 33, 49–60. [CrossRef]You can also read