REDUCED DEPENDENCE ON FOSSIL FUELS IN MONTRÉAL - Reference document - Office de ...
←
→
Page content transcription
If your browser does not render page correctly, please read the page content below
Reference document

REDUCED DEPENDENCE
ON FOSSIL FUELS
IN MONTRÉAL
VILLE DE MONTRÉAL

PRODUCTION
Service de l’environnement
Division de la planification et du suivi environnemental

INFORMATION
environnement@ville.montreal.qc.ca

PHOTOGRAPHY
Ville de Montréal
unless otherwise indicated

                                                           2
TABLE OF CONTENTS

4    Energy and climate – definitions and popularization of concepts
 4   What is a fossil fuel?
 5   What is a renewable energy? What are the different sources of renewable energy?
 6   What is the greenhouse effect? How does it relate to climate warming?
 6   What are the concrete impacts of climate change?
 7   What is the difference between the weather and the climate? How do we forecast the climate
     in 50 years if we are unable to predict the weather in 10 days?
 7   What is a climate model?
 7   References for further information

8    Portrait of fossil fuel consumption in Québec and possible solutions
 8   Global portrait
 9   Montréal’s specificities in reducing the dependence on fossil fuels
 9   Promising avenues to reduce Montréal’s dependence on fossil fuels

11   Transportation sector
11   Portrait of energy consumption in the transportation sector
12   Transportation trends
13   Montréal specificities
14   Limits to the powers of Ville de Montréal
15   Planned measures by Ville de Montréal

23   Building sector
23   Portrait of energy consumption in the building sector
24   Building trends
25   Montréal specificities
26   Limits to the powers of Ville de Montréal
27   Planned measures by Ville de Montréal

29   List of Montréal community plans for lesser dependence on fossil fuels

30   List of corporate initiatives for lesser dependence on fossil fuels

                                                      3
ENERGY AND CLIMATE - DEFINITIONS AND
POPULARIZATION OF CONCEPTS

WHAT IS A FOSSIL FUEL?
A fossil fuel is a fuel derived from the combustion of
                                                                   SOURCE          EXAMPLE OF USE
hydrocarbons (organic compounds composed of carbon
and hydrogen). The fuel is designated as “fossil”, since           Gasoline        Car fuel
the hydrocarbons were extracted from the Earth’s                   Diesel          Truck fuel
underground geological formations where they had
been buried for millions of years. Fossil fuels are not            Fuel oil        Heating
renewable, given that their supply on Earth is limited.            Coal            Production of cement in industries1
The combustion of hydrocarbons releases greenhouse
                                                                   Natural gas     Heating, cooking
gases (GHG), which contribute to climate change. The
adjacent table shows a few examples of fossil fuel                 Propane         Barbecue
sources and their use in Montréal.
                                                                   Butane          Camp stove

1. NATURAL RESOURCES CANADA. Coal – Other information, [Online], updated January 16, 2015. [www.nrcan.gc.ca/mining-materials/
markets/commodity-reviews/2012/14377] (Consulted October 7, 2015).

                                                              4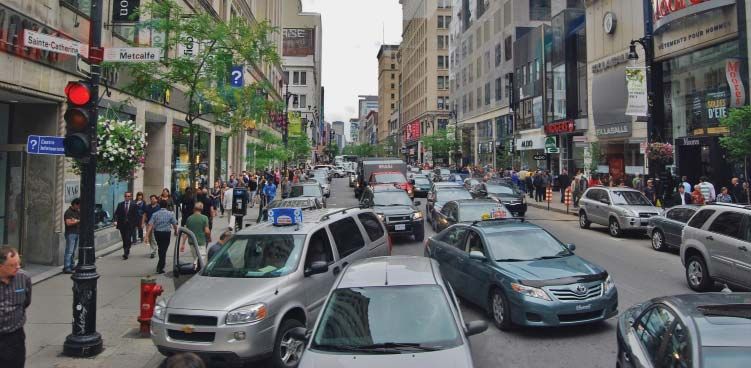
WHAT IS A RENEWABLE ENERGY?
WHAT ARE THE DIFFERENT SOURCES OF RENEWABLE ENERGY?
Unlike fossil fuels, renewable energies are inexhaustible energies on a human timescale. They can be provided by
the sun, the wind, the Earth’s heat, the fall of water from a reservoir created by a dam, the tides or even plants
through biomass combustion.

The following table describes the main sources of renewable energies and their relevance as a solution to reduce
our dependence on fossil fuels in the agglomeration of Montréal (see the Portrait of fossil fuel consumption in
Québec and possible solutions in page 8 for further explanations).

                                                                                        IF HELPFUL TO REDUCE MONTRÉAL’S
 SOURCE             HOW                                      PRODUCT
                                                                                        DEPENDENCE ON FOSSIL FUELS?

                                                                                        No, as our electricity is already derived from
                    Photovoltaic cells                       Electricity
                                                                                        a renewable energy source (hydroelectricity).

                                                                                        Yes, if used to replace a solid fuel
 Solar              Solar thermal collectors                 Heat
                                                                                        heating system.

                                                                                        Yes, if used to replace a solid fuel
                    Passive solar2                           Heat
                                                                                        heating system.

                                                                                        No, as our electricity is already derived from
 Wind               Wind turbines                            Electricity
                                                                                        a renewable energy source (hydroelectricity).

                                                                                        Québec’s electricity is mainly derived from
                    Hydroelectric plants                     Electricity
                                                                                        hydraulic energy (hydroelectricity).
 Hydraulic
                                                                                        No, as our electricity is already derived from
                    Marine turbines                          Electricity
                                                                                        a renewable energy source (hydroelectricity).

                    Fermentation or combustion               Biogas
 Biomass                                                                                Yes, if used to replace a solid fuel.
                    of organic matter                        Biofuels

                                                             Heat                       Yes, if used to replace a solid fuel
 Geothermal         Heat pumps
                                                             Air conditioning           heating system.

2. Integrating passive solar energy into the design of a building allows for the use of sunlight for lighting purposes, and of the sun’s heat
for heating during cold periods, while preventing that same heat from entering the building in warm periods, in order to reduce the use of
other energy sources for lighting, heating or air conditioning purposes.

                                                                     5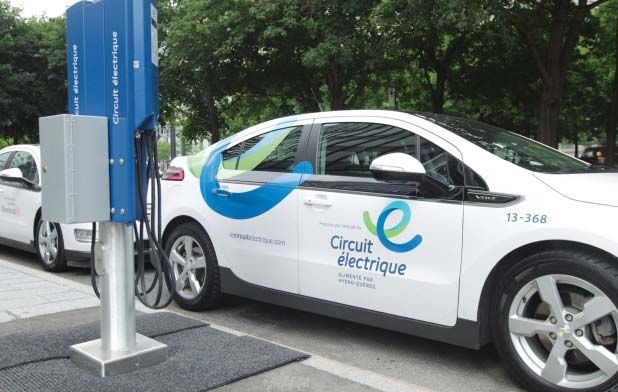
WHAT IS THE GREENHOUSE EFFECT?
HOW DOES IT RELATE TO CLIMATE WARMING?
The Earth’s atmosphere can be represented by a
transparent veil that partly captures the heat emitted by
the Earth (a phenomenon designated as “greenhouse                                  Part of       The surface of
                                                                                   the energy    the Earth is warmed
effect”). More accurately, this “veil” lets the sun’s                              is returned
                                                                                   to space
                                                                                                 by the Sun and returns
                                                                                                 heat to space
rays from space pass through, but captures part of the
infrared radiation (heat) reemitted by the Earth towards
space. Thanks to the greenhouse effect, the Earth’s                   The energy
                                                                                                                The greenhouse
                                                                                                                gases in the atmosphere
                                                                    from the Sun
average temperature is 15 °C rather than -18 °C.                  passes through
                                                                 the atmosphere
                                                                                                                trap some of the heat

The quantity of heat captured depends on the
concentration of certain gases, called greenhouse
gases, such as carbon dioxide (CO2), methane (CH4)
or nitrous oxide (N2O). Since the industrial revolution,
the human population has considerably increased
the concentration of these gases in the atmosphere,
essentially through the combustion of fossil fuels and
deforestation. As a result, the greenhouse effect has increased and will continue to do so. If no greenhouse gas
reduction measures are implemented, the average temperature on Earth could increase by more than 4 °C by the
end of this century. Such climate conditions have never been encountered since the beginning of mankind some 3
million years ago, which begs the question as to how mankind will adapt to these conditions.

WHAT ARE THE CONCRETE IMPACTS OF CLIMATE CHANGE?
Climate change related to the increase in greenhouse gases has several impacts. The most obvious one is
an increase in the global average temperature, accompanied by an increase in the frequency of heat waves.
Another consequence is a modification of the hydraulic cycle with, in particular, more frequent intense
precipitations. This is because warmer air contains more water vapour. In Montréal, one can observe a longer
summer season, a shorter winter season, an increase in abundant rainfalls and heat waves, fewer snowfalls
and an increase in freeze-thaw occurrences.

Similarly to air pollution, climate change can have an effect on human health. For instance, in Montréal
between 1983 and 2013, 423 deaths were caused by heat waves. Also, an extended summer season has
resulted in an increase of pollen-related allergies.

In addition to their repercussions on human health, climate change can impact infrastructures
(e.g., potholes following a freeze-thaw) and the environment (e.g., lesser biodiversity, pollution of
waterways due to sewer overflows).

                                                            6
WHAT IS THE DIFFERENCE BETWEEN THE WEATHER AND THE
CLIMATE? HOW DO WE FORECAST THE CLIMATE IN 50 YEARS IF
WE ARE UNABLE TO PREDICT THE WEATHER IN 10 DAYS?
 “Climate is what you expect, weather is what you get.” This sentence from mathematician and meteorologist
Edward Norton Lorenz pretty well summarizes the difference between weather and climate. Taking Montréal
as an example, on September 8, 2015, the average temperature for the day was 24.2 °C. This was the result of
certain weather conditions that prevailed in the Montréal region in preceding days. If we focused instead on the
average temperature of all September 8ths in each of the years in the 1981 to 2010 period, the “climate” average
was 17.8 °C. The climate thus corresponds to the recorded weather averages over several years.

Montréal’s climate is influenced by well-known major atmospheric movements such as the polar jet stream, the
cold and dry air of the Arctic regions in the winter or the hot and humid air of the Gulf of Mexico in the summer.
These average climate conditions are supplemented by minor air movement disturbances that are impossible to
measure extensively. It is these minor disturbances that explain why it is more difficult to predict the weather
than the climate.

Also, the Earth’s global climate essentially depends on the Sun’s energy and the concentration of greenhouse
gases, factors that are well understood. That is why climate model projections are more reliable when dealing
with the climate in 50 years.

WHAT IS A CLIMATE MODEL?
Climate models consist in very complex software applications that integrate mathematical equations of physics
and chemistry describing the atmosphere, the ocean and continental surfaces. These equations represent the
main exchanges of energy and matter that preside over meteorological, hydrological or biological phenomena.
These models are able to simulate the speed and direction of winds and marine currents, but also the evolution of
temperatures and precipitations, or the features of various plant covers. For additional details on the contents of
climate models, an animated explanation (in French only) is available at the following internet address:
www.ipsl.fr/Mediatheque/Multimedia/Animation-sur-la-modelisation-climatique.

REFERENCES FOR FURTHER INFORMATION
  •   ville.montreal.qc.ca/portal/page?_pageid=7237,75083582&_dad=portal&_schema=PORTAL
  •   www.ouranos.ca

                                                         7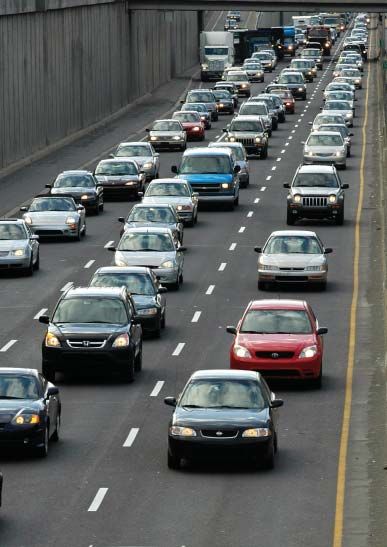
PORTRAIT OF FOSSIL FUEL CONSUMPTION
IN QUÉBEC AND POSSIBLE SOLUTIONS

GLOBAL PORTRAIT
51% of the energy consumed in Québec3 is derived from fossil fuels (oil, natural gas and some coal). The rest
comes from renewable energies (hydroelectricity, wind and biomass energy). Fossil fuel consumption breaks down
as follows between these four sectors:
              •    58% in transportation,
              •    23% in industries,
              •    14% in commercial and institutional buildings,
              •    5% in residential buildings.

The figure below details the type of fossil fuel consumed by sector.

                                      QUÉBEC CONSUMPTION OF FOSSIL FUELS BY SECTOR IN 2012

                  500                                                                                                                   5

                            Note : The split in the consumption of the various fossil fuels between residential buildings and
                            commercial and institutional buildings was estimated by calculating the total consumption by sector
                  400       in 2012 and using the breakdown in consumption by type of energy for 2011 (these data were also
                            drawn from the État de l’énergie au Québec 2015). This explains why the data in this figure are not
                            an exact fit with the percentages of fossil fuel consumption by sector previously indicated in the
                            Global Portrait section.

                  300
Petajoules (PJ)

                                                                                                                                       479
                  200
                                                                                                                      23

                                                                                                                      85
                  100

                                                                             104
                                     22                                                                               88
                                     25                                       15
                    0
                           Residential buildings                       Commercial &                               Industries      Transportation
                                                                   institutional buildings

                                                                  Coal                        Natural gas            Oil

3. The data for Montréal are not available. All of the data presented in this figure are drawn from the État de l’énergie au Québec 2015
produced by the Chaire de gestion du secteur de l’énergie of HEC Montréal (energie.hec.ca/publications/etat-de-lenergie-au-quebec).

                                                                                          8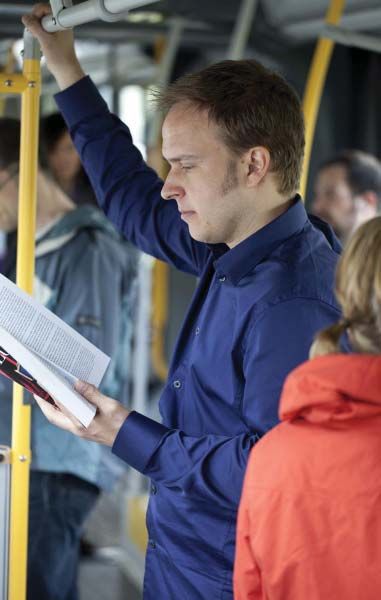
MONTRÉAL’S SPECIFICITIES IN REDUCING
THE DEPENDENCE ON FOSSIL FUELS
Why is it that other cities’ oil exit programs cannot be directly applied to Montréal?
In Québec, we’re fortunate in that our electricity is derived in a proportion of almost 99% from a renewable
energy, namely hydroelectricity. Consequently, and contrary to most other locations in the world engaged in
a transition toward sustainable energy, implementing renewable electricity production programs (for instance
electricity from wind or solar power) would not contribute to reducing our consumption of fossil fuels.

Why is the relevance of municipalities’ actions on the industrial sector limited?
Municipalities have few levers to directly influence the energy choices of industries, among other reasons, because of
their restricted regulatory powers in this matter. Also, industry’s total energy consumption has decreased since 2004,
while energy intensity (energy consumption relative to the gross domestic product) has been on a downward trend
since the beginning of the 90s. This is explained by the fact that two major incentives are driving companies to reduce
their energy consumption, particularly their consumption of fossil fuels: an optimization of their costs to improve their
profitability, and Québec’s Règlement sur le système de plafonnement et d’échange de droits d’émission de gaz à
effet de serre (Regulation respecting a cap-and-trade system for greenhouse gas emission allowances) in force since
2013. For these reasons, the relevance of actions by the municipal level in this field is limited.

PROMISING AVENUES TO REDUCE MONTRÉAL’S
DEPENDENCE ON FOSSIL FUELS
Priority number 1: rethinking transportation
As indicated in page 8, the transportation sector consumes more fossil fuels than all of the other sectors combined.
Consequently, it’s in this sector that the greatest gains can be achieved in terms of reducing the use of fossil fuels.

To reduce fuel consumption in the transportation sector, both in the transportation of people and goods, two
avenues can be considered:

1. favor transportation modes that consume less fuel on the basis of the distance travelled and by passenger or
   by quantity of goods transported, such as public transit, active transportation (walking, cycling, etc.), carpooling,
   electric vehicles, trains or boats;
2. reduce the distances to be travelled, for instance by developing more densely populated mixed-use neighbourhoods,
   by encouraging telecommuting or reducing the distances to be travelled by goods by prioritizing short distribution
   channels and local products.

                                                           9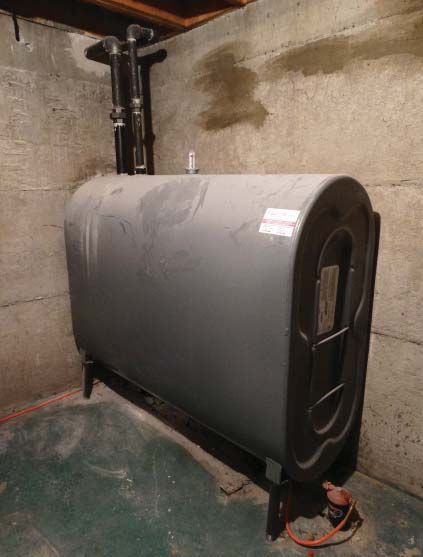
Replace fossil fuels by second or third
generation biofuels                                                 On August 27, 2009, the Montréal
Biofuels are fuels produced from biomass (plant or                  Agglomeration Council unanimously
animal matter). Once burned, biofuels release GHGs like             adopted the Plan directeur de gestion des
carbon dioxide (CO2). However, these gases are not an               matières résiduelles – PDGMR (Waste
additional source of carbon in the atmosphere as are                Management Master Plan). The Plan
fossil fuels, since they would have been released in any            provides for all buildings of eight dwellings
case during the decomposition of the plant or animal                or less to be served by a source separated
matter. That is why they are not recorded in greenhouse
                                                                    collection of food residues. This measure
gas emission inventories and are considered to be zero
                                                                    of the Plan is underway and, in 2014, the
emission GHG fuels.
                                                                    food waste collection service was being
First generation biofuels are produced from plant                   offered to almost 100,000 households in
matter expressly cultivated for the purpose of producing            eight boroughs and, by the end of 2015,
biofuels (corn, beet, colza, sunflowers, etc.). Their use is        an additionnal 100,000 households will
controversial, since they use foods that could have served          also be served.
for human nutrition and, because of the laws of offer and
demand, they may increase the price of foodstuffs. The              The Stratégie montréalaise d’implantation
increased demand for these foodstuffs could also result in
                                                                    de la collecte des résidus alimentaires
the deforestation of some land to expand culture areas.
                                                                    2015-2019 (Montréal strategy for the
                                                                    implementation of the collection of food
Second generation biofuels are produced from plant waste
or residues. For example, biomethane can be produced                residues), announced by the municipal
from a municipality’s organic waste and, ultimately,                administration in August 2015 is intended
injected into the natural gas distribution network.                 to complete the implementation of the
                                                                    collection process in all buildings of eight
Third generation biofuels are produced from                         dwellings or less by 2019. The great majority
micro-organisms (algae or yeasts). This fuel stream is              of food residues will be processed in two
still at the development stage. It is not yet ready to be
                                                                    anaerobic digestion centres provided for
profitably exploited.
                                                                    in the Plan. This process allows for an
                                                                    important quantity of organic matter to be
Reduce the consumption
of fossil fuels for heating                                         recycled and to produce about 8 million m3
                                                                    of biomethane. This biogas can then be used
The fossil fuels used in residential, commercial and
                                                                    to replace fossil fuels.
institutional buildings are mainly used for the heating of
these spaces and of their water. To reduce their
consumption, two avenues can be considered:

1. replace the fossil fuels (oil and natural gas) by renewable energies (hydroelectricity, biomass, etc.);
2. reduce the consumption of fossil fuels by implementing energy efficiency measures.

                                                             10
TRANSPORTATION SECTOR
As mentioned in page 8, the transportation sector is responsible for 58% of the fossil fuels consumed in Québec.4
Consequently, this sector offers the greatest potential gains in terms of a reduction in the use of fossil fuels. Two
avenues are available to reduce fuel consumption in the transportation sector, both for the transportation of
passengers and goods:
1. favor transportation modes that consume less fuel on the basis of the distance travelled and by passenger or by
quantity of goods transported, such as public transit, active transportation (walking, cycling, etc.), carpooling,
electric vehicles, trains or boats;
2. reduce the distances to be travelled, for instance by developing more densely populated mixed-use
neighbourhoods, by encouraging telecommuting or reducing the distances to be travelled by goods by
prioritizing short distribution channels and local products.
PORTRAIT OF ENERGY CONSUMPTION IN
THE TRANSPORTATION SECTOR
Of all the energy consumed in the transportation sector in Québec, 97.6% comes from fossil fuels (96.6 % of
oil and 1.0 % of natural gas). The remaining 2.4 % is sourced from electricity. The figure below details the
breakdown of energy consumption between the transportation of passengers and goods, and by transportation
mode, irrespective of the energy sources.
ENERGY CONSUMED BY THE TRANSPORTATION SECTOR IN QUÉBEC IN 2012
160
Note: The quantity of energy by transportation mode was
140
estimated by applying the distribution by transportation mode
for 2011 to the total quantity of energy consumed in the
120 transportation sector in 2012 (these data are drawn from the
État de l’énergie au Québec 2015).
100 35
Goods Passengers
Petajoule (PJ
80
149
60
84 99 1
40
20 40
25 5 5 25 20
1 1 10
0 0.5
Car
s ks ks cks use
s sit es les ins ts ne ad
ruc ruc tru ol b ran bus cyc Tra Boa Pla -ro
ight t iumt eavy ho blic t rcity otor Off
L d H Sc pu Inte M
Me ity
er c
Inn
4. The data for Montréal are not available. Unless otherwise indicated, the data presented in this fact sheet are drawn from the État
de l’énergie au Québec 2015 produced by the Chaire de gestion du secteur de l’énergie of HEC Montréal (energie.hec.ca/publications/
etat-de-lenergie-au-quebec).
11TRANSPORTATION TRENDS
This section presents a few of the trends observed in
recent years in the transportation sector. The focus is on
road transportation, since more than 80% of the energy
consumed in the transportation sector in Québec is used
by various road vehicles.
The number of vehicles in circulation is increasing
and this, at a faster rate than that of the population.
For example, from 2006 to 2013, the number of private
passenger vehicles registered in Montréal increased
by 8.1%5, whereas the population increased by only
4.7 % in the same period6.
In Québec, since 1990, the distances travelled by
vehicles declined by 8 to 10% for all road vehicle
types, except for heavy trucks, whose average distance
travelled increased by 5%. Many factors, of which the
vigour of the economy, influence the distance travelled
by heavy trucks. Consequently, this distance can vary
significantly from one year to another.
Vehicles in the light truck category (sports utility vehicles
and crossover vehicles) are gaining in popularity and now represent a greater proportion of the vehicles in
circulation. In 1990, 64% of the vehicles registered on the Island of Montréal were automobiles and 14% were
light trucks, whereas in 2009, these proportions were respectively of 44% and 25%. The proportion of heavy
trucks is also on the increase, having progressed from 18% to 28% in the same period7.
The average consumption by vehicle has dropped. For private passenger vehicles on the Island of Montréal, this
has slightly compensated for the increase in the number and size of light vehicles (automobiles and light trucks).
However, because of the greater number of heavy trucks in circulation and the increase in the distance they
travel, the consumption of energy in road transportation is rising8, and this, even if this type of vehicle is the one
whose average consumption has improved the most, falling by 24% between 1990 and 2011 in Québec.
5. VILLE DE MONTRÉAL. “Nombre de véhicules en circulation”, Montréal en statistiques, [Online]. [ville.montreal.qc.ca/portal/page?_
pageid=6897,67889677&_dad=portal&_schema=PORTAL] (Consulted September 16, 2015).
6. INSTITUT DE LA STATISTIQUE DU QUÉBEC. Le bilan démographique du Québec, [Online], 2014 edition, Government of Québec.
[www.stat.gouv.qc.ca/statistiques/population-demographie/bilan2014.pdf] (Consulted September 16, 2015).
7. VILLE DE MONTRÉAL (2013). Inventaire 2009 des émissions de gaz à effet de serre de la collectivité montréalaise, Service de
l’environnement, 70 pages. Also available on the Internet at the following address: ville.montreal.qc.ca/pls/portal/docs/page/enviro_fr/
media/documents/invent_collectivite_2009_vf.pdf.
12MONTRÉAL SPECIFICITIES
Transportation of passengers
About one quarter of the population of Québec lives on the Island of Montréal. Such a population density in a
relatively small territory is a boon to public transit and active transportation. Indeed, it’s in Montréal that the
proportional use of these transportation modes is the greatest in the Montréal Metropolitan region.
PROPORTION OF TRAVEL BY PUBLIC TRANSIT AND ACTIVE TRANSPORTATION
IN THE GREATER MONTRÉAL REGION
MORNING RUSH HOUR COMPLETE DAY
PUBLIC TRANSIT ACTIVE TRANSPORTATION PUBLIC TRANSIT ACTIVE TRANSPORTATION
Montréal 26.0% 14.5% 24.0% 17.5%
Longueuil 20.6% 7.3% 13.9% 7.8%
Laval 18.8% 5.2% 12.9% 5.4%
South shore 7.5% 6.9% 4.8% 6.7%
North shore 6.6% 5.9% 4.3% 6.0%
Source: SECRÉTARIAT À L’ENQUÊTE ORIGINE-DESTINATION. Mobilité des personnes dans la région de Montréal. Enquête Origine-Destination 2013, [Online],
version 13.2a. [www.amt.qc.ca/Media/Default/pdf/section8/enquete-od-2013-mobilite-personnes-region-montreal.pdf] (Consulted September 21, 2015).
However, a picture of the territory of the Island in Montréal is far from being consistent. The central
neighbourhoods are the most densely populated with a greater mixed-uses (dwellings, schools, businesses,
work locations, etc.). The neighbourhoods in the eastern and western ends of the island are mainly comprised of
residential sectors and some industrial areas less conducive to the use of public transit and active transportation.
The table below presents the proportion of travel made by public transit and active transportation in different
sectors of the Island of Montréal.
PROPORTION OF TRAVEL BY PUBLIC TRANSIT AND ACTIVE TRANSPORTATION IN THE CENTRE,
EAST AND WESTERN SECTORS OF THE AGGLOMERATION OF MONTRÉAL
MORNING RUSH HOUR COMPLETE DAY
PUBLIC TRANSIT ACTIVE TRANSPORTATION PUBLIC TRANSIT ACTIVE TRANSPORTATION
Centre of Montréal 29.0% 18.2% 27.7% 21.8%
East end of Montréal 24.0% 10.7% 20.0% 11.0%
West end of Montréal 21.0% 7.2% 16.0% 6.6%
Source: SECRÉTARIAT À L’ENQUÊTE ORIGINE-DESTINATION. Mobilité des personnes dans la région de Montréal. Enquête Origine-Destination 2013, [Online],
version 13.2a. [www.amt.qc.ca/Media/Default/pdf/section8/enquete-od-2013-mobilite-personnes-region-montreal.pdf] (Consulted September 21, 2015).
13Transportation of goods
There are generally more goods being transported on the territory of Montréal than elsewhere in Québec. Indeed,
Montréal is a hub for the transportation of goods in North America, thanks to its port, its rail network belonging
to the two most important railway companies in the country and its highway network. Consequently, many goods
simply pass through Montréal without ever stopping on the island. Furthermore, the Québec distribution system
of many companies relies on Montréal as a distribution centre. Goods are transited through Montréal warehouses
before being redistributed to stores or directly to consumers elsewhere in Québec.
LIMITS TO THE POWERS OF VILLE DE MONTRÉAL
Governance
Most measures that aim to reduce the consumption of fossil fuels in the transportation sector require the
collaboration of many players for their implementation. Consequently, in many cases, the City will need to work
collaboratively with the players involved (provincial and federal government, municipalities, boroughs, etc.) to
implement projects of that nature.
Financing
Structuring measures in the field of transportation are measures that need to be implemented over the
medium and long term. To be successful, these measures require an adequate, stable and sustainable financing.
The sources of revenues of cities are presently limited. In Québec, these sources are established in the Loi sur les
cités et villes (Cities and Towns Act). Their revenues are mainly derived from property taxes.
14PLANNED MEASURES BY VILLE DE MONTRÉAL
The City’s vision for transportation consists in: “Offering the means of transportation to meet the needs of
all Montrealers and making their agglomeration a pleasant place to live, a prosperous economic pole while
respecting the environment. Toward this purpose, Montréal wishes to significantly reduce the use of personal
vehicles through massive investments in public transit and active transportation such as the tramway, metro,
performing bus, train, cycling and walking, and other better adapted uses of the automobile such as carpooling,
car-sharing and the taxi.” (Plan de transport (Transportation plan) 2008)
Montréal’s urban planning documents and planning bylaws as well as its associated program of public
investments all contribute, directly or indirectly, to the objective of reducing its dependence on fossil fuels.
These documents are based on orientations and objectives that are predicated upon the development of
public transit and active transportation (cycling, walking), the offering of an efficient public transit service
in employment sectors, the densification and diversification of the land use of the territory, the creation or
maintenance of quality and complete environments. In sum, the intent is to attract and retain households in
various Montréal neighbourhoods and thus reduce their dependence on the automobile.
The Schéma de développement et d’aménagement de l’agglomération de Montréal (Montréal agglomeration
planning and development scheme) (Scheme) in force since 2015, the Plan d’urbanisme de la Ville de Montréal
(Montréal Master Plan) (2004, revision expected in 2016) and the Plan de transport (Transportation plan (2008,
also being revised)) all resolutely focus on reducing the dependence on the automobile. By the same token,
the Plan de réduction des émissions de gaz à effet de serre de la collectivité montréalaise 2013-2020 (Plan to
reduce the greenhouse gas emissions of the Montréal community) suggests nine possible solutions to reduce the
transportation sector’s dependence on fossil fuels, as outlined in the table below.
ANTICIPATED REDUCTION
POSSIBLE SOLUTIONS
(kt CO2-eq) *
1. Adequately finance GHG emission reduction projects in the field of transportation Unquantifiable
2. Collect data allowing for a better assessment of factors influencing GHG emissions
Unquantifiable
in transportation and of the measures to reduce them
3. Develop public transit
4. Optimize parking
437
5. Manage the demand for transportation in an efficient fashion
6. Develop active transportation
7. Develop alternate means of transportation to solo driving (car-sharing and taxi) 0**
8. Reduce GHG emissions by vehicle 22
9. Facilitate the governance of transportation projects Unquantifiable
* Anticipated reduction relative to a business-as-usual scenario if the reduction measures are implemented by 2020.
** No supplementary reduction expected; this is the reference scenario for 2020.
15For each potential solution, the sections hereafter detail the suggested measures.
1) Adequately finance GHG emission reduction projects in the field of transportation
As indicated previously, an efficient reduction of GHG emissions in the field of transportation is predicated
upon sufficient financing from many sources: the federal and provincial governements, municipalities, boroughs,
public transit agencies, etc. Among the funding levers available are the increase in the provincial budget
dedicated to transportation, an increase in the gas tax and an indexation of vehicle registration taxes based on
vehicles’ cylinder capacity.
2) Collect data allowing for a better assessment of factors influencing GHG emissions
in transportation and of the measures to reduce them
Many means can be used to collect data allowing for a better understanding of mobility behavior and its impacts
on GHG emissions. For example, the documentation accompanying the invoice for residential property transfer
rights could include a link to an electronic survey on the travel patterns of the concerned households and the
impact of their move on said patterns. The following information could be requested:
• the reasons for their move;
• their present and previous address;
• their present and previous place of employment if it has changed;
• information on the persons forming the present and previous household, if there have been
any changes, and on their motorization.
During the development of new neighbourhoods, a survey similar to the regional Origin-Destination (OD) survey
could be administered to residents. It is worthwhile mentioning that the Direction des transports of Ville de
Montréal has started to assess the impacts of a few property development projects on mobility behavior. Similar
information could also be collected from tenants, since 62% of households in the agglomeration are tenants.
3) Develop public transit
Many measures, ongoing or under discussion, aim to develop public transit in Montréal:
• sustained increase in the municipal contribution to the STM since 2008 ($409 M in 2015) allowing it to
substantially enhance its service offering (+26% between 2006 and 2014) and resulting in a 15% increase
of passenger traffic over the same period;
• implementation of 375 additional km of preferential measures for buses that already cover more than
200 km on the Island of Montréal;
• implementation of a bus rapid transit (BRT) on the Pie-IX Blvd. axis;
• extension of the blue metro line (5 stations), then of the orange line (3 stations) on the Island of Montréal;
• implementation of new train systems (light rail transit (LRT) or tram-train) between the downtown district
and the western end of Montréal, and also from Angrignon station to LaSalle, Lachine and Dorval, including
a shuttle between downtown Montréal and the airport;
• design of local mobility plans, for the boroughs and municipalities, that reflect the orientations of the
Scheme and the Transportation plan at the local level, in order to ensure the tranquillity and safety of
residential neighbourhoods, while improving access to the major activity poles.
164) Optimize parking
The Transportation plan promotes the elaboration of a parking policy for the territory of the agglomeration.
The City will be adopting a parking policy by the end of 2015. The draft policy will be subjected to a public
consultation by the Commission sur les transports et les travaux publics. The strategic management of parking is a
tool that cities can use to nurture reliance on public transit and active transportation.
5) Manage the demand for transportation in an efficient fashion: develop and sustain
the density and diversity of the urban fabric
The urban fabric of the agglomeration is different from that of the rest of the Metropolitan Region owing to
various residential neighbourhoods with a greater density. This form of urbanization allows for a reduction of
infrastructure costs, a closer proximity between residential sectors and collective equipment, services and places
of employment, and the exploitation of an efficient public transit system, while promoting active commutes and
reducing the dependence on the automobile.
The Scheme supports interventions that improve the living environment, from a sustainable development point of
view. The sustainable vision of the territory’s planning and development relies on three key orientations, of which
the first two, that are related to a more efficient management of the demand for transportation, aim to:
• foster a quality living environment;
• support the vitality of the agglomeration and the centre of the metropolis;
• showcase areas of interest.
Credit: © Lissandra Melo, Shutterstock.com
17Foster a quality living environment
The vision of the Scheme favours the “compactness” of activities and the diversity of neighbourhoods, the
proximity of services and places of employment as well as the quality of the architecture and development of
public spaces. The organization of the living environment aims to minimize commuting and prioritize urban transit
and active transportation, in an environment where constraints and nuisances are mitigated.
Support the vitality of the agglomeration and the centre of the metropolis
Accessibility also contributes to the vitality of the agglomeration and, in this respect, the Scheme intends to implement
various projects that focus both on the road network and public transit, while promoting walking and cycling.
The Scheme encourages interventions that purport to reduce dependence on the automobile and that contribute
to the diversification and intensification of the activities of the central sectors, while favouring an urban intensity
sufficient to support a public transit network on the outskirts. Cycling, for the purpose of commuting, is a distinctive
feature of Montréal, particularly in the central neighbourhoods. Both the Scheme and the Master plan encourage
developments that favour active commutes, whether walking or cycling, as well as short commutes to access points
to the public transit system.
The Scheme also proposes a set of interventions, in the
short to long term, that focus both on public transit and
road transportation, and will be detailed in the upcoming
revision of the Transportation plan by 2017. These projects
are intended to improve the accessibility of the major
poles of economic activity in the Centre, east end and
west end of the Island by favouring public transit and
active transportation. The Scheme proposes, by 2021,
that 55% of the commutes of the agglomeration’s
residents, during the morning rush hour, be done by public
transit and active transportation (compared to 47% in
2008). Also, the proportion of commutes by public transit
will rise from 32% to 37%, while those relying on active
transportation (walking and cycling) will ramp up from
15% to 18%. The interventions conducted in the public
domain will need to focus on user friendliness and the
safety of pedestrians and cyclists.
Furthermore, the City is studying the development of an
advanced logistic pole in the L’Assomption Sud sector.
The objective is to regroup the players involved in the
Montréal field of logistics around the port’s properties
to enhance the productivity of their activities and
considerably lessen the circulation of the trucks of these
Crédit : © Société de transport de Montréal
logistic companies that are located far from the port. This
would result in a significant decrease of the GHG emitted
by the trucking industry.
18Densify the occupation of the territory
In accordance with the Metropolitan land use and development plan, whose objective is to direct 40% of the
increase in the number of households toward access points to the public transit system, the Scheme supports the
densification of the territory near train and metro stations in the long term. Three objectives have been established:
• consolidate the urban compactness of the central territory of the agglomeration;
• support the intensification and diversification of urban activities in priority sectors on the outskirts
of the central territory;
• strengthen the urbanization of the agglomeration’s extremities.
To ensure that the densification targets are met, reports will indicate the number of dwellings by gross hectare
of the projects realized on all of the agglomeration’s territory. Through its various orientations and interventions
in housing, the City is consolidating its urban space for the purpose of offering an alternative to urban sprawl
and can participate in reducing the potential consumption of fossil fuels. The City’s current interventions, among
other objectives, aim to:
• influence the choice of a greater number of families to stay in Montréal, particularly through measures
for property purchase assistance and measures fostering the construction of large lodgings;
• foster the conservation of the existing lodging stock through financial incentives for renovation works;
• develop residential neighbourhoods where residents are pleased to live and grow, through the valorization
of existing neighbourhoods and the planning of new neighbourhoods, in collaboration with public and
private stakeholders (school boards, child-care centres, healthcare providers, etc.);
• promote living in Montréal through promotional campaigns on the Web and with employees of major
institutions.
Companies’ participation
Companies can also contribute to the management of their employees’, clients’ and users’ demand for
transportation by a company demand management program. By defraying the costs of their employees’ public
transit fares, companies may benefit from a tax deduction of up to 200%8.
6) Develop active transportation
Many means can be used to grow the proportional use of active transportation. Here are a few examples.
• Design projects that foster the practice of cycling, for instance:
» the extension and updating of the bicycle network;
» adapted facilities near congestion points of the network, for example ‘bicycle boulevards’ (steets that
prioritize cycling over motoring), and in accident prone locations, for example bike boxes;
» safe, interior or exterior, parking spaces for bicycles in public spaces and on private properties;
» adapted bus stops near bicycle paths.
8. CHAMBRE DE COMMERCE DE L’EST DE MONTRÉAL. Déduction d’impôt pouvant aller jusqu’à 200 % de l’investissement de
l’employeur en transport collectif, [Online]. [www.ccemontreal.ca/node/500] (Consulted September 16, 2015).
19• Substantially increase the capacity of the public transit system to accommodate bicycles.
• Encourage taxis to be equipped with bicycle racks, which could turn out to be an interesting
commercial opportunity for taxi drivers to develop a new clientele whose transportation mode is
compatible with the use of taxis.
• Continue to develop and maintain the bicycle network to encourage cycling year-round and leave
bicycle stands in place during the winter.
• Multiply the points of contact with nature (greening, fountains and other water uses) to make
the journey more interesting for pedestrians and cyclists.
Many measures have been implemented to attain this objective:
• the adoption of a Charte du piéton (Pedestrian charter) within the Transportation plan, which establishes
the primacy of the pedestrian in the transportation system;
• the launching of a program of Quartiers verts (Green neighbourhoods) promoting the creation of living
environments favorable to the use of public transit and active transportation modes, chosen by local
stakeholders and the boroughs;
• the launching of a bike-share system in 2009 (BIXI), which now includes 5,120 bicycles and more than
400 stations, while ensuring a recurring financing;
• the sustained expansion of the bicycle network which increased from 417 km to 680 km between
2007 and 2014. During the reviews of the Transportation plan, 600 new kilometres of bicycle pathways
were identified, leading to a new objective of 1,280 km. The work scheduled for 2015 alone will result in
the addition of 50 km.
7) Develop other alternate means of transportation to solo driving (car-sharing and taxi)
The City continues its deployment of alternate means of transportation to solo driving in order to reduce the
dependence on the automobile and the volume of traffic. One of the factors that currently curtails the development
of car-sharing is the lack of parking spaces. Possible solutions to mitigate this situation could include the leasing,
at a reasonable price, of strategically located parking spaces to car-sharing companies.
However, the installation of bicycle racks on taxi vehicles, as suggested in the previous section, could allow taxis
to tap the cycling clientele.
8) Reduce GHG emissions by vehicle
To reduce GHG emissions by vehicle, two possible solutions can be entertained: ensuring an improvement
in the energy efficiency of gas powered vehicles and promoting the electrification of transportation.
Ensuring an improvement in the energy efficiency of gas powered vehicles
The following measures could be implemented:
• pursue the application of existing rules and the implementation of announced rules limiting the
consumption of new vehicles through the imposition of a standard for car manufacturers (responsability
of the federal government);
• apply a bonus-malus system that penalizes buyers of light vehicles that consume more than
5 L/100 km and rewards buyers of vehicles that consume less than that threshold.
20Promote the electrification of transportation
Ville de Montréal has elaborated a transportation electrification strategy that builds on the orientations
described in the Plan d’urbanisme (Master plan), Transportation plan and the Plan de développement durable
de la collectivité montréalaise 2010-2015 (Sustainable development plan). The major thrusts of the City’s
transportation electrification strategy are four-pronged:
1. Electrification of the buses of the Société de transport de Montréal (STM):
• the acquisition of 650 hybrid buses by 2020;
• the implementation of a dynamic recharging electric bus line (modern trolleybus equipped with batteries
allowing for the elimination of cables on certain line segments);
• the trial of fast conduction recharging electric buses (Cité mobilité project) in 2016.
2. The conversion of the fleet of municipal combustion vehicles to electric vehicles.
3. The setting up of a self-service electric car system:
• Montréal launched (June 29, 2015) a call for interest to companies to implement, as soon as 2016,
1,000 charging stations to allow the deployment of a fleet of 1,000 self-service electric vehicles.
4. Sustained collaboration between the City and its government partners:
• continue working with governments to implement measures to foster the development of electric
technologies in public transit as well as programs facilitating the purchase of electric vehicles.
Credit: © Société de transport de Montréal
21Simultaneously, the City’s Service de développement économique is studying the possibility of developing a
transportation electrification pole. The phases of the feasibility study are the following:
• assess the scope of the City’s, boroughs’, AMT’s and STM’s fleet of vehicles for which a first order would
give birth to a transportation electrification industrial sector;
• progressively electrify all of the City’s vehicles and act as a test bed for the new companies within that sector;
• describe the hypothetical chain of companies in that sector;
• support the launch of companies to complete that chain, of which a part assembly plant;
• reinvigorate an industrial park by installing the transportation electrification sector therein;
• in partnership with Hydro-Québec, finance the installation of electric charging stations on the City’s territory.
Credit: © Yves Provencher, Journal Métro
9) Facilitate the governance of transportation projects
As was previously mentioned, the issue of transportation in Montréal involves many stakeholders, including the
federal and provincial governments, the municipalities of the Communauté métropolitaine de Montréal (CMM),
the Montréal boroughs and the authorities that manage transportation activities. Consequently, cross-functional
efforts and a close coordination between these stakeholders is essential to reduce the transportation sector’s
dependence on fossil fuels.
22BUILDING SECTOR
As mentioned in page 8, 14% of the fossil fuels consumed in Québec are used in the heating of commercial
and institutional buildings and 5% in the heating of residential buildings9. Some gains in terms of reduced
fossil fuel consumption can still be achieved in these fields, although they are far inferior to the potential
gains that can be achieved in the transportation sector. The fossil fuels used in buildings mainly serve to heat
the buildings and water (a small proportion is used in the kitchen). To reduce their consumption, two possible
solutions can be contemplated:
1. replace the fossil fuels (oil and natural gas) by renewable energies (hydroelectricity, biomass, etc.);
2. reduce the consumption of fossil fuels by implementing energy efficiency measures.
ENERGY CONSUMPTION PORTRAIT IN THE BUILDING SECTOR
In the commercial and institutional building sector, 42% of the total energy consumed is derived from fossil fuels
(37% from natural gas, 3% from light oils and kerosene, 2% from propane and 0.4% from heavy oils). Distribution
of energy consumption (irrespective of the form of energy) by activity in the commercial and institutional sector is
presented in the figure below. In the residential building sector, only 15% of the total energy consumed is derived
from fossil fuels (7% from natural gas and 8% from fuel oil).
ENERGY CONSUMED, IRRESPECTIVE OF THE FORM OF ENERGY, IN THE QUÉBEC
COMMERCIAL AND INSTITUTIONAL SECTOR BY TYPE OF ACTIVITY IN 2012
80
Note: The quantity of energy by type of activity was estimated
70
by applying the distribution by type of activity for 2011 to
the total quantity of energy consumed in the commercial and
60 institutional sector in 2012 (these data were also drawn from
the État de l’énergie au Québec 2015).
50
Petajoules (PJ)
40 80
30
20 38
33
28
10 19
14
7 7 7 5
0
Offices Retail Teaching Health Food and Bulk trade Transportation Information Arts, Other
businesses services & social lodging businesses & storage & culture entertainment services
services industry & leisure
9.The data for Montréal are not available. Unless otherwise indicated, the data presented in this fact sheet are drawn from the État
de l’énergie au Québec 2015 produced by the Chaire de gestion du secteur de l’énergie of HEC Montréal (energie.hec.ca/publications/
etat-de-lenergie-au-quebec).
23BUILDING TRENDS
Commercial and institutional sector
In Québec, although the energy intensity (energy consumed per square metre) of businesses and institutions has
declined by 19% between 1990 and 2012, the increase in floor area of businesses and institutions (+41%) has
resulted in an increase of 13% in energy consumption over the same period.10
Residential sector
In Québec, although the energy intensity of dwellings has declined by 27% between 1990 and 2011, the
increase in their size (+14%) and their number (+32%) has brought about a rise of 9% in energy consumption over
the same period.
The increase in the number of dwellings
is partly explained by a lower average of
the number of persons comprising a
household. In 1991, still in Québec, 56% of
households were composed of one or two
persons, whereas in 2006, their proportion
grew to 65%.11
The use of fossil fuels for residential heating
purposes is on the wane. In fact, many oil
heating systems have been replaced by
electric heating systems in the last decades.
Between 1990 and 2011, the sector’s oil
consumption has dropped from 66 to 27 PJ,
or from 19 to 8% of the sector’s total energy
consumption. Natural gas consumption
has been rather stable. Over the past few
years, it has even enjoyed a slight growth in
popularity given its affordable price.
10. NATURAL RESOURCES CANADA. Commercial/Institutional sector, Québec. Table 1: Secondary energy use and GHG emissions by
energy source, [Online], Office of Energy Efficiency, Government of Canada. [oee.nrcan.gc.ca/corporate/statistics/neud/dpa/showTable.
cfm?type=CP§or=com&juris=qc&rn=1&page=3] (Consulted September 21, 2015).
11. SOCIÉTÉ D’HABITATION DU QUÉBEC (2012). L’évolution démographique et le logement au Québec : rétrospective 1991-2006 et
perspectives 2006-2056, [Online], 146 pages. [www.habitation.gouv.qc.ca/fileadmin/internet/publications/0000021500.pdf] (Consulted
September 21, 2015).
24MONTRÉAL SPECIFICITIES
Commercial and institutional sector
Proportionally to its population, the agglomeration of Montréal has a large number of businesses and institutions.
In fact, 24% of the population of Québec lived on the Island of Montréal in 201112, whereas its industries,
commercial establishments and institutions accounted for 35% of Québec’s gross domestic product13.
Residential sector
In Montréal, the average energy consumption of dwellings is lower than elsewhere in Québec. This is explained by
the smaller size of Montréal dwellings and their particular types. In fact, the smaller the dwelling, the less energy
it requires for heating purposes. Also, apartments and, to a lesser extent, semi-detached homes have a smaller
proportion of their walls exposed to outdoor air than detached homes, which limits heat losses. On average in
Québec, in 2012, a detached home consumed 140 GJ14, all energy sources combined, whereas an apartment
only consumed 68 GJ15. However, the territory of the Island of Montréal is far from being uniform. The central
neighbourhoods are those that include a greater proportion of small dwellings and of dwellings of the apartment
or semi-detached home type. The neighbourhoods of the east and west ends of the Island have a greater proportion
of larger dwellings and of detached homes.
12. INSTITUT DE LA STATISTIQUE DU QUÉBEC. Le bilan démographique du Québec, [Online], 2014 edition, Government of Québec.
[www.stat.gouv.qc.ca/statistiques/population-demographie/bilan2014.pdf] (Consulted September 21, 2015).
13. VILLE DE MONTRÉAL. “Profil sectoriel : Ensemble des secteurs d’industrie de l’agglomération de Montréal”, Montréal en
statistiques, [Online], May 2014. [ville.montreal.qc.ca/pls/portal/docs/PAGE/MTL_STATS_FR/MEDIA/DOCUMENTS/PS_ENSEMBLE%20
DES%20SECTEURS%202013_0.PDF] (Consulted September 21, 2015).
14. NATURAL RESOURCES CANADA. Residential sector, Québec. Table 2: Residential single detached Secondary Energy Use by Energy
Source and End-Use, [Online], Office of Energy Efficiency, Government of Canada.[oee.rncan.gc.ca/corporate/statistics/neud/dpa/
showTable.cfm?type=HB§or=res&juris=00&rn=2&page=3] (Consulted September 21, 2015).
15. NATURAL RESOURCES CANADA. Residential sector, Québec. Table 4: Residential apartments Secondary Energy Use by Energy
Source and End-Use, [Online], Office of Energy Efficiency, Government of Canada.[oee.nrcan.gc.ca/corporate/statistics/neud/dpa/
showTable.cfm?type=CP§or=res&juris=qc&rn=38&page=3] (Consulted September 21, 2015).
25LIMITS TO THE POWERS OF VILLE DE MONTRÉAL
Jurisdiction
In Québec, the construction standards in force are stipulated in the Québec Construction Code (QCC), the
responsibility of the Régie du bâtiment du Québec (RBQ). Ville de Montréal has adopted the QCC while adapting
it to the particularities of Montréal’s built environment, when warranted, through its By-law concerning the
construction and conversion of buildings (Bylaw 11-018).
In 2012, the RBQ introduced, for the first time in the Code, a chapter on energy efficiency (chapter 11 of the QCC).
Since then, the RBQ ensures that all new small (three floors or less or eight dwellings or less) residential buildings
are built according to the thermal insulation and air leakage standards equivalent to the Novoclimat standard.
New medium and large sized residential buildings, a common occurrence in Montréal, are not yet subject to this
standard. In its GHG reduction plan, the City has requested of the RBQ that it continue to complement the Code’s
regulations on energy efficiency to include the buildings that are not yet subjected to chapter 11 of the Code.
Energy conservation programs
Energy conservation is a good thing. It is “a driver of competitiveness, growth and economic wealth.”16 However,
in terms of reduced dependence on fossil fuels, the gains that can be achieved by relying on energy conservation
in buildings alone are limited. As a reminder, less than 20% of the fossil fuels consumed in Québec are used in the
residential, commercial and institutional building sector. Moreover, implementing energy efficiency measures only
allows for a partial reduction of energy consumption, never of its integrality. Finally, if an energy efficiency program
targets all buildings, irrespective of the energy source that is used, many of the energy consumption reductions will
impact hydroelectricity, a renewable energy.
16. WHITMORE, Johanne and Pierre-Olivier PINEAU (2015). État de l’énergie au Québec, [Online], HEC Montréal, Chaire de gestion du
secteur de l’énergie de HEC Montréal. [energie.hec.ca/publications/etat-de-lenergie-au-quebec] (Consulted September 14, 2015).
26PLANNED MEASURES BY VILLE DE MONTRÉAL
To reduce dependence on fossil fuels in the building sector, the Plan de réduction des émissions de gaz à effet de
serre de la collectivité montréalaise 2013-2020 (Montréal Community plan to reduce greenhouse gas emissions)
includes three potential solutions, as outlined in the table below.
POSSIBLE SOLUTIONS ANTICIPATED REDUCTION (kt CO2-eq)
1. Improve buildings’ energy efficiency 571
2. Reduce fuel oil consumption 710
3. Encourage the use of renewable energies Unquantifiable
For each potential solution, the sections hereafter detail the suggested measures.
1) Improve buildings’ energy efficiency
• Create an Energy efficiency fund for renovation projects that integrates energy efficiency in commercial and
institutional buildings whose loans would be reimbursable through the energy savings achieved.
Subsidy programs for residential construction and renovation
In terms of residential construction and renovation, the City’s subsidy programs include measures that promote a
greater energy efficiency in buildings while integrating, in certain cases, the Novoclimat construction standards of
the Bureau de l’efficacité et de l’innovation énergétiques du Québec. Although these standards do not prevent the
targeted buildings from having a fossil fuel heating system (heating oil, natural gas or dual energy), the thermal
insulation and air leakage factors of Novoclimat buildings result in a significant reduction in energy consumption.
More specifically, the City integrates in its interventions on buildings provisions that promote sustainable
development and a more responsible use of energy resources, for example:
• within its renovation programs, requirements for certain energy efficient materials and greater
financial assistance if energy efficiency measures are in place and, in particular, financial assistance
for the installation of a complete electric heating system if the heating system in place is not electric;
• within its property purchase assistance program, measures that facilitate the purchase of a new dwelling
that is compliant with the Novoclimat energy efficiency program and LEED certified;
• the integration of Novoclimat standards in the building of social housing.
27You can also read