PRACTICAL DEVELOPMENT OF A ZNBR2 FLOW BATTERY WITH A FLUIDIZED BED ANODE ZINC-ELECTRODE - IOPSCIENCE
←
→
Page content transcription
If your browser does not render page correctly, please read the page content below
Journal of The Electrochemical
Society

OPEN ACCESS

Practical Development of a ZnBr2 Flow Battery with a Fluidized Bed
Anode Zinc-Electrode
To cite this article: Ibitoye Adelusi et al 2020 J. Electrochem. Soc. 167 050504

View the article online for updates and enhancements.

                                 This content was downloaded from IP address 176.9.8.24 on 03/03/2020 at 22:25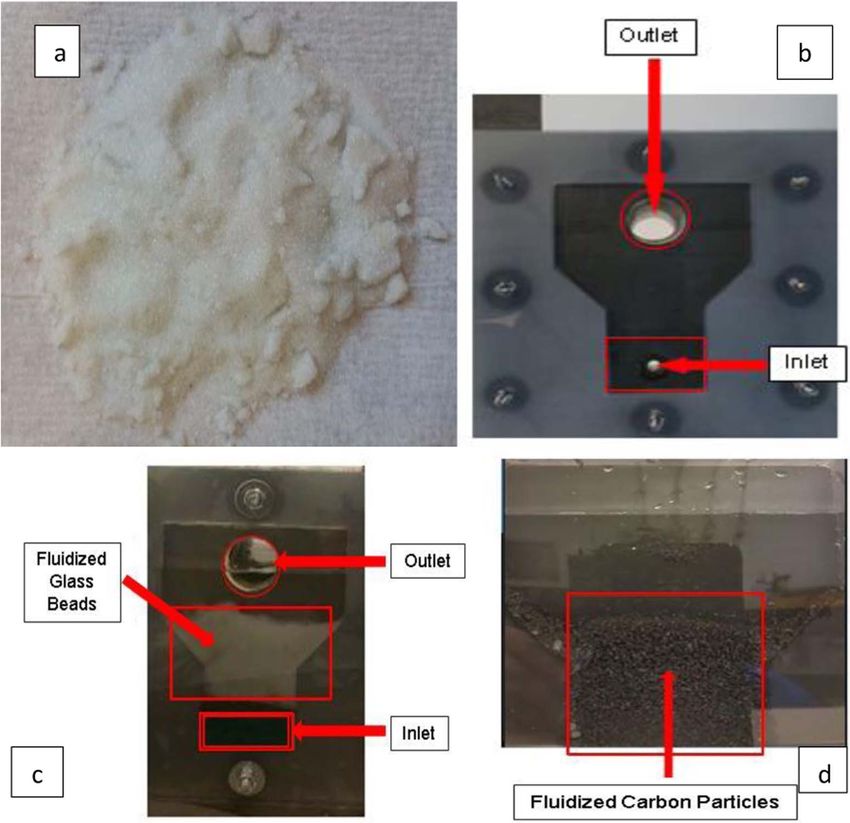
Journal of The Electrochemical Society, 2020 167 050504

                             Practical Development of a ZnBr2 Flow Battery with a Fluidized
                             Bed Anode Zinc-Electrode
                                                        z                                                                                                  ∗
                             Ibitoye Adelusi,               Amaechi Chiemela Victor,            Fabrice Andrieux,            and Richard Dawson
                             Lancaster University, Engineering Department, Lancaster University, Bailrigg, Lancaster LA1 4YW, United Kingdom

               The penetration of renewable sources (solar and wind power) into the power system network has been increasing in the recent years.
               As a result of this, there have been serious concerns over reliable and satisfactory operation of the power systems. One of the solutions
               being proposed to improve the reliability and performance of these systems is to integrate energy storage devices into the power system
               network. Zinc-bromine batteries systems among other energy storage technologies has appeared as one of the best options. This paper
               presents the performance of three different electrodes feeder materials (carbon, nickel and a titanium) coupled and investigated within
               a fabricated ZnBr2 cell system via numerical modelling, DDPM+DEM model in ANSYS Fluent to simulate an incorporated anode
               zinc-electrode and COMSOL Multiphysics for the electrochemical behavior of the cell. After introducing briefly other alternatives
               to store energy, ZnBr2 cell systems, and its mode of operation were then discussed, before focusing on the numerical modelling
               and simulation and the laboratory experiments. Several extensive electrochemical experiments were implemented on the cell to
               achieve fast deposition of zinc onto the electrode surface during charge and fast dissolution during discharge for high performance.
               The mechanical action of the fluidised design of electrode is intended to improve deposit morphology, obviate the risk of dendrite
               growth and provide high transport rates of reactant to and from the active electrode surface. In conclusion, this paper has analyzed
               electrochemical techniques like chronopotentiometry, cyclic voltammetry (CV), and electrochemical impedance spectroscopy that
               were used to understand the behavior of the zinc bromide cells at a particular flow rate of 166.7cm3 min−1 required to give good
               fluidization of the anode.
               © The Author(s) 2019. Published by ECS. This is an open access article distributed under the terms of the Creative Commons
               Attribution 4.0 License (CC BY, http://creativecommons.org/licenses/by/4.0/), which permits unrestricted reuse of the work in any
               medium, provided the original work is properly cited. [DOI: 10.1149/2.0112005JES]

               Manuscript submitted July 25, 2019; revised manuscript received November 18, 2019. Published December 11, 2019. This paper is
               part of the JES Focus Issue on Heterogeneous Functional Materials for Energy Conversion and Storage.

    Energy storage is critically important to enable balancing power                      In order to solve these problems, the explored experimental works
generation and consumption, especially in the context of renew-                       in this study using ANSYS for modelling the hydrodynamic flow rate
able energy innovation, such as promoting energy distribution and                     and validating the results with the laboratory hydrodynamic experi-
management.1–20,21–24 Many renewable energy sources rely on inter-                    ment and also using COMSOL to study the potential difference be-
mittent phenomena (wind, solar, etc.), which makes it difficult to pre-               tween the electrodes, the potential difference etc; was carried out.
dict and regulate the output to fit in with demand. The different types of            Since optimizing zinc-bromine batteries cells are important to correct
energy storage systems being developed for various energy sources25                   these problems, zinc ions deposition were impinged onto the electrode
are solid state batteries, flow batteries, flywheels, compressed air en-              surface that cause deterioration and mechanical abrasion for these
ergy storage, thermal and pumped hydro power. To assist with under-                   cells. As a result of this, it is necessary to improve the performance
standing various strategies currently been used to store energy around                and the uptake of ZnBr2 cells systems for utility-scales electrical stor-
the world, energy storage technologies can been divided into four main                age system34–37 by introducing fluidized bed zinc electrodes to these
categories. These are: Electrical Energy Storage (e.g. supercapaci-                   cells anode-sides as the only electroplating devices that could prevent
tors, superconducting magnetic energy storage), Mechanical Energy                     dendrites formation.
Storage (e.g. pumped hydro, compressed air, flywheel), Chemical En-                       In this paper, both the numerically modelled and experimented
ergy Storage (e.g. batteries, redox flow batteries, hydrogen fuel cells               fluidized bed electrode presented here has the capacity to accommo-
and metal-air batteries, solar fuels16–24 ), and Thermal Energy Storage               date the incorporated carbon particles which were charged and plated
(e.g. sensible heat storage, latent heat storage, thermochemical heat                 separately on the three investigated three different electrodes feeders’
storage.4,8,16,26–29 ).                                                               materials (carbon vs carbon), (nickel vs carbon) and (nickel vs tita-
    However, zinc-bromine redox flow batteries (ZnBr2), among other                   nium). The zinc electrode used was designed to have high surface area
alternatives mentioned for storing energy are recommended and reli-                   with no solid surface, when compared to some electrodes from other
able to use for storing energy from renewable energy sources; such as                 literatures.38–40 From this study, conclusions drawn highlight the nov-
wind and solar because of their significant benefits above conventional               elties of the proposed method, the peculiarities of the models applied
technologies. These include high energy densities, low costs, high effi-              and the efficiency output of the developed battery.
ciencies and power rating, long life cycles of more than 2000 sequences
and, the capacity to operate these batteries with different applications
in a wide range of various environments, etc.26,30 Regardless of all                                 Fluidized Bed Zinc-Reactors (Electrodes)
these benefits, dendritic growth during cycling in ZnBr2 cells is the
main limitation of zinc-bromine batteries cells because it does not only                  Several fluidized bed reactors are currently in use for multiple ap-
lead to perforation of the membrane but can short-circuit the cell and                plications in chemical and engineering industries; such as a sprouted
enhances hydrogen evolution and electrode passivation.31–33 Dendrites                 fluidized bed reactor of the literature by,41 like that of continuous
formation normally occur during charge when zinc is reduced onto the                  stirred tanks fluidized bed reactors,42 tubular loop reactors,43 fluidized
cell electrode surface and stay longer on these electrodes more than                  bed reactors,44 circulating fluidized bed reactors,45 transport fluidized
the expected time before they are re-oxidized back into the solution.                 beds reactors, and fluidized bed zinc electrodes as other types widely
Such process thus causes the deterioration of the electrode and make                  in use for different electroplating purposes within batteries cells.
the battery cell to decay, short circuit the cell, reduce these cells life                Mostly, and according to,46 zinc half-cell of zinc-bromine bat-
span, and damage them.                                                                teries cells behave hugely like an electroplating system for improv-
                                                                                      ing zinc-electrodes. Furthermore, zinc-electrodes have been exam-
                                                                                      ined in rechargeable zinc-air batteries of an outer frame and a porous
                                                                                      foam electrode of supporting structures; to address the formation of
  ∗ Electrochemical Society Member.                                                   zinc dendrites on external surfaces. The outer casing has a pathway
  z
    E-mail: ibitoyea@hotmail.com; i.adelusi@lancaster.ac.uk                           where the electrolyte circulates to the treated zinc coated porous foam.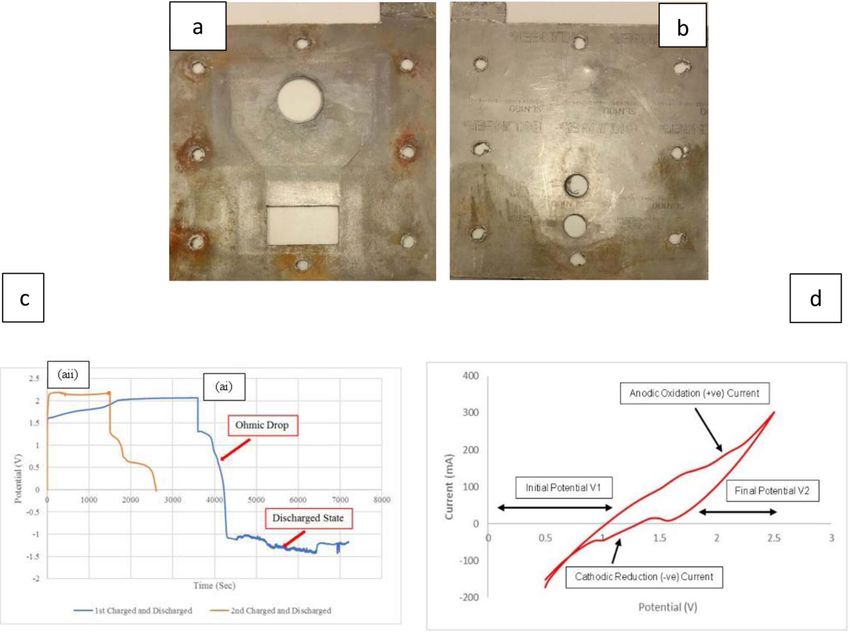
Journal of The Electrochemical Society, 2020 167 050504

Ordinarily, cationic zinc comes out during the charging process from
the aqueous solution to electroplate zinc onto negative sides of bipolar
electrodes in a ZnBr2 battery cell.

    ZBB overall battery cell reaction.—A fully charged zinc bromide
cell overall chemical reaction involves zinc reduction and bromine
evolution as shown below in Equation 1:
                         ZnBr2 → Zn + Br2                             [1]
   Similarly, ZnBr2 is formed from the combination of zinc and
bromine during discharging of the battery as shown below in
Equations 2: Reaction of zinc and bromine electrochemically during
discharge to generate electricity and reform the zinc-bromide solution
        Zn + Br2 → ZnBr2 , E0 = + 1.828 V versus SHE                  [2]
    Theoretically, the electrochemical potential of an individual zinc-      Figure 1. (a) The Designed Anode-Side Reactor and (b) The Zinc Bromine
bromine battery cell reaction should be 1.828 volts according to.47          Battery Cell (ZBB) incorporated with all the components (Anode & Cath-
Under zero current flow, this value is the Nernstian potential. Mean-        ode Reactor, Gaskets, Membrane and the two Anode and Cathode Feeder
while, based on findings and observations, the presence of internal          Electrodes.
efficiencies and different resistance seen and contributed in practice
are scheduled to result in slightly lower cell voltages values. The cur-
rent density of a cell is another essential performance metric for a         and carbon particles. The flow rate was approximately 0.0046m/s and
zinc-bromine battery cell system.48 Current density as measured in           0.0047m/s by converting the values to cubic meter per second m3 /s
amperes is the value of power moving across the surface area of a cell       and to m/s as summarized below (0.05m = anode reactor length) ∗
electrode.49                                                                 (0.05m = anode reactor breadth) ∗ (0.012m = anode reactor thickness)
    However, a current density is not only limited to zinc-bromine bat-      ∗ 166.7cubic meter per minute = 0.005m/s.
teries cells but has a direct influence on the capacity of electrodes in a
battery cell. Regarding the energy per unit area of the battery cell and         ANSYS fluent + the design numerical purpose.—This section ex-
including the operating efficiency of the system overall.50,51 Further-      amines the flow of electrolyte through 1 a packed bed of glass beads
more, Quaternary ammonium bromides (QBr) are stored safely and               and 2 via some added carbon particles for results validation under a
considered as a separate liquid phase52 as displayed in the equation         minimum fluidization condition within a fluidized bed zinc-electrode
below 2. Bromide anions are converted during charging to bromine             that was incorporated to the anode-side of a fabricated zinc-bromine
which is subsequently complexed. See Equation 3 for Bromide for-             battery cell system. To determine the flow regime required to pro-
mation due to gain of electron and Equations 4 for Bromide reaction          vide good fluidization. A reactor geometry was designed for the cell
with quaternary ammonium bromides,53                                         anode-side as presented in Figures 1a and 1b. The anode-reactor was
                                                                             where both the carbon particles and glass beads were separately in-
                         2Br − → Br2 + 2e−                            [3]    vestigated. The designed anode-reactor was now used to carry out the
                                                                             modelling work and to study the fluidization of particles within the half
                        QBr + Br2 → QBr3                              [4]
                                                                             cell. Therefore, this required setting up the boundary conditions to the
                                                        54    55             model, including the physical boundaries of the cells that was achieved
carried out a similar experimental work related to, and by pro-
ducing quaternary ammonium compounds thru selecting anion dur-               by producing a solidwork model of the cell. This was then imported
ing the reaction of a trialkylamine with an alkyl bromide to form a          into ANSYS Fluent and for fluidization studies. It was necessary to
quaternary tetraalkylammonium bromide salt. Furthermore, the qua-            carry out a fluidization experiment within the designed fluidized bed
ternary tetraalkylammonium bromide salt was converted to a quater-           reactor at the cell anode-side to observe the electroplating behavior of
nary tetraalkylammonium hydroxide salt via an ion-exchange resin             the added carbon particles. This is in form of a parallel projection, in
by converting the quaternary tetraalkylammonium hydroxide salt to            which all the projection lines are orthogonal to the projection plane.
quaternary tetraalkylammonium salt of the selected anion.56–58
                                                                                 Problem description in ANSYS fluent and boundary and initial
                                                                             conditions.—The fluent version in ANSYS 17.2 was used for the mod-
               Experimental Work and Approaches
                                                                             elling and simulation. The fluidized bed zinc-electrode was modelled
    The explored experimental work in this paper were carried out by         by using the dense discrete phase model (DDPM) and discrete ele-
these four approaches (1), ANSYS Fluent (2), COMSOL (3) Hydrody-             ment method (DEM) approach in ANSYS. These models are widely
namic experiments and (4), Extensive laboratory experiments: cyclic          used for the simulation of powder systems and suitable to determine
voltammetry (CV), chronopotentiometry, scanning of electrons mi-             complex phenomena based on flowing particles. Dense discrete phase
croscopy and electrochemical impedances microscopy (EIS). Accord-            model (DDPM) is suitable to model dense particulate flows and ac-
ing to previous studies, and the shape and size of this research work fab-   counts for particles blockages and their effect on the primary phase
ricated anode-reactor, a minimum fluidization velocity of (0.001m/s)         solution.59–61
was accomplished theoretically by integrating some parameters into               The anode-side and cathode-side electrode of this research work
the Carman-Kozeny equation. These values include a separate void             were both designed to suite the required standard by considering their
fraction values for our packed glass beads and carbon particles before       thickness due to the impact and importance of what these developed
charge, particles diameter in between (254 microns to 354 microns),          reactors (electrodes) will provide regarding their electrolyte feeding
water density of (1000 kg/m3 ), a zinc density of (7140 kg/m3 ), after       mode and performances of the flow rate as reported in works of lit-
charge and a glass beads density of (2520 kg/m3 ) from literature etc.       erature especially on redox flow batteries (RFB).62 Besides, the elec-
The theoretical minimum fluidization velocity (0.001m/s) was further         trode can be modified in agreement to some works of literature by
investigated in ANSYS Fluent up to 0.098m/s for us to observe an ex-         adjusting electrodes of some fluidized bed reactors with their perfor-
cellent fluidization state before finally agreeing a minimum fluidiza-       mances. In addition, the electrodes of this research work are specially
tion velocity of (0.003m/s) as the best homogenous bed expansion.            made because of their contribution to cell voltage loss during charge
Furthermore, a chosen flow rate of 166.7cm3 min−1 was gradually              transfer and ohmic resistances as reported again in some pieces of
increased from 1cm3 min−1 to fluidize the investigated glass beads           literature.63,64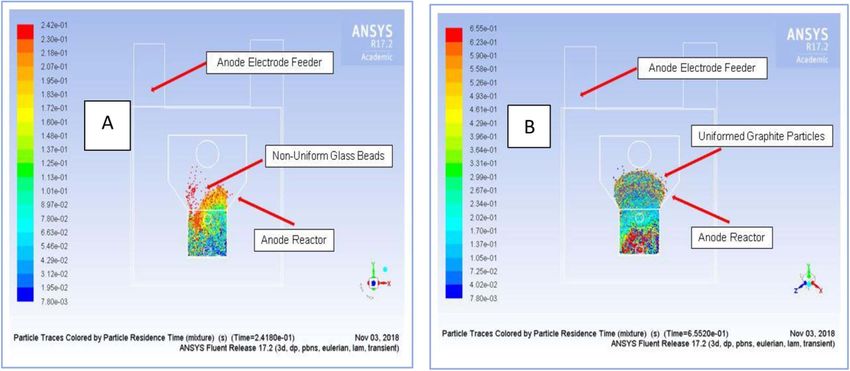
Journal of The Electrochemical Society, 2020 167 050504

                                                                                   Table II. Theoretical and Experimental Results.

                                                                                                            Minimum                  Change in Pressure
                                                                                   Parameters           Fluidization (Umf )             P (Pascal)

                                                                                                          Glass Beads + Water
                                                                                     Theory                 0.001m/s                    Not Calculated
                                                                                    ANSYS                   0.003m/s                     0.0995218
                                                                                   Experiment              0.0046m/s                    Not Measured
                                                                                                        Carbon Particles + Water
                                                                                                            Minimum                  Change in Pressure
                                                                                   Parameters           Fluidization (Umf )             P (Pascal)
                                                                                     Theory                 0.001m/s                  Not Calculated

                                                                                    ANSYS                   0.003 m/s                    0.07493255
                                                                                   Experiment               0.0047m/s                   Not Measured

                                                                               The use of a unified Eulerian coordinate method was introduced to
                                                                               the computational fluid dynamics and multiphase numerical simula-
                                                                               tion of this research work to prevent and resolve any occurring flow
                                                                               discontinuities.67

                                                                                   ANSYS fluent results validation - Carbon and glass beads.—
Figure 2. Fluidized Bed Zinc Reactor Schematic Diagram.                        Figure 2 is the fluidized bed zinc electrode schematic diagram. The
                                                                               validated results presented in Table II were explored experimentally,
                                                                               numerically and theoretically. These include the minimum fluidiza-
    The anode-side reactor was initially modelled and simulated with           tion velocity (Umf ) and the pressure drop of the investigated added
some amount of added glass beads and was later modelled sepa-                  glass beads and carbon particles with water within the anode reactor.
rately with graphite particles in ANSYS as a 3D fluidized bed zinc-            However, the pressure drop was not explored theoretically and during
electrode. Investigated velocity were between 0.001m/s to 0.098m/s             the laboratory experiment but only numerically in ANSYS. Theoreti-
for the glass beads and zinc-particles. The bubbling fluidized bed zinc-       cally, the minimum fluidization velocity was in good agreement with
electrode was modelled and simulated in ANSYS Fluent by using                  the ANSYS numerical value. Experimentally, theoretically and numer-
these approaches (Huilin-Gidaspow, Schiller-Naumann, Wen-Yu, and               ically, a lesser flow resistance was observed within the anode-reactor
Syamlal-Obrien model and finally selected the Wen-Yu model. The                when added with glass beads compared to the carbon particles. This
values for the initial and boundary conditions presented in Table I            was due to the similarities between their densities and mass.
were fed into the system.                                                          Based on the shape of our fabricated anode-reactor and previous
    The injected carbon particles were tracked with the electrolyte at a       literatures, a minimum fluidization velocity of (0.001m/s) was ac-
flow time step of (0.0002) and for the carbon particles time step size(s).     complished theoretically by integrating some parameters within the
To define many injections and differentiate between them during the            Carman-Kozeny equation. These values include a separate void frac-
modelling of the fluidized bed, some procedures were introduced for            tion values for our packed glass beads and carbon particles before
describing the injection of these particles so that no problems will           charge, particles diameter in between (254 microns to 354 microns),
be encountered during the modelling and simulation as it is in most            water density of (1000 kg/m3 ), a zinc density of (7140 kg/m3 ), after
industrial applications.65 The modelling and simulation conducted in           charge and a glass beads density of (2520 kg/m3 ) from literature etc.
this research work to examine injected particles can also be used as               The theoretical minimum fluidization velocity (0.001m/s) was fur-
another kind of measurement in particle systems due to science de-             ther investigated in ANSYS Fluent up to 0.098m/s for us to observe an
velopment which enables researchers to have deep insight in particle           excellent fluidization state before finally agreeing a minimum fluidiza-
system so that the detailed behavior of the particles can be obtained.66       tion velocity of (0.003m/s) as the best homogenous bed expansion.

   Table I. Boundary and Initial Condition.

                                                          ANSYS FLUENT DDPM + DEM MODEL

            Names                                                       Glass Beads                                                  Zinc Particles

         Primary Phase                                                      Liquid                                                       Liquid
       Secondary Phase                                           Solid Density (2520kg/m3 )                                   Solid density (7140kg/m3 )
           Mesh Type                                                     Multizone                                                    Multizone
   Inlet Liquid Temperature                                                  293K                                                         293K
         Inlet Pressure                                                101325 Pascals                                               101325 Pascals
        Outlet Pressure                                                101600 Pascals                                               101600 Pascals
   Inlet Velocity Magnitude                                               0.003 m/s                                                    0.003 m/s
        Total Flow Rate                                                0.00408 (Kg/s)                                               0.00408 (Kg/s)
    Minimum Particle Sizes                                              0.00038 (m)                                                  0.00038 (m)
   Maximum Particle Sizes                                               0.00042 (m)                                                  0.00042 (m)
        Physical Model                                                     Wen-Yu                                                       Wen-Yu
    Particle Time-Step Size                                                 0.0002                                                       0.0002
    Particles travel velocity                                              0-50m/s                                                      0-50m/s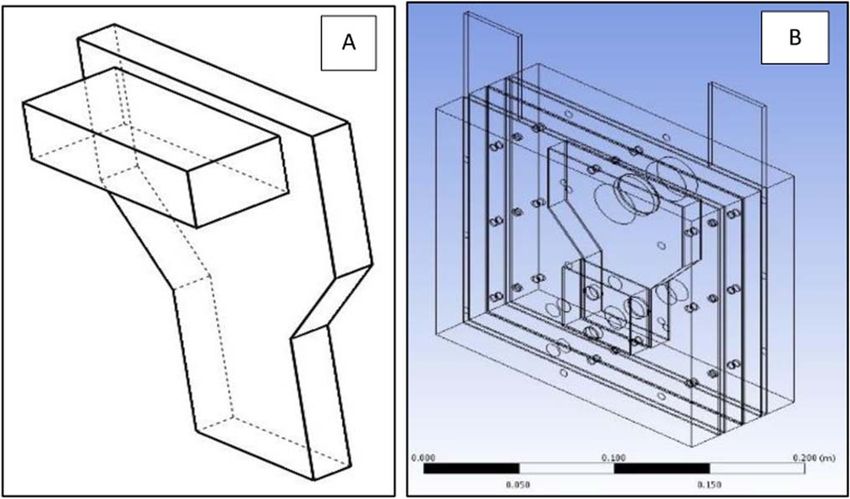
Journal of The Electrochemical Society, 2020 167 050504
Figure 3. Investigated Particles within the Anode-Reactor (A) Non-uniformed Glass Beads (B) Uniformed Graphite Particles.
A chosen flow rate of 166.7 cm3 min−1 was gradually increased are subjected to high current density degrade at a faster rate. Knowl-
from 1 cm3 min−1 to fluidize the investigated glass beads and carbon edge of the current density distribution is also desired to optimize the
particles. The flow rate was approximately 0.0046m/s and 0.0047m/s utilization of the electrocatalysts, because these are often made of ex-
by converting the values to cubic meter per second m3 /s and to m/s as pensive noble metals. Non-uniform deposition and consumption, as
summarized below (0.05m = anode reactor length) ∗ (0.05m = anode well as unnecessarily high overvoltages, with resulting energy losses
reactor breadth) ∗ (0.012m = anode reactor thickness) ∗ 166.7cubic and possibly unwanted side-reactions, may be other effects that one
meter per minute = 0.005m/s. would like to minimize.
Three key stages were involved during the computational
Discussion on glass beads and carbon.—The designed reactor experiment
during the modelling and simulation showed that it has capability of 1. The vigorous mixing of the electrolyte, the ionic migration was
producing an electrode that reduces losses during charging and dis- the dominating transport mechanism and the general mass balance
charging and can create enough mass transport of zinc ions and capable in the electrolyte, since it was a steady-state conditions and that no
of quick exchanging of electrons based on the speed of charging and homogeneous reactions occur. These processes were governed by the
discharging onto plane surfaces according to the observations made following Equations 5 and 6
in ANSYS CFD Fluent. Numerically, both the experimented (a) glass
beads and (b) graphite particle residence time (mixture) seconds are ∇.Ni · = 0 [5]
displayed in Figures 3a and 3b. The simulation time of the exper-
where Ni is the flux of species i (SI unit: mol·m2 /s), which in turn is
imented glass beads was for a short period to prevent the particles
governed by:
from escaping from the anode-reactor’s outlet compare to the added
zinc-particles. Di ∇ci − zi mi Fci ∇φl + ci u = Ni [6]
The added glass beads were not uniformed within the reactor unlike
3
the zinc-particles during the numerical simulation. These two particles where ci represents the concentration of the ion i (SI unit: mol/m ), zi
densities carbon and glass beads could have resulted to such discrep- its valence, Di its diffusivity (SI unit: m2 /s), mi its mobility (SI unit:
ancy. For instances, the glass beads density was (2520 kg/m3 ) and the mol·m2(s·V·A)), F denotes the Faraday constant (SI unit: As/mol), the
zinc particles solid density was (7140 kg/m3 ). Furthermore, these has ionic potential, and u the velocity vector (SI unit: m/s).
affected the spherical shapes of these two investigated particles which 2. The kinetics at the electrode.
have also contributed to the outcome of the result. Specifying differ- 3. Mass transportation of ion through diffusion, convection, and
ent parameters had assisted through the numerical simulation and the migration.
used of rosin-rammler particles distribution in setting the injection Furthermore, to reduce the experiment computational times in
properties in Fluent as an addition to the initial applied velocity at COMSOL, the cell behavior was simulated in a 2-D dimension by cut-
the zinc-bromine battery cell’s anode inlet, temperature and total flow ting the cross section and making them to be perpendicularly through
rate. each of the layers. By modelling the cell system can be used to reduce
the required time of the experiment via programming some values on
COMSOL.—Dendrite clusters, porous electrode media, or 2 phase COMSOL because it will point out the independent and experimen-
bromine phenomena have not been presented in COMSOL due to the tal designed parameters and how they can be modified to better the
due the research license that was available. Therefore, not all models performance of the model.
were accessible during the numerical modelling experiment. Further- To help design the laboratory experiments described in this paper,
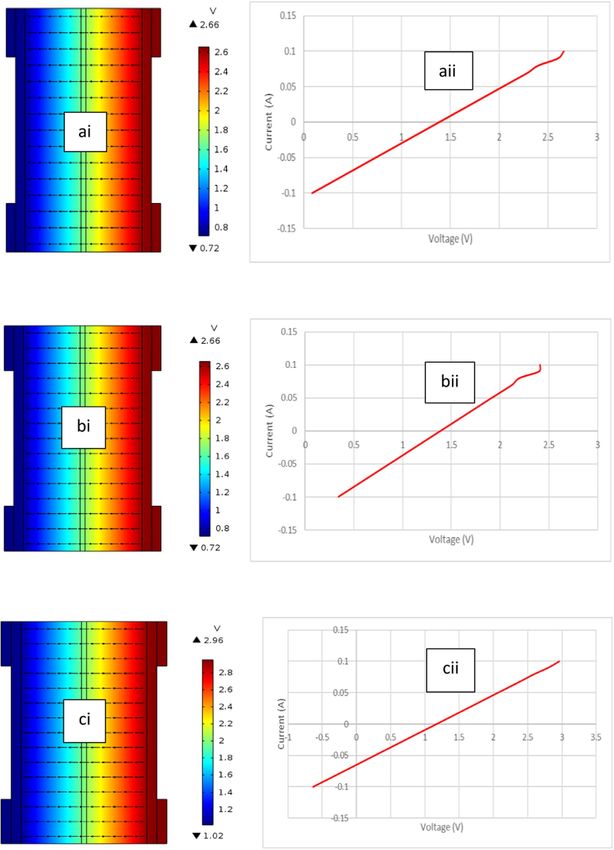
more, both the anode and cathode electrode (reactors) were designed it was necessary to model the electrochemical behavior of the cell
to be thin for a more proper conductivity because one of the most during charge, discharge in three key states: (i) almost fully charge,
important aspects in the design of electrochemical cells is the current (ii) mid-charge and (iii) almost fully discharge, in order to predict
density distributions in the electrolyte and electrodes as non-uniform the current generated, potential differences between the electrodes,
current density distributions can be detrimental for the operation of the current vs voltage response, and the changes in concentrations of
electrochemical processes. In many cases the parts of an electrode that key electrolyte composition. In this section, a two-dimensional (2D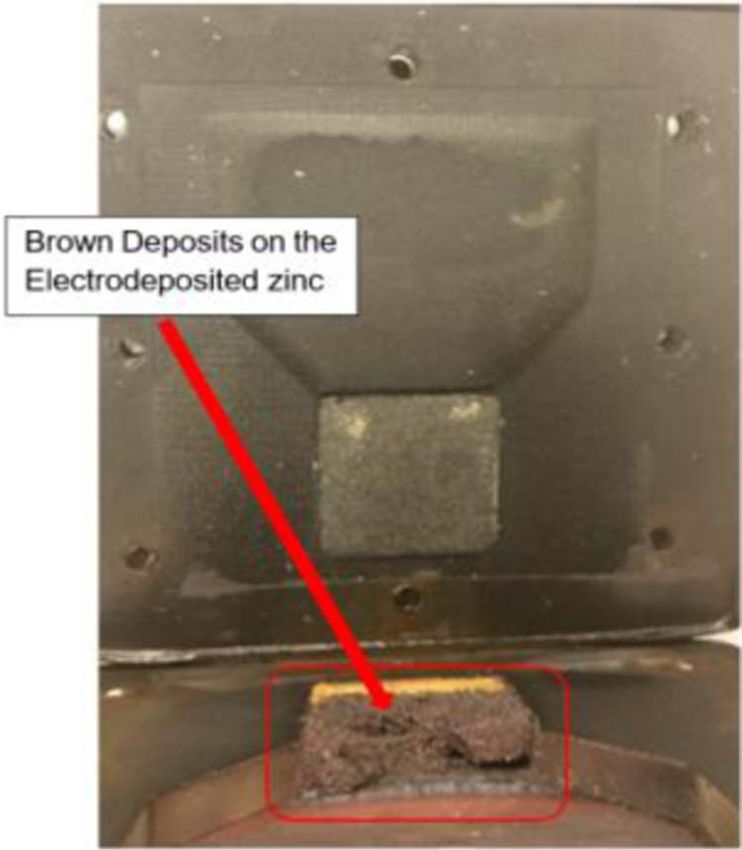
Journal of The Electrochemical Society, 2020 167 050504
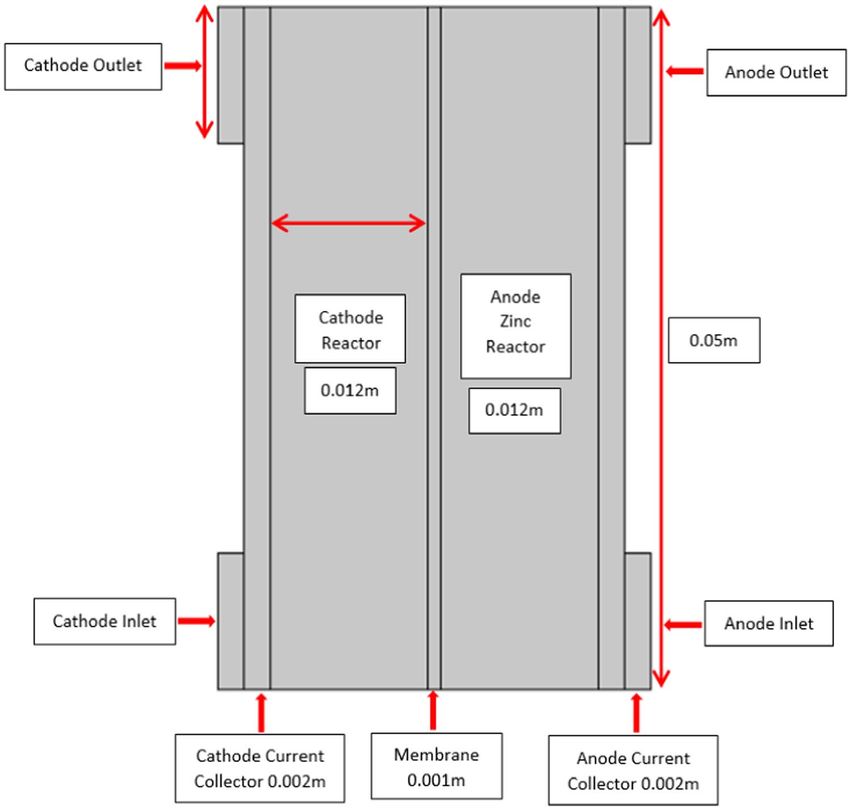
Figure 4. The Zinc-Bromine Battery cell Model.
model) ZnBr2 model geometry was used and consists of five different Cathode bromide concentration.—The programmed bromide (Br)
layers as showed in Figure 4. concentration for the charge was 0.01M, and 1.5M for the mid-
This includes (a) the anode feeder electrode (b) anode-side reac- charge and 3M for discharge. The same bromide concentration was
tor (b) Nafion ion-exchange membrane, (c) cathode-side reactor and formed at charge (0.01 mol to 93.718 mol at 0.1A) and at −0.1A
(e) cathode feeder electrode. The anode and cathode feeder electrodes it was (114.542 mol and 208.25 mol). For the mid-charge, it was
provide the electrical connection externally to the system. The Nafion also increased by 0.08 mol (1.5 mol and 1.58 mol at 0.1A) and by
membrane separates the two-electrolytes from mixing together. The 0.09 mol (1.59 mol and 1.68 mol at −0.1A). It was (3.01 mol and
anode-side reactor is injected with un-measured added zinc particles. 3.09 mol) at 0.1A and (3.11 mol and 3.2 mol) at −0.1A for the dis-
The composition of the anode-side and cathode-side electrolytes are charge. The bromide concentration during the real experiment might
given in Table III. The system was simulated using COMOL Multi-
physics 5.3a and no additional program modules.
Table III. Charged, Mid-charged and Discharged Concentrations.
Anode zinc concentration.—Not all the concentrations results fed ANOLYTE COMPOSITION
into the system at the cell anode-side were discussed in this section;
since the area of interest focusses on zinc depleted, bromine formed Elements Charge Mid-Charge Discharge
and the amount of bromide concentration at the cell anode-side and
cathode-side. Therefore, only the added zinc concentrations results Zinc (Zn2+ ) 2.5M 3.25M 4M
were mentioned in this section. The anode zinc-electrode zinc con- Bromide (Br− ) 6M 6M 6M
centrations were (2.5M), before charge, at a current rate in between Chlorine (Cl− ) 3M 3M 3M
−0.1A and 0.1A and was (3.25M) for the mid-charged and (4M) for Potassium (K+ ) 1M 1M 1M
the discharged. The discharge current rate was also in between −0.1A Hydrogen (H+ ) 0.00316M 0.00316M 0.00316M
and 0.1A. At −0.1A and 0.1A as the mid-charge, more zinc was used at Water (H2 O) 55.555M 55.555M 55.555M
charge, by depleting from (2.5 mol to 2.41 mol) than at a current rate of CATHOLYTE COMPOSITION
−0.1A (2.4 mol and 2.32 mol). According to Figures 5bi and 5bii, the Elements Charge Mid-Charge Discharge
depleted zinc during mid-charge was (3.25 mol and 3.16 mol) at 0.1A
and between (3.1 mol and 3.07 mol) at −0.1A. In Figures 5ci and 5cii, Bromide (Br− ) 0.01M 1.5M 3M
it was between 4 mol and 3.9 mol, while at 0.1A; and it was between Chlorine (Cl− ) 1M 1M 1M
3.9 mol and 3.82 mol, while at −0.1A for the discharge. These pre- Potassium (K+ ) 4M 1M 4M
dictions were all in good agreement with the laboratory experimental Bromine (Br2 ) 1.5M 0.75M 0.01M
work. Water (H2 O) 55.555M 55.555M 55.555M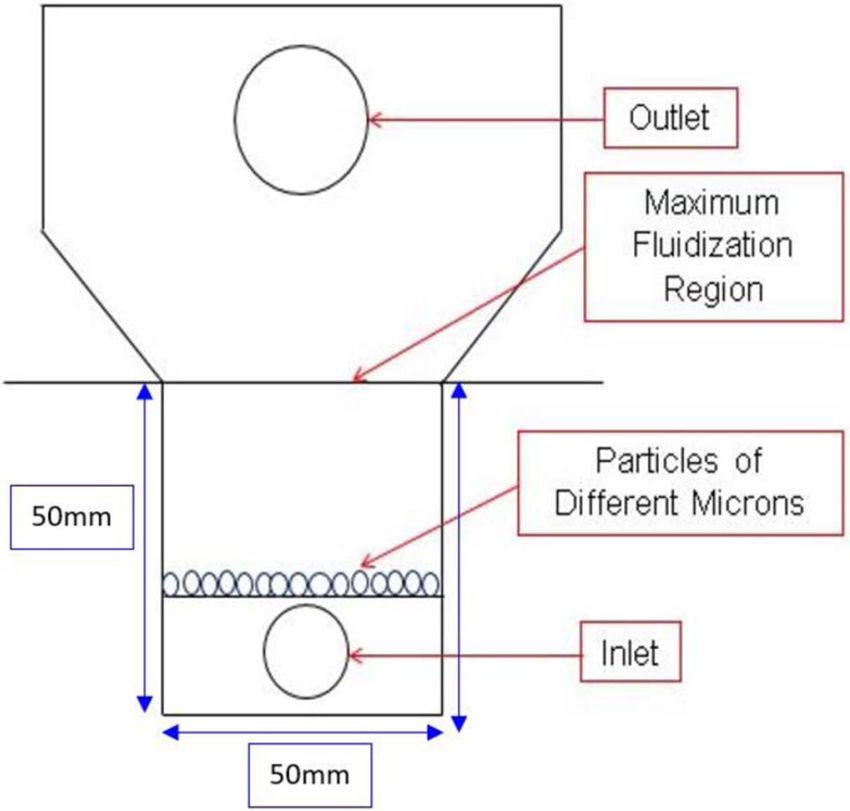
Journal of The Electrochemical Society, 2020 167 050504

Figure 5. Cell Model Electrolyte Potential and Current Vs Voltage (a) Charged at 0.1A & −0.1A (b) Mid-Charged at 0.1A & −0.1A and (c) Discharged at 0.1A
& −0.1A.
Journal of The Electrochemical Society, 2020 167 050504

have increased during the laboratory experiment. Numerically, the           minimum fluidization (0.001m/s) that were both separately investi-
model has showed that the original ZnBr2 solution can be reformed           gated in the anode-reactor. In this equation, (em f ), is identified as the
during discharge. The simulation outcomes showed that the numer-            function of the shape and distribution of the particles size. (d 2 ) is the
ical modelling and experimental data were compatible and in good            diameter, (ρs ) is the density of the particles and (ρ) as the density of
agreement.                                                                  water.

                                                                                      ρf             150 (1 − ε0 ) μ
    Cathode bromine concentration.—The bromine (Br2) concentra-                1.75           u0 +
                                                                                               2
                                                                                                                       u0 + −g ρs − ρ f = 0 [7]
tion for the charge was 1.5M, and 0.75M for the mid-charge and 0.01M                D p ε30               D2p ε0
for discharge. The model predicted a change to the discharge concen-
trations (0.01M). More bromine was formed during charge by 0.09M.               Hydrodynamic experimental procedure.—A DC power supply
Both the mid-charge and discharge concentrations elevated separately        was used to control the current, and a small centrifugal pump for
by 0.094M. At the cell cathode-side, the model has showed that more         transferring the fluid. The small centrifugal pump was initially cou-
bromine will be formed during charge. During charge the concen-             pled with a flowmeter reactor added with some quantity of glass beads
tration was between (0.16 mol to 1.4 mol at 0.1A) and (1.7 mol and          before re-introducing them to the fabricated anode zinc electrode (re-
3.17 mol at −0.1A). For the mid-charge it was (84.3 mol and 753.1 mol       actor), as shown in Figure 7b. However, the glass beads quantity was
at 0.1A) and (920 mol and 1672.7 mol at −0.1A). And (10.4 mol and           not measured and the carbon particles.
93.8 mol at 0.1A) and (114.6 mol and 208.4 mol at −0.1A) for the                The final applied flow rate was 166.7cm3 min−1 as it was grad-
discharge.                                                                  ually increased from 1 cm3 min−1 . This flow rate was approxi-
                                                                            mately 0.0046m/s and 0.0047m/s by converting the values to cu-
    COMSOL: results description + discussion.—Electrolyte poten-            bic meter per second m3 /s and to m/s as summarized shown:
tial vs current and voltage.—The predicted electrolyte potential and        0.05m∗0.05m∗0.012m∗166.7cubic meter per minute = 0.005m/s. The
current versus time by the model are presented in Figures 5ai to 5cii.      apparatus (test tube flowmeter and fluidized bed anode-reactor) used
These predicted results are for the charge state, partially charged state   for this experiment were carefully checked to know their condition or
and discharge state. The electrolyte potentials presented in Figures 5ai    else they might affect the experimental data.
to 5cii were observed after running the model under a set of operat-
ing condition at a steady state. Mathematically, the model was com-         1.   The carbon particles were filled within the anode-reactor up to
puterized under a constant temperature of 293.15 (K) with current                a height of 35 mm and examined. The same height applies to
flowing in the ZnBr2 cell. The cell was set to first charge at a current         the added and examined glass beads. However, only the carbon-
rate of 0.1A and −0.1A and discharged at −0.1A after charging at                 particles were between 254 microns to 354 microns, as presented
0.1A at the same time. The mid-charge was programmed up at 0.1A                  in Figure 7c.
and −0.1A for the cell to store energy and to predict the cell elec-        2.   The graphite particles density was 7140kg/m3 and the glass beads
trolyte potential when partially charged. The red mapped color on                particles density was not measured but appeared very tiny com-
the modelled geometry at the anode zinc-electrode identifies charged             pared to the carbon particles, as presented in Figure 7d.
zinc.
    The model predicted the expected electrolyte potentials for the             Hydrodynamic results and discussion.—Recurrently, high in-
charged, mid-charged and discharge. These values corresponded with          ternal resistances were encountered within the fabricated zinc-
the explored laboratory experiment. The model did not predict a cur-        bromide cell throughout the experimental work. From the anode
rent that can be detrimental to the health of the modelled ZnBr2 cell       electrode to the cathode electrode, the frequency was high but re-
in real life. Flowing of electrons were identified by the black arrows      duced toward the cathode electrode, as presented in Figures 6a to
from the anode zinc-electrode to the cathode-electrode. Before the bed      6c. The first impedances demonstrated 4 from the cell anode-
could be more conductive, the model was re-designed to be thin. This        side. The problem has made the charge and energy efficiency
idea supported the resistivity of the cell. The model demonstrated the      to be low compared to most of the results conducted in other
highest voltage during the discharge state followed by the charge state.    articles. For instance, with the second feeder current collectors,
The highest voltage predicted by the model during mid-charged was           the carbon and nickel feeder electrode at 3-cycles of charge and
low compared to others. The differences between these voltages could        discharge, established a maximum charge and energy efficiency of CE
have happened because of the variations in the electrolyte composi-         of (47.5%, 64.5% and 63.3%) and energy efficiency, EE of (13.97%,
tions. However, none of the predicted voltages can be detrimental to        18.9%. and 18.6%) at a current rate of 0.1A and 0.1A. The size of the
the SOH of the real battery cell.                                           fabricated and incorporated two reactors (anode and cathode) could
                                                                            have contributed the discrepancy in the results. Subsequently, this has
                                                                            instigated making the shape of the reactors to be thin when modelled in
   Fluidized bed lab experimental.—Introduction and objectives.—
                                                                            2D on COMSOL so that these electrodes will be conductive. However,
Figure 8a has showed some glass beads experimented separately
                                                                            both the added glass beads and injected carbon particles fluidized as
within the anode reactor apart from the carbon particles before in-
                                                                            expected and behave in the state of the fluid, as presented in Figures 7c
corporating the fabricated anode reactor to the cell anode side. By
                                                                            and 7d. At 0.0046m/s, the glass beads had gained its steady state and at
carrying out these hydrodynamic laboratory and numerical modelling
                                                                            0.0047m/s, the investigated carbon particles had also gained its steady
and simulation experiments on the glass beads and carbon particles
                                                                            state.
has enabled the below listed objectives to be determined:
1.   To observe the pressure drops and expansion via the fixed fluidized        Laboratory experimental condition.—Carbon-anode vs carbon-
     bed.                                                                   cathode.—Carbon offers access to a wide anodic potential range, low
2.   To observe the beginning of fluidization during the laboratory         electrical resistance, low residual current, and a reproducible struc-
     experiment.                                                            ture of the electrode surface.72,73 Few results out of all the explored
3.   The verification of the Ergun equation (1952) theoretically for        chronopotentiometry experiment are presented here in this paper with
     the laboratory experiment,68 Wen & Yu equation (1966)69 for            their energy and charge efficiency for the first set feeder electrodes ma-
     the numerical simulation through the application of DDPM and           terials (carbon-anode and carbon-cathode). Exploring various electro-
     DEM models in ANSYS Fluent and Baeyens & Geldart equation              chemical measurements using different current rates and techniques
     (1977).70,71                                                           has allowed to know the most conductive electrode materials that can
                                                                            be recommended in future to fabricated ZBB cells through these intro-
   The presented Carman-Kozeny in Equation 5 was used to calculate          duced electrochemical measurement methodologies: cyclic voltam-
the glass beads minimum fluidization (0.001m/s) and the added zinc          metry (CV), chronopotentiometry, impedances and taking some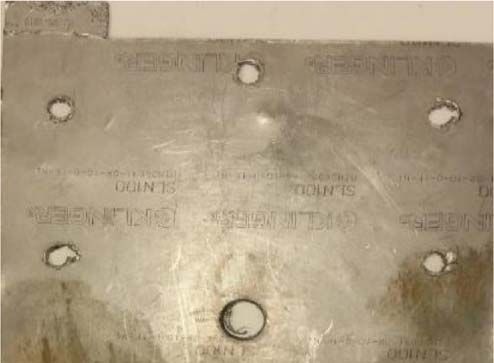
Journal of The Electrochemical Society, 2020 167 050504

Figure 6. Three Consecutive Impedances Measured at a Current Rate of 0.1A and −0.1mA for 3600 Secs, and at a Current Rate of 0.25A and −0.25A for 3600
Secs for the Measured Impedances B and C.

scanning of electrons microscopy. All the explored cyclic voltam-            ure 8c(ai), only the cell charge efficiency was calculated, but very
metry’s were at 25mV/sec at 1 cycle after charging and discharging           low compare to the charge efficiency of the experimental result in
current stored by the fabricated zinc-bromine battery cell at the var-       Figure 8c(aii). The cell showed a negative potential of 1.1V and
ious programmed rates. The cell impedances will later be discussed           a charge voltage of 2V. The cell completed its charged and dis-
somewhere in this paper with the outcome of the scanning of electrons        charged at the actual programmed current rates (0.1A, and −0.1A)
microscopy (SEM). The explored charged and discharged experiment             and within 3600 seconds and 500 seconds but with a strange voltage.
at various current rates with the first set electrode feeder materials,      During charge the cell watt was 0.2 Watt.Hr (0.0002 Kilowatt.Hr) and
carbon vs carbon, was coupled with 3M of KBr (535.51g), 1M of KCl            0.11 Watt.Hr (0.0001 Kilowatt.Hr) during discharge. The cell stored
(111.89g) as the cathode-side electrolyte and 3M of ZnBr2 (675g), 1M         360C at 3600 seconds and discharged the stored current at the expected
of ZnCl2 (205g), and 1M of KCl (111.826g) as the anode electrolyte           500 seconds.
solution.                                                                        Carrying out a deep discharge on the cell at a current rate of 0.1A
                                                                             and −0.1A can stress the battery cell if a partial discharge (500 secs)
                                                                             on the cell can result to a negative voltage. Furthermore, this could
   EXP                       CARBON & CARBON                                 have affected the cell energy efficiencies (CE and EE). Therefore, it
                                                                             is not advisable to partially or completely discharge current stored
   1     (a) Charge and discharge rate (0.2A and −0.1A @ 1500 secs &
                                                                             by the cell rather than programming the cell to store more current
           1300 secs) (b) (0.1A and −0.1A @ 3600 secs & 500 secs).           and programming the cell to discharge at a proper discharge time and
                                                                             currents. The cell was able to reverse back its polarity after it was
                                                                             fully discharged. This was confirmed via other chronopotentiometry
   1st feeder electrode results and discussion.—Chronopoten-                 measurements that was later carried out on the cell which indicated
tiometry @ (0.1A & −0.1A) @ (3600 secs & 500 secs).—In Fig-                  that the cell was not damaged and required no replacement.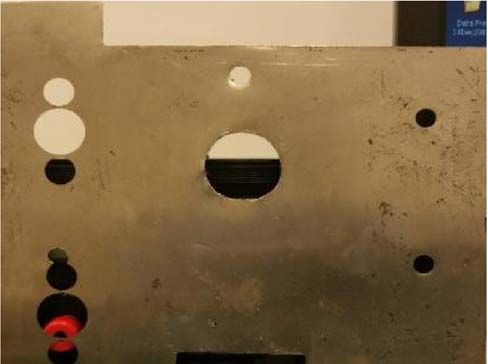
Journal of The Electrochemical Society, 2020 167 050504

Figure 7. (a) Investigated Glass Beads (b) Anode Zin-Electrode Anode Reactor with (c) Fluidized Glass Beads and (d) Carbon Particles.

    Chronopotentiometry @ (0.2A & −0.1A) @ 1500 secs & 1300                         2. Energy Efficiency (EE)
secs.—At 2.1V from the graph plot in Figure 9aii, the cell energy
was 0.42 watt.Hr with the following efficiencies: CE, 43.3%, and EE,                             Energy Recovered Discharge
                                                                                                                            ∗100%
15.63%. The cell demonstrated a voltage of 1.3V at discharged. The                                  Energy Input Charge
battery cell was unable to store the expected 720C due to loss of energy
and failed to discharge the programmed (−360C) of energy. The cell                  The energy efficiency was calculated but not recorded due to a
was fully charged at 1500 secs but could only store 300C out of the              negative discharge voltage.
anticipated 720C. Therefore, 460C. of energy was lost, and the cell                 The cell programmed discharge cut off voltage (0V) was exceeded.
still has 2300 secs to complete its charged. Additionally, the cell was          therefore, this had resulted to the calculated negative voltage due after
able to discharge (−130C) at 1300 secs out of the expected 360C and              the cut off voltage which has made the chemistry to be different.
lost (−210C).                                                                       Calculations (Ai) 0.2A & −0.1A @ 1500 secs & 1300 secs
                                                                                    3. Charge Efficiency (CE)

    Cyclic voltammetry @ 25mV/Sec - carbon feeder electrodes.—The                                Charged Recovered Discharge
cell encountered high resistance during charge. This occurrence con-                                                              ∗100%
tributed to a reduced flow of current and zinc depletion. Based on the                               Charged Input Charge
high slope, the cyclic voltammetry shape indicated a high resistance
of about 5 ohms. Applying a slow scan rate to this cyclic voltammetry                                     130
                                                                                                        =     ∗100% = 43.33%
experiment was to observe a fast-chemical reaction. From the graph                                        300
results, the reduction voltage occurred at 1.1V and reduction current               4. Energy Efficiency (EE)
peak at −30mA. Zinc depletion (Oxidation) continued until 2.3V with
the oxidation current peak was between 200mA and 300mA.                                        Energy Recovered Discharge
    Calculations (Ai) 0.1A & −0.1A @ 3600 secs & 500 secs                                                                  ∗100%
                                                                                                    Energy Input Charge
    1. Charge Efficiency (CE)

                Charged Recovered Discharge                                         Charge Recovered ∗ Average Voltage During Discharge
                                                ∗100%                                                                                 ∗100%
                    Charged Input Charge                                               Charge Input ∗ Average Voltage During Charge

                             50                                                                         130∗0.707
                        =       ∗100% = 13.8%                                                       =             ∗100% = 15.63%
                            360                                                                          300∗1.96
Journal of The Electrochemical Society, 2020 167 050504
Figure 8. Two Carbon Fiber Materials Incorporated onto the ZnBr2 Cell at the (a) Anode-Side and (b) Cathode-Side, of (c) Charged and Discharged Result Plot (ai)
(0.1A at 3600 secs & −0.1A for 500 secs) and (aii) (0.2A @ 1500 secs &, −0.1A for 1300 secs) of 3M of KBr (535.51g), 1M of KCl (111.89g) as the cathode-side
electrolyte solution and 3M of ZnBr2 (675g), 1M of ZnCl2 (205g), and 1M of KCl (111.826g) as the anode electrolyte solution (d) Cyclic voltammetry of the
two-carbon electrodes feeder materials consisting 3M of KBr (535.51g), 1M of KCl (111.89g) as the cathode-side electrolyte solution and 3M of ZnBr2 (675g),
1M of ZnCl2 (205g), and 1M of KCl (111.826g) as the anode electrolyte solution at a current rate of (0.2A @ 1500 secs &, −0.1A for 1300 secs).
Recognition of Cu and cell efficiency after reversion and descrip- depending on different combination and decomposition of the active
tion of results - carbon feeder electrodes.—Batteries cells capacities materials and chemical reactions. Therefore, this has instigated the
can be reduced, and the resistances can be increased, when differ- different charges rate carried out on the experimented zinc-bromine
ent charges conditions are passed to them. Such result can always be battery cell since it has been reported in previous studies and based
on the earlier charged passed on the cell in this research work. Many
research studies has also confirmed how the addition of active com-
pound, and many other elements existing in batteries cells can give
rise to undesirable chemical reactions.74 In this section, the battery cell
was charged and discharge at different acceleration voltages and pro-
grammed to charge and discharge at some different rates to observe the
electrodeposited metallic zinc elements via using scanning the electron
image with the SEM device (JSM-6010LA/JSM-6010LV). A charge
was passed twice at this currents rate (0.1A and −0.1A) to confirm if
the strange electrochemical noise was from the centrifugal pump and
for further elucidation on the percentage of the efficiency that can be
derived from the cell. This has made the current results in this section
as three different chronopotentiometry measurements at these current
rates: (0.1A, 0.1A, and 0.25A) and (−0.1A, −0.1A, and −0.25A)
and three cyclic voltammetry. This is presented in Figures 10a–10d
for the chronopotentiometry measurements and Figure 10e–g for the
cyclic voltammetry (CV), respectively. The measured charge efficien-
Figure 9. Bar Chart Comparing Efficiencies of Charge-(Blue) and Energy- cies for the presented chronopotentiometry results in Figure 10 were
(Orange) at (1) 0.1A & −0.1A @ 3600 Secs & 500 Secs, and (2) A Current 22%, 5.71%, and 2.77%. The calculated energy efficiency was 5.90%,
Rate of 0.2A & −0.1A for 1500 Secs & 1300 Secs. 2%, and 1.07%. Brown deposits identified to be copper after chargingJournal of The Electrochemical Society, 2020 167 050504
Figure 10. Charge and Discharge a current rate of (a) 0.1A for 3600 secs, −0.1A for 800 secs (First Top Left) (b) 0.1A and −0.1A for 3600 secs and 200 secs
(First Top Right) (c) 0.25A and −0.25A for 3600 secs and 100 secs (First Middle Left) of 3M of KBr (535.51g), 1M of KCl (111.89g) of cathode electrolyte
solution and 3M of ZnBr2 (675g), 1M of ZnCl2 (205g), and 1M of KCl (111.826g) of anode electrolyte solution, and (e–g) cyclic voltammetry at 25mV/sec for 1
cycle (First Middle Right, First Bottom Left and First Bottom Right).
the battery cell, was deposited on the electroplated zinc, as shown on Some parameters of the battery cell need to be monitored; such
Figure 11. The energy efficiency and charge that was first tested, is as the voltage, temperature and current during passing charges. These
presented in Figure 12. parameters are important so that the cell can be kept in a good op-
erating condition. Other areas that required concentration is the elec-
Findings and comments – carbon vs carbon feeder electrodes.— trolyte depletion and preventing the cell from overcharging. The elec-
Charged passed to the cell at those low currents rates for two case trolyte should be change as this can be degrading slowly. This can
studies, might have increased the resistances or possibly the bed was make the voltage to fluctuate, have low coulombic efficiency in rela-
not conductive as expected to fluidize and charge the added carbon tion to the discharge capacity and charge capacity. This can lead to
particles and result to zinc electrodeposition. The parameters for case a non-uniformed electrodeposition of zinc like dendrite formation.75
study 1 were 0.1A, 0.1A, and 0.25A and while the parameters for case However, the incorporated high surface area anode-reactor will cer-
study 2 were −0.1A, −0.1A, and −0.25A. The presented bar charts tainly prevent dendrite problems. Brown deposit identified as copper
supported each part of the data, as presented in Figure 12 (1), (2) and were also observed within the cathode-side electrolyte during those
(3). Furthermore, the cell temperature increased sharply without any explored charged passed and on the electrodeposited zinc within the
short circuit. The charge and energy efficiencies might be reduced due anode-reactor, as shown in Figure 11. Such observed results impelled
to secondary reaction; like the redox reaction within the cell. interrupting the cell from operating further and led to pulling the cellJournal of The Electrochemical Society, 2020 167 050504
Table IV. Experimental Data’s of the investigated two-carbon
materials with 3M of KBr (535.51g), 1M of KCl (111.89g) as the
cathode-side electrolyte and 3M of ZnBr2 (675g), 1M of ZnCl2
(205g), and 1M of KCl (111.826g) as the anode electrolyte solution.
Current Rates Charge Efficiencies Energy Efficiencies
0.25A Vs −0.25A 11.1% 5.48%
0.1A Vs −0.005A 4.86% 2.94%
0.25A Vs −0.01A 3.88% 1.81%
0.5A Vs −0.01A 1.94% 1.25%
1A Vs −0.05A 4.86% 2.21%
Five cycles of chronopotentiometry - carbon feeder electrodes.—
As mentioned earlier in Section 3.12, to compare the cell energy effi-
ciencies, the cell was further charged at these current rates of 0.25A,
0.1A, 0.25A, 0.5A and 1A, and discharges at −0.25A, −0.005A,
−0.01A, −0.01 and −0.05A, carried out under different set times
in seconds. The cathode electrolyte solution contains 3M of potas-
sium bromide (KBr) (535.51g) and 1M of potassium chloride (KCl)
(111.89g). The anode-side electrolyte also includes the following
Figure 11. Brown deposits identified to be copper after charging the battery chemicals solution: 3M of zinc-bromide (ZnBr2 ) (675g) Solution, 1M
cell. of zinc chloride (ZnCl2 ) (205g), and 1M of potassium chloride (KCl)
(111.826g). The anode electrolyte density was 1.47gcm−3 .
components apart for a proper cleaning and introducing a separation Description of results - carbon feeder electrodes.—Figures 13 and
technique to sieve the cathode electrolyte solution and the anode elec- 14 are the charge results plots and bar chart. By charging the battery cell
trolyte from these escaped zinc-particles. Fitting materials that were at those current rates stated in this section 3.13.1 was to observe which
not chemically resistance had contributed to such deposition. of the current rates that can rapidly make the battery cell to have a better
The brown deposit had converted the zinc-bromine batteries cell charge and energy efficiency of approximately 90% compared the pre-
to a copper-zinc battery cell but was later reverted to a zinc-bromide vious results. The charged passed at 0.25A for 3600 secs and −0.25A
cell of which the reverting process involved carrying out the filtration for 400 secs has made the battery cell to stored 900C at 3600 secs dur-
procedure repeatedly to separate these sediments from the anode and ing charge but lost (−700C) in between 3600 secs to 4000 secs and
cathode electrolyte solution. The battery cell was able to establish a only stored 100C at 400 secs from the charge passed to discharge. The
good redox reaction after these processes and according to the elec- charged voltage was 1.9V with 0.475Watt. Hr (0. 000475 Kilowatt.Hr)
trochemical results and from the experimental observation. However, and 0.5V as the discharged with 0.125Watt. Hr (0.000125 Kilowatt.
the cell efficiencies were too low due to internal losses, and some of Hr). In between (0.1A and −0.005A), at 3600 secs to 7100 secs, the
the energy were assumed to be converted into heat, as presented in stored current from the charged passed was −17.5C instead of −18C
Figure 12. The cell metallic bolts and nuts must be changed to first and 360C for the charged at exactly 3600 secs. The lost charge passed
avoid the transferring of current onto them. The opening charge and during discharge was −0.5C. The cell voltage was 1.5V during charge
discharged initially showed a voltage of 2V and dropped to 1.9V. The with 0.15Watt. Hr (0.00015Kilowatt. Hr). The discharged voltage was
second and third charge and discharged voltage was 1.3V and 1.9V 0.7V and demonstrated 0.0035Watt. Hr (0.0000035Kilowatt. Hr.).
at the same current rates and programmed time. The last charged and During the charged passed at a current rate of 0.25A and −0.01
discharged value at a current rate of 0.25 and −0.25 for 3600 seconds at both 3600 secs, the cell stored 900C at 3600 secs and lost −1C in
showed 1.8V. between 3600 secs and 7100 secs during discharge but could dis-
charged −35C at exactly 3500 secs. The cell charge voltage was
1.9V during charge and 1.0V for the discharged. The cell showed
0.475Watt. Hr (0.000475Kilowatt. Hr) for the charged and 0.01Watt.
Hr (0.00001Kilowatt. Hr.) for the discharged. The charged passed dur-
ing charge and discharged at 0.5A and −0.01A for 3600 secs were
1800C and −35C. The voltage was 2.6V for the charge and 1.4V
for the discharge. The charged passed made the cell to established
1.3Watt. Hr (0.0013Kilowatt. Hr) for the charge and 0.014Watt. Hr
(0.000014Kilowatt. Hr) for the discharged. At exactly 3500 secs the
cell could also discharge −35C of energy. Both the charge and energy
efficiencies were low due to the poor performances.
At 1A and −0.05A for 3600 secs, the cell established 4V, 4Watts.
Hr (0.004Kilowatt. Hr) during charge and 1.3V, 0.065Watt. Hr
(0.000065Kilowatt. Hr) during discharged. The lost current was 5C
out of 175C. The discharged current accumulated within (7100secs)
to (3600secs). The charge passed during charge was 3600C and none
of the charge passed throughout the charge period was recorded.
Figure 12. Charge-(Blue) and Energy-(Orange) Efficiencies a current rate of
(1) 0.1A and −0.1A for 3600 secs and 800 secs (2) At 0.1A and −0.1A for Findings and comments – carbon vs carbon feeder electrodes.—
3500 secs and 200 secs (3) 0.25A for 3600 secs and −0.25A for 100 secs of As displayed in Table IV, the cell demonstrated a very detrimental
3M of KBr (535.51g), 1M of KCl (111.89g) of cathode electrolyte solution voltage (4V) at a current rate of 1A and −0.05 and at 7000 secs. At
and 3M of ZnBr2 (675g), 1M of ZnCl2 (205g), and 1M of KCl (111.826g) of 0.5A and −0.01A, the cell showed a voltage of 2.6V at 7000 secs. The
anode electrolyte solution. cell voltage was low (1.5V) at a current rate of 0.25A and −0.01A. AtJournal of The Electrochemical Society, 2020 167 050504 Figure 13. Charge and Discharge: 3M of KBr (535.51g), 1M of KCl (111.89g) of cathode electrolyte solution and 3M of ZnBr2 (675g), 1M of ZnCl2 (205g), and 1M of KCl (111.826g) of anode electrolyte solution at (a) 0.25A for 3600 secs, −0.25A for 400 secs (First Top Left) (b) 0.1A for 3600 secs and −0.005A for 3500 secs (First Top Right) (c) 0.25A for 3600 secs, and −0.01A for 3600 secs (First Middle Left) (d) 0.5A for 3600 secs, and −0.01A for 3600 secs (First Middle Right) (e) 1A for 3600 secs, and −0.05A for 3500 secs (Bottom Centre). 0.1A and −0.005A, the cell voltage was 2V. The cell further showed is so resistive, charging it at high current rates should be avoided but a very low voltage at a current rate of 0.25A and −0.25A. The cell to discharge at a much lower rate. But not quite sure if the charges demonstrated and had a good redox reaction during the charge state passed can be retrieved back from the cell at a lower current rate since and according to the graph results, but the materials were not elec- the cell did not reached a point where the voltage collapsed. However, trically conductive as expected. It was assumed that the entire cell running the cell longer could have been a good idea for comparison energy efficiency has been result has affected due to the problem. The of results. membrane can be re-boiled to be more conductive and the pH level of the two-electrolytes should be frequently checked since they de- Discussion on 1st feeder carbon feeder electrodes.— termine the number of protons at the battery cell anode-side. Flow batteries cell electrolytes must not be ionically conductive alone to • Unanticipated side reaction could be occurring by charging the have higher efficiency, but also to be chemically stable, be conductive cell at 0.1A and −0.1A instead of a current rate of 0.2A and −0.1A. under a wide range of conditions, and be good mechanically.76,77 The Therefore, the electrodeposition of zinc is better at this current rate: anode electrode feeder must be changed to a better material that can be 0.2A and −0.1A; as this favours the Zn reaction. Similar current rate more conductive. Different Coulombs of charge were lost by charging could be repeated later to observe if the cell resistance will be reduced. the cell at different current rates and discharges rates. The battery cell The battery cell required dismantling it and cleaned to improve the
Journal of The Electrochemical Society, 2020 167 050504

                                                                                  As described in Description of results-carbon feeder electrodes
                                                                              section, the cell was later programmed to charge and discharge with
                                                                              the 2nd set of electrodes (nickel and carbon electrode) and the 3rd set
                                                                              of electrodes (nickel and titanium electrodes) to be sensitive to these
                                                                              materials. These electrodes are to indicate the excellent conductors
                                                                              of electricity and were compared to the 1st feeder materials of these
                                                                              electrodes: carbon-anode and carbon-cathode, as shown in Figures 15a
                                                                              and 15b. However, only the best explored experimental readings are
                                                                              presented for these two, and three sets electrodes feeder materials at
                                                                              (a) Carbon and Nickel at a current rate of 0.1A and −0.1A for (1),
                                                                              for (4000 secs and 1900 secs), and (2), for (3100 secs and 2000 secs),
                                                                              and (3) for (3000 secs and 1900 secs). (b) 3-Cycles of Charged and
                                                                              Discharge at a Current Rate of 0.1A and −0.1A for (1800 secs and
                                                                              900 secs), (1810 secs and 900 secs), and (1705 secs and 900 secs) via
                                                                              using the Nickel Vs Titanium with 3M of KBr (535.51g), 1M of KCl
Figure 14. Charge-(Blue) & Energy-(Orange) Efficiencies: 3M of KBr            (111.89g) as the cathode-side electrolyte and 3M of ZnBr2 (675g), 1M
(535.51g), 1M of KCl (111.89g) of cathode electrolyte solution and 3M of      of ZnCl2 (205g), and 1M of KCl (111.826g) as the anode electrolyte
ZnBr2 (675g), 1M of ZnCl2 (205g), and 1M of KCl (111.826g) of anode elec-     solution (c) Cyclic voltammetry at 25mV/s taken after investigating
trolyte solution at (1) At a current rate of 0.25A & −0.25A @ 3600 Secs and   the Nickel and Titanium Electrode.
400 secs (2) 0.1A & −0.005A @ 3600 Secs and 3500 secs. (3) 0.25A & −0.01A
@ both 3600 Secs. (4) 0.5A & −0.01A @ both 3600 Secs. (4) 1A & −0.05A
@ both 3600 Secs.                                                                 Description and analysis of results.—Carbon vs nickel.—As
                                                                              showed in Figure 16a, less passed charge was recovered back (310C)
                                                                              in between (5900secs to 9000secs) during the 2nd cycle instead of hav-
                                                                              ing 360C. The lost charge passed was 50C. But during the discharge,
efficiency and examine it methodically to prevent any future fault. The
                                                                              200C in between (900 secs to 1100 secs) was retrieved as 180C was
lost current might have gone into the added zinc particles or via wiping
                                                                              expected. Charged passed during the 3rd cycle was 300C in between
or leakage. From the bar chart in Figure 8 (charge and discharge),
                                                                              1100 secs to 14200secs instead of 360C. The lost charged was 60C
the cell performed better at a current rate of 0.2A for 1500 secs and
                                                                              during charge and gained 10C in between 143000 secs to 16200 secs
at −0.1A @ 1300 secs. The system electrochemical design required
                                                                              from the charge passed. However, the expected Coulombs from the
checking it. This include the zinc-electrode and cathode-electrode and
                                                                              charge passed was 180C. The charged passed increased by 40C dur-
the composition of the electrolyte. The high resistance on the zinc-
                                                                              ing the 1st cycle of charge in between 3600 secs to 4000 secs and during
bromide cell can also be reduced by lowering the salts concentration.
                                                                              discharged by an additional 10C in between 4000 secs to 5900 secs.
Furthermore, placing the two electrodes more closely to each other
                                                                              The cell demonstrated 1.8V during charge and 0.4V during discharged
and firmly can also be of help and reducing the thickness of the gasket
                                                                              throughout the charged passed for the charge and discharge.
demarcating these two electrodes for more closed intact.
                                                                                  The battery cell was able to complete the three cycles of charges
    • Different energy efficiencies were established by the cell through
                                                                              and discharges at the exact programmed time and at a current rate of
the passed charged and due to the internal losses and heat that was en-
                                                                              (0.1A, −0.1A). The current measured through the cyclic voltammetry
countered and suffered by the cell as presented through the bar chart
                                                                              at a scan rate of 25mV/sec demonstrated a current of 270 milliamperes.
in Figure 14. Although these efficiencies were not good as desired;
                                                                              The measured resistance was high at 0.1A and −0.1A after the three
but still the best efficiency can be given to the 1st chronopotentiome-
                                                                              cycles of charge and discharge but the result was ignored and not ap-
try measurement at a current rate of (0.1A, −0.1A at 3600 secs and
                                                                              propriate to be presented. The frequency was between 50 Hertz. No
800 secs) because of the observed charge efficiency of 22.22%, and
                                                                              leakage was observed compared other explored measurements. The
energy efficiency of 5.90%.
                                                                              resistance was measured after charge at a rate of 0.1A and at −0.1A
    • The presented bar charts confirmed each part of the data. For
                                                                              for the discharge to avoid high resistances due to the previous values.
instances, in Section 3.13.1, the CE efficiency was better than the
                                                                              However, the impedance resistance was still high at the measured cur-
EE efficiency. The cell demonstrated different results that cannot be
                                                                              rent rates (0.1A and −0.1A). The carbon and nickel current collectors
presented due to the following indicated energy efficiencies: 11.1% as
                                                                              showed a large reduction process during the forward scan and a peak
the 1st CE efficiency, 4.86% as the 2nd CE efficiency, 3.88% for the 3rd
                                                                              during the reverse scan from a voltage of 2.4V to 1.6V, as shown in
CE efficiency, 1.94% for the 4th CE efficiency and 4.86% for the 5th
                                                                              Figures 16a and 16b.
CE efficiency. These observed results showed that the charge that was
passed into the cell system were not completely recovered and none
                                                                                  Titanium Vs nickel.—The result presented in Figures 16c–16d and
of these experiments can be recommended as a good zinc-bromine
                                                                              Figure 17 has showed that the old electrolyte performed outstandingly.
battery. The result also showed that almost 88.9% of the efficiency
                                                                              But the cell could only charge at 100mA, 200mA, and 300mA for
were lost, which was due to the physics within the cell walls in the
                                                                              1800 seconds when it was expected to charge up to 1000mA. The
experimental set-up.
                                                                              cell also discharged at these current rates (−100mA), (−200mA), and
                                                                              (−300mA) for 900 seconds and elevated from 1.3V to 2.2V. However,
    Carbon vs nickel and Titanium vs nickel.—Nickel (Ni) is a good            the new electrolyte solution and its reaction within the cell could not
corrosion resistant choice for electrode feeders but may still have prob-     make the cell to charge. No leakage was also encountered on the cell
lems in halide conditions. Titanium is a non-ferrous metal with excel-        during the experiment.
lent corrosion resistance, good fatigue properties, and a high strength-          The cell abnormal performance was due to the added sequestering
to-weight ratio. Titanium’s excellent corrosion properties result in the      agent (Tetrabutylammonium bromide) in the cathode-side electrolyte
use of titanium for electrochemical processes such as electroplating,         solution. The old cathode-electrolyte with the new anode-electrolyte
electrophoresis, electrodeposition, electroforming, electro-hydrolysis,       was also compatible to charge the cell at 100mA for 1800 seconds and
electro chlorination, electrofluorination, and electrolysis. Titanium has     discharge at a current rate of −100mA for 900 seconds before stopping.
the highest strength to weight ratio of any metal and even in its unal-       No peaks were observed for the nickel and titanium electrode feeder. In
loyed form it is as strong as some steels but around 45% lighter and          between 1800 secs to 1890 secs, the charged passed during discharge
has a high melting point. Titanium alloys contain additional quantities       was 90C at the first cycle and 180C at 1800 secs for the charge.
of other elements such as vanadium and aluminum to further enhance                The cell voltage at the first cycle during charge was 2.2V at
mechanical properties and corrosion resistance                                0.22Watt. Hr. (0.00022Kilowatt. Hr.). For the second cycle of charge
You can also read