An Analysis of the Tourist Mobility in the Island of Lanzarote: Car Rental Versus More Sustainable Transportation Alternatives
←
→
Page content transcription
If your browser does not render page correctly, please read the page content below
sustainability

Article
An Analysis of the Tourist Mobility in the Island of
Lanzarote: Car Rental Versus More Sustainable
Transportation Alternatives
José María Martín Martín 1, * , Jose Manuel Guaita Martínez 2 , Valentín Molina Moreno 3
and Antonio Sartal Rodríguez 4
 1    Department of Business, International University of La Rioja, Avenida de la Paz, 137, 26004 Logrono, Spain
 2    Faculty of Business, Valencian International University, Carrer del Pintor Sorolla, 21, 46002 Valencia, Spain;
      josemanuel.guaita@campusviu.es
 3    Faculty of Economics and Business, Department of Management-1, University of Granada,
      Campus de Cartuja, 18071 Granada, Spain; vmolina2@ugr.es
 4    Department of Business Organization and Marketing, University of Vigo, Estrada San Cosme, 2,
      36310 Pontevedra, Spain; antoniosartal@uvigo.es
 *    Correspondence: josemaria.martin@unir.net; Tel.: +34-958-241-000

 Received: 20 November 2018; Accepted: 29 January 2019; Published: 31 January 2019

 Abstract: Studies have shown that certain modes of tourist development jeopardize the environment,
 as in the case of mass tourism, especially in areas that require special protection. The goal of this study
 is to apply a proposal for studying sustainability of tourist mobility to a protected space, the island of
 Lanzarote, which has been declared a Biosphere Reserve by UNESCO. This paper seeks to figure out
 the mobility patterns of tourists, the criterion used to select a mode of transportation, the attitude
 of tourists towards the sustainability of transport, and its environmental implications by analyzing
 secondary sources and interviewing tourists. The results show that the tourism model of the island is
 based on scattered natural resources that tourists want to enjoy in a tailor-made visit, which makes it
 hard to give up individual transportation. The only environmentally sustainable alternative is opting
 for electric vehicles with charging stations in the aforementioned tourist spots.

 Keywords: mobility; sustainable development; environmental sustainability

1. Introduction
     Specific human actions can have a negative impact on natural resources in protected areas if
they do not adopt behavior in accordance with principles of sustainability [1]. The management and
administration of these areas thus hold a fundamental role in preserving these resources. Tourism
produces a set of interferences on the environments where it is developed. These interferences are
derived from the number of arrivals, a factor that can also intensify the effects linked to seasonality [2].
The type of impacts derived from tourism and the way that the population perceives them should be
under continuous examination [3]. The concept of tourism is intrinsically associated with mobility,
since it appears as a temporary displacement from one’s usual place of residence [4]. Tourism includes
the activities that people undertake during their trips and their stays in places different from their usual
environment for recreation, business, and other purposes. Currently, tourism is the largest industry
in the world and one of the most rapidly growing ones on an international scale [5]. This causes
problems, especially in its impact on the environment. In both developed and less-economically
developed nations, public sector attention has increasingly focused on the perceived economic benefits
of tourism, which has progressively been adopted as a vehicle for the regeneration of rural areas
suffering economic decline or deprivation [6].

Sustainability 2019, 11, 739; doi:10.3390/su11030739                           www.mdpi.com/journal/sustainability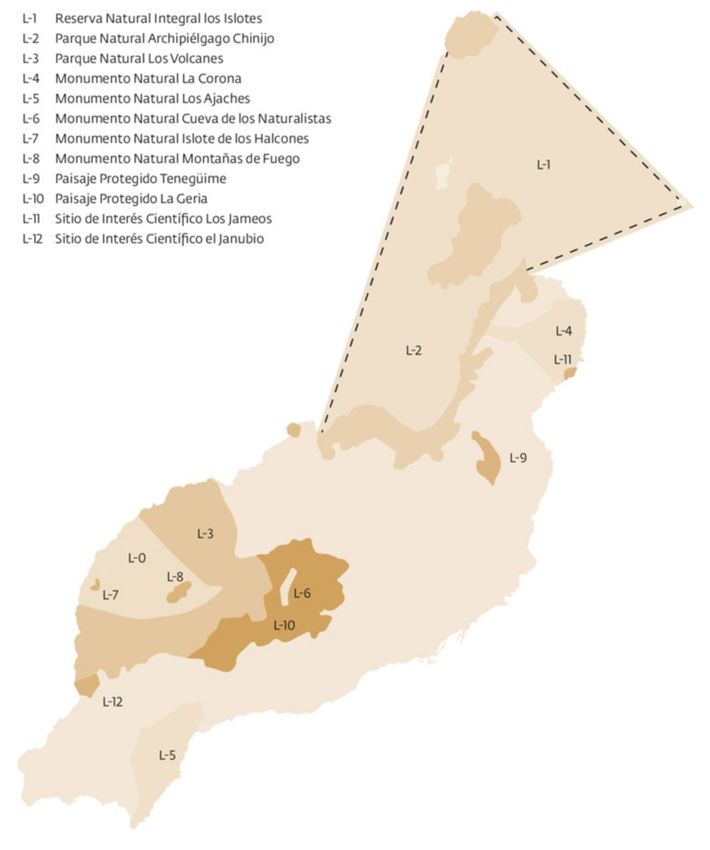
Sustainability 2019, 11, 739                                                                         2 of 17

      Tourism can have economic, sociocultural, and environmental repercussions for the surrounding
environment, and these can be both positive and negative. They can be positive because tourism
generally means an increase in the income of the area that receives tourists, and social relationships
between residents and visitors are established during tourists’ stay at the tourism destination. Further,
planning can make it possible for tourism to contribute to sustainable development and can serve
as a stimulus for conservation and protection of natural systems, as well as for educating the
population to avoid destroying these systems [7]. Negative impact occurs when tourism is developed
in an unorganized, uncontrolled way, causing irreversible damage and threats to the environment,
which ironically can destroy the resources that constituted the main attraction of the tourist destination.
This may be due to changes that transform the environment irreversibly, such as excessive urban
growth, the creation of artificial spaces and infrastructure not integrated into this environment,
the generation of waste, the erosion and degradation of the surroundings, the deterioration of flora
and fauna, and other issues.
      The concept of sustainable tourism comes from another broader notion, sustainable development,
which involves satisfying the needs of the present without compromising the possibilities of future
generations [8]. The evolution of the relationships between tourism and development has taken place in
various declarations and documents sponsored by international organizations; among these, the World
Tourism Organization. There has been a gradual transition from the dominance of sociocultural and
economic aspects of tourism to the omnipresent paradigm of sustainability [9], which recognizes the
potential of the tourist sector as a driver of economic and social development, while maintaining a
balance between social, economic, and ecological interests. The WTO itself indicates that sustainable
tourism attends to the needs of current tourists and the receiving regions, while also protecting and
fostering opportunities for the future [10]. Further, these documents conceive of transportation as a key
environmental sector, along with water, energy, and waste [11]. It seems obvious that new, innovative,
interdisciplinary structures are needed for sustainable tourism services [1].
      To be sustainable, tourism and the mobility it involves should integrate resources, be participatory
and planned, be open to nearby geographical areas, be organized to eliminate the effect of seasonality,
be oriented towards the long term, and be viable economically, socially, and environmentally [12].
Policy makers and tourism developers must understand visitors’ mobility behavior and how they
consume space and tourism resources in order to set up sustainable cultural tourism destinations [13].
With this considered, we conclude that there are limits to visitors’ use of tourist spaces [14,15] and that
it is necessary to perform studies that consider the individual characteristics of each scenario so that
tourism does not become a destabilizing factor in the areas that receive tourists.
      The aim of this paper is focused on analyzing the mobility of tourists in an environmentally
sensitive destination characterized by scattered tourist spots. By doing so, we intend to determine
which modes of transportation are used by tourists, their restrictions, why they are selected, and what
effects these mobility patterns have on the environmental and economic sustainability of the destination.
Lanzarote has been chosen due to its environmental value, but also due to the fact that because it
is an island, the modes of transportation are influenced (in fact, it is impossible for tourists to get
there with their own vehicle), and because the tourists spots are scattered. This paper seeks to offer
useful information to design public policies relative to tourist mobility with the aim of reaching more
sustainable models. We intend to provide academic literature with information on tourist mobility
in islands, especially in environmentally sensitive destinations, as well as to offer a guide of the
possible improvements, and a framework of analysis that is applicable to other fields. Studies on
tourist mobility in islands based on direct surveys are scarce in the academic literature, let alone those
concerning protected areas, which is why this study offers unique and new information that should be
completed with similar studies in similar destinations.
Sustainability 2019, 11, 739 3 of 17
2. Tourist Mobility Impacts on the Environment
The management of tourist mobility on destinations environmentally sensitive proves of great
importance, given that the impacts generated by visitors are dependent upon it [16,17]. The intensity
of said impacts will vary depending on the attitude, motivation, and behavior of tourists. Previous
studies indicate that these three factors are key when investigating eco-tourism [18–20]. In this paper,
the mobility patterns of the tourists visiting the island (behavior) are analyzed while considering their
motives to choose a mode of transportation and their attitude towards sustainability. According to
Ma et al., the motivations of the tourists in their visit influence their behaviors while they are at the
destination [21], as well as a responsible attitude towards the environment [22,23].
The spreading of mass tourism has been a factor influencing the mobility patterns of tourists,
since it is associated with the increase in the number of private vehicles [24]. In coastal destinations,
like the one this paper takes as the case study, resorts have expanded at the same time as the
tourist activity [24], which also widened the gap between them. In coastal destinations or islands,
tourist activity represents a large part of the revenue, hence the high pressure on the development of
resorts and transportation infrastructure [25]. Moreover, the pressure on coastal areas is intensified if
we take into consideration that they are usually more populous than interior areas, which increases the
necessity for transportation infrastructure and generate a larger number of journeys [26]. The effects of
tourist mobility are more intense in destinations suffering from high seasonality levels, given that in
those destinations the concentration of tourists at certain times of the year pressures the destination
even more. This is proven by the deterioration of dirt roads, interferences with the flora and fauna,
the crowding of transportation infrastructure, increasing emissions, and the inconveniences endured
by the residents [2,3,6,27,28].
The studies focused on tourist mobility built around rental vehicles are very scarce. The only
existing studies are focused on the economic impact of tourism, including the car rental industry as
part of this impact [29]. There are also studies related to the degree of satisfaction of the tourist with
the services they hire [30], and to the measurement of the quality of the service [31]. Other studies
analyze the tourist mobility across the board, but they do not do so specifically when it comes to the
mobility associated with car rentals. Using a set of various indicators can be very useful to measure
achievements in development and sustainability [32–36].
One of the most relevant aspects within the impacts associated with transportation in tourist
destinations is related to greenhouse gas emissions. It is estimated that the tourism industry is directly
responsible for 5% of the total volume of CO2 emissions. Furthermore, 75% of that percentage is
attributed to mobility [37]. What is more, whereas global emissions are decreasing, those associated
with the tourism industry grow more and more [38,39]. Therefore, it is urgent to know and control
the mobility patterns that explain the increase in the volume of emissions [40]. This paper moves
in that direction, seeking to assess the tourist mobility patterns and the reasons why the visitors
choose car rentals. Sustainable mobility in the tourism industry does not only include changes in
the transportation models, but also a reduction of the number of journeys, which would result in the
development of new forms of tourism [41]. Some studies even introduce tourism models pointing at
the type of tourism that should be developed to comply with the commitments related to matters of
greenhouse gas emissions [42].
This study is focused on matters highlighted by the academic literature, such as mobility
patterns in environmentally sensitive destinations, the motivations behind the selection of a mode
of transportation, or even the limitations of more sustainable alternatives. In tourism research, it is
necessary to count more specific studies that describe the behavior of tourists instead of general
approximations [43]. Following this idea, this paper has selected an environment that meets several
desirable requisites: it involves an island, which influences mobility; it is an environmentally sensitive
destination and tourist spots are scattered throughout the area, with most of them being located in
enclaves far from population centers and resorts.Sustainability 2019, 11, 739 4 of 17
3. Materials and Methods
Given its importance for the tourist sector and the economy in general, this study focuses
on firms in the car rental sector in Lanzarote. More specifically, it focuses on this sector’s target
audience—tourists who use rental vehicles.
Diagnosis of the situation shows a scenario of massive use of private vehicles and only slight use
of public transportation. Thus, we wish to evaluate the intermodal transportation and accessibility
of transportation in the area, focusing our study on specific analysis of the rental vehicle sector on
Lanzarote. Our analysis is based on data compiled from a survey that was developed and carried
out specifically for this study as an opportunity to obtain information relevant to the study’s goals.
The data were collected at different points on the island to guarantee maximum heterogeneity of the
sample. We obtained first-hand information about the guidelines describing the use of this service.
The survey was performed during 1–30 November 2015, in collaboration with Lanzarote’s Car
Rental Association on a representative sample of 400 tourists who used rental vehicles. Therefore,
the final number of surveys was 400. Selecting the time frame was dependent upon the cooperation
of the association. Given the low level of tourism seasonality of the Canary Islands [27], there are no
big differences in the tourist arrivals throughout the year. The association allowed the interviewers to
interview tourists in the premises of their partners (car rental companies) and they also shared the
necessary information to estimate the representative sample and the main surveying points. To perform
the survey, we administered the questionnaire to tourists who had finished using the rental car service,
including both Spanish and foreign tourists. The surveys were carried out on-site by professional
interviewers in eight different places of delivery of rented cars dispersed throughout the island in the
municipalities of Teguise, Arrecife, Puerto del Carmen, and Playa Blanca, the main access points for
tourists. To reach a sufficient level of representativeness, we considered the number of annual users of
Rent a Car services, and based on this information, estimated the necessary sample. We determined
the sample size according to the following conditions: (1) We took as the parameter of interest the
population proportion (number of users of the Car Rental service); (2) the population proportion
considered was 0.5, the least favorable that one might find (p = 50); (3) we established the maximum
allowable error as 0.03 (+/− 3.0%); (4) e assigned a confidence level of 0.95. By creating the formula,
we obtain the following model for selection of the sample size used in the fieldwork:
N Ph Qh
∑h Wh2 Nh −h 1 wh
n=
e2 1 Nh2
k2
+ N2 ∑h Nh −1 Ph Q h
where:
k, is the value of the confidence level calculated using normal distribution.
e, is the maximum allowable error, interpreted as the difference between the population parameter and
the estimator of this parameter: θ − θ̂ .
h, indicates the stratum at which we are operating (determined by taking into account the first stratum
and weighting the other strata according to size).
Wh are the weightings of each stratum, with the strata considered in this case to be uniform.
Nh , is the population size of each stratum.
N = ∑h NH , is the population size.
Ph , is the population proportion, where Qh = 1 − Ph
The four premises stated above influence the model and the formula used to calculate “n”,
the number of surveys needed to ensure that the data and the results of the research are statistically
representative [44]. If we consider the user’s country of origin, the greatest percentage of respondents
is composed of Spaniards (55%), although English (17%), German (16%), and French (9%) tourists are
also represented. Among Spaniards, the greatest proportion are from Madrid, the Canary Islands,Sustainability 2019, 11, 739 5 of 17
and Catalonia, although the origin of the users is quite varied. We find that the most common kind
of group to visit Lanzarote are couples (61.36%), followed at a considerably lower rate by groups
of friends (17.05%) and families (13.64%). Although independent users are in the minority, they do
constitute 7.95%
Given that the aim of the study is descriptive, the analysis focuses on analyzing descriptively
the data gathered by the survey, so that we can know in an intuitive manner the mobility patterns
of the tourists, the way in which they organize their visit, and the criteria that the tourists take into
consideration when choosing a mode of transportation. However, t-test and one-way analysis of
variance (ANOVA) have also been used to analyze whether the answers of the tourists were influenced
by personal motives, such as nationality, gender, age, or level of education. The sets of questions
that comprise the questionnaire are as follows: characteristics of the tourist, spots visited on the
island, mode of transportation used to arrive at each tourist spot, criteria taken into consideration
when selecting a mode of transportation, assessment of the overall private vehicle rental experience.
The questionnaire is designed by keeping in mind the basic goal of knowing the mobility patterns of
the visitors as well as the factors that influence choosing one or another mode of transportation. To
design the questionnaire, we have made a bibliographic review on tourist mobility. The work of Ekiz
and Bavik [31] has been of great help since it reviews the assessment methodologies on quality service
of car rental.
4. An Application: The Case of the Island of Lanzarote
Lanzarote is an island in the archipelago of the Canary Islands (Spain). It has considerable natural,
social, scientific, and tourism importance. The location of the Canary Islands is shown in Figure 1.
The island of Lanzarote hosted 2.93 million tourists in 2017, a figure that shows growth in relation to
the 2.13 million tourists that arrived in 2013 [45]. The accommodation offering of the island rose to
71,830 beds, out of which 40,342 are part of hotels. The total number of accommodation facilities in the
island is 291, out of which 75 are hotels [45]. When not controlled, traditional tourist development
of this kind of area, with its special attraction and natural beauty, is particularly damaging to the
environment [1,9]. In developing this study, we propose that tourist management on the island of
Lanzarote is not being performed using the criteria of sustainability [46]. Based on this premise,
we design and apply a questionnaire to identify the priority elements of mobility for tourists who
arrive on the island [46]. Successful tourism development involves balancing relationships among
tourists, residents, places, and the organizations and businesses that provide tourism services [47].
Figure 1. Location of the Canary Islands, Spain. Source: Developed by the authors.
Lanzarote is a small island with a low population and low population density, although we can
observe from Table 1 that its population has undergone intense growth—over 50%—in only a decade.
Since the 1970s, Lanzarote’s tourist development has spread out gradually from the capital, Arrecife,Sustainability 2019, 11, 739 6 of 17
to the southern towns, which have more beaches. This has led to greater pressure on the system of
roads from both residents and tourists. An important factor that influences this development and
must be taken into account is that over 40% of the island’s surface has been declared a protected area
(Table 2).
Table 1. Population and population density according to the Town Register by years.
Population Density Population Density
Year Inhabitants (No.) Year Inhabitants (No.)
(Inhabitants Per km2 ) (Inhabitants Per km2 )
2016 141,437 167 2010 116,782 138
2015 141,938 168 2009 114,715 136
2014 139,506 165 2008 109,942 130
2013 132,366 156 2007 103,044 122
2012 127,457 151 2006 96,310 114
2011 123,039 145 2005 90,375 107
Source: Canary Islands Institute of Statistics (ISTAC) [45]. Developed by the authors.
Table 2. Surface area of protected natural areas according to protection categories (in hectares).
Percentage of the Total Surface
Surface Hectares
of the Island of Lanzarote
Declared “National park” 5107.00 6.04%
Declared “Natural park” 19,270.40 22.78%
Declared “Integral natural reserve” 165.20 0.20%
Declared “Natural monument” 5211.90 6.16%
Declared “Protected countryside” 5676.50 6.71%
Declared “Place of scientific interest” 199.50 0.24%
Total Protected 35,029.20 41.41%
Total of the Island of Lanzarote 84,594.00 100.00%
Source: Canary Islands Institute of Statistics (ISTAC) [45]. Developed by the authors.
The location of protected spaces in Lanzarote is shown in Figure 2. In recent years,
the improvement in accessibility and infrastructure and the increase in tourist activity and land
mobility due to the economic evolution of Lanzarote have made this island a unique space in Spain
on which to perform our research analysis. One of the main natural treasures is the National Park of
Timanfaya, the only area on the island in this protection category. Its property structure is primarily
public. Of the 5107 hectares that make up the surface of the National Park of Timanfaya, 95.90% are
public property and 4.10% private property [45]. This area has experienced increased tourism and
tourist fame in recent decades (Figure 3). There has been an increase in the number of visitors, namely,
if we compare the number of tourist arrivals in 2015 with 1996, they have doubled. However, we can
observe increasing and decreasing cycles in the number of arrivals, associated with reasons outside the
sphere of the destination.
The problems with the current model of land mobility in Lanzarote stem from the accumulation
and interrelation of many conflicts [49], among which are: strong growth in tourist demand; imbalance
in the connection, use, and integration of the means of transportation; increase in the number
and distance of trips made in motor vehicles; high accident rate; growth in greenhouse gas [50];
strong geographical and seasonal concentration of tourist activity; and occupation of the area for
infrastructure and vehicle parking. Given all of these changes in an environment with the natural
wealth of Lanzarote, defining transportation systems that respect the environment should be a priority.
For example, the decreasing number of users of intercity transportation (Figure 4) leads us to think
that the trips are usually made in less sustainable ways, particularly by car [50].Sustainability 2019, 11, 739 7 of 17
Figure 2. Location of the protected enclaves in Lanzarote. Source: Alvarez, 2014 [48].
Figure 3. Number of visitors per year to the National Park of Timanfaya. Source: Canary Islands
Institute of Statistics (ISTAC) [45]. Developed by the authors.
Figure 4. Evolution of intercity transport in Lanzarote. Number of bus users. Source: Canary Islands
Institute of Statistics (ISTAC) [45]. Developed by the authors.
Lanzarote provides the perfect case for studying and analyzing the impact of tourists’ use of
vehicles, since the number of vehicles in the island’s fleet is higher than the average in Spain (Table 3).
The annual licensing figures show the important of mobility based on car rentals in the island.Sustainability 2019, 11, 739 8 of 17
Table 3. Relationship between population and fleet of vehicles (vehicles per 1000 inhabitants).
Year Vehicles Per 1000 Inhabs. in Lanzarote Vehicles Per 1000 Inhabs. in Spain
2016 849 673
2015 847 684
2014 868 685
2013 864 661
2012 842 636
2011 826 616
2010 825 594
Source: Canary Institute of Statistics (ISTAC) [45] and National Institute of Statistics (NIS) [51]. Developed by
the authors.
The public transportation available for travelers on the island is strongly supported by the rental
car sector, which becomes the most significant and specialized tourism-related sector. The advantage of
rental cars stems from the fact that they guarantee the tourist’s autonomy, enabling access to different
geographical points on the island. Currently, the rental sector for transportation in Lanzarote provides
an excellent price-quality ratio, making it one of the most abundant sectors throughout tourism
development (Table 4). The sector generates significant activity, both its own and activity derived from
the use of rental vehicles. The increase in individual trips and outings has stimulated rental car services
(Table 5), which although they suffered the effects of the global economic crisis, have improved thanks
to the systems of electronic reservations and the Internet.
Table 4. Number of firms and fleet of rental vehicles with active registration for the year 2016.
Lanzarote Spain
Number of Car Rental firms 25 1768
Number of Car Rental firms per 1000 inhabs. 0.18 0.04
Total fleet of rental vehicles 10,245 275,000
Rental vehicles per 1000 inhabitants 72 6
Source: Canary Island Institute of Statistics (ISTAC) [45].
Table 5. Registrations of vehicles for rent without driver in Lanzarote.
Year Registrations (No.)
2016 1413
2015 2919
2014 6148
2013 5817
2012 3989
2011 3612
2010 3435
Source: Canary Island Institute of Statistics (ISTAC) [45].
Road transportation, which is included in this sector, can encounter problems of sustainability
in the medium and long term. An effort must therefore be made to regulate transportation in a way
that is environmentally sustainable (this is necessary to guarantee the future of tourism on the island),
as well as the economic implications of tourism. As will be explained in what follows, a model must
be advanced that encourages the rational use of public and private transportation and mobility that
respects the environment.
5. Results
From the sample surveyed, we find that of the users of rental cars enter and leave the island
from Lanzarote Airport (97%). This has clear repercussions for planning the pick-up and drop-off
points for the vehicles. However, transportation service to the hotel, which is provided in manySustainability 2019, 11, 739 9 of 17
cases, also influences the pick-up point of the vehicle. As for the itinerary of the visit, users stress
the following as the main locations of overnight stays: Costa Teguise (37.50%), Puerto del Carmen
(30.68%), and Playa Blanca (18.18%). The itinerary is determined by considering the most-visited
tourist locations on the islands. The users visited primarily Los Jameos del Agua, La Cueva de los
Verdes, Las Montañas del Fuego, Playa Blanca, the Cactus Garden, Yaiza, Mirador del Río, among other
popular destinations (Table 6). The data shows the distribution of the tourists’ trips, which begin and
end at the airport, hence the importance of rental vehicles in organizing the visit. The locations of the
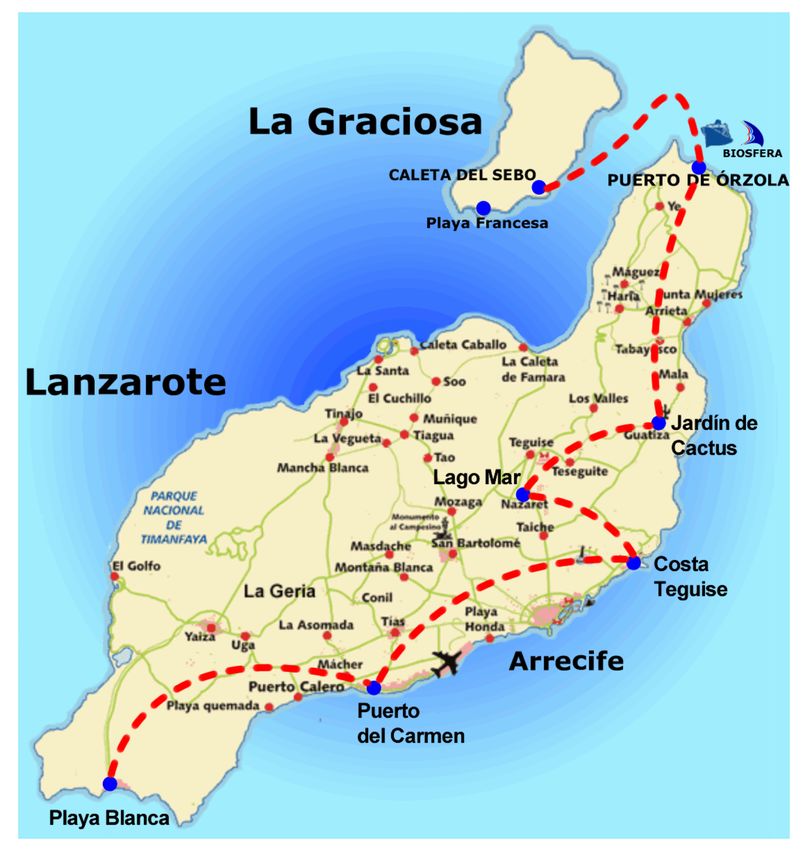
main tourist spots in Lanzarote are shown in Figure 5.
Table 6. Points of interest visited by tourists on their trips.
Touristic Location %
Puerto Calero 7.95%
Castillo de San José 9.09%
Caleta de Famara 10.23%
Tinajo-La Santa 10.23%
Isla de la Graciosa 10.23%
Bodegas de Vino 12.60%
Haría 13.64%
Isla de Fuerteventura 13.64%
Mercadillo de la Villa 17.05%
Monumento Campesino 18.18%
Salinas de Janubio 21.69%
Fundación Cesar Manrique 21.69%
Playas de Papagayo 27.27%
La Geria 30.68%
El Golfo 35.23%
Mirador del Río 45.45%
Yaiza 46.69%
El Jardín de Cactus 51.14%
Playa Blanca 53.41%
Las Montañas de Fuego 64.77%
La Cueva de los Verdes 73.86%
Los Jameos del Agua 80.68%
Source: Direct survey. Developed by the authors.
Figure 5. Main tourist spots in Lanzarote. Source: Lanzarotetours.com [52].
To analyze intermodal transportation in tourist displacement on the island, we considered the
set of means of transportation used on the route. Among users of rental cars, the complementary
means of transport most used was the inter-city bus, although the rate of use was only 13.64%.Sustainability 2019, 11, 739 10 of 17
This means of transportation is followed by complementary use of taxi (7.95%), city bus (6.82%),
and boat (6.82%). Hotel transportation and bicycle also appear, but in very low percentages (2.27%
and 2.27%, respectively). The low rate of intermodal transportation registered nowadays among users
of rental vehicles may be due to lack of information or lack of need.
It is worth stressing that 81.88% of those surveyed did not know about the availability of public
transportation before arriving on the island, a factor that could limit the possibilities for setting up an
intermodal route. Within the group of rental vehicle users, the motives given for the decision to use
rental vehicle services are related to tourists’ ability to tailor their visits and to be independent—first,
for the possibility of making a tour of the island (93.18%), and second just to be able to take a drive
(37.50%). Considering the survey sample as a whole, 78.41% of the respondents indicate that they did
not use the public transportation available on the island, and only 11.36% considered it useful and
comfortable. Still, a good percentage of those who used public transportation felt that it did not fit
their needs (5.68%) or had difficulty accessing it (3.41%). The last element in our analysis of means of
transportation used on a tourist visit to Lanzarote was the mode of access to the main tourist resources
on the island (Table 7). We would like to stress the predominant use of rental vehicles, especially in
natural spaces, tourist centers, points of entrance and exit, and lodging. The complementary means of
transportation most used are the tourist bus in cities and taxis to access lodgings.
Table 7. Means of transportation used to access tourist attractions.
Points of
Transportation System Cities Beaches Natural Spaces Tourist Centres Lodging
Entrance and Exit
Public bus 12.79% 7.23% - 2.38% - 1.16%
Taxi 1.16% - - 1.19% 1.15% 5.81%
Rental vehicle 86.05% 90.36% 100.00% 95.24% 96.55% 91.86%
Bicycle - 2.41% - - - -
Tourist transportation - - - 1.19% - 1.16%
Other - - - - 2.30% -
Source: Direct survey. Developed by the authors.
Only 9% of those surveyed indicated specific problems parking. Users reported that connecting
with intermodal transportation created difficulties in accessing public transportation and tourist
transportation. Thus, the percentages of those who did not use public transportation are very high
(55.68%), and the percentages for those who did not use tourist transportation are even higher (92.05%).
The users of public transportation did not mention difficulty in accessing public transportation, as they
did when mentioning access to tourist transportation. The last block of survey questions focused on the
rental vehicle user’s satisfaction with the rental vehicle service for tourists (Table 8). The assessment
that the tourists perform about car rental services is expressed on a scale from 1 to 10, in which 1 is the
most negative assessment and 10 is the most positive one. The aspects that received the highest point
values were those related to the vehicle used, accessibility, parking, and heavy road traffic. We should
point out that these issues exceed the average point value of 8, and that none of the concepts analyzed
is under the value 7, indicating that the experience was positive. The concepts that received the lowest
evaluation were related to quality of infrastructure and intermodal transportation.
We have used t-test and one-way analyses of variance (ANOVA) to analyze whether the tourist
assessment about the rent-a-car services shows statistically significant differences depending on
nationality, gender, age, and level of education (Table 9). The same analyses were used to determine
whether there are any differences in the importance that tourists give to sustainability when choosing
a mode of transportation. They have also been used to find out if there are any differences in the
criteria used to choose a mode of transportation in relation to the different segments. With respect
to the assessment of car rental services, the most positive opinions correspond either with foreign
tourists, tourists below 35 years of age, or tourists educated to a primary school level. We have found
statistically significant differences in these three cases, unlike the differences found in terms of gender.Sustainability 2019, 11, 739 11 of 17
Table 8. Degree of satisfaction with rental vehicle services.
Item Satisfaction
Price/quality ratio of the service 7.66
Parking problems 8.78
Accesibility problems 8.63
Heavy traffic 8.31
Intermodal transportation alternatives 7.36
Quality of roadway infraestructures 7.37
Information on points of interest 7.40
Information on routes and roads 7.41
Prior information 7.75
Reservation process 7.23
Attention to public 7.95
Vehicle used 8.11
Source: Direct survey. Developed by the authors.
Table 9. Assessment of the car rental service in terms of the characteristics of the tourist.
Assessment of the Car
N Mean Standard Deviation Test Statistic p-Value
Rental Service
Origin
National tourists 220 7.62 0.54 t-test 0.000 *
Foreign tourists 180 8.11 0.41 4.11
Gender
Male 301 7.89 0.61 t-test 0.541
Female 99 7.11 1.21 3.12
Age
50 years 60 7.54 0.412
Level of Education
Primary studies 68 8.10 0.642 ANOVA 0.000 *
Secondary studies 124 8.01 0.415 3.221
Higher studies 208 7.12 0.402
Source: Direct survey. Developed by the authors. * p < 0.05.
The tourists were asked to assess the importance of certain factors when they had to select a
mode of transportation (Table 10). This assessment is measured on a scale from 1 to 5, where 5 implies
a great importance in the process and 1 implies minimal importance. In regard to the criteria
used by the tourists to select a mode of transportation during their visit, the most highly valued
is “the capacity to access tourist spots”. The second criterion in terms of importance is “freedom to
arrange the visit”, whereas the third one is “cost of transport”. The two less important elements are
“environmental sustainability” and “professional driver familiar with the area”. The answers show
significant differences between Spanish and foreign tourists when assessing how important it is the
freedom to arrange the visit, as well as in the presence of a professional driver or the importance of
sustainability, to which foreign tourists are more sensitive.
Regarding the assessment of sustainability as an element of importance when choosing a mode of
transportation, foreign tourists hold it in higher esteem than Spanish ones do, being this a statistically
significant difference (Table 11). It is also more important for women, young people and those who
pursued higher studies. Statistically significant differences have also been found in these three cases.Sustainability 2019, 11, 739 12 of 17
Table 10. Assessment of the different elements intervening in the selection of a mode of transportation.
N Mean Standard Deviation Test Statistic p-Value
Freedom to arrange the visit
National tourists 220 3.81 0.49 t-test 0.000 *
Foreign tourists 180 4.52 0.41 3.98
Average cost of transportation
National tourists 220 3.42 0.814 t-test 0.451
Foreign tourists 180 3.31 1.27 0.711
Environmental sustainability
National tourists 220 2.84 0.45 t-test 0.000 *
Foreign tourists 180 3.11 0.55 4.015
Capacity to access tourist spots
National tourists 220 4.88 0.911 t-test 0.0671
Foreign tourists 180 4.74 0.971 0.842
Professional driver familiar with the area
National tourists 220 2.47 0.841 t-test 0.000 *
Foreign tourists 180 3.01 0.661
Source: Direct survey. Developed by the authors. * p < 0.05.
Table 11. Assessment of the importance of sustainability when choosing a mode of transportation
according to the characteristics of the tourist.
Environmental Sustainability N Mean Standard Deviation Test Statistic p-Value
Origin
National tourists 220 2.84 0.45 t-test 0.000 *
Foreign tourists 180 3.11 0.55 4.015
Gender
Male 301 3.34 0.41 t-test 0.000 *
Female 99 2.74 0.35 2.128
Age
50 years 60 2.64 0.47
Level of education
Primary studies 68 2.67 0.32 ANOVA 0.000 *
Secondary studies 124 2.89 0.47 3.451
Higher studies 208 3.29 0.55
Source: Direct survey. Developed by the authors. * p < 0.05.
Now that we have analyzed all of the data, we can consider the current situation and future
challenges in Lanzarote. In this context, one of the problems comes from the insufficient infrastructure
for public transportation, which influences trips. The fleet of vehicles is large, and the use of private
vehicles predominates over public transportation. The local population is highly mobile, in part
because of the average distance between workers’ places of residence and the tourist centers (Table 12).
It is thus essential to rationalize mobility and increase the use of public transportation. This table
shows the geographical dispersion of the tourist spots in Lanzarote. In it we can appreciate the distance
between population centers and the different tourist spots. This influences the tourist mobility and
forces the visitors to use a flexible mode of transportation. Moreover, the distance between population
centers and tourist spots makes it necessary for a large number of the population to count with a mode
of transportation for their commute to work.
This causes serious problems, which are especially significant on an island that boasts the title
of Biosphere Reserve, particularly for the value of its landscapes [7]. In fact, the island’s current
system of mobility takes up an increasing amount of the territory, with new roads and the expansion
of existing ones generating pollution and leading to accidents. Therefore, this is an unsustainable
model that should opt for a rethinking of mobility with action taken in infrastructure, means of
transportation, and regulation of the territory. It is necessary to decrease the impact on the landscapeSustainability 2019, 11, 739 13 of 17
caused by transportation infrastructure, which is precisely the main island’s export product, since its
sustainability is influenced, in part, by the growth of transportation and the infrastructure that
supports it.
Table 12. Distances in kilometres between the main population centres in Lanzarote.
From To Via Distance (km.)
Arrecife Playa Honda LZ-2 3.40
Arrecife Pto. Del Carmen LZ-40-2 10.20
Arrecife San Bartolomé LZ-20 6.20
Arrecife Tinajo LZ-20 17.10
Arrecife Haría LZ-1-10 25.70
Arrecife Teguise LZ-1-10 9.25
Playa Honda Yaiza LZ-2 17.50
Playa Honda Tinajo LZ-2 16.80
Playa Honda Teguise LZ-2-3-1-10 15.11
Playa Honda Costa Teguise LZ-2-3 8.90
Playa Honda Tahiche LZ-2-3-1 9.70
Playa Honda Pto. Del Carmen LZ-40-2 8.60
Playa Honda Playa Blanca LZ-2 33.30
Playa Honda Pto. Calero LZ-2 14.00
Tinajo San Bartolomé LZ-20 10.90
Tinajo Yaiza LZ-67 16.40
Pto. Del Carmen Haría LZ-40-2-3-1-10 39.80
Source: Direct survey. Developed by the authors.
To achieve more sustainable mobility, there should be more means of transportation
and intermodal transportation, including the introduction of more ecological vehicles,
consciousness-raising campaigns, and demystification of private transportation and possession of
high-end vehicles as social status items [53]. Lanzarote’s character as an island makes private rental
transport a necessity that encourages the geographical distribution of the benefits of tourist activity
and satisfies the needs and expectations of tourists’ visits, granting tourists a degree of flexibility.
Further, the geographical dispersal of tourist attractions and lodging requires quick flexible use of
transportation that can respond to the tourist’s needs. Given the small amount space, rental vehicle
firms in Lanzarote should be given incentives to renew their car fleets with ecological vehicles and
to improve intermodal transportation by imitating other European models implemented in small
spaces, such as the natural environment of the ski station Zermatt (Switzerland), in which this kind of
instrument has been organized, prohibiting the use of the conventional automobile and permitting
only electric car and train [54].
6. Conclusions and Discussion
Tourist trips often take place in areas with unique environmental and social characteristics
that make these places particularly sensitive to degradation and requiring support for modes of
transportation with a lower environmental impact. Managing mobility can prevent the degradation
of the environment through the use of strategies such as the improvement of public transportation,
commitment to ecological transportation, management of parking lots, distribution of transportation
guides, etc. The availability of different transportation alternatives in tourist areas improves
accessibility for visitors, as well as for tourist industry employees. Thus, managing mobility also
benefits tourism, because among other things, it generates savings, reduces traffic jams, and improves
habitability and conditions of access. Our research shows that in small protected spaces like the
island of Lanzarote, rental vehicle transportation has been a good instrument for the tourist until
now, although it creates environmental problems. The tourism developed on the island is based on
numerous tourist spots scattered throughout the island, some of them in environmentally protected
areas. This poses a challenge in the planning of public transport. According to the data provided bySustainability 2019, 11, 739 14 of 17
the survey, tourists highly value the capacity of the mode of transportation to access tourist spots and
the freedom to arrange their visit. Other modes of transportation with lower environmental impact
than cars will hardly meet these criteria.
The assessment of sustainability is higher amongst young people, tourists with higher levels of
education, and foreign tourists. The demand of sustainable transportation on the part of the tourists
will probably increase in the future. Public authorities should plan sustainable alternatives for the
future to meet the necessities of tourism and work around the particular characteristics of the island.
Electric car rentals are possibly a good option, given that they meet the requirements of tourists
and have a low environmental impact. In this sense, and considering the distances between tourist
spots and resorts, there should be a large investment in charge stations. Rental vehicles should not
necessarily be replaced but should be complemented by other means of transportation with less
environmental impact. The results of our study show the importance of and need for planning and
management of mobility in protected natural spaces in the presence of mass tourism.
We propose that public transportation be stimulated and improved for residents in order to gain
energy efficiency and coherence in trips. These measures will have a clear effect on the congested
roadways and on accessibility. We also propose rationalizing the use of private transportation based
on better planning at the levels of territory, labour, etc. Finally, the island should commit itself to
sustainable intermodal transportation appropriate to the economic and functional needs of its residents.
As for specific proposals for tourists, the island should make a direct and decisive commitment to
ecological vehicles. It can do this by promoting these vehicles, expanding the points for recharging
them, and creating parking lots in centres of tourist interest. For intermodal transportation, Lanzarote
should foster connections to ecological vehicles inside the points of tourist interest and to bicycle
routes, pedestrian zones, and individual electric vehicles. These measures are complemented by a
commitment to improving the roadway infrastructure and providing appropriate information for
users, which will help both residents and visitors.
This paper shows that the challenges posed by mobility on this island are a complex matter.
The number of private vehicles should be reduced in environmentally sensitive spaces, but due to the
widespread location of tourist locations, it is hard to achieve. However, a combination of private and
collective transportation based on electric vehicles could help to reduce the number of vehicles on the
island, while still allowing the tourists to visit the most sensitive spots. Moreover, this would also
meet the demands of some tourists who require a professional driver that knows the area, especially in
remote areas. The key to doing so is to plan a possible combination of elements with enough frequency
that they are able to adjust to the necessities of the tourists. Likewise, it is important to collaborate
with the hotel industry to provide them with information about transportation possibilities, as well
as to be able to coordinate the transportation necessities of the tourists in order to share it with other
facilities and optimize collective modes of transportation. Car rental companies should work jointly
with the public administration sector, with the aim of designing the future of intermodal transport
and planning the implantation of charging stations for electric vehicles. The results of the survey
show that tourists nowadays, and increasingly in the future, will demand more sustainable modes of
transportation. Therefore, it is the responsibility of public administrations to offer viable solutions in
this regard. Local- and worker-oriented transportation cannot be set apart or cast into oblivion when
designing the island’s transportation network. The geographical dispersion of the tourist spots also
affects these collectives, whom must be offered viable solutions so that they can also have access to
sustainable modes of transportation.
This research has proven that in order to analyze tourist mobility, we must perform a
comprehensive analysis of the destination as well as the elements influencing tourist mobility, the most
widespread modes of transportation, and the assessment of the tourists in regard to the elements they
consider most important when choosing a mode of transportation. This research should be developed
in the future by applying the same model of analysis in islands with similar characteristics in order to
complete the data obtained in this study.Sustainability 2019, 11, 739 15 of 17
Author Contributions: J.M.M.M. designed and coordinated the research, was in charge of the bibliographic
research, and part of the conclusions. J.M.G.M., A.S.R. and V.M.M. were in charge of the data treatment and the
collection of the information derived from it, as well as part of the conclusions.
Funding: This research received no external funding.
Conflicts of Interest: The authors declare no conflict of interest.
References
1. Savage, M. Ecological Disturbance and Nature Tourism. Geogr. Rev. 1993, 83, 290–300. [CrossRef]
2. Martín, J.M.; Rodriguez, J.A.; Zermeño, K.A.; Salinas, J.A. Effects of Vacation Rental Websites on the
Concentration of Tourists—Potential Environmental Impacts. An Application to the Balearic Islands in Spain.
Int. J. Environ. Res. Public Health 2018, 15, 347. [CrossRef] [PubMed]
3. Martín, J.M.; Guaita, J.M.; Salinas, J.A. An Analysis of the Factors behind the Citizen’s Attitude of Rejection
towards Tourism in a Context of Overtourism and Economic Dependence on This Activity. Sustainability
2018, 10, 2851. [CrossRef]
4. Chávez, R.M.; Cifuentes, J.L.; Andrade, E.; Espinoza, R. Huella Ecológica y Turismo Sostenible. Teoría Praxis
2006, 1582, 147–156.
5. Barret, S. Implementation Studies: Time for a Revival? Personal Reflections on 20 years of implementation
studies. Public Adm. 2004, 82, 249–262. [CrossRef]
6. Martín, J.M.; Salinas, J.A.; Rodríguez, J.A.; Jiménez, J.D. Assessment of the Tourism’s Potential as a
Sustainable Development Instrument in Terms of Annual Stability: Application to Spanish Rural Destinations
in Process of Consolidation. Sustainability 2017, 9, 1692. [CrossRef]
7. Prats, F.; Míguelez, A. Lanzarote en la biosfera: Una estrategia hacia el desarrollo sostenible de la isla: Aplicación de
la Agenda 21 Local a Lanzarote; Cabildo Insular: Lanzarote, Spain, 1998.
8. CMMAD. Informe de la Comisión Mundial sobre el Medio Ambiente y el Desarrollo; United Nations:
New York, NY, USA, 1987.
9. Ivars, J.A. Regional tourism planning in Spain: Evolution and Perspectives. Ann. Tour. Res. 2004, 31, 313–333.
[CrossRef]
10. WTO. Tourism Report Year 2000 and Beyond Qualitative Aspects; World Tourism Organization:
Madrid, Spain, 1993.
11. Estevan, A.; Del Val, A. Los sectores ambientales clave. Cuad. Del Sureste 2000, 1, 5–6.
12. Ullastres, H. Turismo Sostenible en el Mediterráneo: Guía Para la Gestión Local; Brau Editions: Girona, Spain, 1998.
13. Aranburu, I.; Plaza, B.; Esteban, M. Sustainable Cultural Tourism in Urban Destinations: Does Space Matter?
Sustainability 2016, 8, 699. [CrossRef]
14. Getz, D. Capacity to Absorb Tourism. Concepts and Implications for Strategic Planning. Ann. Tour. Res.
1983, 10, 239–263. [CrossRef]
15. Roig, F. Análisis de Capacidad de Carga en los Espacios Litorales, Calas y Playas, Situados en Areas Naturales de
Especial Interés de la Isla de Menorca, in Fernández Gutiérrez et al. Turismo y Transformaciones Urbanas en el siglo;
Universidad de Almería: Almería, Spain, 2002; Volume XXI, pp. 325–335.
16. Zhong, L.; Buckley, R.C.; Wardle, C.; Wang, L. Environmental and visitor management in a thousand
protected areas in China. Biol. Conserv. 2015, 181, 219–225. [CrossRef]
17. Cheung, L.T.O.; Lo, A.Y.H.; Fok, L. Recreational specialization and ecologically responsible behaviour of
Chinese birdwatchers in Hong Kong. J. Sustain. Tour. 2017, 25, 817–831. [CrossRef]
18. Buckley, R.; Linsheng, Z.; Ma, X. Visitors to protected areas in China. Biol. Conserv. 2017, 209, 83–88. [CrossRef]
19. Li, J. On Chinese ecotourists characteristics and motivational factors: Making the Shaanxi TaiBai National
Park as an example. Econ. Geogr. 2005, 5, 720–727.
20. Liang, J.; Wang, J.Y. Ecotourist motivation analysis based on a structural equation model: A case study in
Mao’er Mountain National Nature Reserve in Guangxi. J. Northwest. For. Univ. 2013, 28, 227–233.
21. Ma, A.T.; Chow, A.S.; Cheung, L.T.; Liu, S. Self-determined travel motivation and environmentally
responsible behaviour of Chinese visitors to national forest protected areas in South China. Glob. Ecol. Conserv.
2018. [CrossRef]Sustainability 2019, 11, 739 16 of 17
22. Chow, A.S.Y.; Cheng, I.N.Y.; Cheung, L.T.O. Self-determined travel motivations and ecologically responsible
attitudes of nature-based visitors to the Ramsar wetland in South China. Ann. Leisure Res. 2017, 42–61.
[CrossRef]
23. Cheung, L.T.O. A segmentation analysis of participants´preferences in the selection of an ecotourism-training
course. J. Ecotour. 2017, 17, 123–139. [CrossRef]
24. Davenport, J.; Davenport, J.L. The impact of tourism and personal leisure transport on coastal environments:
A review. Estuar. Coast. Shelf Sci. 2006, 67, 280–292. [CrossRef]
25. Gormsen, E. The impact of tourism on coastal áreas. GeoJournal 1997, 42, 39–54. [CrossRef]
26. Burak, S.; Dogˇan, E.; Gaziogˇlu, C. Impact of urbanization and tourism on coastal environment.
Ocean Coast. Manag. 2004, 47, 515–527. [CrossRef]
27. Martín, J.M.; Jiménez, J.D.; Molina, V. Impacts of seasonality on environmental sustainability in the tourism
sector based on destination type: An application to Spain’s Andalusia region. Tour. Econ. 2014, 20, 123–142.
[CrossRef]
28. Martin, J.M. Impacts of the Tourist Activity and Citizens’ Evaluation about the Necessity for Resting Periods.
In Strategic Perspectives in Destination Marketing; IGI Global: Hershey, PA, USA, 2019; pp. 81–112.
29. Archer, B.; Fletcherb, J. The economic impact of tourism in the Seychelles. Ann. Tour. Res. 1996, 23, 32–47.
[CrossRef]
30. Chadee, D.D.; Mattsson, J. An Empirical Assessment of Customer Satisfaction in Tourism. Serv. Ind. J. 1996,
16, 305–320. [CrossRef]
31. Ekiz, E.H.; Bavik, A. Scale Development Process: Service Quality in Car Rental Services. Electron. J. Bus.
Res. Methods 2008, 6, 133–146.
32. Rodriguez, J.A.; Jiménez, J.D.; Salinas, J.A.; Martin, J.M. Millennium Development Goals 4 and 5: Progress in
the least developed countries of Asia. Soc. Indic. Res. 2015, 129, 489–504.
33. Rodriguez, J.A.; Martin, J.M.; Jiménez, J.D. A Synthetic Indicator of Progress towards the Millennium
Development Goals 2, 3 and 4 in the Least Developed Countries (LDCs) of Asia. Appl. Res. Qual. Life 2018,
13, 1–19.
34. Rodriguez, J.A.; Aguilera, J.D.; Martin, J.M.; Salinas, J.A. Crisis in the Horn of Africa: Measurement of
Progress towards Millennium Development Goals. Soc. Indic. Res. 2018, 135, 499–514.
35. Rodriguez, J.A.; Martin, J.M.; Salinas, J.A. Assessing MDG 6 in Sub-Saharan Africa: A territorial analysis
using a synthetic indicator. Rev. Econ. Mund. 2017, 47, 203–222.
36. Martin, J.M.; Salinas, J.A.; Rodriguez, J.A. Comprehensive evaluation of the tourism seasonality using a
synthetic DP2 indicator. Tour. Geogr. 2018. [CrossRef]
37. UNWTO–UNEP–WMO. Climate Change and Tourism: Responding to Global Challenges; UNWTO: Madrid, Spain,
2008.
38. Bows, A.; Upham, P.; Anderson, K. Growth Scenarios for EU and UK Aviation: Contradictions with Climate Policy;
Tyndall Centre Working Paper 84; Tyndall Centre: London, UK, 2006.
39. Tight, M.R.; Bristow, A.L.; Pridmore, A.; May, A.D. What is a sustainable level of CO2 emissions from
transport activity in the UK in 2050? Transp. Policy 2005, 12, 235–244. [CrossRef]
40. Dubois, G.; Jean-Paul, P.; Ceron, J.P.; Gössling, S. The future tourism mobility of the world population:
Emission growth versus climate policy. Transp. Res. Policy Pract. 2011, 45, 1031–1042. [CrossRef]
41. Høyer, K.G. Sustainable Tourism or Sustainable Mobility? The Norwegian Case. J. Sustain. Tour. 2000, 8,
147–160. [CrossRef]
42. Ceron, J.P.; Dubois, G. Limits to Tourism? A Backcasting Scenario for Sustainable Tourism Mobility in 2050.
Tour. Hosp. Plan. Dev. 2007, 4, 191–209. [CrossRef]
43. Verbeek, D.; Mommaas, H. Transitions to Sustainable Tourism Mobility: The Social Practices Approach.
J. Sustain. Tour. 2008, 16, 629–644. [CrossRef]
44. Jiménez, J.D.; Martín, J.M.; Montero, R. Felicidad, desempleo y crisis económica en Andalucía. Algunas
evidencias. Rev. Estud. Reg. 2014, 99, 183–207.
45. Canary Islands Institute of Statistics (ISTAC). Available online: www.gobiernodecanarias.org/istac/
(accessed on 13 August 2018).
46. Ferrari, G.; Mondejar, J.; Vargas, M. Environmental sustainable management of small rural tourist enterprises.
Int. J. Environ. Res. 2010, 4, 407–414.Sustainability 2019, 11, 739 17 of 17
47. Yu, C.; Cole, S.T.; Chancellor, C. Resident Support for Tourism Development in Rural Midwestern (USA)
Communities: Perceived Tourism Impacts and Community Quality of Life Perspective. Sustainability 2018,
10, 802. [CrossRef]
48. Alvarez-Uría, P.; Sabanes, M. Estrategia Lanzarote. 2020; Cabildo de Lanzarote: Lanzarote, Spain, 2014.
49. Hernandez, J.A. Efectos territoriales del actual modelo de transporte terrestre en Canarias. Ciudad Territ.
Estud. Territ. 2007, 657–688.
50. Kassomenos, P.; Karakitsios, S.; Papaloukas, C. Estimation of daily traffic emissions in a South-European
urban agglomeration during a workday. Evaluation of several “what if” scenarios. Sci. Total Environ. 2006,
370, 480–490. [CrossRef] [PubMed]
51. National Institute of Statistics (NIS). Available online: www.ine.es (accessed on 13 August 2018).
52. Lanzarote Tours. Available online: www.lanzarotetours.com (accessed on 13 August 2018).
53. Estevan, A.; Sanz, A. Hacia la Reconversión Ecológica del Transporte en España; Bakeaz: Bilbao, Spain, 1996.
54. Suter, R.; Benz, S. Road-Pricing Zermatt Demand Management in a Village without Cars. In Proceedings
of the 16th ITS World Congress and Exhibition on Intelligent Transport Systems and Services,
Stockholm, Sweden, 21–25 September 2009.
© 2019 by the authors. Licensee MDPI, Basel, Switzerland. This article is an open access
article distributed under the terms and conditions of the Creative Commons Attribution
(CC BY) license (http://creativecommons.org/licenses/by/4.0/).You can also read