A Framework to Predict Consumption Sustainability Levels of Individuals - MDPI
←
→
Page content transcription
If your browser does not render page correctly, please read the page content below
sustainability

Article
A Framework to Predict Consumption Sustainability
Levels of Individuals
Arielle Moro *        and Adrian Holzer
 Information Management Institute, University of Neuchâtel, A.L. Breguet 2, CH-2000 Neuchâtel, Switzerland;
 adrian.holzer@unine.ch
 * Correspondence: arielle.moro@unine.ch

 Received: 10 December 2019; Accepted: 10 February 2020; Published: 14 February 2020

 Abstract: Innovative Information Systems services have the potential to promote more sustainable
 behavior. For these so-called Green Information Systems (Green IS) to work well, they should
 be tailored to individual behavior and attitudes. Although various theoretical models already
 exist, there is currently no technological solution that automatically estimates individual’s current
 sustainability levels related to their consumption behaviors in various consumption domains
 (e.g., mobility and housing). The paper aims at addressing this gap and presents the design of
 GREENPREDICT, a framework that enables to predict these levels based on multiple features, such
 as demographic, socio-economic, psychological, and factual knowledge about energy information.
 To do so, the paper presents and evaluates six different classifiers to predict acts of consumption on
 the Swiss Household Energy Demand Survey (SHEDS) dataset containing survey answers of 2000
 representative individuals living in Switzerland. The results highlight that the ensemble prediction
 models (i.e., random forests and gradient boosting trees) and the multinomial logistic regression
 model are the most accurate for the mobility and housing prediction tasks.

 Keywords: sustainable consumption behavior; green technology; transitioning to sustainability;
 data analytics; decision making; green information systems

1. Introduction
      Standing in front of the European Parliament in 2019, the young climate activist Greta Thunberg
warned: “The climate and ecological emergency is right here, right now. But it has only just begun, it
will get worse.” (Greta Thunberg full speech at the European Parliament in Strasbourg (2019-04-16):
https://www.youtube.com/watch?v=cJAcuQEVxTY). Science agrees. The number and the severity
of climatic disasters, such as massive melting ice, devastating storms, and wildfires, are increasing,
making life progressively harder for our ecosystem (fauna and flora). The main cause is known:
human activity. The good news, according to the experts of the Intergovernmental Panel on Climate
Change (IPCC), is that it seems still possible to reduce the greenhouse gas emissions, if we make the
appropriate decisions now and adopt more sustainable consumption behaviors (IPCC fifth report:
http://www.ipcc.ch/pdf/assessment-report/ar5/syr/SYR_AR5_FINAL_full_wcover.pdf).
      Green Information Systems (Green IS) could be powerful catalysts to help individuals move
towards more sustainability [1]. However, providing a one-size-fits-all solution is not adapted for
all individuals because they are not in the same socio-economical context and do not have the same
sustainable behavior for all consumption domains. For example, an individual who buys all her food
in bulk stores to reduce her waste but uses a private car every day has a higher food consumption
sustainability level compared to the one related to mobility. Consequently, she needs appropriate
positive incentives to reduce her carbon footprint in the mobility domain. Therefore, we consider that

Sustainability 2020, 12, 1423; doi:10.3390/su12041423                    www.mdpi.com/journal/sustainability
Sustainability 2020, 12, 1423 2 of 27
knowing the individual’s current sustainability levels of different consumption modes could help her
to reduce her carbon footprint.
To raise people’s awareness of the sustainability of their consumption behavior, there exist various
carbon footprint calculators [2–6]. Based on multiple consumption information given by an individual,
they can reveal the impact of their consumption in terms of pollution. However, these carbon footprint
calculators have several limitations [7]. Although these calculators are quite helpful for different
publics (e.g., for individuals or for policy-makers), they require various precise items of data related
to energy consumption by domains related to an individual or a country (e.g., tonnes of CO2 for
the mobility domain). This essential information must be entered by the user herself. There are
also various theoretical models for understanding and quantifying the sustainable consumption
behaviors of individuals in the literature [8,9]. However, there is no technological solution that could
estimate them at a fine-grained scale. Such a solution could process individuals’ data (demographics,
psychological attitudes, or socio-economic variables) to generate sustainability estimates. To create this
novel technological solution, a prediction model could estimate the sustainability level of a specific act
of consumption of an individual based on her personal data, as indicated above. Then, it would be
feasible to compute sustainability levels per domains (e.g., global, mobility, and housing) based on
various predictions of consumption acts. Various prediction models have already been used to predict
people’s behavior, such as regression models, neural networks or ensemble approaches [10–13]. Such
a technological solution could serve as building block for Green Information Systems (Green IS) or
other existing applications to automatically estimate the sustainability levels of consumption behavior
of users. In addition, such a solution could be complementary to the carbon footprint calculators for
policy-makers by analyzing the people’s behaviors at different geographical scales (e.g., neighborhood,
city, country, worldwide).
In this paper, we therefore propose GREENPREDICT, a framework that predicts the sustainability
levels of an individual based on multiple data (e.g., demographics, psychological attitudes, and
accommodation characteristics). This framework includes single consumption behavior indicators
(corresponding to specific acts of consumption) and aggregated indicators (per domain or overall),
which are computed on the basis of the single indicators. To explore the relevance of such a framework
and to evaluate it, we use a dataset called SHEDS, collected by the Competence Center for Research
in Energy, Society and Transition (SCCER CREST). It contains 15,000 survey responses (totaling
over 1,200,000 data points) of representative individuals living in Switzerland during three years
(2016–2018) and will end in 2020 (Swiss Household Energy Demand Survey (SHEDS) website: https:
//www.sccer-crest.ch/research/swiss-household-energy-demand-survey-sheds/). We evaluate the
framework from two points of view: a micro evaluation (single consumption behavior indicators) and
a macro evaluation (aggregated indicators per domain or overall). This research work is the follow-up
of a preliminary research published in the proceedings of the International Conference on Information
Systems (ICIS’19) [14]. This paper builds on this work and makes the following contributions.
• Proposing an innovative framework that allows urban planners, researchers, and Green IS
designers to obtain a fine-grained representation of the sustainable consumption behavior of an
individual (being complementary to existing carbon footprint calculators).
• Presenting a novel way to compute the sustainability levels of an individual and the related
fine-grained representations of her consumption behavior with a tree structure.
• Showing several comparative analyses of six classifiers per act of consumption related to mobility
and housing domains of Swiss individuals.
• Providing a detailed analysis of the features that are associated with the prediction of the
sustainability levels of Swiss individuals. This brings complementary insights regarding the
sustainable consumption behavior of individuals in general.
The paper is organized as follows. We highlight the related work close to our research domains in
Section 2. Then, the GREENPREDICT framework and its structure are presented in Section 3. The dataSustainability 2020, 12, 1423 3 of 27
science methodology, used to design and assess the framework, is explained in Section 4. The SHEDS
dataset, used for a micro evaluation about the predictions per act of consumption and a macro
evaluation about the entire framework, and its variables are described in Section 5. The evaluation
scheme, used to conduct the micro and macro evaluations, is presented in Section 6. The micro and the
macro evaluation results are detailed in Sections 7 and 8, respectively. Finally, Section 9 discusses the
results and wraps up with a conclusion.
2. Related Work
Hereafter, we discuss background literature on three important axes of this research work:
computing sustainability, modeling sustainable behavior, and predicting human behavior.
2.1. Computing Sustainability
The sustainability of an individual can be computed by using a carbon footprint measure [15].
The carbon footprint of an individual is the sum of all her emissions of greenhouse gas, including
CO2 . Computing this sum is obviously related to all her consumption activities belonging to mobility,
housing, food, clothing, etc. There are various carbon footprint calculators available on the Internet [16],
some of which are briefly presented in Table 1. They slightly differ in terms of the input data that
they use to compute the carbon footprint of an individual. For example, some of them require real
consumption numbers of a household, usually during one year, whereas others simply ask questions
related to consumption behaviors (e.g., means of transportation and diet preferences). Büchs et al. [17]
and Collins et al. [18] conducted an analysis of carbon footprint calculators and highlighted that they
help to increase the awareness of how daily activities can affect the planet. Büchs et al. also noticed
that effective voluntary behavioral changes are very costly and require ambitious and effective policies.
Table 1. List of several existing carbon footprint calculators.
Carbon Footprint Calculator Input Data Output Data
WWF Footprint Calculator Questions by consumption Percentage of our target impact on
(World Wildlife Fund) [6] domains the world (tonnes of CO2 )
Carbon Footprint Calculator kWh (electricity), km (car), Tonnes of CO2 by consumption
(Carbon Footprint Ldt) [2] water (liters), etc. domain (housing, car, bus and
train, etc.)
Personal Carbon Footprint Questions by consumption domain Global result of tonnes of CO2
(myclimate Foundation) [3]
Carbon Footprint Calculator Questions by consumption domain Tonnes of CO2 and percentages by
(United Nations) [5] consumption domain
Carbon Footprint Calculator Questions and precise numbers by Actions to reduce our impact
(The Nature Conservancy) [4] consumption domain and comparisons with similar
households
This related work allows us to highlight the recurrent elements of carbon footprint calculators.
Compared to the existing carbon footprint calculators mentioned above, our research work is focused
on the prediction of the sustainability levels of consumption behavior of an individual based on a large
number of consumption preferences and personal data of representative individuals in Switzerland,
and not solely based on the person’s own individual data. These elements give us some insights into
finding appropriate acts of consumption per domain that should be included in our framework.
2.2. Modeling Sustainable Behavior
Modeling people’s sustainable behavior is crucial to first understand the different types of
sustainable behaviors, and then to predict them. Kollmuss and Agyeman [9] studied economic, social,
and cultural factors that have an influence on pro-environmental behavior in order to better understandSustainability 2020, 12, 1423 4 of 27
them. To do so, they proposed a model to study a pro-environmental behavior using internal factors
(e.g., knowledge, attitudes, and personality traits) and external factors (e.g., infrastructure, political,
social, and cultural). Clark et al. [19] conducted a similar study in the context of a green electricity
program. They highlighted that biocentric, altruistic, and egoistic motives were the three main
motivations to participate in this green program. Other researchers highlighted that emotional
criteria (e.g., emotional attachment/taking care of a virtual polar bear) and individuals’ awareness
could have a high impact on increasing green behavior, as described in the following papers [20,21].
Juárez-Nájera et al. [22] analyzed the influence of moral norms and values on sustainable behaviors of
individuals in higher institutions in German and Mexican universities. They found that the main factors
that explain a sustainability behavior are ascription of responsibility, universal values and personal
intelligence. In Spain, the most important social factors that determine sustainable consumption
behavior of individuals were found to be: environmental influences (e.g., traditions), education,
information, and market conditions [23].
In the mobility domain, Van Acker et al. [24] analyzed individuals’ lifestyles; how they have an
influence on their mobility; and, more importantly, how they can move towards more sustainable
behaviors. Regarding the electricity domain, Guo et al. [25] reviewed and assessed existing works
related to residential electricity consumption, from the factors to the adoption of sustainable plans. To
better understand how to model the sustainable behavior of an individual, Geiger et al. [8] presented a
theoretical model, called Sustainable Consumption Behavior (SCB) cube. This model takes into account
two sustainable dimensions (ecological and socio-economic) and includes multiple consumption areas
and various consumption phases.
This related work gives us crucial elements regarding the variables that could affect a sustainable
behavior. In terms of research gaps, we can first indicate that although there exist several theoretical
models that allow researchers to study the sustainability of an individual, there is no technological
solution to predict it. Second, there is no model (even theoretical) that estimates several levels
of sustainability of an individual based on her personal data (e.g., demographics, location, and
psychological data). The closest existing model to our solution is the Sustainable Consumption
Behavior (SCB) cube. However, this model is not a technological solution and does not include a
prediction approach.
2.3. Predicting Human Behavior
In the context of sustainability, several studies have used machine learning techniques to predict
certain desirable outcomes, e.g., to evaluate human behavior such as the helpfulness of online reviews
for sustainable marketing [26]. In this study, we focus in particular on predicting human consumption
behavior. Human behavior can be analyzed from a dynamic point of view (i.e., the evolution of the
behavior) or a static point of view (i.e., the behavior at a single point in time).
From a dynamic point of view, Subrahmanian and Kumar [27] indicated that the prediction models
need to learn the behavioral changes in order to increase their performance. This is particularly relevant
because human behaviors are constantly evolving. Regarding the mobility domain, Pentland and
Liu [28] used a Markov chain model to predict the behavior of automobile drivers. Kulkarni et al. [29]
analyzed the behavior of individuals by dynamically studying their movements over time and the
places they visited. Moro et al. [30] proposed an approach to translating human mobility movements
into entropy sequences to facilitate the analysis of human mobility behaviors. Then, this translation
enables the researchers to study the features that have an influence on human mobility behaviors. From
a static point of view, Wei et al. [12] presented a framework that includes several classifiers to predict
user personality based on heterogeneous information (e.g., social media data). Kim et al. [10] proposed
a genetic approach that combines several classifiers to predict customers’ purchasing behavior. Kim
and Yoon [11] described a model with a regression analysis that aims to predict green advertising
attitudes. The authors also studied the variables that have an influence on the attitudes to greenSustainability 2020, 12, 1423 5 of 27
advertising. Yang et al. [13] explored the prediction of individuals’ email reply behavior. They used
various prediction models (e.g., logistic regression and AdaBoost) and compared them.
Other types of behavioral research analyses could also be relevant for our research work, even if
they are not necessarily focused on humans. They can indeed highlight some other interesting models
and help us in choosing the best families of classifiers. Several authors used machine learning models
and strategies, such as active learning, neural network, logistic regression, and k-nearest neighbors to
generate behavioral predictions in various domains (from animal behavior to malware behavior)—see
the description in [31,32]. Zhou [33] carried out a data mining analysis about individual consumer
credit default prediction in the context of e-commerce. The researcher compared two different ensemble
approaches (bagging and boosting) and highlighted the importance of social features for this prediction
task. Finally, Zhang and Mahadevan [34] presented an ensemble of machine learning models to
predict the aviation incident risk, based on structured and unstructured data. More specifically,
they used an ensemble of deep neural networks for structured data and support vector machine for
unstructured data.
This related work is crucial for us to identify the families of prediction models that are best suited
for our multiclass classification problems, which must be addressed in our framework.
3. Framework
We introduce a framework, called GREENPREDICT, that enables to personalize Green IS application
based on an estimate of a user’s levels of consumption sustainability based on her personal data. The
input data of this framework consists in personal data of an individual (e.g., age, home place, and
workplace) and the level of sustainability domain (e.g., mobility and global sustainability level) that
the application wants to obtain. The output produced by the framework is the value that expresses the
level of sustainability linked to the specified domain. The framework is able to compute this value
based on the generation of a tree that provides an estimated view of the sustainable consumption
behavior of the individual. In order to compute this tree structure, the framework uses prediction
models related to different acts of consumption that are trained with various individuals’ data.
More specifically, Figure 1 depicts the structure of the framework and the functions that allow
developers of Green IS to use it. To provide the estimates of the sustainability levels of an individual,
the framework builds a tree with different (e.g., three) distinct levels that contain the sustainable
consumption behavior representation of the individual, as described in the center of Figure 1. The
leaves—i.e., the single sustainable consumption behavior indicators—correspond to the estimates of
sustainability levels of precise acts of consumption (e.g., home–work transportation mode, number
of long distance flights, and number of showers per week). The intermediary nodes and the root of
the tree, i.e., the aggregated sustainable consumption behavior indicators per domain and overall,
respectively, are the estimates of sustainability levels of specific consumption domain (e.g., mobility,
housing, and global). The single sustainable consumption behavior indicators are predicted by using
machine learning models, based on the personal information of the individual, whereas the aggregated
sustainable consumption behavior indicators per domain or overall are computed based on the
single indicators.
More formally, there are three ways to interact with the framework for the developers via functions.
On the right of Figure 1, Function (1) is an API that allows a Green IS application to directly use our
framework to build the sustainable consumption behavior representation (i.e., the tree) of an individual,
by providing a domain and the personal information of the individual (e.g., age, gender, income, and
home zip code).
get_sustainability(domain, user_data) (1)Sustainability 2020, 12, 1423 6 of 27
Training data Framework Description Application
Sustainable consumption behavior view of an individual (Green IS)
Multiple individuals’ data (3) Global Sustainability Level Personal individual data
train_model(…) get_sustainability(…)
(2) Mobility Sus. Level Housing Sus. Level
(1) Mob. Sus. Level 1 Mob. Sus. Level 2 Mob. Sus. Level 3 Hous. Sus. Level 1 Hous. Sus. Level 2 results
… set_tree_structure(…) …
(1) Predicting sustainability levels of an individual (single consumption indicators)
and (2 and 3) computing the aggregated consumption indicators
Figure 1. GREENPREDICT Framework overview.
On the left of Figure 1, two functions serve as System Programming Interface (SPI) to set up
the system. Function (2) enables the predictive models to be trained in order to operate correctly
to further create the entire sustainable consumption behavior view (i.e., the tree) of an individual.
This function requires a prediction task, which is the sustainability level that we want to predict
between all the sustainability levels that are possible to predict at the lower levels of the tree (e.g.,
SHORT _ MIDDLE _ FLIGHT, HOME _ WORK _ TRANSPORT _ MODE), whereas the training data helps to build
the model that corresponds to the selected prediction task.
train_model ( pred_task, training_data) (2)
On the left of Figure 1, there is a second function that enables us to set the tree
structure, i.e., Function (3). This function needs a domain (e.g., SHORT _ MIDDLE _ FLIGHT _ NB ,
HOME _ WORK _ TRANSPORTATION _ MODE , MOBILITY, FOOD , AND ALL), an upper domain, and a weight
related to this domain. The upper domain enables to define the structure of the tree. For example, the
upper domain of short_middle_flight_nb is mobility. However, the upper domain of the top domain,
called all, must be empty because there is no domain above this specific domain (i.e., root of the tree
structure). The model sets a default weight of 1.0 for each indicator and allows experts to fine-tune
them if needed. For example, we first choose all the weights of the acts of consumption of the mobility
and housing domains. Then, we set all the weights of the aggregated indicators per domain: for the
mobility and the housing domains. Finally, the aggregated indicator (i.e., the root of the tree) always
has a weight of 1.0 because there is only one value at this level.
set_tree_structure(domain, upper_domain, weight) (3)
3.1. Use Cases
GREENPREDICT can be used in several different Green IS contexts such as recommender systems,
sustainability awareness systems, and data analytics for urban planners.
3.1.1. Recommender Systems
Today, recommender systems are embedded into a lot of existing applications and are therefore
used by individuals on a daily basis (e.g., in social networks and streaming applications). With the
use of GREENPREDICT, existing applications could estimate the sustainability levels of the consumption
behavior of their users with the unique amount of data they already have about them (e.g., age and
main location). This could enable existing applications to promote green content or to target the right
users of green services.
3.1.2. Sustainability Awareness Systems
Raising awareness of people’s actual carbon footprint can be a first step towards changing their
behavior. Carbon footprint calculators are therefore powerful tools. GREENPREDICT can improve the
user experience with such calculators in two ways. First, it can reduce the input friction by providingSustainability 2020, 12, 1423 7 of 27
first estimates about acts of consumption based on simple user demographic data or other types of data
(e.g., distance home–work) depending on their relevance to predict the sustainability levels, without
the need to fill in a whole questionnaire. Second, it can enable gamification features to motivate people
to improve their footprint compared to people with similar profiles. Finally, GREENPREDICT could also
help to raise sustainability awareness in schools in Switzerland embedded in a playful game, in order
to create the most sustainable persona with appropriate personal characteristics as input.
3.1.3. Data Analytics for Urban Planners
In this last context of use, data analytics and visualization systems could be used by urban
planners to design and implement new smart city services. These new services could lead to fostering
the development of more sustainable cities and, consequently, more sustainable behavior of citizens.
GREENPREDICT could display sustainability trends via the estimations and help to design new versions
of cities and the organization and management of their infrastructure and accommodation. For
instance, the data used in this context could be data of a fictive representative user who lives in a
certain neighborhood of a city.
3.2. Predicting Single Consumption Indicators
GREENPREDICT creates a tree that represents the sustainable consumption behavior of an individual
with different distinct levels, for example three levels, as depicted in Figure 1. The single sustainable
consumption behavior indicators (i.e., the leaves of the tree) correspond to the estimates of acts
of consumption of an individual (e.g., home–work transportation mode and number of showers
per week). We treat these estimates as multiclass classification problems with three distinct classes:
low, medium, and high sustainability levels, which represent high, medium, and low greenhouse
gas emission impacts, respectively. Various prediction models can help to solve these multiclass
classification problems, in the following section we detail several of them and evaluate their accuracy
and effectiveness.
3.3. Computing Aggregated Consumption Indicators
Whereas single indicators are focused on an act of consumption, aggregated indicators combine
several acts of consumptions into a consumption domain (e.g., mobility and housing) or several
domains into a global sustainability level as illustrated in Figure 1. The aggregated sustainable
consumption indicators are computed by performing a weighted average of the values of the lower
indicators according to their pollution impact.
Algorithm 1 shows how these values are aggregated. This algorithm takes two variables
as input (low_indicators AND low_indicator_weights) and returns their weighted mean as output.
The input variable low_indicators is an array that contains all the sustainability indicators from
lower levels of the tree (acts of consumption or lower aggregated indicators). The second input
variable low_indicator_weights is an array composed of the weights of each lower indicator. For
instance, to compute the aggregated mobility indicator, the variable low_indicators contains the
three single sustainability indicator results of the mobility consumption domain (see Figure 1) and
low_indicator_weights the corresponding weights of each single indicator given in low_indicators.
Then, to compute the global sustainable indicator of an individual, the variable low_indicators contains
the two aggregated indicators per domain, i.e., mobility and housing, computed previously (see
Figure 1) and low_indicator_weights their corresponding weights. As indicated in Algorithm 1, the
output is a continuous value in the range of [0, 2], both included.Sustainability 2020, 12, 1423 8 of 27 Algorithm 1 Compute an aggregated indicator (res) from the lower ones (low_indicators) and their weights (low_indicator_weights). Require: low_indicators = [...] and low_indicator_weights = [...] Ensure: res >= 0 and res
Sustainability 2020, 12, 1423                                                                                           9 of 27

                                Table 2. List of types of variables contained in SHEDS dataset.

 Variable Group                          Variable Name                           Value
                                         Age                                     Z
                                         Gender                                  {Female, Male}
                                                                                 {Single person household,
                                         Household type
 Demographic and                                                                 Couple with children, etc.}
 socio-economic variables (17)           Homeplace zip code                      Z
                                         Workplace zip code                      Z
                                                                                 {3000 or less, 3000–4499
                                         Household monthly gross income
                                                                                 4500–5999, 6000–8999, ...}
                                         ...                                     ...
                                         Accommodation type                      {Flat in a building with less than 5 flats, ...}
 Accommodation                           Size of the living area                 Z
 variables (21)                          Distance to the grocery store           {
Sustainability 2020, 12, 1423 10 of 27
1. Low sustainability level (2): High pollution impact;
2. Medium sustainability level (1): Medium pollution impact;
3. High sustainability level (0): Low pollution impact.
Table 3. List of predicted values.
Consumption Domain Act of Consumption Raw Value Predicted Value
Home–work transportation mode Category
Mobility Leisure activities transportation mode Category
Short/middle distance flight number Integer {Low sustainability Level (2),
Long distance flight number Integer Medium sustainability level (1),
Number of electric devices owned Integer High sustainability level (0)}
Housing Number of use of 4 electric devices Integer
per week
Number of showers per week Integer
We selected the seven groups of features (see the list below), which are partially described as
variables in Table 2, to predict these values by using classifiers. For ethical reasons, note that we
did not grade the factual knowledge answers of a participant about energy, we took the answers of
the questions that belong to this category independently to highlight if they are associated with a
specific prediction task. An extensive description of all these features can be found in a document
available online (Swiss Household Energy Demand Survey (SHEDS) 2018 documentation: https:
//www.sccer-crest.ch/fileadmin/user_upload/SHEDS2018_Questionnaire_Codes_EN.pdf).
1. Demographic and socio-economic features.
2. Accommodation features.
3. Psychological attitudes features.
4. Social performance features.
5. Habits and routines features.
6. Social context features.
7. Factual knowledge about energy features.
To translate the raw values of acts of consumption into these three possible sustainability levels,
we convert the categories into sustainability levels according to their pollution impact and we map the
numerical values into sustainability levels by analyzing the distributions of these numerical values.
The distributions of each act of consumption are depicted in Figures 2 and 3. The first two mobility
acts of consumption are not presented in the figures because they were defined according to categories
and not numerical values as described in Table 4.
For the last two mobility and the three housing acts of consumption, we extracted the three
sustainability levels of each of them using the mean and standard deviation. Every low boundary was
computed by subtracting half the standard deviation from the mean of its related distribution and
every high boundary was computed by adding half the standard deviation to the mean. This means
that the levels are relative rather than absolute indicators of sustainability. These values are presented
in Table 4 below. The three sustainability levels identified for each act of consumption are based on
the dataset. The levels are, therefore, relative and depend on the context of the population studied.
In total, we extracted 1983 participant answer records from the SHEDS dataset of the year 2018 and
before (2016 and 2017), in cases where the participant answers did not change from one year to another.
Note that the number of showers per week is divided by the total number of people living in the
participant’s household because the participant gives this total number for the entire household.Sustainability 2020, 12, 1423 11 of 27
Figure 2. Distributions of the last two mobility acts of consumption.
Figure 3. Distribution of the three housing acts of consumption.Sustainability 2020, 12, 1423 12 of 27
Table 4. List of the acts of consumption with their three sustainability levels and their precise values.
Act of Consumption Predicted Value Raw Value/Low/High Boundary
Low sustainability level (2) Private car/motorbike
Home–work transportation mode
Medium sustainability level (1) Car sharing/public transportation
High sustainability level (0) Soft mobility/works from home
Low sustainability level (2) Private car/motorbike
Leisure activities transportation mode
Medium sustainability level (1) Car sharing/public transportation
High sustainability level (0) Soft mobility/works from home
Low sustainability level (2) >2
Short/middle distance flight number
Medium sustainability level (1) >1 or 0 or 12.480 or 6.646 or 3.423 orSustainability 2020, 12, 1423 13 of 27
evaluation, which will be detailed in Section 8, is to evaluate the accuracy performance of the
aggregated indicators from the estimates of the single indicators by taking into account the best
prediction models found during the micro evaluation. More technically, we used the Python
programming language and the open-source Scikit-Learn Python library (Scikit-Learn Python library
documentation: https://scikit-learn.org/stable/) to set and assess the machine learning models and
evaluate the entire framework.
Training and Test Set(s) for the Micro and Macro Evaluations. We divided the original dataset
(1983 participant answer records) into two sets: a training set (80%) and a test set (20%). As depicted
in Figure 4, the test set is considered as a hidden set for the entire framework during the macro
evaluation. The training set is used to identify the best prediction models during the micro evaluation.
The training and test set are both used to evaluate the entire framework during the macro evaluation.
The distribution and the proportion of SHEDS participants per sustainability level and per act of
consumption are detailed in Table 5.
Table 5. Distribution and proportion of participants per sustainability level and per act of consumption
(80% and 20% of the dataset).
Act of Sustainability 80% of the Dataset 20% of the Dataset
Consumption Level (Model Evaluation) (Framework Evaluation)
0 324/≈ 20.4% 80/≈ 20.2%
Home–work transportation mode 1 605/≈ 38.1% 156/≈ 39.3%
2 657/≈ 41.4% 161/≈ 40.6%
0 300/≈ 18.9% 69/≈ 17.4%
Leisure activities transportation mode 1 360/≈ 22.7% 90/≈ 22.7%
2 926/≈ 58.4% 238/≈ 59.9%
0 1035/≈ 65.3% 259/≈ 65.2%
Short/middle distance flight number 1 246/≈ 15.5% 60/≈ 15.1%
2 305/≈ 19.2% 78/≈ 19.6%
0 1079/≈ 68.0% 270/≈ 68.0%
Long distance flight number 1 321/≈ 20.2% 83/≈ 20.9%
2 186/≈ 11.7% 44/≈ 11.1%
0 447/≈ 28.1% 110/≈ 27.7%
Number of electric devices owned 1 653/≈ 41.1% 153/≈ 38.5%
2 489/≈ 30.8% 134/≈ 33.8%
0 541/≈ 34.1% 128/≈ 32.2%
Number of use of 4 electric devices per week 1 666/≈ 42.0% 166/≈ 41.8%
2 379/≈ 23.9% 103/≈ 25.9%
0 506/≈ 31.9% 127/≈ 32.0%
Number of showers per week 1 593/≈ 37.4% 148/≈ 37.3%
2 487/≈ 30.7% 122/≈ 30.7%
7. Micro Evaluation
In this evaluation, we perform a comparative analysis of several classifiers to identify the best
models to predict the single sustainable consumption behavior indicators, i.e., the sustainability levels
of the seven acts of consumption of an individual presented in Table 5. The evaluation process consists
of three main steps: (1) selecting the classifiers, (2) finding the best classifier parameters using a
k-folds cross-validation, and (3) comparing them with the best parameters. We also extract the 20 most
important features that are associated with the different acts of consumption.
7.1. Selecting the Classifiers
We chose six supervised learning classifiers in order to predict the sustainability levels of
consumption behavior of an individual. We selected the classifiers that can solve multiclass
classification problems.Sustainability 2020, 12, 1423 14 of 27
7.1.1. Decision Tree
A decision tree is a simple classifier that enables us to solve a multiclass classification problem.
The main strength of this model is that it can be visualized and read from the top (i.e., the root of
the decision tree) to the bottom (i.e., the leaves of the decision tree). The internal nodes of the tree,
including the root, are conditions that are followed by branches and then other internal nodes until
eventually reaching the leaves of the tree. The leaves are the different possible decision values (i.e., the
three possible sustainability level values in our context).
7.1.2. Random Forests
A random forest classifier is an ensemble of decision tree classifiers. This classifier is usually
trained with the bagging approach. This bagging approach randomly selects several data subsets and
therefore trains different decision trees. The final prediction is computed from the aggregation, usually
average, of the predictions of these multiple decision trees. This approach reduces the variance and
therefore a possible overfitting issue.
7.1.3. Gradient Boosting Trees
A gradient boosting tree classifier is an ensemble of decision tree classifiers based on a boosting
approach. A boosting approach creates a series of weak decision tree classifiers that are linked to each
other until reaching the final prediction output. These weak classifiers can use different combinations
of features and are usually weighted according to their own accuracy. This approach decreases not
only the variance (i.e., overfitting), but also the bias (i.e., underfitting).
7.1.4. Multinomial Logistic Regression
A multinomial logistic regression classifier is based on the logistic regression classifier adapted
to a multiclass classification problem. More specifically, the chosen multinomial logistic regression
classifier, implemented in the Scikit-Learn Python library, uses a cross-entropy loss approach. A linear
model computes the scores of each candidate category and then the final predicted value is obtained
using a softmax function followed by a cross-entropy loss.
7.1.5. Support Vector Machine
A support vector machine classifier is an approach that computes decision boundaries from
hyperplanes and margin maximization. This approach enables us to easily map high-dimensional
feature spaces. This is made possible with the use of a kernel that is included in the prediction process
of the support vector machine classifier. We test two different kernels for our research work: a linear
kernel and a rbf kernel.
7.1.6. Multi-layer Perceptron (Neural Networks)
The last classifier chosen is a deep learning approach, which is a multi-layer perceptron belonging
to the neural networks family. This model contains three layers: an input layer, a hidden layer and
an output layer. Each layer may contain multiple nodes, except the last one, which must have a
node number equal to the total number of different possible output values (i.e., the three possible
sustainability level values in our context). Each node of each layer uses an activation function to
spread the information learned through the next nodes of the next layer. More formally, this learned
information is called a weight. We test two activation functions for our research work: a relu activation
function and a tanh activation function.
7.2. Finding the Best Classifier Parameters
As we did not have the same number of respondents for each sustainability level per act of
consumption, it was crucial to choose a technique that avoid issues during the classifier assessment.Sustainability 2020, 12, 1423 15 of 27
We therefore used a Synthetic Minority Oversampling TEchnique (SMOTE), to avoid class minority bias,
as described in [37]. The SMOTE strategy is used for both evaluations: micro and macro evaluations.
For all category (non-numeric values) features of the dataset used for this evaluation, we use a one-hot
encoding approach. For three unsupervised learning models (i.e., multinomial logistic regression,
support vector machine and multi-layer perceptron), we used a mechanism to scale each feature
according to a computed range, called a minimum maximum scaler. This technique helps the models
to be more efficient and faster during their learning process.
To find the best parameters for each machine learning model, we used a grid search approach
combined with a stratified k-fold cross-validation strategy (k: 4) and a random state equal to 0. The
SMOTE strategy is applied to the training set of each k-fold and not on the training and the test sets of
each k-fold in order to avoid biased results. To select these best parameters, we used the following
values and ranges of parameters.
• Decision tree
– max_depth = [2, 10[
• Random forests
– max_depth = [2, 10[
– n_estimators = 10, 50, 100, 250, 500
– max_features = auto
• Gradient boosting trees
– max_depth = [2, 10[
– n_estimators = 10, 50, 100, 250, 500
– learning_rate = 1 × 10⁻⁵ , 0.00001, 0.0001, 0.001, 0.01, 0.1, 1.0, 10.0
– max_features = auto
• Multinomial logistic regression
– multi_class = multinomial
– solver = newton-cg
– max_iter = 100, 500, 1000, 2000, 5000, 7000, 10000
– C = 0.01, 0.1, 1.0, 10.0, 100.0, 1000.0, 10000.0, 1 × 10⁵ , 1 × 10⁶
• Support vector machine (kernel: linear)
– C = 0.01, 0.1, 1.0, 10.0, 100.0
• Support vector machine (kernel: rbf)
– C = 0.01, 0.1, 1.0, 10.0, 100.0, 1000.0, 10000.0
– gamma = 0.00001, 0.0001, 0.001, 0.01, 0.1, 1.0, 10.0, 100.0
• Multi-layer perceptron (neural networks)
– solver = adam
– activation = relu/tanh
– hidden_layer_sizes = [226]
– max_iter = 1000
– learning_rate_init = 1 × 10⁻⁶ , 1 × 10⁻⁵ , 0.00001, 0.0001, 0.001, 0.01, 0.1, 1.0
– alpha = 1 × 10⁻⁶ , 1 × 10⁻⁵ , 0.00001, 0.0001, 0.001, 0.01Sustainability 2020, 12, 1423 16 of 27
7.3. Comparing the Classifiers
The evaluation indicators, used for the comparison of the six classifiers, are the F1 score and the
normalized confusion matrix. As it is usually more complicated to evaluate the performance of a
multiclass classification problem, the combination of these two metrics allows us to highlight the best
classifier for each act of consumption. The F1 score computes the accuracy performance of a prediction
task. This metric is based on the precision and recall measures, which are based on the notions of true
positive, true negative, false positive, and false negative items resulting from the prediction task, as
shown in Table 6 with the example of a binary classification task (two classes). Formally, the precision
metric is the division of the number of true positive items over the sum of the true positive and false
positive items. The recall metric is the division of the number of true positive items over the sum of the
true positive and false negative items. From the precision and recall metrics, the F1 score is introduced
in Equation (4) below.
precision × recall
F1_score = 2 × (4)
precision + recall
A confusion matrix is a table that highlights the quality of a prediction task. For example, Table 6
presents a classification matrix of a binary prediction task. Depending on the analysis (from the point
of view of class x for example), it is possible to see the quality of prediction of a classifier by visualizing
this table and its four results. As hinted above, we also used SMOTE, a stratified k-fold cross-validation
strategy (k: 8) and a random state equal to 0, using the best parameters highlighted for each model in
order to properly assess all the classifiers.
Table 6. True positive, false positive, false negative, and true positive matrix (binary prediction example
with 2 possible classes: class x and class y).
Predicted Class Label
Class x Class y
Class x True positives False negatives
True class label
Class y False positives True negatives
Classifier Comparison Results
The best parameters found for each classifier and for each act of consumption are presented
in Tables 7 and 8. Figures 5 and 6 indicate the best classifiers in terms of averages of micro, macro,
and weighted F1 scores (in this context, micro and macro do not correspond to the micro and macro
evaluations). The micro average F1 score computes the average F1 score globally without considering
the classes independently. The macro average F1 score computes the average of the F1 score of each
class. The weighted average F1 score computes the average of the F1 score of each class, and then the
average of each class is weighted by the support (number of true instances of each class). This micro
evaluation provides a first view of the most likely best classifiers for each act of consumption.Sustainability 2020, 12, 1423 17 of 27
Table 7. Mobility domain: best parameters of the classifiers for each act of consumption.
Act of Consumption Classifier Best Parameters Identified
Decision tree max_depth = 2
Random forests max_depth = 5/n_estimators = 500
Gradient boosting trees max_depth = 4/n_estimators = 500/learning_rate = 0.1
Home–work Multinomial logistic regression max_iter = 100/C = 10,000
transportation mode Support vector machine (linear) C = 10
Support vector machine (rbf) C = 1/gamma = 0.1
Multi-layer perceptron (relu) learning_rate_init = 0.0001/alpha = 0.01
Multi-layer perceptron (tanh) learning_rate_init = 0.0001/alpha = 0.01
Decision tree max_depth = 5
Random forests max_depth = 7/n_estimators = 250
Gradient boosting trees max_depth = 4/n_estimators = 500/learning_rate = 0.01
Leisure activities Multinomial logistic regression max_iter = 100/C = 0.01
transportation mode Support vector machine (linear) C = 0.1
Support vector machine (rbf) C = 1/gamma = 0.1
Multi-layer perceptron (relu) learning_rate_init = 0.001/alpha = 0.01
Multi-layer perceptron (tanh) learning_rate_init = 0.001/alpha = 0.01
Table 7. Cont.
Act of Consumption Classifier Best Parameters Identified
Decision tree max_depth = 3
Random forests max_depth = 9/n_estimators = 250
Gradient boosting trees max_depth = 2/n_estimators = 50/learning_rate = 0.1
Short/middle distance Multinomial logistic regression max_iter = 100/C = 0.1
Flight number Support vector machine (linear) C = 0.1
Support vector machine (rbf) C = 0.01/gamma = 0.1
Multi-layer perceptron (relu) learning_rate_init = 0.001/alpha = 1 × 10⁻⁵
Multi-layer perceptron (tanh) learning_rate_init = 0.01/alpha = 0.001
Decision tree max_depth = 3
Random forests max_depth = 6/n_estimators = 250
Gradient boosting trees max_depth = 7/n_estimators = 100/learning_rate = 0.1
Long distance Multinomial logistic regression max_iter = 100/C = 0.1
Flight number Support vector machine (linear) C = 10
Support vector machine (rbf) C = 0.01/gamma = 1
Multi-layer perceptron (relu) learning_rate_init = 0.0001/alpha = 0.01
Multi-layer perceptron (tanh) learning_rate_init = 0.01/alpha = 0.0001Sustainability 2020, 12, 1423 18 of 27
Table 8. Housing domain: best parameters of the classifiers for each act of consumption.
Act of Consumption Classifier Best Parameters Identified
Decision tree max_depth = 2
Random forests max_depth = 8/n_estimators = 500
Gradient boosting trees max_depth = 4/n_estimators = 500/learning_rate = 0.01
Number of electric Multinomial logistic regression max_iter = 100/C = 0.01
devices owned Support vector machine (linear) C = 0.01
Support vector machine (rbf) C = 1/gamma = 0.1
Multi-layer perceptron (relu) learning_rate_init = 1 × 10⁻⁵ /alpha = 0.001
Multi-layer perceptron (tanh) learning_rate_init = 1 × 10⁻⁵ /alpha = 1 × 10⁻⁶
Decision tree max_depth = 3
Random forests max_depth = 8/n_estimators = 250
Gradient boosting trees max_depth = 2/n_estimators = 500/learning_rate = 0.01
Number of use of 4 Multinomial logistic regression max_iter = 100/C = 0.01
electric devices per week Support vector machine (linear) C = 0.01
Support vector machine (rbf) C = 1/gamma = 0.01
Multi-layer perceptron (relu) learning_rate_init = 1 × 10⁻⁵ /alpha = 0.001
Multi-layer perceptron (tanh) learning_rate_init = 1 × 10⁻⁵ /alpha = 0.01
Decision tree max_depth = 2
Random forests max_depth = 9/n_estimators = 500
Gradient boosting trees max_depth = 2/n_estimators = 250/learning_rate = 0.01
Number of showers Multinomial logistic regression max_iter = 100/C = 0.01
per week Support vector machine (linear) C = 0.01
Support vector machine (rbf) C = 100/gamma = 0.0001
Multi-layer perceptron (relu) learning_rate_init = 1 × 10⁻⁵ /alpha = 0.01
Multi-layer perceptron (tanh) learning_rate_init = 0.0001/alpha = 0.01
However, a complementary analysis is required to find the best classifiers. We therefore computed
the averaged and normalized confusion matrices in order to assess the classifiers at a finer granularity.
In some cases, there are different results for the micro, macro, and weighted F1-scores, and the macro
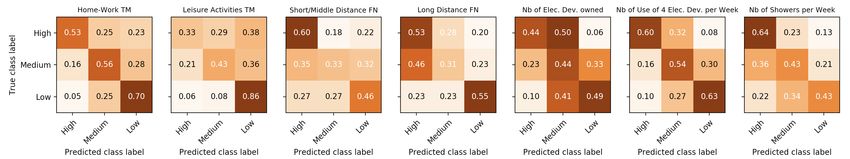
results are sometimes lower than the micro or weighted results. Figures 7 and 8 depict the normalized
confusion matrices of each prediction task (DT: Decision tree, RF: Random forests, GBT: Gradient
boosting trees, MLR: Multinomial logistic regression, SVM 1: Support vector machine (linear), SVM 2:
Support vector machine (rbf), MLP 1: Multi-layer perceptron (relu), MLP 2: Multi-layer perceptron
(tanh)). The normalization of a confusion matrix simply means that the sum of all the cells of one row
is equal to 1.0. Therefore, it is easier to visually identify the accuracy performance of a classifier and
this gives a complementary view to the F1 scores. The normalized confusion matrix of a perfectly
accurate classifier would have values of 1.0 on the top left to bottom right diagonal (i.e., every instance
of a class would have been predicted by the classifier). Furthermore, it would thus have values of 0.0
elsewhere (i.e., no instance of a class would have been misclassified).Sustainability 2020, 12, 1423 19 of 27
Figure 5. Averages of micro/macro/weighted F1-scores of the predictions related to the selected four
mobility acts of consumption.
Figure 6. Averages of micro/macro/weighted F1-scores of the predictions related to the selected three
housing acts of consumption.Sustainability 2020, 12, 1423 20 of 27
Transportation Mode
Home-Work
Transportation Mode
Leisure Activities
Short/Middle Distance
Flight Number
Long Distance
Flight Number
Figure 7. Normalized confusion matrices related to the four mobility acts of consumption.
Number of Electric
Devices Owned
Electric Devices per Week
Number of Use of 4
Number of Showers
per Week
Figure 8. Normalized confusion matrices related to the three housing acts of consumption.
The actual confusion matrices convey the fact that the ensemble approaches (random forests
and gradient boosting trees) are performant classifiers for the first two mobility acts of consumption
and the three housing acts of consumption. Regarding the last two mobility acts of consumption, the
multinomial logistic regression approach is the most accurate classifier.
As the random forests and the gradient boosting trees are good prediction models for the majority
of acts of consumption evaluated, we use these specific classifiers to identify the 20 most important
features that are associated with these specific prediction tasks, as demonstrated in Figures 9 and 10.
We purposely exclude the short/middle distance flight number and the long distance flight number acts of
consumption that do not obtain appropriate results with these classifiers, as depicted in the normalized
confusion matrices. The random forests and the gradient boosting trees classifier indeed enable us to
automatically extract these features after their training process.Sustainability 2020, 12, 1423 21 of 27
Figure 9. Twenty most important features related to the first two mobility acts of consumption.
Figure 10. Twenty most important features related to the three housing acts of consumption.
7.4. Influential Features
Regarding mobility, the results show that several demographic features, such as the distance
between two regions (home and workplaces) and accommodation characteristics, are influential
features (accom_5: size of the living area, living_area_1: city) for the home–work and leisure activities
transportation modes, as well as several of the habit features (accom_12_3: type of transportation
mode usually used to go to the post office; accom_12_1: type of transportation mode usually used to
go to the grocery store; mean of the comfort living habits—computed according to a scale representing
several degrees of importance: from “not at all important” 1.0 to “very important” 5.0).
About the housing consumption domain, the main predictors are demographic attributes such as
language (language_1: french), household characteristics (household_size: number of persons living in
the household; household_type_6: single person household; household_type_2: couple with children),
the accommodation features, as well as behavioral indicators of social performance (social_perf_11:
money spent to go out for a really good dinner). Surprisingly, the factual knowledge features about
energy do not appear in the top twenty most important features. In addition, psychological attributes,
age, social performance and habits characteristics are highlighted in the top twenty of the main features.Sustainability 2020, 12, 1423 22 of 27
8. Macro Evaluation
The macro evaluation aims at assessing the entire framework as it could be used by a real Green
IS application with undisclosed (hidden) data, i.e., a real use case evaluation.
8.1. Process
In this second evaluation, we use the undisclosed part of the dataset (i.e., 20% of the dataset)
mentioned in Section 5.1 and in Figure 4. We previously identified the best classifiers of each act of
consumption, that will help to build the tree that must be produced by the framework. As a reminder,
this tree represents the sustainable consumption behavior of an individual with single sustainable
consumption behavior indicators (i.e., leaves of the tree) and aggregated indicators per domain or
overall (i.e., intermediary nodes and root of the tree). In our evaluation context, the single indicators
correspond to the sustainability levels of seven acts of consumption belonging to the mobility and
housing domains, also detailed in Section 5.1. The aggregated indicators per domain are therefore the
sustainability levels of the mobility and housing domains, and finally the aggregated indicator overall
is the global sustainability level of the individual.
In the test part of the dataset (or undisclosed data), we have 396 respondents with their answer
records that cover all the possible classes of each act of consumption (see Table 4). It was crucial to
be able to cover all the classes of each act of consumption to avoid a bias in the evaluation of the
framework. First, we build 396 different trees with the real values of the test set (20% of the dataset),
i.e., baseline trees. Second, we build 396 different other trees corresponding to the participants of the
test set using the framework, and the best classifiers for each act of consumption trained with the
training set (80% of the dataset), used in the first/previous evaluation. Third, we compare the values
obtained for these two types of trees, baseline, and predicted values. For this macro analysis, the
weights used to create the trees were all equal to 1.0. The configuration of these weights could be the
subject of of a future dedicated research study with experts related to the energy domain. In terms of
evaluations, we first assess the accuracy of the predictions between the training set and the test set with
the best identified classifiers highlighted during the micro evaluation. This highlights the accuracy of
the single sustainable consumption behavior indicators. We also compute the proportions of corrected
predicted classes for the low level of the tree of each tested respondent. Then, we assess the aggregated
indicators per domain or overall that are computed from the predictions of the single sustainable
consumption behavior indicators. To do so, we compared the results in terms of root mean square error
(RMSE) and mean absolute error (MAE) for the aggregated indicators per domain or overall. These
metrics are good indicators to see the gap between actual and computed or estimated values. The
RMSE is more sensitive to large errors than the MAE, therefore they provide complementary views.
8.2. Results
We launched the evaluation of the entire framework with the best classifiers and their related
parameters for the seven acts of consumption and present the results in Tables 9–11 and Figure 11.
Regarding the framework accuracy evaluation (Table 9), the results obtained for the training set
are slightly better than those of the test set accuracy, which is usually the case. The accuracy computed
for the framework evaluation is simply the percentage of correct class labels predicted by the best
classifier found. According to these results, there is apparently no presence of overfitting (i.e., a training
accuracy equals or very close to 1.0). Table 10 highlights the number of correct predicted values (from
0 to 7) per evaluated respondent. The higher results are ranged between 3 and 5, which means that we
are able to estimate a sufficient number of correct sustainability levels even if it is not all the correct
seven levels. Finally, Table 11 shows the RMSE and MAE values that highlight the error between the
real aggregated indicator values of the test set and the ones computed from the predictions. The RMSE
values are higher than the MAE values because larger errors have more impact on the first metric.You can also read