A global profile of emigrants to OECD countries: Younger and more skilled migrants from more diverse countries - OECD iLibrary
←
→
Page content transcription
If your browser does not render page correctly, please read the page content below
OECD Social, Employment and Migration Working Papers
                                                  No. 239

                                      Rohen d’Aiglepierre,
 A global profile of emigrants                       Anda David,
to OECD countries: Younger           Charlotte Levionnois,
    and more skilled migrants             Gilles Spielvogel,
 from more diverse countries                  Michele Tuccio,
                                                Erik Vickstrom
                                       https://dx.doi.org/10.1787/0cb305d3-en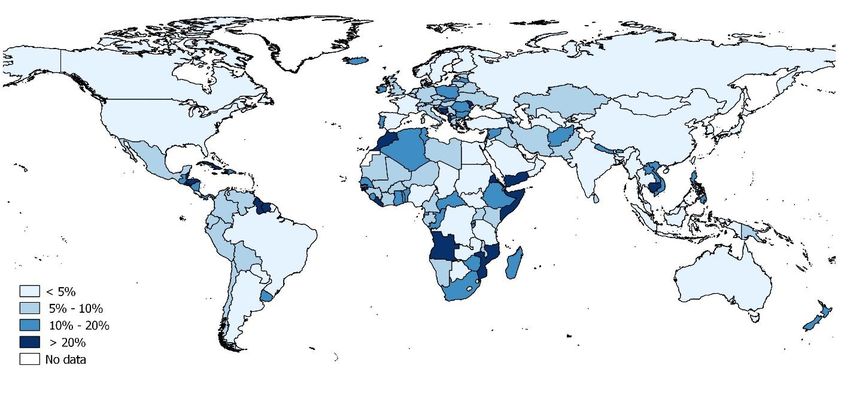
Organisation for Economic Co-operation and Development
                                                                                 DELSA/ELSA/WD/SEM(2020)4

Unclassified                                                                                      English - Or. English

DIRECTORATE FOR EMPLOYMENT, LABOUR AND SOCIAL AFFAIRS
EMPLOYMENT, LABOUR AND SOCIAL AFFAIRS COMMITTEE

A Global Profile of Emigrants to OECD Countries

Younger and More Skilled Migrants from More Diverse Countries

JEL Classification: F22, J61, O15.

Keywords: International migration, Immigrant stocks, DIOC, Emigration rates.

Contact:
Gilles Spielvogel – Tel: +33 1 85 55 45 05 – Gilles.Spielvogel@oecd.org

OFDE

This document, as well as any data and map included herein, are without prejudice to the status of or sovereignty over any territory,
to the delimitation of international frontiers and boundaries and to the name of any territory, city or area.
2 DELSA/ELSA/WD/SEM(2020)4
OECD Social, Employment and Migration Working Papers
www.oecd.org/els/workingpapers
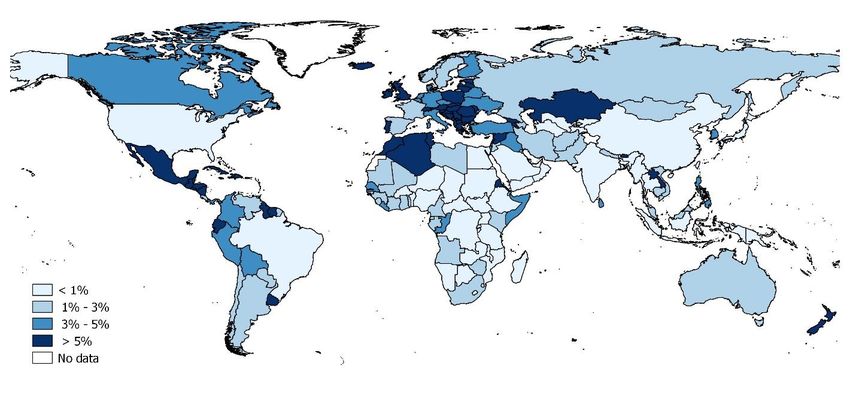
OECD Working Papers should not be reported as representing the official views of the
OECD or of its member countries. The opinions expressed and arguments employed are
those of the author(s).
Working Papers describe preliminary results or research in progress by the author(s) and
are published to stimulate discussion on a broad range of issues on which the OECD works.
Comments on Working Papers are welcomed, and may be sent to els.contact@oecd.org.
This series is designed to make available to a wider readership selected labour market,
social policy and migration studies prepared for use within the OECD. Authorship is
usually collective, but principal writers are named. The papers are generally available only
in their original language – English or French – with a summary in the other.
This document and any map included herein are without prejudice to the status of or
sovereignty over any territory, to the delimitation of international frontiers and boundaries
and to the name of any territory, city or area.
Note by Turkey:
The information in this document with reference to “Cyprus” relates to the southern part of the Island. There is
no single authority representing both Turkish and Greek Cypriot people on the Island. Turkey recognises the
Turkish Republic of Northern Cyprus (TRNC). Until a lasting and equitable solution is found within the context
of the United Nations, Turkey shall preserve its position concerning the “Cyprus issue”.
Note by all the European Union Member States of the OECD and the European Union:
The Republic of Cyprus is recognised by all members of the United Nations with the exception of Turkey. The
information in this document relates to the area under the effective control of the Government of the Republic
of Cyprus.
Note on Israeli Statistical Data
The statistical data for Israel are supplied by and under the responsibility of the relevant Israeli authorities. The
use of such data by the OECD is without prejudice to the status of the Golan Heights, Eat Jerusalem and Israeli
settlements in the West Bank under the terms of international law.
© OECD 2020
You can copy, download or print OECD content for your own use, and you can include
excerpts from OECD publications, databases and multimedia products in your own
documents, presentations, blogs, websites and teaching materials, provided that suitable
acknowledgment of OECD as source and copyright owner is given. All requests for
commercial use and translation rights should be submitted to rights@oecd.org.
A GLOBAL PROFILE OF EMIGRANTS TO OECD COUNTRIES
UnclassifiedDELSA/ELSA/WD/SEM(2020)4 3
Acknowledgements
This paper was written by Rohen d’Aiglepierre (AFD), Anda David (AFD), Charlotte
Levionnois (OECD), Gilles Spielvogel (OECD), Michele Tuccio (OECD) and Erik
Vickstrom (OECD).
The underlying database, DIOC 2015/16, was compiled in co-operation with national
authorities, whose support is gratefully acknowledged. This project has been supported by
the Research Department of the Agence Française de Développement (AFD).
We are grateful to Jean-Christophe Dumont and Jason Gagnon for their comments and
suggestions.
A GLOBAL PROFILE OF EMIGRANTS TO OECD COUNTRIES
Unclassified4 DELSA/ELSA/WD/SEM(2020)4
Abstract
This paper presents new findings on the main characteristics of immigrants living in OECD
countries by country of origin, drawing from the updated Database on Immigrants in OECD
Countries (DIOC) 2015/16. It describes migrant populations by country of destination and
country of origin in 2015/16, as well as the dynamics of international migration to OECD
countries since 2000/01. It also presents evidence on overall emigration rates and
emigration rates of the highly educated at the regional and country levels. Finally, the paper
looks at age patterns in immigrant populations.
A GLOBAL PROFILE OF EMIGRANTS TO OECD COUNTRIES
UnclassifiedDELSA/ELSA/WD/SEM(2020)4 5
Résumé
Ce document présente de nouveaux résultats sur les principales caractéristiques des
immigrants vivant dans les pays de l’OCDE par pays d'origine, à partir de la Base de
données sur les immigrés dans les pays de l'OCDE (DIOC) 2015/16. Il décrit les
populations immigrées par pays de destination et pays d'origine en 2015/16, ainsi que la
dynamique des migrations internationales vers les pays de l’OCDE depuis 2000/01. Il
présente également des données sur les taux d’émigration globaux et les taux d’émigration
des personnes diplômées de l’enseignement supérieur aux niveaux régional et national.
Enfin, ce document examine les profils par âge des populations immigrées.
A GLOBAL PROFILE OF EMIGRANTS TO OECD COUNTRIES
Unclassified6 DELSA/ELSA/WD/SEM(2020)4
Table of contents
OECD Social, Employment and Migration Working Papers............................................................ 2
Acknowledgements ................................................................................................................................ 3
Abstract .................................................................................................................................................. 4
Résumé ................................................................................................................................................... 5
Introduction ........................................................................................................................................... 8
Main findings ....................................................................................................................................... 8
1. The Database on Immigrants in OECD Countries: 15 years of data ......................................... 11
2. An overview of immigrant populations in OECD countries in 2015/16 ..................................... 13
2.1. How many immigrants live in OECD countries? ....................................................................... 13
2.2. Key characteristics of immigrant populations in OECD countries ............................................. 14
2.3. Main destination countries, origin countries and corridors......................................................... 18
2.4. The educational attainment of immigrants has increased significantly ...................................... 20
3. Emigration rates and “brain drain” estimates ............................................................................. 22
3.1. Total emigration rates to OECD countries .................................................................................. 22
3.2. Emigration rates of the highly educated ..................................................................................... 24
4. Young and old immigrants in OECD countries............................................................................ 28
4.1. Population ageing in OECD countries and the role of international migration .......................... 28
4.2. The age distribution of immigrants in OECD countries ............................................................. 29
4.3. How does the age distribution of emigrants compare to that of their origin country? ................ 31
References ............................................................................................................................................ 33
Annex A. ............................................................................................................................................... 34
Data sources and limitations .............................................................................................................. 34
Additional tables ................................................................................................................................ 37
Tables
Table 1. Coverage and content of DIOC over time ............................................................................... 11
Table 2. Variables available in DIOC 2015/16 ..................................................................................... 12
Table 3. Characteristics of the immigrant population aged 15+ in OECD countries, 2015/16 ............. 17
Table 4. Characteristics of the immigrant population aged 15+ in OECD countries by region of
birth, 2015/16 ................................................................................................................................ 17
Table 5. Number of immigrants (15+) in the top 10 OECD destination countries, 2000/01 to
2015/16 (in millions) ..................................................................................................................... 18
Table 6. Number of immigrants (15+) born in the top 10 origin countries and living in OECD
countries, 2000/01 to 2015/16 (in millions) .................................................................................. 19
Table 7. Top 15 countries in terms of emigration rate of high-skilled, number of high-skilled
emigrants and difference in rates between 2000/01 and 2015/16.................................................. 27
A GLOBAL PROFILE OF EMIGRANTS TO OECD COUNTRIES
UnclassifiedDELSA/ELSA/WD/SEM(2020)4 7
Figures
Figure 1. Immigrant population (15+) in OECD countries, 2000/01 to 2015/16 .................................. 14
Figure 2. Share of immigrants in the population (15+) in OECD countries, 2000/01 and 2015/16 ...... 14
Figure 3. Share of immigrants in the total population and among the tertiary-educated (15+) in
OECD countries, 2015/16 ............................................................................................................. 16
Figure 4. Top 20 migration corridors towards OECD countries, 2015/16 ............................................ 20
Figure 5. Share of low- and high-educated migrants, by group of countries of birth, 2000/01 to
2015/16 .......................................................................................................................................... 21
Figure 6. Share of high-educated migrants, by group of countries of birth and duration of stay,
2000/01 to 2015/16 ........................................................................................................................ 21
Figure 7. Total emigration rates to OECD countries, 2015/16 .............................................................. 23
Figure 8. Total emigration rates, 2000/01 and 2015/16 ........................................................................ 23
Figure 9. Total emigration rate and emigration rate of the high-skilled, 2015/16................................. 24
Figure 10. Emigration rates of the highly educated to OECD countries, 2015/16 ................................ 25
Figure 11. Emigration rate as a function of GDP per capita by education level, 2015/16 .................... 26
Figure 12. Emigration rates by level of education, by group of countries of birth and gender,
2015/16 .......................................................................................................................................... 27
Figure 13. Age distribution of the foreign-born and total population (15+) in OECD countries,
2000/01-2015/16 (%) .................................................................................................................... 30
Figure 14. Age distribution of the foreign-born population (15+) in OECD countries, 2015/16 .......... 31
Figure 15. Age distribution of the foreign-born population (15+) in OECD countries, by origin
country, 2015/16 (%) ..................................................................................................................... 32
Figure 16. Age distributions among emigrants (15+) living in OECD countries and in their origin
country, 2015/16 ............................................................................................................................ 32
A GLOBAL PROFILE OF EMIGRANTS TO OECD COUNTRIES
Unclassified8 DELSA/ELSA/WD/SEM(2020)4
Introduction
1. International migration has rapidly grown and changed in composition in the last
few decades, leading policy-makers to devote greater attention to its determinants and
impact. Countries of destination are increasing their efforts to effectively manage migration
and integrate migrants while countries of origin put emphasis on protecting their citizens
abroad and maintaining their bonds with them. The potential contribution that diasporas
can make towards the development of their home countries is now more fully
acknowledged. The availability of high quality and internationally comparable data on the
size and characteristics of the migrant populations by country of origin is a prerequisite for
proper analysis, as well as to the implementation of effective policies by countries on both
ends of the migration corridors.
2. High quality, reliable and internationally comparable data on international
migration are scarce due to a variety of reasons. In the last decade, substantial efforts were
made to fill this void. The compilation of original data on migrant stocks from a large
number of destination countries, namely the Database on Immigrants in OECD Countries
(DIOC), undertaken by the OECD, represents one of them. It was first released in 2008
based on the 2000/01 census round. It was then updated using data collected in 2005/06
and again in 2010/11. Lastly, the most recent update of DIOC is compiled using data from
35 countries collected in 2015/16.
3. DIOC provides a detailed picture of the main characteristics of immigrants living
in OECD countries by country of origin. Taking advantage of the availability of data at
four different points in time, the updated database allows addressing various questions such
as the following: How did migrant populations change over time? Particularly, what are
the key origin countries of migrants in the OECD destinations? To which extent do recent
migrants differ from the earlier cohorts? Which countries receive the largest share of highly
educated migrants? What do we know about brain drain and its evolution by country of
origin?
4. The purpose of this paper is to answer some of these questions and to present the
basic findings drawn from the updated DIOC 2015/16. The first section of this paper
presents the Database on Immigrants in OECD Countries (DIOC) in detail, its key variables
and country coverage. Section 2 describes migrant populations both by country of
destination and country of origin in 2015/16, as well as the dynamics of international
migration to OECD countries since 2000/01. Section 3 presents the evidence on overall
emigration rates and emigration rates of the highly skilled at the regional and country
levels. Finally, section 4 looks at age patterns in immigrant populations.
Main findings
The adult (15+) immigrant population of OECD countries has reached 120 million
in 2015/16, up from 78 million in 2000/01. These immigrants account for 54% of
the world immigrant population and represent 12% of the total population of OECD
countries.
Europe is the main region of origin of immigrants in OECD countries, with 41.5
million immigrants (about 35% of the total), followed by Asia (31 million, 26% of
the total), Latin America (30 million, 25% of the total) and Africa (12 million, 10%
A GLOBAL PROFILE OF EMIGRANTS TO OECD COUNTRIES
UnclassifiedDELSA/ELSA/WD/SEM(2020)4 9
of the total). North America and Oceania account together for only about 3% of
immigrants living in OECD countries.
Since the start of the 21st century, the main origin countries of immigrants living
in OECD countries have changed significantly. While Mexico remains the top
origin country, with 11.7 million emigrants, several other origin countries dropped
significantly down the ranking between 2000/01 and 2015/16, notably the United
Kingdom, Germany, Italy and Turkey.
Several countries experienced a spectacular progression, in terms of both their place
in the ranking and their number of emigrants, in particular China, India, Poland,
Romania and the Philippines.
In 2015/16, India and China were the second and third main origin countries of
immigrants living in OECD countries, with 4.8 million and 4.6 million migrants
respectively, over one quarter of whom arrived since 2010/11.
Migration from Eastern Europe also increased significantly, against a backdrop of
greater opportunities for mobility within the European Union, as reflected in the
increase of the number of migrants from Poland (+79% between 2000/01 and
2015/16) and from Romania (+213%), and the significant share of recent migrants
in their number.
The main destination countries for immigrants within the OECD area remained
virtually unchanged between 2000/01 and 2015/16. In 2015/16, the United States
was still the main destination country, with 46 million immigrants, or 39% of all
migrants living in OECD countries. Germany accounted for 10% of the total, while
the United Kingdom, Canada and France received 6% to 7% of migrants residing
in OECD countries.
Between 2000/01 and 2015/16, there was a sharp increase in the immigrant
population in Italy (+174% between 2000/01 and 2015/16) and in Spain (+175%),
due in part to greater mobility within the European Union.
The largest corridor of migration towards OECD countries is the Mexico – United
States corridor, with 11.5 million immigrants, almost 10% of the total number of
adult immigrants living in OECD countries. In total, the 20 main corridors account
for 30% of all immigration to OECD countries, with only a handful of different
destinations (United States, Germany, France, Italy, Australia), illustrating the high
concentration of immigrants across destination countries. By contrast, each origin
country represented in the 20 main corridors appears only once, reflecting the much
more pronounced diversity of origin countries.
In 2015/16, one-third of all adult immigrants in OECD countries had a tertiary
education. This share was much higher in countries with selective migration
policies, such as Canada (60%) and Australia (47%), but much lower in some
European countries, such as Slovenia (11%), Italy (12%) and Greece (19%).
Over the last 15 years, there has been a continuous increase in the level of education
of immigrants residing in OECD countries, and a simultaneous decline in the
proportion of poorly educated immigrants. In total, between 2000/01 and 2015/16,
the number of tertiary-educated immigrants increased by around 20 million, while
the number of low-educated immigrants increased by only five million.
A GLOBAL PROFILE OF EMIGRANTS TO OECD COUNTRIES
Unclassified10 DELSA/ELSA/WD/SEM(2020)4
In 2000/01, the proportion of high-educated immigrants was virtually identical
among recent migrants and long-standing migrants born in OECD countries.
However, over the past 15 years, the average level of education of recent
immigrants has risen at a faster pace. This difference was not observed for migrants
from non-OECD countries, which reflects an increase in the temporary migration
of highly educated individuals between OECD countries, a trend likely driven by
increasing intra-European mobility.
Among the countries most affected by emigration, small-size islands in the Pacific
region and the Caribbean have a prominent position. The emigration rate to the
OECD area of some of these countries can be as high as 30%. In Europe, Balkan
countries are among the largest exporters of migrants. In contrast, few countries
worldwide have emigration rates to the OECD area of less than 1%, including
several G20 countries.
Overall, the emigration rates of the highly educated are typically higher than the
total emigration rates. This distinction is, however, more marked in the poorest
origin countries, where the emigration rate of the low educated are extremely low.
The overall emigration rate of highly educated individuals towards OECD countries
was 16% in 2015/16. In comparison, that of the low educated was 5%. Some
countries have high-skilled emigration rates of more than 40% (e.g. Guyana,
Trinidad and Tobago, Mauritius, Liberia, Jamaica, Haiti, Fiji).
India has the largest high-skilled diaspora in the OECD area, with over 3 million
tertiary-educated migrants, followed by China (2 million) and the Philippines (1.8
million). OECD countries themselves have large numbers of high-skilled
emigrants: the United Kingdom has 1.7 million and Germany has 1.4 million.
Across all education levels, there is little difference in the emigration rate of men
and women born in OECD countries. This is not the case for non-OECD countries
of birth: while the emigration rates of low-educated men and women are similar,
highly-educated women born in non-OECD countries are significantly more likely
to emigrate towards the OECD area than their male counterparts.
In 2015/16, among immigrants aged 15 and older living in OECD countries, about
10% were aged 15-24, 74% were aged 25-64 and 16% were aged 65+. In the last
15 years, this distribution has shifted significantly, with an increasing share of
migrants in the intermediary and older age groups, and a declining share of younger
migrants.
The intermediary age group (25-64) represents a much higher share among
immigrants than in the total population (10 percentage points more in 2015/16),
while both the younger and older groups are smaller among the foreign-born.
Overall, immigrants contribute to increase the share of prime-age individuals in the
adult population of OECD countries.
A GLOBAL PROFILE OF EMIGRANTS TO OECD COUNTRIES
UnclassifiedDELSA/ELSA/WD/SEM(2020)4 11
1. The Database on Immigrants in OECD Countries: 15 years of data
5. The Database on Immigrants in OECD Countries (DIOC) was constructed with the
aim of providing reliable and internationally comparable data on immigrants living in
OECD countries by country of origin. In this context, immigrants are defined as individuals
living in a country other than their country of birth. DIOC therefore relies on data collected
by destination countries with information on country of birth, typically population censuses
and administrative registers. Large representative surveys, such as labour force surveys
(LFS), are also used as a substitute when data from censuses or registers are unavailable or
incomplete. In addition to the number of immigrants living in each OECD country
disaggregated by country of origin, DIOC provides detailed information on the
demographic and socio-economic characteristics of the immigrant populations, including
age, gender, educational attainment, duration of stay, employment status and occupation.
6. Since the first edition, DIOC 2000/01 (OECD, 2008[1]), three updates have been
released, describing immigrant populations in OECD countries in 2005/06 (Widmaier and
Dumont, 2011[2]), 2010/11 (Arslan et al., 2015[3]) and 2015/16. Based on the most recent
and most relevant information available, all those datasets have a similar structure and core
variables (see Table 1 for details on the variables included in the different versions of
DIOC). They are designed to be comparable over time to the extent possible, in order to
capture the dynamics of global migration trends, but also the changes occurring for specific
countries of destination, countries of origin and migration corridors.
Table 1. Coverage and content of DIOC over time
DIOC extended DIOC extended
DIOC 2000/01 (DIOC-E) DIOC 2005/06 DIOC 2010/11 (DIOC-E) DIOC 2015/16
2000/01 2010/11
Number of countries 28 100 27 33 88 35
Country of residence x x x x X x
Country of birth x x(*) x x x(*) x
Nationality x x(*) x x x(*) x
Gender x x x x x x
Age x x x x x x
Educational attainment x x x x x x
Field of study x x
Duration of stay x x x x
Labour force status x x x x x x
Occupation x x x x x
Sector of activity x x
Note: (*) For DIOC-E 2000/01 and 2010/11, in some countries, immigrants are identified based on nationality
and not country of birth. Nationality is not separately available for these datasets.
7. DIOC has data for almost all OECD countries and the coverage has increased over
time, accounting for the expanding membership of the Organisation, but also additional
efforts to collect data for countries that had not participated in earlier rounds. In terms of
origin countries, virtually all countries in the world are captured.
A GLOBAL PROFILE OF EMIGRANTS TO OECD COUNTRIES
Unclassified12 DELSA/ELSA/WD/SEM(2020)4
8. In addition to OECD destination countries, extended versions of DIOC (DIOC-E)
have been produced in 2000/01 (Dumont, Spielvogel and Widmaier, 2010[4]) and 2010/11
(OECD, 2015[5]) and include many non-OECD destination countries.
9. For DIOC 2015/16, the different combinations of variables available are published
and made publicly available online at www.oecd.org/migration/dioc.htm in four different
files (see Table 2). Data sources and limitations are discussed in the Appendix. Additional
detailed information, such as categories and classifications for the different variables, as
well as a detailed exposition of special cases and adjustments, is provided with the data in
a methodological document.
Table 2. Variables available in DIOC 2015/16
File A File B File C File D
Main topic Nationality and age Duration of stay Labour force status Occupation
Employed persons
Reference population All persons Persons aged 15+ Persons aged 15+
aged 15+
Variables: - Country of residence - Country of residence - Country of residence - Country of residence
- Country of birth - Country of birth - Country of birth - Country of birth
- Gender - Gender - Gender - Gender
- Age - Duration of stay - Age - Occupation
- Education level - Education level - Education level - Education level
- Nationality - Labour force status
A GLOBAL PROFILE OF EMIGRANTS TO OECD COUNTRIES
UnclassifiedDELSA/ELSA/WD/SEM(2020)4 13
2. An overview of immigrant populations in OECD countries in 2015/16
2.1. How many immigrants live in OECD countries?
10. The adult (15+) foreign-born population of OECD countries has reached
120 million in 2015/16, compared to 78 million in 2000/01 (population aged 15 and above,
Figure 1).1 In 2015/16, according to UN data, immigrants living in OECD countries
represented 54% of the world immigrant population (15+), compared to 52% in 2000/2001.
(United Nations, 2017[6]). During the same period 2000-2015, the share of OECD countries
in the world population (15+) has decreased from 20% to 18%. Immigrants are therefore
increasingly concentrating in OECD countries.
11. The share of immigrants in the population of OECD countries, which averaged
12% in 2015/16 (compared to 9% in 2000/01), is higher than in most non-OECD countries.
There are however significant differences across OECD countries: as shown in Figure 2,
the share of foreign-born individuals reaches 49% in Luxembourg and is also significantly
higher than average in countries such as Australia (33%), Switzerland (32%), New Zealand
(29%), Israel (28.5%) and Canada (27%). Several European countries also have a high
share of immigrants in their population, for instance Austria, Ireland and Sweden, with
20% each. In the United States, immigrants account for 17.5% of the population. The share
of immigrants is also above the OECD average in Germany (17%), the United Kingdom
(15.5%), France (14%) and Spain (13.5%). At the other end of the spectrum, several OECD
countries have very small immigrant populations: this is for example the case of Mexico,
with slightly more than 0.5%, Japan (1.5%), Poland (less than 2%), Turkey (2%) and Chile
(3%). East European countries, such as the Slovak Republic (3.5%), the Czech Republic
(less than 5%) and Hungary (5.5%) also have low shares of immigrants.
12. The share of immigrants in the population has increased in almost all OECD
countries in the last 15 years, with the largest increases recorded in Luxembourg (+12
percentage points), Ireland (+9 pp), Norway and Spain (+8 pp each), Switzerland (+7 pp),
New Zealand and Italy (+6.5 pp each).
1
For the 32 OECD countries for which comparable data is available.
A GLOBAL PROFILE OF EMIGRANTS TO OECD COUNTRIES
Unclassified14 DELSA/ELSA/WD/SEM(2020)4
Figure 1. Immigrant population (15+) in OECD countries, 2000/01 to 2015/16
Number of immigrants left scale) Share of the population (right scale)
Millions %
150 15
100 10
50 5
0 0
2000/01 2005/06 2010/11 2015/16
Source: Database on Immigrants in OECD Countries (DIOC) 2000/01, 2005/06, 2010/11 and 2015/16.
Figure 2. Share of immigrants in the population (15+) in OECD countries, 2000/01 and
2015/16
2000/01 2015/16
%
50
40
30
20
10
0
Source: Database on Immigrants in OECD Countries (DIOC) 2000/01 and 2015/16.
2.2. Key characteristics of immigrant populations in OECD countries
13. Beyond the number of immigrants and the share of the population they represent,
there are significant differences across OECD countries in terms of the main characteristics
of the immigrant populations (Table 3). A first notable dimension is the share of
immigrants born in other OECD countries, as it indicates whether the immigrant population
originates mostly from countries with a similar level of development, or from poorer
countries. Among the whole immigrant population living in OECD countries, 38% were
born in another OECD country. This share ranges from less than 10% in Slovenia, Chile
and Estonia to more than 70% in Ireland, the Slovak Republic or Luxembourg.
A GLOBAL PROFILE OF EMIGRANTS TO OECD COUNTRIES
UnclassifiedDELSA/ELSA/WD/SEM(2020)4 15
Geographical location and historical migration patterns largely explain these differences.
For two-thirds of OECD countries, however, this share ranges from 15% to 50%.
14. There is much more homogeneity across countries in the share of women among
immigrants: the OECD average is 51.8% and it ranges from 48% to 56% for most countries.
For countries with very low or very high shares of immigrant women, this is often due to a
skewed age distribution among immigrants. For example, both Estonia and Poland have a
share of women among immigrants exceeding 58%, but this is because the share of older
immigrants is particularly high in these countries (and because women have higher life
expectancy than men).
15. Overall, the share of young people (15-24) among adult immigrants in OECD
countries is only 10%, while the share of older individuals (65+) is close to 16%. As can
be expected, there is a robust positive correlation across countries between the share of
younger individuals and the share of recently arrived migrants (duration of stay of five
years or less). Countries with a very low share of young immigrants, such as Estonia, Israel,
Poland or the Slovak Republic also have very low shares of recent immigrants. On the other
hand, countries with high shares of recent immigrants, such as Chile, Norway or Turkey,
tend to have relatively high shares of young immigrants. This relationship is not systematic,
however, because the share of recent immigrants depends on migration policies and return
behaviour.
16. A key dimension captured by DIOC is the educational attainment of immigrants.2
Overall, in 2015/16, one-third of all adult immigrants in OECD countries had a tertiary
education. This share was much higher in countries with selective migration policies, such
as Canada (60% of tertiary-educated immigrants) and Australia (47%), but much lower in
some European countries, such as Slovenia (11%), Italy (12%) and Greece (19%). This
information is essential to better understand the impact of migration policies in destination
countries, but also country-specific integration challenges. This highlights an important
value added of DIOC: the ability to provide assessment of key characteristics of immigrant
populations across OECD countries in a comparable framework.
17. Overall, in many OECD countries, the share of immigrants among the tertiary-
educated mirrors their share in the total adult population: for about half of OECD countries,
there is a difference of less than two percentage points in absolute value between these two
shares (Figure 3). For several key destination countries, the difference is slightly negative:
in the United States, the share of foreign-born among the tertiary-educated is 0.5 percentage
points lower than their share in the total population. This is also the case in Germany (-
1.2 pp), France (-0.4 pp), Italy (-0.9 pp), Spain (-1.8 pp). There are some countries,
however, where the share of foreign-born among the tertiary-educated is significantly
higher than in the total population: in Luxembourg, 63% of those with tertiary education
are foreign-born, 16 percentage points more than in the total population. The difference is
also quite large in other countries with relatively large share of immigrants, such as New
Zealand (+11.2 pp), Israel (+7.4 pp), Australia (+7 pp), the United Kingdom (+6.7 pp),
Ireland (+6.2 pp), and to a lesser extent, Switzerland (+3.4 pp) and Canada (+2 pp).
2
It should be noted that DIOC does not contain information on where education was acquired, nor
the age at which an immigrant first arrived in his/her destination country.
A GLOBAL PROFILE OF EMIGRANTS TO OECD COUNTRIES
Unclassified16 DELSA/ELSA/WD/SEM(2020)4
Figure 3. Share of immigrants in the total population and among the tertiary-educated (15+)
in OECD countries, 2015/16
Total Tertiary educated
%
70
60
50
40
30
20
10
0
Source: Database on Immigrants in OECD Countries (DIOC) 2000/01 and 2015/16.
18. Looking at the characteristics of immigrants by region of origin provides additional
insights (Table 4). First, in terms of geographical distribution, Europe is the main region of
origin of immigrants in OECD countries, with 41.5 million immigrants (about 35% of the
total), followed by Asia (31 million, 26% of the total), Latin America (30 million, 25% of
the total) and Africa (12 million, 10% of the total). North America and Oceania account
together for only about 3% of immigrants living in OECD countries.
19. There is significant heterogeneity across regions of origin in terms of key socio-
demographics characteristics of immigrant populations. For example, immigrants from
African countries are on average less likely to be women than those from Europe (48% vs
53%), the share of younger immigrants is the highest among North American immigrants
and the lowest among those born in Europe, while the share of older immigrants is lowest
among those born in Latin America. Those arrived recently account for more than one-fifth
of the total among Asian immigrants, but less than 12% among Latin American immigrants.
Finally, in terms of education, the most educated are the immigrants born in North America
(54% with tertiary education) and Asia (47%), while those with the lowest share of tertiary-
educated are those born in Latin America (20%). Immigrants from Europe and Africa have
an intermediary position, with about 30% of them being tertiary-educated. Detailed
information on the gender and education distributions of immigrants by country of origin
is provided in the Annex (Table A.2.).
A GLOBAL PROFILE OF EMIGRANTS TO OECD COUNTRIES
UnclassifiedDELSA/ELSA/WD/SEM(2020)4 17
Table 3. Characteristics of the immigrant population aged 15+ in OECD countries, 2015/16
Foreign-born Born in OECD Persons Persons Duration of Tertiary
Country of Women
population 15+ countries aged 15-24 aged 65+ stay 0-5 years educated
residence (%)
(thousands) (%) (%) (%) (%) (%)
Australia 5 791 43.6 51.5 10.6 21.2 19.8 47.4
Austria 1 491 47.4 51.2 11.4 14.0 21.1 25.9
Belgium 1 601 51.2 50.7 11.5 14.7 27.8 26.8
Canada 7 738 30.9 52.3 9.8 22.0 13.9 59.5
Switzerland 2 236 63.2 51.0 7.3 14.0 43.2 33.7
Chili 405 9.6 53.4 20.1 4.3 44.8 -
Czech Republic 415 39.1 42.5 9.2 4.9 13.5 29.4
Germany 12 011 43.5 49.5 8.6 15.1 20.0 21.7
Denmark 564 46.7 50.4 14.6 8.8 31.7 41.0
Spain 5 262 20.6 53.4 13.3 7.3 11.8 24.2
Estonia 190 9.7 58.7 3.0 41.1 6.7 35.5
Finland 299 40.1 49.3 12.6 5.6 28.7 22.5
France 7 407 32.1 51.8 8.5 22.8 12.9 26.6
United Kingdom 8 116 40.4 52.5 11.6 11.8 21.1 42.1
Greece 1 184 24.8 54.7 9.7 10.6 18.7 19.0
Hungary 460 22.7 50.1 11.0 18.1 15.3 28.6
Ireland 735 72.2 51.1 14.4 6.6 26.0 43.9
Israel 1 744 17.4 55.1 5.4 37.9 5.3 49.3
Italy 5 532 17.5 54.9 10.7 5.3 8.5 12.1
Japan 1 593 30.6 54.5 17.1 8.2 - -
Luxembourg 228 83.0 51.0 8.7 10.7 7.0 45.8
Mexico 487 64.1 49.9 33.0 10.2 23.2 30.7
Netherlands 1 625 37.7 54.1 8.0 12.2 11.6 26.1
Norway 702 50.4 47.6 12.7 6.3 36.1 39.0
New Zealand 1 082 40.2 50.9 14.4 16.3 20.2 39.2
Poland 565 33.4 58.3 5.7 67.7 5.3 21.2
Portugal 661 26.9 56.2 11.1 8.1 7.2 27.8
Slovak Republic 160 77.8 49.6 4.7 30.0 6.1 20.9
Slovenia 230 8.7 43.4 6.2 18.0 27.8 10.8
Sweden 1 624 38.5 50.3 12.2 15.4 29.2 32.5
Turkey 1 358 29.5 54.5 13.1 13.7 38.3 24.4
United States 46 151 40.4 51.6 9.7 15.7 13.8 34.0
Total OECD 119 648 37.8 51.8 10.2 15.7 16.5 33.2
Source: Database on Immigrants in OECD Countries (DIOC) 2015/16.
Table 4. Characteristics of the immigrant population aged 15+ in OECD countries by region
of birth, 2015/16
Foreign-born Persons Persons Duration of Tertiary
Women
Region of birth population 15+ aged 15-24 aged 65+ stay 0-5 years educated
(%)
(thousands) (%) (%) (%) (%)
Africa 12 510 48.2 10.3 13.5 15.9 30.8
Asia 31 297 52.3 11.9 12.9 22.2 46.9
Europe 41 572 52.8 8.2 21.2 15.9 32.2
North America 2 533 52.0 15.6 18.4 18.3 53.7
Oceania 1 514 50.2 11.5 12.5 16.6 37.9
Latin America 29 980 51.6 10.7 11.9 11.7 20.1
Source: Database on Immigrants in OECD Countries (DIOC) 2015/16.
A GLOBAL PROFILE OF EMIGRANTS TO OECD COUNTRIES
Unclassified18 DELSA/ELSA/WD/SEM(2020)4
2.3. Main destination countries, origin countries and corridors
20. The main destination countries for immigrants within the OECD area remained
virtually unchanged between 2000/01 and 2015/16, with the top 10 countries welcoming
between 85% and 90% of the total migrant population (Table 5). In 2015/16, the United
States was the main destination country, with 46 million immigrants, or 39% of all migrants
living in OECD countries, a proportion that has increased regularly since 2000/01.
Germany maintained its second place with 10% of the total, while the United Kingdom,
Canada and France received 6% to 7% of migrants residing in OECD countries. The most
noticeable changes in the list of the main destination countries over this period are the sharp
increases in the immigrant population in Italy (+174% between 2000/01 and 2015/16) and
in Spain (+175%), due in part to greater mobility within the European Union.
21. During the more recent period, between 2010/11 and 2015/16, different trends
emerged in the main destination countries. The number of immigrants in Australia,
Germany and Canada increased by over 15% and by almost 25% in Italy, while the pace
of growth was slower in the United Kingdom, France and particularly in Spain. These
changes only partially reflect the inflow of refugees into some OECD countries in recent
years, as the sources of the data used in DIOC do not always incorporate the number of
people entering a country immediately. This time lag is potentially significant with regard
to refugees, who typically secure their status several months after their arrival in the country
as asylum seekers.
Table 5. Number of immigrants (15+) in the top 10 OECD destination countries, 2000/01 to
2015/16 (in millions)
Growth
Main destination
2000/01-
2000/01 2005/06 2010/11 2015/16 countries
2015/16
2015/16
(%)
United States 31.4 United States 38.6 United States 40.9 United States 46.2 United States 47.0
Germany 7.8 Germany 10.1 Germany 10.4 Germany 12.0 Germany 53.3
France 5.6 France 6.4 United Kingdom 7.4 United Kingdom 8.1 United Kingdom 80.2
Canada 5.4 Canada 6.1 France 6.8 Canada 7.7 Canada 44.5
United Kingdom 4.5 United Kingdom 5.9 Canada 6.7 France 7.4 France 32.3
Australia 3.9 Australia 4.1 Spain 5.1 Australia 5.8 Australia 50.0
Italy 2.0 Spain 3.8 Australia 5.0 Italy 5.5 Italy 173.8
Spain 1.9 Italy 2.8 Italy 4.5 Spain 5.3 Spain 174.8
Israel 1.8 Israel 1.8 Switzerland 1.9 Switzerland 2.2 Switzerland 53.8
Switzerland 1.5 Switzerland 1.5 Israel 1.7 Israel 1.7 Israel -1.5
Total top 10 65.7 Total top 10 81.2 Total top 10 90.3 Total top 10 102.0 Total top 10 55.2
Total 78.1 Total 91.9 Total 105.7 Total 119.6 Total 53.3
Source: Database on Immigrants in OECD Countries (DIOC) 2000/01, 2005/06, 2010/11 and 2015/16.
22. By contrast, since the start of the 21st century, the main origin countries of
immigrants living in OECD countries have changed significantly (Table 6). Even though
Mexico remains the top origin country for migrant communities in the OECD area, with
11.7 million people, several other origin countries dropped significantly down the ranking
between 2000/01 and 2015/16, notably the United Kingdom and Germany which fell
second to fifth and from third to seventh respectively. Italy, which was the fourth-placed
origin country in 2000/01, fell to 12th in 2015/16, while Turkey fell from sixth to tenth. At
the same time, several countries experienced a spectacular progression, in terms of both
A GLOBAL PROFILE OF EMIGRANTS TO OECD COUNTRIES
UnclassifiedDELSA/ELSA/WD/SEM(2020)4 19
their place in the ranking and their number of emigrants, in particular China, India, Poland,
Romania and the Philippines. In 2015/16, India and China were ranked second and third
respectively in the list of the main origin countries for immigrants living in OECD
countries, with 4.8 million and 4.6 million migrants respectively, over one quarter of whom
arrived during the previous five years, which reflects the strong recent surge in immigration
from these countries. Migration from Eastern Europe also increased significantly, against
a backdrop of greater opportunities for mobility within the European Union, as reflected in
the increase of the number of migrants from Poland (+79% between 2000/01 and 2015/16)
and from Romania (+213%), and the significant share of recent migrants in their number.
Table 6. Number of immigrants (15+) born in the top 10 origin countries and living in OECD
countries, 2000/01 to 2015/16 (in millions)
Growth
Main origin
2000/01-
2000/01 2005/06 2010/11 2015/16 countries
2015/16
2015/16
(%)
Mexico 8.3 Mexico 10.8 Mexico 11.3 Mexico 11.7 Mexico 40.5
United Kingdom 3.3 United Kingdom 3.4 United Kingdom 3.7 India 4.8 India 144.8
Germany 3.2 Germany 2.9 China 3.6 China 4.6 China 123.0
Italy 2.4 Poland 2.9 India 3.6 Poland 3.9 Poland 79.5
Poland 2.2 India 2.8 Germany 3.5 United Kingdom 3.7 United Kingdom 12.5
Turkey 2.1 China 2.7 Poland 3.3 Philippines 3.5 Philippines 83.1
China 2.1 Turkey 2.6 Philippines 3.0 Germany 3.5 Germany 12.5
Russia 2.0 Philippines 2.5 Romania 2.7 Romania 3.5 Romania 213.2
India 2.0 Russia 2.4 Turkey 2.6 Morocco 3.0 Morocco 77.4
Philippines 1.9 Italy 2.3 Morocco 2.6 Turkey 2.5 Turkey 19.4
Total top 10 29.4 Total top 10 35.4 Total top 10 39.9 Total top 10 44.9 Total top 10 52.8
Total 78.1 Total 91.9 Total 105.7 Total 119.6 Total 53.3
Source: Database on Immigrants in OECD Countries (DIOC) 2000/01, 2005/06, 2010/11 and 2015/16.
23. Combining information on place of residence and place of birth allows the
identification of the main migration corridors towards OECD countries (Figure 4). The
largest one, by far, is the Mexico – United States corridor, with 11.5 million immigrants,
almost 10% of the total number of immigrants (15+) living in OECD countries. The 20
main corridors account for 30% of all immigration to OECD countries (out of about 5 000
bilateral corridors with a recorded number of immigrants). However, none of the other large
corridors amounts to more than one-fifth of the Mexican community in the United States.
Considering its weight as a destination country, it is not surprising that the United States
appears as a destination in 12 out of the 20 main corridors. The other destination countries
appearing in the list are Germany (with immigrants coming from Poland, Turkey, Russia
and Kazakhstan), France (with Algerian and Moroccan immigrants), Italy (Romanian
immigrants) and Australia (British immigrants). Even further down in the rankings, few
additional destination countries are represented (mostly Spain, the United Kingdom and
Canada), illustrating the high concentration of immigrants across destination countries. By
contrast, each origin country represented in the 20 main corridors appears only once,
reflecting the much more pronounced diversity of origin countries and the idiosyncratic
nature of the main migration corridors, which are mostly shaped by geographical proximity
and historical ties between origin and destination countries.
24. There is a striking diversity in the education distribution of immigrants across these
top corridors. Some of them indeed exhibit a very low share of tertiary-educated persons;
A GLOBAL PROFILE OF EMIGRANTS TO OECD COUNTRIES
Unclassified20 DELSA/ELSA/WD/SEM(2020)4
this is the case for example for Mexico – United States (9%), El Salvador – United States
(9%), Turkey – Germany (7%) and Romania – Italy (7%). Other major corridors, by
contrast, include a majority of tertiary-educated immigrants: this is the case of some of the
large corridors connecting Asian countries (India, China, Philippines, Korea) to the United
States, as well as the main intra-OECD corridors (Germany – United States, United
Kingdom – Australia, Canada – United States).
Figure 4. Top 20 migration corridors towards OECD countries, 2015/16
Number of immigrants (left scale) Share of tertiary-educated (right scale)
Thousands %
12000
10000 100
8000 80
6000 60
4000 40
2000 20
0 0
Source: Database on Immigrants in OECD Countries (DIOC) 2015/16.
2.4. The educational attainment of immigrants has increased significantly
25. Over the last 15 years, there has been a continuous increase in the level of education
of immigrants residing in OECD countries, and a simultaneous decline in the proportion of
poorly educated immigrants (Figure 5). In 2000/01, 38% of immigrants from non-OECD
countries had a low level of educational attainment, and this share was 45% for immigrants
from OECD countries. In 2015/16, this was the case for fewer than 30% of non-OECD
immigrants and 34% of immigrants born in OECD countries. At the same time, the share
of immigrants with a high level of education rose from 27% to 35% for those born outside
of the OECD area, and from 21% to 30% for those born in an OECD country. In 2015/16,
there were more tertiary-educated foreign-born than low-educated immigrants in OECD
countries, which is a complete reversal of the situation in 2000/01.
26. The high share of tertiary-educated individuals among immigrants from outside the
OECD area, compared to immigrants born in OED countries, can be explained in part by
the closer geographic proximity to a large number of OECD countries (European countries,
North American countries, Australia – New Zealand), and by the existence of free-
movement zones, such as the European Union. These two factors make it comparatively
easier for the less educated to move. In addition, many OECD countries have selective
immigration policies, which have a proportionally greater impact on immigrants from non-
OECD countries.
27. In total, between 2000/01 and 2015/16, the number of tertiary-educated immigrants
increased by around 20 million, while the number of low-educated immigrants increased
by only five million.
A GLOBAL PROFILE OF EMIGRANTS TO OECD COUNTRIES
UnclassifiedDELSA/ELSA/WD/SEM(2020)4 21
Figure 5. Share of low- and high-educated migrants, by group of countries of birth, 2000/01
to 2015/16
Low education, Born in non-OECD countries Low education, Born in OECD countries
Higher education, Born in non-OECD countries Higher education, Born in OECD countries
%
50
40
30
20
10
0
2000/01 2005/06 2010/11 2015/16
Source: Database on Immigrants in OECD Countries (DIOC) 2000/01, 2005/06, 2010/11 and 2015/16.
28. Accounting for duration of stay reveals a specific trend for tertiary-educated
immigrants from OECD countries, compared to immigrants born in non-OECD countries
(Figure 6). In 2000/01, the proportion of high-educated immigrants was virtually identical
among recent migrants and long-standing migrants born in OECD countries. However,
over the past 15 years, the average level of education of recent immigrants has risen at a
faster pace. This difference was not observed for migrants from non-OECD countries,
which suggests that it mainly reflects an increase in the temporary migration of highly
educated individuals from one OECD country to another, with a substantial proportion
returning to their origin countries. It is likely that much of this trend is driven by intra-
European mobility.
Figure 6. Share of high-educated migrants, by group of countries of birth and duration of
stay, 2000/01 to 2015/16
Settled immigrants, Born in non-OECD countries Settled immigrants, Born in OECD countries
Recent immigrants, Born in non-OECD countries Recent immigrants, Born in OECD countries
%
50
40
30
20
10
0
2000/01 2005/06 2010/11 2015/16
Source: Database on Immigrants in OECD Countries (DIOC) 2000/01, 2005/06, 2010/11 and 2015/16.
A GLOBAL PROFILE OF EMIGRANTS TO OECD COUNTRIES
Unclassified22 DELSA/ELSA/WD/SEM(2020)4
3. Emigration rates and “brain drain” estimates
29. Absolute numbers of migration to OECD countries only shed light on one side of
the coin, disregarding the origin countries’ perspective. Yet, during the past decades of
migration research, a large portion of the literature – closely followed by the scrutiny of
the media and the public eye – has focused on the extent to which certain origin countries
are depleting their population in favour of richer host countries. In particular, the
emigration of the “best and brightest”, high-skilled individuals has often been at the centre
of the debate, under the disputed name of “brain drain” (see also OECD (2016[7])).
30. The Database of Immigrants in OECD Countries (DIOC) allows an estimation of
both the total and highly skilled emigration rates, thereby providing a new and updated
picture of which countries of origin are affected the most by emigration. Note, however,
that only OECD destinations appear in this analysis, hence underestimating the size of
phenomenon for some origin countries where most migrants move to non-OECD countries.
Total emigration rates for each country of origin, as well as emigration rates for women
and the highly-educated, are provided in the Appendix (Table A.2.).
3.1. Total emigration rates to OECD countries
31. Figure 7 presents the 2015/16 total emigration rates, defined as the ratio between
the number of emigrants from a specific country living in OECD countries and the total
sum of the resident population of this country and emigrants living in OECD countries.
Among the countries most affected by emigration, small-size islands have a prominent
position. The total emigration rate of Samoa and Tonga reaches as high as 42% in 2015/16,
and many other islands across the globe appear among the highest emigration rate
countries, such as Jamaica (33%) and Cape Verde (26%). Certain Central and Latin
American countries also have substantial emigration rates, including Belize (18%) and
Barbados (28%). In Europe, Balkan countries are among the largest sources of migrants.
For example, Albania has a total emigration rate of 29%, Bosnia and Herzegovina of 20%
and Northern Macedonia of 18%. In contrast, few countries worldwide have emigration
rates of less than 1%, including a number of G20 countries (Saudi Arabia, Indonesia, China,
Japan, and the United States).
A GLOBAL PROFILE OF EMIGRANTS TO OECD COUNTRIES
UnclassifiedDELSA/ELSA/WD/SEM(2020)4 23
Figure 7. Total emigration rates to OECD countries, 2015/16
Note: The emigration rate is calculated as the ratio between the number of emigrants living in OECD countries
and the total sum of the resident population and emigrants living in OECD countries.
Source: Database on Immigrants in OECD Countries (DIOC) 2015/16.
32. On average, emigration rates towards OECD countries have increased from 5.5%
in 2000/01 to 6.5% in 2015/16. As shown in Figure 8, some countries have experienced a
larger rise. A number of East European countries – in particular, Moldova, Romania and
Albania – saw their emigration rates increase by over five percentage points in the last 15
years. Interestingly, several countries lie below the 45 degrees line, meaning that their
emigration rates to the OECD area have actually shrunk over time.
Figure 8. Total emigration rates, 2000/01 and 2015/16
Emigration rate in 2015/16
(%)
40 GUY
JAM
30 ALB
CPV
SLV TTO
20 BIH
MKD BLZ
ROU BGR STP
IRL
MDA LTU
10
HTI
0
0 10 20 30 40
Emigration rate in 2000/01 (%)
Note: The emigration rate is calculated as the ratio between the number of emigrants living in OECD countries
and the total sum of the resident population and emigrants living in OECD countries.
Source: Database on Immigrants in OECD Countries (DIOC) 2000/01 and 2015/16.
A GLOBAL PROFILE OF EMIGRANTS TO OECD COUNTRIES
Unclassified24 DELSA/ELSA/WD/SEM(2020)4
3.2. Emigration rates of the highly educated
33. Overall, the emigration rates of the highly educated are almost always higher than
the total emigration rates (Figure 9). This positive selection of migrants is linked to several
factors: not only highly educated individuals typically have lower budget constraints to
engage in cross-country migration than lower qualified peers, but also numerous OECD
countries have adopted more favourable migration policies for the highly skilled. Figure 10
provides an illustration of this fact: compared to Figure 7, emigration rates of the highly
educated are on average higher than total rates, but the geographic distribution is also
different, with a pronounced difference for many African countries.
Figure 9. Total emigration rate and emigration rate of the high-skilled, 2015/16
Emigration rate of high-
skilled (%)
80
70
60
50
40
30
20
10
0
0 10 20 30 40 50 60 70 80
Total emigration rate (%)
Note: The emigration rate is calculated as the ratio between the number of emigrants living in OECD countries
and the total sum of the resident population and emigrants living in OECD countries.
Source: Database on Immigrants in OECD Countries (DIOC) 2015/16.
A GLOBAL PROFILE OF EMIGRANTS TO OECD COUNTRIES
UnclassifiedDELSA/ELSA/WD/SEM(2020)4 25
Figure 10. Emigration rates of the highly educated to OECD countries, 2015/16
Note: The emigration rate is calculated as the ratio between the number of emigrants living in OECD countries
and the total sum of the resident population and emigrants living in OECD countries.
Source: Database on Immigrants in OECD Countries (DIOC) 2015/16.
34. This distinction is however more marked in the poorest origin countries, where the
emigration rate of the low skilled are extremely low (Figure 11). As they have poor human
capital levels and they are often confronted with significant budget constraints, low
educated individuals from poor origin countries are less likely to obtain a job in an OECD
country and have little chances of being able to afford such a long-distance migration. In
fact, low educated individuals tend to migrate regionally, often to neighbouring countries,
especially in developing regions. The emigration rate of the low educated gets higher for
those origin countries with a greater GDP per capita, although it drops again for the richest
countries, thereby following an inversed U-shape pattern.
35. A similar inversed U-shape pattern is observed for individuals having medium
education levels (i.e. secondary education), even though they generally have higher
emigration rates. In contrast, tertiary-educated individuals have a monotonous decreasing
relationship between their emigration rate and GDP per capita of origin countries. Indeed,
highly educated individuals from poor countries have the highest likelihood to reside
abroad. This reflects both the relatively low number of highly educated individuals born in
these countries and the lack of employment opportunities in certain specialised fields. In
addition, many of them actually obtain their education in OECD countries and stay in the
host country afterwards.
A GLOBAL PROFILE OF EMIGRANTS TO OECD COUNTRIES
UnclassifiedYou can also read