A Guide to the Dimensions Data Approach - Dimensions Report
←
→
Page content transcription
If your browser does not render page correctly, please read the page content below
Dimensions Report

A Guide to the Dimensions Data Approach
     A collaborative approach to creating a modern infrastructure for data
          describing research: where we are and where we want to take it

              Christian Bode, Christian Herzog, Daniel Hook & Robert McGrath

                                                           JANUARY 2018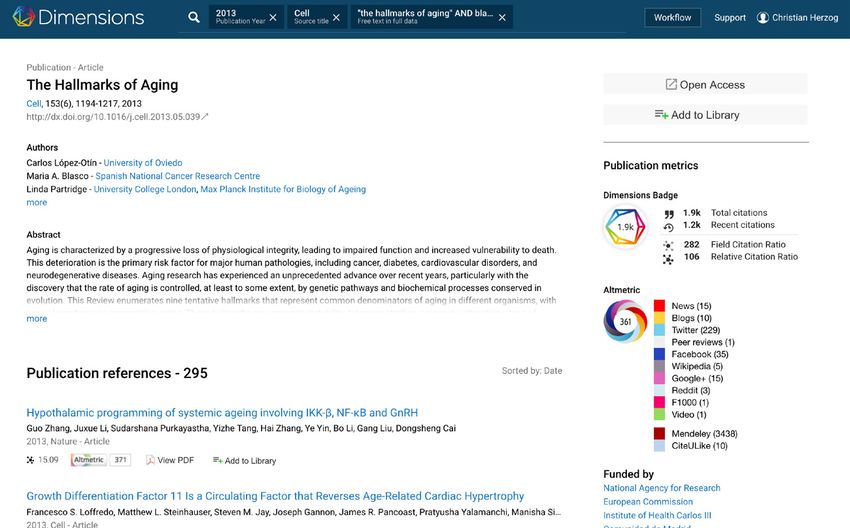
About Dimensions          Dimensions® is a modern and innovative, linked research data infrastructure and tool, re-
                                   imagining discovery and access to research: grants, publications, citations, clinical trials and patents
                                   in one place. The development of Dimensions has been triggered by the feedback from clients and
                                   partners of the Digital Science portfolio companies. As a result, Dimensions has been developed
                                   through a dynamic collaboration across Digital Science and six of its portfolio businesses (ReadCube,
                                   Altmetric, Figshare, Symplectic, DS Consultancy and ÜberResearch).

                                   With each company focused on a different pain point within the research cycle and serving various
                                   stakeholders in the research ecosystem, these teams shared their true passion for innovation, and
                                   contribute their unique experiences, opinions, and values into Dimensions. Visit www.dimensions.ai

      About Digital Science        Digital Science® is a technology company serving the needs of scientific and research communities
                                   at key points along the full cycle of research. We invest in, nurture and support innovative businesses
                                   and technologies that make all parts of the research process more open, efficient and effective. We
                                   believe that together, we can change research for good. Visit www.digital-science.com

        Acknowledgements           We are grateful to all contributors and would like to thank our development team for their time and
                                   effort in extracting the data to support this report.

                                   This report has been published by Digital Science, which is owned by the Holtzbrinck Publishing Group.

                                   For inquries in respect of Dimensions, please contact info@dimensions.ai, otherwise please write to
                                   Digital Science at info@digital-science.com or 625 Massachusetts Avenue, Cambridge, MA, 02139 USA.

                                   Copyright © 2018 Digital Science & Research Solutions Inc.

DOI: 10.6084/m9.figshare.5783094
Contents
 1.   A modern linked research data landscape				                                                                     2
      Quick facts on Dimensions - the total record count and more                                                      3

 2.   Linking it all together and enriching it for the user				                                                       3
      Full text index - enabling deep discovery	                                                                       4
      Machine learning based research topic classification - Fields of Research and other classification systems       4
      Disambiguating institution names - based on GRID							                                                          6
      Person disambiguation across publications, grants, patents and clinical trials - a challenging task	             7
      Citations, acknowledgements and adding context                                                                   7

 3.   Bringing content together from as many places as possible	                                              9
      How does Dimensions compare to other databases like Google Scholar, Pubmed, Scopus or Web of Science?	 9
      Citation counts in different systems and databases - there is no single truth!					 9
      The current content scope and quality is just the starting point	                                      11

 4.   Funded grants - a real glimpse into the future 		                                                            12
      Key statistics on the Dimensions grant data                                                                  13

 5.   Publications, books and citations 		                                                                         15
      Dimensions and publication / citations - a database, not a judgement call	                                   16
      Quality related filters, white and blacklists as tools for the user	                                         17
      Aggregating the Dimensions publication and citation data	                                                    18
      Open Access, Open Citation Data and Dimensions	                                                              19
      Key statistics on the Dimensions publication and citation data:	                                             19

 6.   Clinical trials - research result en route to clinical application 		                                        20
      Key statistics on the Dimensions clinical trial data                                                         20

 7.   Patents - research resulting in practical and commercial applications                                        22
      Key statistics on the Dimensions clinical trial data                                                         22

Dimensions Report                                                                                                   1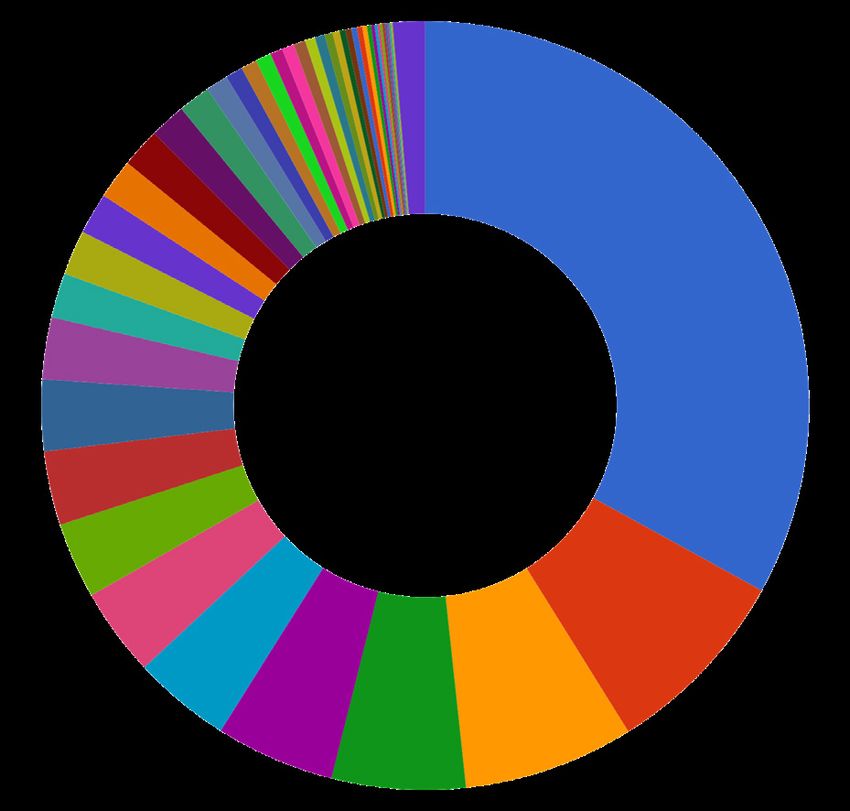
Dimensions
                         Content Overview
                         A modern linked research data landscape

    The broader          Dimensions was created in response to two significant constraints for Digital
                         Science and its development partners.The first constraint was that existing
    Dimensions team:     solutions sought to understand the research landscape solely through the lens
    100+ development     of publication and citation data.The second constraint was the way that existing
                         solutions exposed what data they did have. Much of the publications research
    partners and
                         graph had been locked away in proprietary applications, which constrained how
    Digital Science      the information could be used, including through a lack of workable APIs.Where
                         proprietary data existed, there were significant data holes, making the data less
                         useful for core use cases.

                         To address these constraints and to try to stimulate innovation to support
    Making publication   research, we worked closely with more than 100 development partners
    and citation data    (research organisations and funders) to realise an integrated database covering
                         the entire research process from funding to research, from publishing of
    freely available     results through attention, both scholarly and beyond, to commercial application
                         and policy making - consistently linked in multiple dimensions.

                         At the heart of Dimensions, we wanted to do something transformative
                         for research and that was always going to have multiple components. A key
                         part of that vision was that Dimensions makes available, without charge,
                         publication citation data via the Dimensions application (visit https://app.
    Empowering the       dimensions.ai) and via APIs - the metrics in Dimensions are available via
    research community   the open Dimensions Metrics API and the Dimensions Badges (visit https://
                         badge.dimensions.ai) - in both cases for non-commercial purposes.

                         Another aspect of supporting the academic community was empowering
                         the community. The current vogue in research evaluation promotes the use
                         of metrics to cope with the vast quantities of material being evaluated. It is
                         clear that a more open data source compatible with more open publications,
                         more open evaluation frameworks and more open metrics are needed.
    Does it support      Dimensions aims to be a system that helps the academic community to own
    your use case?       the formulation and development of metrics that tell the best stories and give
                         the best context to a piece of research.

                         This document provides an overview of the Dimensions content. Feel free to
                         reach out to the Dimensions team here if you want to discuss further whether
                         the content scope and coverage of Dimensions can help in your specific
                         situation and use case.

                         One of the most important aspects of Dimensions is that we are going to
    We will improve      develop it further with the research community - any feedback is welcome.
    it together!         Please contact us at info@dimensions.ai.

2                                                                                     Dimensions Report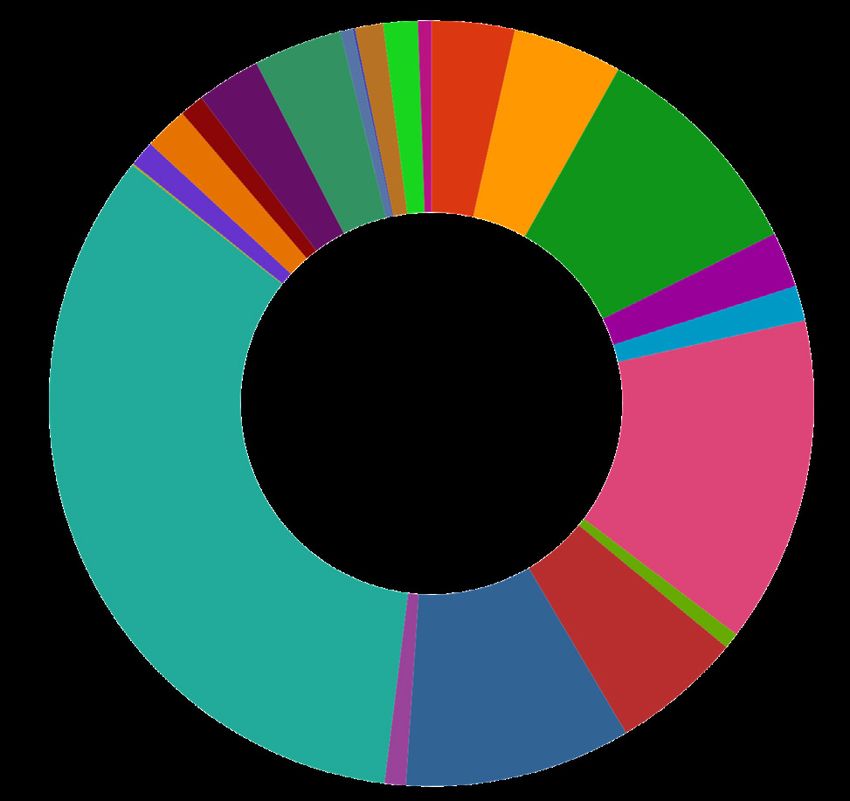
Quick facts on Dimensions - the total record count and more
Number of publication records 89,428,659
Number of funded grants 3,695,703
Number of clinical trials 380,440
Number of patents 34,599,378
Number of records with Altmetric data in Dimensions appr. 9 million
Total number of documents in Dimensions 128,104,180
…but what matters even more: appr. 4 billion
number of links between these records
Linking It All Together and
Enriching It For the User
Linked and integrated data from multiple sources are core to Dimensions. The links between grants,
This has been a key feature in discussing the product scope and direction
with development partners, who agree that the integrated view enables novel publications, clinical trials
insights. The following sections provide a quick overview of the key approaches and patents are key
which are visible to the user.
We are realising these linkages with a data driven, machine learning and
AI-based approach, automatically extracting the information to create
the connections. The content and enrichment pipeline is as automated as
possible, allowing us to provide Dimensions with publication / citation data to
researchers for free, and to research institutions at realistic cost levels. While
an automated approach allows us to offer a more open, free approach it also Automated process,
results in some data issues, which we will continue to have to work on and
improve. If you see anything that doesn’t seem correct in our data case please
efficient and effective,
reach out to us. We are always looking to improve the processing pipeline and but we need your help
subsequently the data and services that Dimensions provides - please email us to constantly improve
at support@dimensions.ai.
the quality
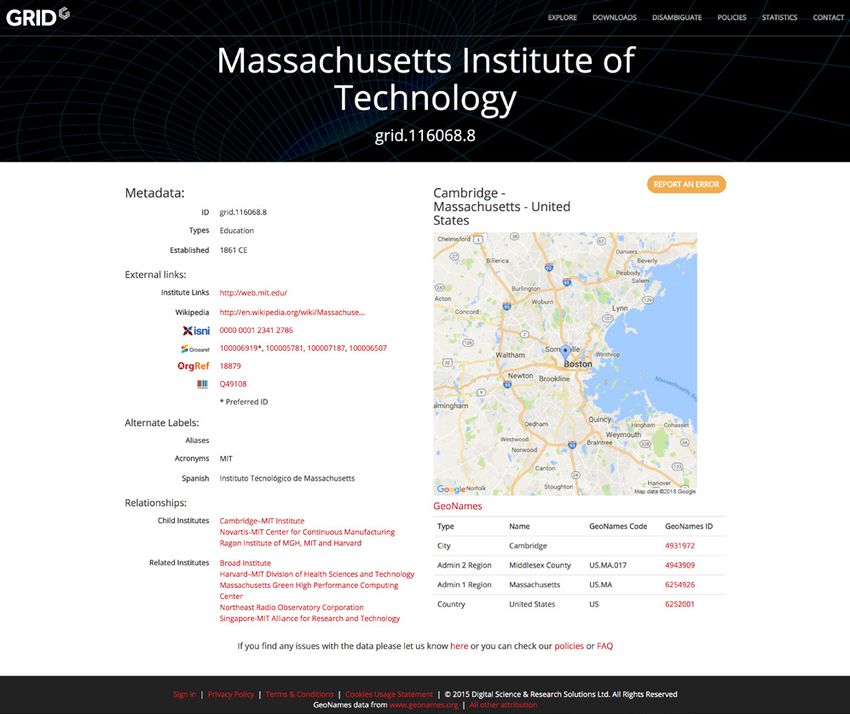
An example of a publication record in Dimensions with links to all other
content sources - allowing the user already in the freely available version to
explore these relations:
PUBLICATION RECORD
Publication references: 295
Supporting grants: 1
Supporting funding agencies: 15
Publication citations: 1,780
Patent citations: 1
Sorted by: Date
Research categories assigned: 10
Altmetric mentions: appr. 4000
Dimensions Report 3
Full text index - enabling deep discovery

                              Dimensions provides researchers with a free discovery service. Our
    Full text indexing -      approach to indexing the full text makes publications and books much more
    real discovery instead    discoverable. Full text search is already available for over 50 million publication
    of missing relevant       records in Dimensions. For example, a search for CRISPR in just title and
                              abstracts brings back about 8,300 results, while the Dimensions search using
    information               the full-text index results in more than 43,000 results. The full text index
                              makes Dimensions a very powerful discovery tool - especially with the filtering
                              options, which helps researchers to further refine their results.

                              Machine learning based research topic classification - Fields of
                              Research and other classification systems

    Article-level metrics     In existing databases such as Web of Science and Scopus, the documents are
                              typically categorized using a journal as a proxy, with a few research categories
    need to be paired         being assigned at the journal level. This approach has created unintended
    with article-level        consequences across research, from content coverage in databases to citation
                              benchmarking practices.
    classifications
                              Technology has developed further. The fields of natural language processing,
    NLP, machine learning     machine learning and artificial intelligence have all made huge advances in
                              recent years. Dimensions has been able to leverage these technologies to
    and AI are allowing       solve a very practical problem requiring a different approach: If you want
    categorisation            to consistently categorize grants, patents and clinical trials, a journal proxy
    approaches which          is no longer available. The path we have chosen for Dimensions is to use
                              existing classification systems and an AI/machine learning based approach to
    take the substance        automatically assign a consistent set of categories to all documents - regardless
    into account              of the source.

                              We implemented established research classification systems that have
                              existing associated datasets that we are able to use to train our classification
                              algorithms. The leading categorization system with broad coverage of subject
                              areas and a large general corpus of training material is the Australia/New
                              Zealand Fields of Research system. This classification “lens” has been made
                              available as part of the free Dimensions version.

                              Research categories in Dimensions- Australian and New
                              Zealand Standard Research Classification (ANZSRC)

                              The Fields of Research (FOR) classification is a component of the Australian
    FOR - part of the         and New Zealand Standard Research Classification (ANZSRC) system,
    Australian and New        developed in 2008. It allows all R&D activity to be categorized using a single
    Zealand Standard          system.

    Research Classification   The ANZSRC is used in all areas of research and education in Australia and
                              New Zealand. The FOR classification has three hierarchical levels: Divisions,
    (ANZSRC) system
                              Groups and Fields. Division represents a broad subject area or research
                              discipline, while Groups and Fields represent increasingly detailed subsets of
                              these categories. There are 22 Divisions, 157 Groups and 1238 Fields. We have
                              emulated the second level of the system only (Groups) in Dimensions. We
                              have used a reverse-engineering technique, based on machine learning, where a
                              corpus of manually-coded grants are examined and the manually-applied codes

4                                                                                           Dimensions Report
are reproduced by the algorithm. This is then checked against actual codes, and
 the algorithm is iterated.

 FOR classification covers all areas of academic research at a high level, so it
 works well for non-granular investigations by broad subject areas. Therefore,
 FOR is good for comparative analyses across all academia.

 The FOR classification system is a good starting point, but due to the nature         Ongoing improvement
 of the training set some of the categories are challenging. We are going to
 improve the training set in collaboration with the Dimensions development
                                                                                       of the training set
 partners. This will be an ongoing task where we plan annual refreshes -
 providing the research community the opportunity to help shape and influence
 how we implement the classification system.

 Where you see an item in the system that hasn’t been classified as you would
 expect, we want to know about that. It might be that our training dataset
 doesn’t have very good coverage of that field or that we lack enough data to
 train our algorithms to discern between two closely related areas. The input
 of the community can make a massive difference to the effectiveness of the
 system by making comments and categorisation suggestions available to us.
 Shortly after launch we will integrate a simple feedback mechanism to allow
 the user to provide feedback with very little effort.

 Other classification systems

 Other classification systems have been implemented in addition to the                 NIH’s RCDC and UK
 ANZSRC and FOR codes. The choice of these different classification lenses
 is mainly driven by the needs of research funders, the majority of whom are           HRCS implemented
 focused on the biomedical sciences. An analogous machine-learning approach            as well
 has been used to implement these schemes. Examples include:

 •T
   he Research, Condition, and Disease Categorization (RCDC) is a classification
  scheme used by the US National Institutes of Health (NIH) for the public
  reporting required by the US Congress.The ÜberResearch team has
  implemented the technology for RCDC at the NIH and is still supporting it.

 •T
   he Health Research Classification System (HRCS) is a classification system
  used by nearly all UK biomedical funders to classify their portfolio of health
  and biomedical projects. There are two strands to HRCS – Research Activity
  Codes (RAC) and Health Categories (HC).

 Any other classification system can be generated in a similar way with very           Other classification
 little effort. Several additional schemes have been implemented for clients with
 specific topic classification needs. Examples could be classification systems
                                                                                       systems can be
 on a national level or very specific topic focused systems. If required, it is also   implemented
 possible to categorize documents that are not part of Dimensions.This is
 currently not a standard feature of the Dimensions API. Please reach out to
 the Dimensions team if you would like to learn more here.

Dimensions Report                                                                                             5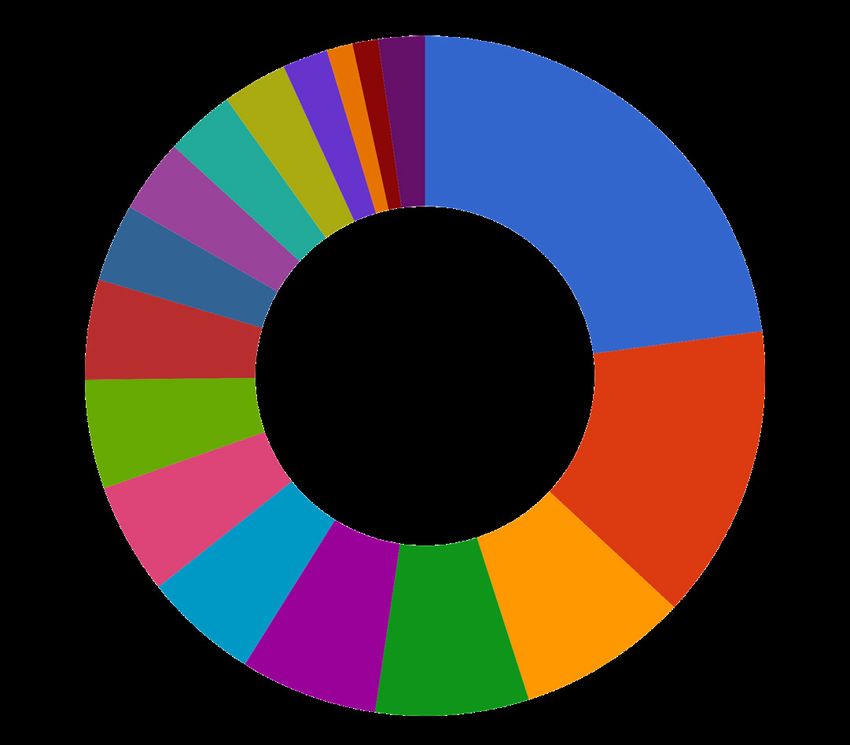
Disambiguating institution names - based on GRID

The challenge of          Authors of publications (as well the other research objects such as grants and
                          patents) express their institutional affiliations in non-standard ways. Indeed,
affiliation names         most institutions have a few name variants but for some organizations we
                          found hundreds of name variants. For a data infrastructure like Dimensions it is
                          important to be able to assign documents automatically to a unique identifier
                          that corresponds to a single institution. Furthermore, each institution in that
                          unique identifier list must be well defined according to a policy that helps to
                          quantify what we classify to be an institution, why it has been included and
                          what type of institution we believe it to be. On top of this, there must be
                          useful metadata, such a geolocation information, date of foundation and, most
                          importantly, a persistent identifier.

                          Digital Science has already started to tackle that challenge - resulting in the
                          release of the open GRID database, which has grown to cover more than
                          70,000 institutions, where the data has been curated and each institution
                          assigned a persistent identifier. GRID is continuously improved and used in
                          many other systems, for example ORCID (see ORCID blog post).
GRID - an open
                          In Dimensions, the GRID system is used to allow us to create a consistent
resource provided by      view of an organization within one content source, but also across the
Digital Science           different types of content.

MIT GRID file in folder                      MIT Dimensions file in folder

Feedback to improve       GRID is continuously improved as we encounter more data and feed that back
                          into the GRID database. Digital Science is committed to providing GRID on an
GRID is appreciated!      ongoing basis as an open dataset under a CC0 license to support the research
                          community. GRID is not yet perfect and never will be. Research organizations
                          change: some merge, some rename themselves, new institutions appear.
                          Change here is more fluid than you think! For more information on GRID
                          please visit www.grid.ac or the GRID support page, where you can also submit
                          support requests or suggestions for improvements.

 6                                                                                      Dimensions Report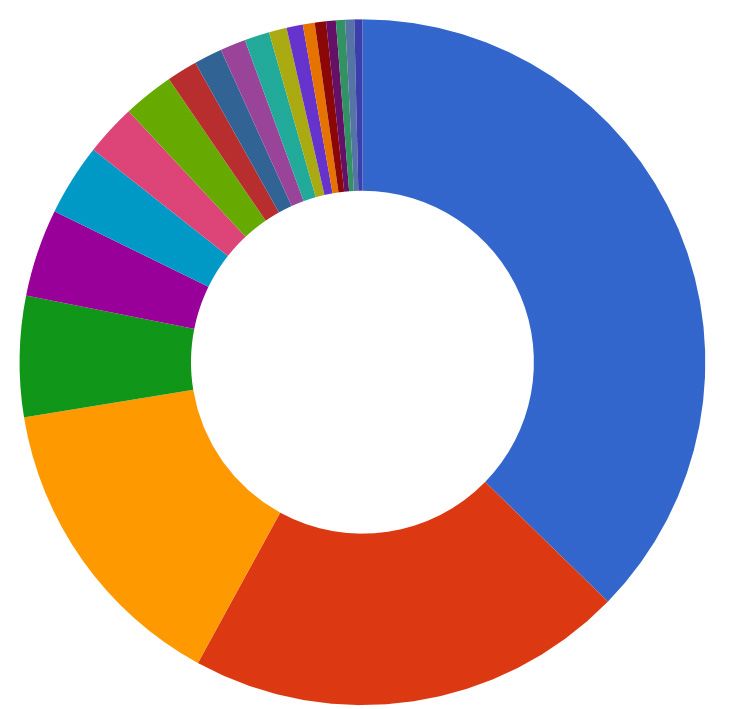
Person disambiguation across publications, grants, patents
 and clinical trials - a challenging task

 Automatically assigning the correct publications to a researcher has
                                                                                     Researcher
 always been a challenging task. Even with the growing adoption of ORCID
 identifiers by an increasing proportion of the research community there still       disambiguation across
 exist software solutions such as Symplectic Elements to help researchers,           multiple sources
 institutions and funders manage the link between publications, researchers and
 grants. However, automated assignment is four times as challenging for the
 team behind Dimensions! The aim of Dimensions is to connect a researcher
 to all their research objects across at least four content sources: grants,
 publications, clinical trials to patents. Consequently, we have invested a lot of
 resource to developing an automated researcher disambiguation process that
 takes into account not only the metadata in each of the content sources but
 also the publicly available ORCID data to provide the best outcome that can
 be achieved at this point.

 In technical terms, Dimensions has taken an approach that focuses more on
 precision and less on recall of the disambiguation routine. This is because
 we believe that assigning the wrong publications and other documents to a
 researcher is worse than suggesting an incomplete record since data errors
 undermine the trust in the results and can be highly confusing. Completeness,
 on the other hand, can be easily fixed with the help of the user and is not as
 detrimental to the user experience as a basic lack of trust in the results.

 For the launch, we have completed a beta version of the disambiguation              Feedback desired,
 functionality, which will improve with time. Future improvements will be
 based on the work of our data science team, but also, critically, will be based     ORCID infrastructure
 on feedback and interaction with the research community. Soon after launch          to be implemented
 we will provide the ability to provide feedback on the automatically-produced
 researcher profiles via the ORCID website - giving researchers the ability to
 influence their record in Dimensions.

 Citations, acknowledgements and adding context

 The extraction of the references and links between the different content            Extracting references
 sources is key to Dimensions. Our aim is to allow a user to gain a far superior
 understanding of the context of a piece of research by eliminating the walls
                                                                                     - creating a network
 and separations between isolated data silos. Bringing data together in this         across sources
 way allows a much improved view on the nature of research in a particular
 field as well as the associated research process. The user is then able to draw
 conclusions and gain new insights, which previously would have taken an
 enormous amount of effort.

 References between the different records are either harvested from existing
 databases (such as CrossRef, PubMed Central, Open Citation Data) or
 extracted directly from the full text record provided by the content publisher.
 This is not only limited to journal publication references, but also includes
 acknowledgement and citation from and to books, conference proceedings,
 patents, grants and clinical trials.

Dimensions Report                                                                                            7
PUBLICATIONS                          GRANTS
                         Publication references                Resulting publications
                         Publication citations                 Resulting patents
                         Supporting grants                     Resulting clinical trials
                         Patent citations
                         Linked clinical trials

                         PATENT                                CLINICAL TRIALS
                         Patent references                     Linked publications
                         Publications references               Supporting grants
                         Supporting grants
                         Patent citations

More than 1.3 billion   In total, we have extracted more than 1.2 billion direct connections between
                        the document records, with 873 million between publication records alone.
references between      This number is continually growing as we integrate more content, as we
documents               improve the representation of the content from more and more publishers,
                        and as we work on perfecting our extraction routines.

8                                                                                   Dimensions Report
Bringing Content Together
From as Many Places as Possible
How does Dimensions compare to other databases like Google
Scholar, Pubmed, Scopus or Web of Science?
Dimensions is not directly comparable to PubMed, Google Scholar, Scopus or Web Not comparable - a
of Science. It is a different style of offering with different features and a different
approach. However, one can say that the approach we have taken aims to identify new and innovative
and improve upon the best (or most relevant) parts of each of those systems so approach
that the user has an enhanced experience.
Dimensions provides:
•A
solid citation graph of the kind offered by Scopus or Web of Science, while
acknowledging that we are still working on coverage in many fields;
•W
ide coverage and an enhanced experience around discovering the right (or most
relevant) research based on indexing the full-text, in a similar approach to Google
Scholar;
•A
dvanced search syntax that helps the user to be specific in their searches, as
PubMed does, but with the advantage that it goes beyond biomedical research.
On top of these core features, Dimensions transcends existing tools and databases: Grants, clinical
The bringing together of grants, publications, clinical trials and patents, consistently
linked and contextualised, opens up a world of proper discovery, research planning
trials and patents
and impact communication possibilities. In addition, the Dimensions user interface - for the first time an
presents search results in context allowing a user to understand the setting of a
integrated picture
search result at a glance, while at the same time, facilitating greater exploration of
potentially relevant works, funding or routes to impact.
The data is provided with a powerful API, allowing a machine-to-machine interaction.
This is available in the institutional subscription but can also be made available to
individual researchers for research purposes on request.
Citation counts in different systems and databases -
there is no single truth!
One question we are asked when talking about Dimensions is,’how does our Citations counts -
citation count compare to Google Scholar, Scopus or Web of Science’? As much
as we would like to able to give a simple answer, it is not possible. First of all, why do they differ?
Dimensions and the reference that it contains is not directly comparable with other
databases since Dimensions also captures references and links to sources beyond
classic publication-based citations. Even if we only examine the publication-based
citation count, it is not possible to establish a simple ranking. (This type of work was
already found by the bibliometrics community in the comparison of the Scopus and
Dimensions Report 9Web of Science databases following the launch of Scopus in 2006.) There are
several reasons why Google Scholar, Scopus,Web of Science and other services
may show different citation counts for the same content. Some of the reasons
for these disparities include:
• e ach database covers different sets of databases and content to build its
citation graph
• e ach database may include content from different date ranges (e.g. 1996
to present)
• e ach database may include different types of content. For example, some
sources may only include references from peer-reviewed journals, while others
may include references from non-published or not-yet-published works, such
as student theses published on a website, citations from pre-prints or e-prints
(where versioning and disambiguation of pre-print and post-print versions of
the same paper adds yet more complexity)
• t he frequency at which the content is updated differs by database, from daily to
weekly and beyond
• e xtracting references from a paper and uniquely matching them to the
reference graph is a challenge which each database solves in different ways.
There is no standard, industry defined approach and, as a result, in some
cases references may not properly match, and in other cases false positives
may occur.
• a s algorithms for matching improve and new data sources become available,
reference graphs may be updated, resulting in changes to citation counts.
Dimension citations - While spot checking Dimensions records against source data we found that
for some articles we were under reading citation counts while for other
at the right level publications our counts were notably higher than publicly available higher
citation sources.We know that there are some fields where we need to engage
with more publishers or more funders for greater coverage. Likewise, we know
that there are some geographies where more work is needed to achieve greater
patent coverage. As ever, we look for feedback from the community to prioritise
our development focus for content integration.
As an illustratration, from available data, an example from PLOS One:
FastTree 2 – Approximately Maximum- Dimensions: 2,038
Likelihood Trees for Large Alignments Scopus: 1,834
Price MN, Dehal PS, Arkin AP (2010) WoS: 1,843
FastTree 2 – Approximately Maximum- CrossRef: 1,640
Likelihood Trees for Large Alignments. Google Scholar: 2,610
PLOS ONE 5(3): e9490.
https://doi.org/10.1371/journal.pone.0009490
Given the many variables described above, it is not possible for multiple parties
to arrive at a single absolute count. As a result, in practice many researchers
consider citations counts to be a useful relative metric when comparing other
content within a single system.
10 Dimensions ReportThe current content scope and quality is just the
starting point
It took a large amount of effort and resource to bring all the current sources
and content together - we consider this only to be a starting point:
•G
rants are added continuously - every few months new funders and their Dimensions and the
portfolios become part of the Dimensions data universe underlying data is an
•W
e are going to add more publication data - with a focus on ongoing effort
international content
•P
re-prints will be consistently integrated
•W
e continue to support publishers who wish to work with us to make their
content more discoverable in Dimensions. In particular, we have created a
technical environment so that a publisher can integrate their data almost
automatically into our database
•P
atents - new jurisdictions will be added during the course of 2018
And, that’s just the start:There is more being planned! The representation of
books in the system is currently challenging and we are working on a more
A joint effort to improve
consistent way to represent them.We will integrate a large collection of policy the data - please be as
documents in the future, adding a completely new facet to the discovery critical as possible!
experience that we are very excited to bring to the community. These are just
two elements we are currently working on!
Most important to us is your input and feedback.We are looking forward to
being challenged and to receiving many suggestions from you as to where we
can improve the data.We already have a long list of tasks from our development
partners and friends, but we can always be better! This is clearly a team effort
and we need you as the users, the research community and the broader
Dimensions team!
Dimensions Report 11Funded Grants - a Real
Glimpse into the Future
Funded grants are the result of an extensive process in which a researcher or
Grants, a forward
team of researchers describe the research project that they wish to undertake.
looking data source - The aim of their “pitch” is to convince a research funder, through an anonymous
neglected for too long peer review panel, that the research problem is interesting, tractable and worthy,
and that the team is qualified and capable of achieving the outcomes suggested.
This process is even more important since, in most cases, the money being
spent is public money and hence must be accounted for in a responsible manner.
Grants are the first manifestation of a research idea in a cogent format that
must convince a third-party of their value - a little like a beta software release.
That position in the research cycle makes it a very special source for discovery
since it allows analysis of trends and movements in fields by looking at the
research that is intended to be carried out in the coming years - a glimpse into
the future. For funders, research policy strategists and planners, analysis of the
funding landscape allows early intervention and strategy formulation, not only
the retrospective identification of fast facts or wrong decisions.
ÜberResearch ÜberResearch (one of the six businesses in the Digital Science portfolio creating
Dimensions) was founded in 2013 to work with research funders on aggregating
aggregated a grant a large grant database. Its aim was to enable, for the first time, a broad view
database with $1.2 across national and institutional borders on the resource input aspects of the
research system and to make this available not just to the largest funders, who
trillion in funding
have the responsibility to commission custom systems to ensure appropriate
reporting to public stakeholders, but also to smaller funders with smaller teams
and more limited resources. ÜberResearch’s early effort has now become part
of the new and broader version of Dimensions, which covers the entire flow
from input to academic attention, commercialization, policy formulation and
routes to impact.
Grants are a difficult content source for several reasons:They do not follow
Grant data provides a common metadata schema in the way that publications do, nor do they yet
particular insights, not have a persistent identifier such as the DOI; they are highly dependent on
a complete research individual national frameworks of research funding. Geographic differences are
not trivial. In some countries, the majority of the research funding is given out in
funding view competitive project grants, while in other countries there is a skew toward block
funding, which will never show up in a funded grants database. Of course, there
are a lot of countries that fall between the ends of this spectrum with a mix of
block funding and project-based funding. For that reason the grant data should
not be taken as a complete view on all research related funding, as we pointed
out in a recent report. It covers project-based funding from different types
of funders (government, multinational, charities etc.). If you have any question
related to your use case do not hesitate to reach out to us here.
12 Dimensions ReportKey statistics on the Dimensions grant data
The following key statistics have been captured on Jan 1, 2018 and are changing
on a weekly basis - this means that the values in this document can vary from
the actual results in the Dimensions application or API.
No. of funded grants: 3,695,703
Total funding amount more than $1.2 trillion
Total amount of funding of projects more than $276 billion
active in 2018 and beyond:
Average funding amount: $899,000
Number of research funders covered >250, more added on a
monthly basis
Links between grants and research 3,255,505
organizations
Links between grants and funders 3,675,892
Links between grants and researchers 5,422,483
Links between grants and publications 4,258,414
Distribution of funded projects across disciplines
■ Mathematical Sciences
■ Physical Sciences
■ Chemical Sciences
■ Earth Sciences
■ Environmental Sciences
■ Biological Sciences
■ Agricultural and Veterinary Sciences
■ Information and Computing Sciences
■ Engineering
■ Technology
■ Medical and Health Sciences
■ Built Environment and Design
■ Education
■ Economics
■ Commerce, Management, Tourism and Services
■ Studies In Human Society
■ Psychology and Cognitive Sciences
■ Law and Legal Studies
■ Studies In Creative Arts and Writing
■ Language, Communication and Culture
■ History and Archaeology
■ Philosophy and Religious Studies
Geographical distribution of grants (total number of countries = 174)
■ United States
■ Japan
■ Canada
■ Russian Federation
■ China
■ Belgium
■ United Kingdon
■ Germany
■ Switzerland
■ Brazil
■ 160 other countries
Dimensions Report 13Funding over time - note the increase in stimulus funding in 2009
Project count per year
14 Dimensions ReportPublications, Books
and Citations
Dimensions and publication / citations - a database,
not a judgement call
With Dimensions, a powerful publication and citation database has been Lack of innovation due to
made available to increase access and usage of metadata for researchers and
institutions, which has been, for a long time, an aspiration for Digital Science. An data being ‘locked up’
uncompetitive landscape has led to a slower-than-desirable pace of innovation
to support researchers in many use cases. Rather than a lively research-led
discussion about the needs of researchers, administrators and evaluators, there
has been a narrower approach born of historical legacies both technological and
practical as well as specific drivers from the research policy arena.
But it was clear that simply replicating existing approaches to create a third Dimensions - not
(or fourth, or fifth, depending on how you classify and count) abstracting and
indexing database would not be in the sector’s interest, so we decided to do two
a replication of the
things in a fundamentally different way: usual approach - a
different approach
•D
imensions should be open to integrate all relevant research objects - in
essence, less editorial choices over the content to be included (within reason,
predatory journals, for example, clearly need to be treated differently)
•C
onsistent integration and linking of other sources (grants, patents and more.)
treated in on the same basis as publications.
Making the Dimensions database as comprehensive as possible is a central As comprehensive as
driver. We firmly believe that technological advances have led to different
expectations from users. People no longer expect or desire that a search possible - the decision
engine should filter content based on the preferences of a vendor. Indeed, as power belongs in the
we write this report, net neutrality is becoming a big issue and in a very real
hands of the user, not
sense we are consciously choosing to be neutral with respect to the content
that we index and display to users. This means that we should not make the a vendor
decision as to what is a ‘worthy’ research output (e.g. journal) to be included in
our database - these decisions belong in the hands of the research community
or, depending on the use case, in the hands of the individual user. Rather, it is
our job to give users the best tools to navigate content and arrive at the most
relevant results in the most efficient way.
Quality-related filters: whitelists and blacklists as tools for
the user
To ensure that users have the tools that they need to make content the right
content filtering decisions for their use case we have implemented features
that allow the user to limit the results that they obtain to certain subsets. The
standard filters are specified by pre-defined, curated lists, which can be white
Dimensions Report 15or black lists. We started our list definition with accepted openly available
listed defined by others in the community, but are looking forward to receive
new suggestions, again from the research community.
At launch, the following journal lists have been implemented in Dimensions:
•D
OAJ list: Directory of Open Access Journals (DOAJ) is a community-
Norwegian Register, curated online directory that indexes high quality, open access, peer-
Web of Science (beta), reviewed journals. The DOAJ journal list includes over 10,000 journal
ERA list, DOAJ list titles covering all areas of science, technology, medicine, social science and
humanities.
•E
RA list: The ERA 2015 journal list was designed by the Australian Research
Council (ARC) in cooperation with the National Health and Medical
Research Council (NHMRC) and the broader research community, with the
purpose of supporting Australia’s national research evaluation framework,
Excellence in Research for Australia (ERA). Included are journals that were
eligible for institutions' ERA 2015 submissions. We will include the ERA 2018
list as a filter once it is released.
•N
orwegian Register: The Norwegian register, officially the ‘Norwegian
Register for Scientific Journals, Series and Publishers’ is operated jointly by
the Norwegian Centre for Research Data (NSD) and the National Board of
Scholarly Publishing (NPU). The list shows which scientific publications are
recognized in the weighted funding model and includes around 30,000 source
titles.
•W
eb of Science list (approximation, in beta): The Web of Science
Master Journal List includes all journal titles covered in Web of Science. The
master journal list includes over 24,000 source titles indexed in: Web of
Science Core Collection, Subject Indexes on the Web of Science platform,
Current Contents Connect and Science Citation Index. The list is an
approximation only since aspects of timing are not taken into account, that
is: A journal might have been only accepted to be indexed in WoS in 2015,
but the filter will include all content that we have for that journal, not only
post-2015 content.
Any idea for an These filters are just a starting point and only address specific use cases. We
are keen to learn about other general, national or institutional filters that
additional ‘quality’ list? should be considered, as well as different use cases where other lists may be
Please get in touch! helpful and welcome feedback so that we can develop this concept further.
Aggregating the Dimensions publication and citation data
The publication and citation content in Dimensions is aggregated in a complex
process. Below we sketch the key points in a two-step process for those who
are keen to understand “why the data looks that way”.
90 million publication Step 1: Creating a backbone
metadata records An extensive metadata backbone was assembled and is continuously updated.
assembled This data spine integrates data from many sources, including openly-available
16 Dimensions Reportdatabases together with those with permissive content licenses, such as
PubMed, PubMed Central, ArXiv and CrossRef.
This initial step resulted in a large index of uniquely-identified publications
containing about 90 million records. The CrossRef records associated with a
DOI sourced from the publishers among the 9,351 CrossRef members form
a significant core of this spine. This provides the Dimensions database with a
very robust metadata backbone, but even with this great resource there are
some limitations on metadata completeness, most notable is affiliation data
for authors.
Step 2: Enhancing the data
The metadata records resulting from Step 1 are enhanced by processing
full-text records, where those have been made available to us, significantly
improving discoverability of content.
This Step includes deriving reference/citation data from the full-text and 50 million records enriched
mining acknowledgements sections to identify links to patents, research
funders and funded projects. This Step has been completed for more than
- from more than 100
50 million full-text records, some open access but many made available to publishers already
Digital Science for such purpose. These records are sourced from more than
100 publishers including some of the largest STM publishers in the world.
Searching Dimensions will quickly indicate where we have coverage.
A key part of this data enhancement Step is that we are able to index full-text
records. This means that a user can search for any term in a paper - it doesn’t
have to be in the title or the abstract. In concert with the filtering mechanisms
that we’ve put in place for users, this means that you are increasingly likely to
locate the research work that you’re looking for,
New publication data is added as more and more publishers join the effort New content added
and make their content more discoverable. Over the last 12 months, we have
focused primarily on the large- and medium-sized publishers to be ready for
continuously - self service
the launch of Dimensions. In 2018 we will also launch a self-service content platform coming in 2018
integration platform so that publishers can integrate their content with
minimal effort.
If you are a publisher and want to see your content representation improved Want to integrate
in Dimensions - just reach out to us via this form and we will be in touch!
your content?
Beyond academic attention - altmetrics data in Dimensions
Digital Science was an early supporter of the alternative metrics movement
and Altmetric has played a key part in defining the agenda around altmetrics.
Altmetrics - an
Indeed, Altmetric has lead the field with a number of innovations including the immediate and different
colorful Altmetric badges, score, unique sources like policy documents and type of impact
university syllabi, and the always popular Altmetric Top 100.
Dimensions includes high-level Altmetric data for each article in the index
and displays this on the article details page. In this way, we bring together the
academic attention (citations), innovation attention (patents), clinical attention
Dimensions Report 17(trials) alongside public and policy engagement attention including social
media, traditional media, policy attention and the other forms of attention that
Altmetric indexes.
The need to demonstrate the impact of research has, in a number of countries,
sought to bring together data to tell stories to describe the route to impact.
The inclusion of Altmetric data natively in Dimensions moves the community
a step closer to understanding the impact of research in more quantifiable
terms.
Open Access, Open Citation Data and Dimensions
Open Access in Digital Science is a firm supporter of Open Access and Dimensions can be
Dimensions a helpful tool for the community in supporting these efforts. We are in the
process of integrating data from a variety of sources to create an “as-near-as-
possible” comprehensive view on Open Access articles (currently we include
data from DOAJ and data associated with oaDOI / Unpaywall). The free
version of Dimensions allows a user to access most of the OA articles with
a single click. The article opens directly in a ReadCube overlay window on
top of the Dimensions interface to get the user to the content as quickly as
possible. Of course, the pdf is available for download as well. We are working
hard to extend this to all OA records as soon as we can.
Dimensions -
Dimensions is an example of the power of making metadata including citations
making citation and publicly available, in order to stimulate innovation and novel solutions / tools.
metadata available Dimensions has been developed with the same goal in mind: Making good
quality, consistent and linked metadata available to the community not just
to ensure access for all but to stimulate creativity. So much can be done with
these data and to create innovation that supports research.
Dimensions and open Dimensions is aligned with the very important Initiative for Open Citations.
citation data Indeed, Dimensions is an example of what can be done if citation data is
more openly available. In building Dimensions, Digital Science had to invest
significant effort to make a good enough citation graph so that a good quality
discovery experience could be delivered to users. We hope that the I4OC and
similar initiatives continue to lower that barrier going forward. This will allow
the community to focus on more valuable functionality for users who want to
push their research forward faster.
Since we have been asked this question often: Digital Science is not a publisher
and is not in the best position to contribute citation data to 140C - we believe
this should come from publishers themselves. From the Dimensions team,
both Altmetric and Figshare are members of the initiative.
18 Dimensions ReportKey statistics on the Dimensions publication and citation data
The following key statistics were captured on Jan 1, 2018 and are changing on
a weekly basis - this means that the values in this document can vary from the
actual results in the Dimensions application or API.
No. publication records 89,428,659
Number of journals covered More than 50,000
Number of citations between publication records Appr. 873,000,000
Links between publications and research Appr. 115,000,000
organizations
Links between publications and grants 7,901,524
Links between publications and funders 32,259,074
Links between publications and researchers Appr. 240,000,000
Links between publications and patents 9,315,246
Links between publications and clinical trials 129,404
Distribution of publications across disciplines
■ Mathematical Sciences
■ Physical Sciences
■ Chemical Sciences
■ Earth Sciences
■ Environmental Sciences
■ Biological Sciences
■ Agricultural and Veterinary Sciences
■ Information and Computing Sciences
■ Engineering
■ Technology
■ Medical and Health Sciences
■ Built Environment and Design
■ Education
■ Economics
■ Commerce, Management, Tourism and Services
■ Studies In Human Society
■ Psychology and Cognitive Sciences
■ Law and Legal Studies
■ Studies In Creative Arts and Writing
■ Language, Co mmunication and Culture
■ History and Archaeology
■ Philosophy and Religious Studies
Distribution across publisher
■ Other
■ Elsevier
■ Springer Nature
■ Wiley
■ IEEE
■ Taylor & Francis
■ Other
■ Sage Publications
■ Cambridge University Press
■ Wolters Kluwer
■ Other
■ Springer Nature
■ DeGruyter
■ Oxford University Press
■ Royal Society of Chemistry
Dimensions Report 19Clinical Trials - Research
Result en Route to
Clinical Application
Clinical trials, To be clear about definitions: A clinical trial is 'any research study that
prospectively assigns human participants or groups of humans to one or more
aggregated from health-related interventions to evaluate the effects on health outcomes'.
different registries
Interventions include, but are not restricted to drugs, cells and other biological
products, surgical procedures, radiological procedures, devices, behavioural
treatments, process-of-care changes, preventive care, etc. (Source: WHO)
Dimensions provides a single point of access to multiple clinical trial registries.
As of January 2018 we have integrated eight registries:
•C
linicalTrials.gov,
• t he EU Clinical Trials Register (EU-CTR),
• t he Japanese UMIN Clinical Trials Registry (UMIN-CTR),
• t he ISRCTN registry,
• t he Australian New Zealand Clinical Trials Registry (ANZCTR),
• t he Chinese Clinical Trial Registry (CHICTR),
• t he Netherlands Trial Register (NTR),
•T
he German Clinical Trials Register (GTRS)
More will follow in the future. We integrate and map all relevant source data
into Dimensions’ coherent data model with filters, for e.g. research categories,
research organizations or years, applicable across content types.
Key statistics on the Dimensions publication and citation data
The following key statistics were captured on Jan 1, 2018 and are changing on
a weekly basis - this means that the values in this document can vary from the
actual results in the Dimensions application or API.
No. clinical trial records 380,963
Number of countries and clinical trials 174
Links between clinical trials and research Appr. 380,000
organizations
Links between clinical trials and funders 43,061
Links between clinical trials and researchers Appr. 477,000
20 Dimensions ReportDistribution of publications across disciplines (based on the Health
Research Classification System (HRCS) from the UK
■ Cancer
■ Cardiovascular
■ Metabolic and Endocrine
■ Infection
■ Mental Health
■ Oral and Gastrointestinal
■ Musculoskeletal
■ Neurological
■ Respiratory
■ Reproductive Health and Childbirth
■ Stroke
■ Inflammatory and Immune System
■ Renal and Urogenital
■ Eye
■ Generic Health Relevance
■ Skin
■ Other
Geographical distribution of clinical trials
■ United States
■ Japan
■ United Kingdom
■ China
■ Germany
■ France
■ Netherlands
■ Canada
■ Australia
■ Switzerland
■ Italy
■ Sweden
■ Denmark
■ Belgium
■ Brazil
■ South Korea
■ Spain
■ Israel
■ Taiwan
Top 20 shown
Dimensions Report 21Patents - Research
Resulting in Practical and
Commercial Applications
Patent data - to show The patent data in Dimensions is provided by the Digital Science portfolio
company IFI Claims. We started with an initial tranche of patent offices for
the translation of the launch of Dimensions. We are now in the process of adding more, which
research activities into will appear in Dimensions during the course of 2018. The focus of the patent
the commercial space data in Dimensions is to provide a downstream view on how research funding
is impacting and enabling the commercial protection and potential use of
research results.
Current patent offices already covered in Dimensions:
•U
nited States Patent and Trademark Office (USPTO)
• E uropean Patent Office (EPO)
•W
orld Intellectual Property Organisation (WIPO)
•G
erman Patent and Trademark Office (DPMA)
•C
anadian Intellectual Property Office (CIPO)
• Intellectual Property India (IPI)
• Intellectual Property Office, UK (IPO)
•N
ational Industrial Property Institute, France (INPI)
• Intellectual Property Department, Hong Kong (IPD)
The number of links between publications and patents will significantly
increase in the first half of 2018, since the current count of 11.3M links is
based on PubMed publications only. We have have started the extraction
already and will integrate the results as quickly as possible.
Key statistics on the Dimensions patent data
The following key statistics were captured on Jan 1, 2018 and are changing on
a weekly basis - this means that the values in this document can vary from the
actual results in the Dimensions application or API.
No. of patent records 34,655,315
Links between patent records Appr. 230,000,000
Links between patents and research organizations 38,328,208
Links between patents and grants 171,648
Links between patents and funders 291,442
Links between patents and publications 11,271,205
22 Dimensions ReportGeographical distribution of assignees
■ United States
■ Japan
■ Germany
■ France
■ United Kingdom
■ South Korea
■ Switzerland
■ Netherlands
■ Sweden
■ Canada
■ China
■ Taiwan
■ Italy
■ Finland
■ Belgium
■ Australia
■ India
■ Denmark
■ Singapore
■ Austria
Thank You
Thank you for your interest in Dimensions. We look forward to
improving both the data and the tool in cooperation with you and the
research community.
Legal note: while we have tried to ensure the accuracy of this report, it is
subject to change and provided for information only on an "as is" basis, and
is not intended to form part of any legal contract. Any reference to a third
party in this report should not be considered as an endorsement by or of, or
indication of any association with, Dimensions or Digital Science.
Dimensions Report 23Notes 24 Dimensions Report
Dimensions Report 25
Part of the Digital Science portfolio

      digital-science.com
You can also read