Modeling of trees failure under windstorm in harvested Hyrcanian forests using machine learning techniques - Nature
←
→
Page content transcription
If your browser does not render page correctly, please read the page content below
www.nature.com/scientificreports
OPEN Modeling of trees failure
under windstorm in harvested
Hyrcanian forests using machine
learning techniques
Ali Jahani1* & Maryam Saffariha2
In managed forests, windstorm disturbances reduce the yield of timber by imposing the costs of
unscheduled clear-cutting or thinning operations. Hyrcanian forests are affected by permanent
winds, with more than 100 km/h which cause damage forest trees and in result of the tree harvesting
and gap creation in forest stands, many trees failure accidents happen annually. Using machine
learning approaches, we aimed to compare the multi-layer perceptron (MLP) neural network, radial
basis function neural network (RBFNN) and support vector machine (SVM) models for identifying
susceptible trees in windstorm disturbances. Therefore, we recorded 15 variables in 600 sample plots
which are divided into two categories: 1. Stand variables and 2.Tree variables. We developed the tree
failure model (TFM) by artificial intelligence techniques such as MLP, RBFNN, and SVM. The MLP
model represents the highest accuracy of target trees classification in training (100%), test (93.3%)
and all data sets (97.7%). The values of the mean of trees height, tree crown diameter, target tree
height are prioritized respectively as the most significant inputs which influence tree susceptibility
in windstorm disturbances. The results of MLP modeling defined TFMmlp as a comparative impact
assessment model in susceptible tree identification in Hyrcanian forests where the tree failure is
in result of the susceptibility of remained trees after wood harvesting. The TFMmlp is applicable in
Hyrcanian forest management planning for wood harvesting to decrease the rate of tree failure after
wood harvesting and a tree cutting plan could be modified based on designed environmental decision
support system tool to reduce the risk of trees failure in wind circulations.
Windstorm disturbances occur when sudden changes happen in wind loading and trees have not acclimatized to
new conditions of the site1 in thinned or adjacent to clear-cut stands. In managed forests, windstorms reduce the
yield of timber by imposing the costs of unscheduled clear-cutting or thinning o perations2. Windstorms cause
significant changes in forest management plans, climate c hange3 and carbon storage of forests4 especially in tem-
perate regions5. Therefore, we need to model the response of trees to wind pressure to achieve reliable prediction
and develop new strategies in forest management6. We believe that it is possible to develop mathematical models
to predict the role of wind in trees stability by discovering the response of trees to sudden windstorms. This
approach allows forest managers to predict the impact of forest activities or silvicultural plans on tree stability
in sudden windstorms. The modeling approach quantitatively describes the relationship between tree attributes
and tree susceptibility under windstorm tension. Recently, mechanistic models have been developed for forest
ecosystems where the natural phenomena are influencing forest s uccession7,8. These models are mainly based on
prooting1,9.
stand and tree characteristics, and aim to identify trees having potential for failure or u
The main advantages of artificial neural networks (ANNs) in comparison with classic logistic regression are
summarized in data analyzing which results in developing more accurate predictive m odels10. ANNs model the
structure of the human brain in data analysis and create a neural structure as the human brain analyses data in
parallel by several neurons. ANN is structured by a series of mathematical equations to simulate environmental
processes such as wind-susceptible tree identification. ANNs and machine learning techniques are some algo-
rithms that learn from samples and data without relying on rules-based system programming; while common
statistical modeling formulates the relationships between input and output variables in the form of mathematical
1
Research Center of Environment and Sustainable Development, College of Environment, Tehran,
Iran. 2Department of Rangeland Management, College of Natural Resources, University of Tehran, Tehran,
Iran. *email: Ajahani@ut.ac.ir
Scientific Reports | (2021) 11:1124 | https://doi.org/10.1038/s41598-020-80426-7 1
Vol.:(0123456789)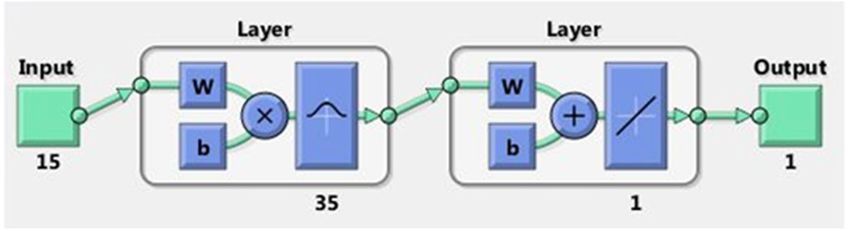
www.nature.com/scientificreports/
Figure 1. The location of study area and sample plots (QGIS 3.12.0, https://www.qgis.org/en/site/).
equations. ANNs have a variety of advantages, such as the ability to implicitly distinguish complicated nonlinear
relationships between inputs (independent variables) and outputs (dependent variables). ANNs also use multiple
training algorithms and rules and less formal statistical training. These methods have very distinctive potential
to determine all possible interactions between tree failure and ecological variables11. Considering that, ANN
methods resulted in a significant increase in prediction accuracy (approximately up to 80% of water discharge
studies) in comparison with multiple r egressions12.
The literature review reveals some advanced technologies which can predict the relationship between human
activities and ecological processes. For example, Jahani et al.13 determined MLP, RBF and SVM, as the most
accurate models in the ecological process modeling to predict vegetation density loss in response to the tourist
activities, based on the ecological conditions of national parks. Considering the lack of valid long term data
sets (noisy data) and a considerable number of variables, which influence tree failure, machine learning tech-
niques and artificial intelligence will be applicable in susceptibility assessment and modeling in many ecologi-
cal phenomena14–16. For example, J ahani11 developed SFHCM (Sycamore Failure Hazard Classification Model)
model for hazardous tree classification in urban green spaces using an artificial neural network technique.
SFHCM classifies the susceptibility of Sycamore trees under wind pressure in four classes of tree failure within
a year containing 1. Offshoots, 2. Branches, 3. Tree crown and 4. Whole tree failure. However, machine learning
techniques, such as Multi-Layer Perceptron (MLP), Radial Basis Function Neural Network (RBFNN) and Sup-
port Vector Machine (SVM) has been applied in many types of ecological researches (e.g. Jahani and S affariha17;
Hong et al.18). We aimed to compare the MLP, RBFNN and SVM models for prediction of tree failure in forest
ecosystems. The main objectives were to: (1) model tree failure potential in the windstorm of forest lands; (2)
compare different machine learning techniques to identify the most accurate model; (3) prioritize the model
inputs (tree and stand variables) using sensitivity analysis of the model; and (4) designing environmental deci-
sion support tool for wind-susceptible tree identification.
Materials and methods
Site selection. Hyrcanian temperate forests, dominated by old broadleaf trees, are located in the north of
Iran adjacent to the Caspian Sea. We selected the Neka Zalemroud forest in Mazandaran province as the study
area for this research (36° 26′ 09″ to 36° 30′ 47″ N latitude and 53° 20′ 34″ to 53° 31′ 51″ E longitude) as the
boundaries of sampling area have been illustrated in Fig. 1 by the authors. This forest has been covered with 2533
hectares of old broadleaf trees such as Fagus orientalis, Carpinus betulus, Quercus castanafolia, Acer velutinum,
Acer cappadocicum, Parrotia persica and some other species. This region is affected by permanent winds and the
maximum wind speed is in the range of 10 to > 30 m/s. The windstorms with more than 100 km/h cause damage
forest trees, including uprooting or stem breakage. The windstorms cause many tree failures annually, which is in
result of the tree harvesting and gap creation in forest stands. Hence, we aimed to identify the uprooted or stem
broken trees using the sample plots data after the windstorm with 100 km/h (4 h) on 21 March 2018.
Methods. Data from field measurement of 600 sample plots in the study area were summarized before and
after the windstorm in March 2018. ARC MAP 9.3 software was used to spatially locate the sample plots on the
Scientific Reports | (2021) 11:1124 | https://doi.org/10.1038/s41598-020-80426-7 2
Vol:.(1234567890)www.nature.com/scientificreports/
forest map. Also, the slope of plots was defined by topography map (1:50,000) in this software. The permanent
sample plots were created by Department of Natural Resources of Mazandaran Province (in the structure of
the forest management plan) as a part of government-sponsored “permanent sample plot” protocol to monitor
the changes in the number of trees and s pecies48. In this protocol, the centers of these sample plots are marked
with a metal rod and the geographical coordinates are recorded. The attributes of all trees in the sample plots
are recorded consisting of species, diameter at the breast height, tree’s height, number of trees, distance to the
center of the plot, crown diameter and land, soil and climate characteristics of the plot location. On average,
in each plot, there are about 10 to 20 trees with a diameter of more than 7 cm (marketable size), and using the
recorded data of the trees, it is possible to identify each tree in subsequent monitoring. As the protocol dictates,
preliminary data were recorded on the stage of creating plots by experts from the Provincial Department of
Natural Resources in 2 01649. After the windstorm on 21 March 2018, these plots were investigated by the authors
to find damaged and undamaged trees. The area of each sample plot was 1000 m2 and in the shape of the circle
with 17.84 m radius. These plots were investigated to record harmed trees which were uprooted or stem broken.
Sample plots are clustered into susceptible (with harmed trees) and unsusceptible (without harmed trees) plots.
We recorded the forest stand attributes, as well as tree attributes, which influence the likelihood of trees to be
damaged in windstorms. Therefore, we investigate the damaged and resistant trees in the plots within 1000 m 2
area. The stand variables were recorded in the plot area such as the mean of the trees’ height in the plot. Some
plots (306 plots) were determined where the damaged trees were observed and some others (294 plots) were
determined where the target tree in the middle of the plot was undisturbed. In a literature review, we found that
stand and tree characteristics influence wind-susceptibility of trees (such as tree diameter and height, spread
crown area, rooting system, soil type, stand density, topography, etc.1,3,19–21). Therefore, 15 variables in 600 sam-
ple plots were recorded that are divided into two categories: 1. Forest stand variables: Plot Slope (PS) (%), Soil
Depth (SD) in plot area (cm), trees Mean Diameter at the Breast Height (MDBH) at plot (cm), trees Mean Height
(MH) in plot (m), trees Density (De) in plot (Number of trees), trees Diversity (Di) in plot (Number of tree spe-
cies), Number of Thicker trees in diameter (than the target tree) (NTh), and Number of Taller trees (than the
target tree) (NTa).
2.Tree variables (bigger than marketable size): Tree Area (TA) (occupied area by the tree) ( m2), Tree Diameter
at the Breast Height (TDBH) (cm), Tree Height (TH) (m), Tree Crown Diameter (TCD) (m), Mean Distance from
Neighbor trees (MeDN) (m), Minimum Distance from Neighbor trees (MiDN) (m), and Maximum Distance
from Neighbor trees (MaDN) (m). Tree heights and some more data were recorded in permanent sample plots
before the windstorm. Therefore, we used the recorded data at the stage of creating plots, for damaged trees. In
fact, 10 to 20 trees are recorded in each plot and using the recorded data of the trees (species, diameter, distance
to the center of the plot, etc.) it is possible to identify target trees (damaged or undamaged) in subsequent moni-
toring. There are some other factors that influence wind-susceptibility of trees such as forest edge, tree diversity,
and land form. In this research, we were looking for the impact of forest plan activities on tree failure; therefore,
we neutralized forest edge effects by selecting sample plots inside the forest stands which are far from the forest
edges. In land form variables, land slope was considered in stand variables, but altitude and geographical aspect
of the hill, as well as tree diversity, were omitted because of limited variation in the samples.
Tree Failure Model (TFM) was developed by recording 15 variables of the trees and forest stands in 600
selected sample plots. In fact, we designed three TFMs with three modeling techniques to achieve the most
accurate one based on model accuracy assessment. The damaged trees in the plots were identified by two fea-
tures: (1) The tree was uprooted by wind forces along the windstorm. (2) The tree was uprooted or stem broken.
Leaning trees (under windstorm force) were also counted as uprooted trees. The damaged tree was chosen as
the target tree in susceptible plots (plots with a damaged tree). Also, the central tree was selected as the target
tree in the wind-unsusceptible plots (plots without damaged tree). Indeed, the output of TFM will be in two
classes of damaged trees (1) and stable trees (0). Hence, the response or output of the model will be a discrete
class {0,1}. The accuracy of the model is assessed by confusion matrices which detect the number of accurate
and false classifications of sample trees.
The new mathematical modeling approaches and machine learning techniques are needed to cover limita-
tion in data collection and forest inventories. Indeed, ANNs are over 50 years old, but just not often applied
yet. History of ANN development represents this fact that learning algorithms and structure of neural net-
works are developed every year. Therefore, we developed artificial intelligence techniques in natural phenomena
modeling11,17 namely MLP, RBFNN, and SVM.
Machine learning techniques rely on a specific concept that is "a set of weak learners develop a single strong
learner" (by Freund and Schapire22, Breiman23 and Breiman et al.24). As it is known, a weak learner is a classifier
correlating slightly with the real (target) classification; while a strong learner is well correlated with real (target)
classification. Machine learning algorithms are trying to combine weak classification rules in a one strong clas-
sification rule. Based on this approach, we used 15 variables (even if we believe that these variables are not related
to tree susceptibility in the wind) and tested some algorithms and variable weights to make weak learners or rules
and combining them into one strong rule in the structure of three machine learning techniques.
Multi‑layer perceptron (MLP) neural network. ANNs use different methods, such as feed-forward,
backward, recurrent and other, to teach the network for output prediction. MLP is a multi-layer form of Feed-
forward neural networks without any cycle or loop. In Feed-forward neural networks, the information analysis is
performed in one direction from the input layer, through the hidden layer to the output layer47. In this learning
method, the errors of the network propagate from the output layer to inputs to revise the weights of input vari-
ables. MLP is a multi-layer Artificial Neural Network (ANN) model with self-learning mechanism which uses
samples for classification. Indeed, MLP has been using some interconnected processing elements that are called
Scientific Reports | (2021) 11:1124 | https://doi.org/10.1038/s41598-020-80426-7 3
Vol.:(0123456789)www.nature.com/scientificreports/
PEs (Processing Elements). MLP learns by using samples and transfer functions which are applied between neu-
rons and hidden layers in a computer program17. In the training process, each PE receives signals periodically
from other PEs and sends the new signal to other processors. Considering inputs, MLP adjusts the weights of
neurons continuously, and the learning process is completed.
We used some activation functions (such as logarithmic sigmoid, hyperbolic tangent, and linear transfer
functions) which determine the relation between inputs and outputs and these functions were tested to achieve
the best performance of MLP. Back Propagation (BP) method propagates the error of outputs to the input layer
where the first random weights have been assigned. The weights of the network inputs will be justified until the
best performance of the network is reached; and after that, the learning process will be c ompleted7,11. Errors
between Ynet (MLP output) and Y (real class of tree failure) are decreased by BP when the weight of neurons or
Processing Elements (PEs) (w) and input variables (x) come to the best performance, and the output of jth PE
on the kth layer (PEkj) will be achieved by Eq. (1):
n
netjk = wji xji (1)
i=0
Transfer functions are used in the structure of network, and neuron output value is determined by (Eq. 2).
Ynet = ∫ netj (2)
Finally, weights of t samples will be adjusted by delta rule which has been summarized in Eq. (3).
wjit = wjit−1 + wjit (3)
By using the ANN function in MATLAB R2013b, 360 uniformly distributed random samples (60% of 600
samples) were defined as training data set. 120 evenly distributed random samples (20% of 600 samples) were
defined as validation data set, and 120 samples (20% of 600 samples) were determined as test data set. All data
were normalized to the interval of 0 to 1 using the Min–Max technique by mapminmax function in MATLAB
R2013b (Refer to Demuth and Beale25 for MATLAB codes for MLP neural network development and related
preprocessing algorithms).
Radial basis function neural network (RBFNN). Radial basis function neural network is architectur-
ally similar to the MLP with different activation function in the hidden layer. RBFNNs have been used in func-
tion approximation and classification in researches of the last d ecade13,26–28. RBFNN uses samples in two data
sets of training and test. The radial function is applied in each neuron of the hidden layer; and the number of
neurons depends on input matrix of variables. Considering two classes of trees failure (0 and 1) in this research,
we have two output layers in the structure of RBFNN. Gaussian function is the most frequently used function
BFNN13,27. The Gaussian function can find the center of circular classifiers successfully.
in the hidden layers of R
The Gaussian function regulates the centre of mentioned circular classifiers by Eq. (4).
||x − aj ||2
Rj (x) = exp (4)
2σ 2
j(x),
In Eq. (4), input variables are structured in the matrix "x", radial basis function has been defined as R
centre of RBF function is presented as aj, and we have a positive real number as "ϭ". The outputs of network will
be calculated by an output function Eq. (5).
m
yk = wjk Rj (x) + bj (5)
j=1
In Eq. (5), the number of calculation nodes in the structure of hidden layers (j), the number of neurons (m),
the weights of neurons (wik), and a bias value (bj) have been used to calculate output (yk).
Neuron weights (wjk) are updated continuously to decrease output errors until network training process
comes to end. Network performance is calculated when the number of neurons and the weights of neuron or
xed13. (Refer to Demuth and B
layers are fi eale25 for MATLAB codes for RBF neural network development and
related preprocessing algorithms).
Support vector machine (SVM). SVM is one of the machine learning techniques that requires quite a lot
of data for training, but this method also provides more accurate results than other methods when the volume of
training data is limited29,30. Therefore, SVM has been used for modeling in this paper to deal with this issue with
the collected data along forest inventory.
As a classifier technique, SVM aims to determine the largest margin in decision boundaries that could
separate classes of d ecision31. SVM is looking for the largest margin in the boundaries of classification when the
uncertainties in the decision are e xpected27. This method of prediction minimizes the probability of over-fitting
in classes limits of tree failure.
We have two datasets of training and test in the structure of SVM. The values of target are structured in a
n-dimensional matrix so it is possible to find the most accurate boundaries and margins. Equation (6) is the
Scientific Reports | (2021) 11:1124 | https://doi.org/10.1038/s41598-020-80426-7 4
Vol:.(1234567890)www.nature.com/scientificreports/
SVM model and equation parameters define: y(x) = SVM output, α_i = a multiplier, K = kernel function, and
b = threshold parameter.
n
y(x) = αi K xi , xj + b (6)
i=1
Then we defined Gaussian Radial Basis Function (RBF) in Eq. (7), in the context of non-linear SVM. As we
know, RBF is the most popular function in the context of SVM with remarkable ability to control generalization
of SVM classifier.
K xi , xj = exp −γ �xi − xj �2 (7)
The parameters of Eq. (7) are: xi and xj = samples and γ = kernel parameter.
Finally, primal problem in Eq. (8) should be minimized to achieve the most accurate SVM for tree failure
prediction.
n
1
�w�2 + C ξi (8)
2
i=1
In Eq. (8), the parameters are: 1/2||w||2 = the margin, Σξi = training errors and C = the tuning parameter.
SVM uses samples in two data sets of training and test. The classes of the target will be summarized in a
n-dimensional matrix to determine the nearest classification boundaries and margins. (Refer to Demuth and
Beale25 for MATLAB codes for SVM neural network development and related preprocessing algorithms).
Model selection. MLP, RBFNN, and SVM models were run on the training dataset with 15 tree variables
as inputs and tree failure classes in 600 selected trees as output. To evaluate prediction accuracy of the MLP,
RBFNN, and SVM models, we used the confusion matrix to determine the percentage of accuracy in target tree
etected11.
classification. Also, the number of trees with accurate and failed classification will be d
Sensitivity analysis. Sensitivity analysis was designed to prioritize the most accurate model variables with
respect to the significance of variables in output. Sensitivity analysis defines the usefulness of variables in model
predictions. In sensitivity analysis, we changed each variable in the range of standard deviation with 50 steps
while the other variables were fixed at the value of the average. Then, the standard deviation of outputs for each
variable changes was measured as model sensitivity for that variable. Variables with high value in the outputs
standard deviation are the most important variables with more influence on model outputs. The trend of model
output changes with changing the most significant variables, in the range of standard deviation (50 steps) was
illustrated in some figures to find out the way that model outputs are changing with variable changes (negatively
or positively) (Refer to Kalantary et al.27 and Jahani et al.13.
Environmental decision support system (EDSS) tool. Finally a user friendly GUI (Graphical User
Interface) tool was designed as an EDSS for susceptible tree identification in windstorms. It is applicable for
forest managers who are looking for hazardous trees to plan for tree protection and increase the forest stands
resistant against windstorms. ANN models use a huge matrix of weights; so model execution should be in the
mathematical software (in this research MATLAB R2013b). Users, who are not familiar with the software, need
a simple tool to run the model on new samples and get the results of prediction. To design EDSS tool, we devel-
oped a GUI extension in MATLAB R2013b software. With this tool, users enter the values of trees and stands
variables (based on forest inventory data in other target forests) and the susceptible trees will be identified only
by pushing a button. The model will be run on the data and the model outputs for each tree will be appeared in
a table (0 or 1).
Results
Totally 306 damaged trees (306 sample plots) were identified in this study. On the other hand, 294 plots did not
contain the damaged tree; so the central tree in the plot was recorded as stable tree. The recorded variables of
the tree and stand, which have been used as model variables, are illustrated in Table 1. Indeed, the minimum,
mean and maximum of model variables define the limits of model validity in practice.
In this paper, the accuracy of three predictive models, namely MLP, RBFNN, and SVM, in tree susceptibility
assessment and prediction, was tested. The most accurate model discovers tree and forest stand attributes which
result in a greater chance of tree failure. Sensitivity analysis of the best model aims to find out which parameters
and how influence the chance of tree failure in windstorm events.
Prediction performance of MLP. The number of neurons and hidden layers, activation function, and
training method may lead to different MLP prediction performances (Table 2). The best MLP structures, its’
accuracies and training functions have been reported in Table 2. Considering the accuracy of classification in
training and test data sets (Table 2), the most successful training function is SCG and the topology of MLP is
(15-27-1) which means that 15 variables as inputs, 27 neurons in hidden layer, and one neuron (failure class) in
output layer. The tangent hyperbolic transfer function was detected as the best estimation function in hidden
and output layers.
Scientific Reports | (2021) 11:1124 | https://doi.org/10.1038/s41598-020-80426-7 5
Vol.:(0123456789)www.nature.com/scientificreports/
Stand variables Mean ± Standard error Min Max Tree variables Mean ± Standard error Min Max
Plot slope (%) 10.79 ± 0.22 1 30 Tree Area (m2) 171.93 ± 2.18 61 295
Soil Depth (cm) 28.47 ± 0.44 10 50 Tree Diameter at the Breast Height (cm) 95.82 ± 0.84 35 142
Trees Mean Diameter at Breast Height (cm) 31.42 ± 0.26 15 50 Tree Height (m) 25.89 ± 0.07 19 32
Trees Mean Height (m) 19.3 ± 0.14 11 28 Tree Crown Diameter (m) 10.34 ± 0.08 5 16
Trees Density (N) 12.42 ± 0.11 5 19 Mean Distance from Neighbor Trees (m) 7.72 ± 0.05 4.5 9.9
Trees Diversity (N) 2.48 ± 0.03 1 4 Minimum Distance from Neighbor Trees (m) 4.44 ± 0.05 1.5 6.8
Number of Thicker Trees in diameter than the
1.63 ± 0.04 0 5 Maximum Distance from Neighbor Trees(m) 14.01 ± 0.04 11.5 15.8
target tree (N)
Number of Taller Trees (N) 1.52 ± 0.03 0 5
Table 1. Statistical data of tree and stand variables.
Test set Training Data
Activation function Training function Structure Accuracy (%) Accuracy (%)
Tanh-Tanh Scaled conjugate gradient (SCG) 15–27-1 MLP 93.3 100
Spread Neurons Structure Test set Training Data
495 35 RBFNN 90.6 94.8
C γ Structure Test set Training Data
200 24 SVM 93.4 97.9
Table 2. The results of parameters tuning in MLP, RBFNN and SVM structure.
Figure 2. The confusion matrix of MLP neural network.
Considering the confusion matrix in Fig. 2, we find remarkable accuracy of classification in MLP model for
three data sets of training, validation, and test. The designed model resulted in 100% successful in tree failure
classification in the training data set. The accuracy of classification was 95% in the validation data set, 93.3% in
the test data set, and 97.7% in the all data sets. MLP failed six samples of 120 samples in the validation data set,
eight samples of 120 samples in the test data set, and 14 samples of 600 samples in the all data set.
Scientific Reports | (2021) 11:1124 | https://doi.org/10.1038/s41598-020-80426-7 6
Vol:.(1234567890)www.nature.com/scientificreports/
Figure 3. The best structure of RBFNN model (MATLAB R2013b, http://www.mathworks.com).
Figure 4. The confusion matrix of RBFNN neural network.
Prediction performance of RBFNN. RBFNN has been designed with a feed-forward structure, input
layer, a single hidden layer with Gaussian transfer function and an output layer. RBF neural network minimizes
the error of prediction by using a variety of parameters which include: the number of neurons, spreads of radial
basis functions, and mean squared error goal. In this research, RBFNN parameters were defined to minimize
the error of prediction: the number of neurons = 5–250, the spread of radial basis functions = 15–600 and Mean
squared error goal = 0. The best results of RBFNN have been represented in Table 2.
Considering the accuracy of classification in training and test data sets (Table 2), the most successful topol-
ogy of RBFNN is presented in Fig. 3. The optimized RBFNN has been structured with 15 variables as inputs, 35
neurons in hidden layer with Gaussian transfer function, and one neuron (tree failure class) in output layer with
a linear transfer function. The optimized RBFNN is illustrated at Fig. 3 in MATLAB R2013b software.
Considering the confusion matrix in Fig. 4, we find the accuracy of classification in RBFNN model for two
data sets of training and test. The designed model resulted in 94.8% successful in tree failure classification in the
training data set. The accuracy of classification was 90.6% in the test data set and 94% in the all data sets. RBFNN
failed 25 samples of 480 samples in the training data set, 11 samples of 120 samples in the test data set, and 36
samples of 600 samples in the all data set.
Prediction performance of SVM. SVM requires parameter tuning to perform with high accuracy in the
best configuration. Indeed, SVM uses some predefined functions, called kernels. The kernel structure drives data
into a multi-dimensional space. SVM with Gaussian RBF function combines bell-shaped curves at support vec-
tors. The bell-shaped curves have a particular width which inversely depends on the value of γ.
We use the C parameter to the regular simplicity of curves. Indeed, as the value of the C parameter is
increased, the classification curve is more intricate. In the RBF function in SVM structure, parameter gamma
(γ) is used to modify the system variance and the smoothness of classification boundaries. Table 2 represents
prediction accuracies for various SVM parameters of the training and test data.
Considering the accuracy of classification in training and test data sets (Table 2), the value of the most accurate
parameter is C = 200 and γ = 24. Considering the confusion matrix in Fig. 5, we find the accuracy of classification
in the SVM model for two data sets of training and test. The designed model resulted in 97.9% successful in tree
failure classification in the training data set. The accuracy of classification was 93.4% in the test data set and 97%
in the all data sets. SVM failed 10 samples of 480 samples in the training data set, eight samples of 120 samples
in the test data set, and 18 samples of 600 samples in the all data set.
Considering the results of modeling in Fig. 6, the MLP model is defined as the most accurate model in
susceptible tree identification in wind disturbances of forest. Comparing to RBFNN and SVM, the MLP model
represents the highest accuracy of target tree classification in data sets. Therefore, TFMMLP (TFM that uses MLP
technique) was detected as the most accurate TFM for target tree identification. After randomizing data, we
separated training and test data sets so that the same training and test samples were applied for three modeling
techniques. Indeed, MLP achieved more accurate results by assigning 20% of all samples for validation during
the training process.
Scientific Reports | (2021) 11:1124 | https://doi.org/10.1038/s41598-020-80426-7 7
Vol.:(0123456789)www.nature.com/scientificreports/
Figure 5. The confusion matrix of SVM neural network.
Figure 6. The performance of the designed TFMs for susceptible trees identification.
Figure 7. The impact value (0 to 1) of input variables on the tree failure model outputs in sensitivity analysis
of model (trees Mean Height (MH), trees Density (De), Tree Crown Diameter (TCD), Tree Height (TH),
Minimum Distance from Neighbor trees (MiDN), Number of Thicker trees (than the target tree) (NTh), Mean
Distance from Neighbor trees (MeDN), Tree Area (TA), Soil Depth (SD), trees Mean Diameter at the Breast
Height (MDBH), Maximum Distance from Neighbor trees (MaDN), Tree Diameter at the Breast Height
(TDBH), Number of Taller trees (NTa), trees Diversity (Di) and Plot Slope (PS)).
Sensitivity analysis of TFMmlp. We performed a sensitivity analysis on the outputs of the optimal TFMmlp
model. In Fig. 7, the share of each input variable on model output has been detected by sensitivity analysis. The
sensitivity value is the standard deviation of model output changes in response to each variable changes. Consid-
ering to the classes of targets, model outputs will be appeared in two classes of 0 and 1. According to the results
of sensitivity analysis, the variables of ’the mean of trees height’ (0.46) and ’the number of trees (stand density) in
plots’ (0.44), ’tree crown diameter’ (0.43) and ’tree height’ (0.42) are prioritized respectively as the most signifi-
cant inputs which influence tree susceptibility in the windstorm (Fig. 7). Indeed, ’the mean of tree’s height’ and
’the number of trees (stand density)’ are the most influential forest stand factors which increase the chance of
tree failure in windstorm events. On the other hand, some tree characteristics increase the vulnerability of trees
in windstorms which are ’tree crown diameter’ and ’tree height’.
Scientific Reports | (2021) 11:1124 | https://doi.org/10.1038/s41598-020-80426-7 8
Vol:.(1234567890)www.nature.com/scientificreports/
Figure 8. The trend of TFMMLP Output changes with varying the most significant variables.
Considering trends in Fig. 8a,b, ’the mean of stand trees height’ and ’stand density’ in forest, are negatively
correlated to tree susceptibility in the windstorm; so in forest stands where the mean of tree’s height and the
number of trees (stand density) increase, the probability of trees failure reduces. Indeed, trees in dense forest
stands with taller species are less vulnerable in windstorms. Considering trends in Fig. 8a,b, ’tree crown diameter’
and ’tree height’ in forest, are positively correlated to tree susceptibility in the windstorm so taller trees with high
crown dimensions have a remarkable potential to be damaged in the windstorm.
TFMmlp provides a new tool as a decision support system for forest stands management to reduce the number
of damaged trees in wind disturbances. The sensitivity analysis prioritizes ’the mean of trees’ height’, ’the number
of trees (stand density) in plots’, ’tree crown diameter’ and ’tree height’ variables as the most significant charac-
teristics of forest trees and stands which influence trees stability in windstorms. These results could be used in
forest management and silvicultural methods in respect to the trends.
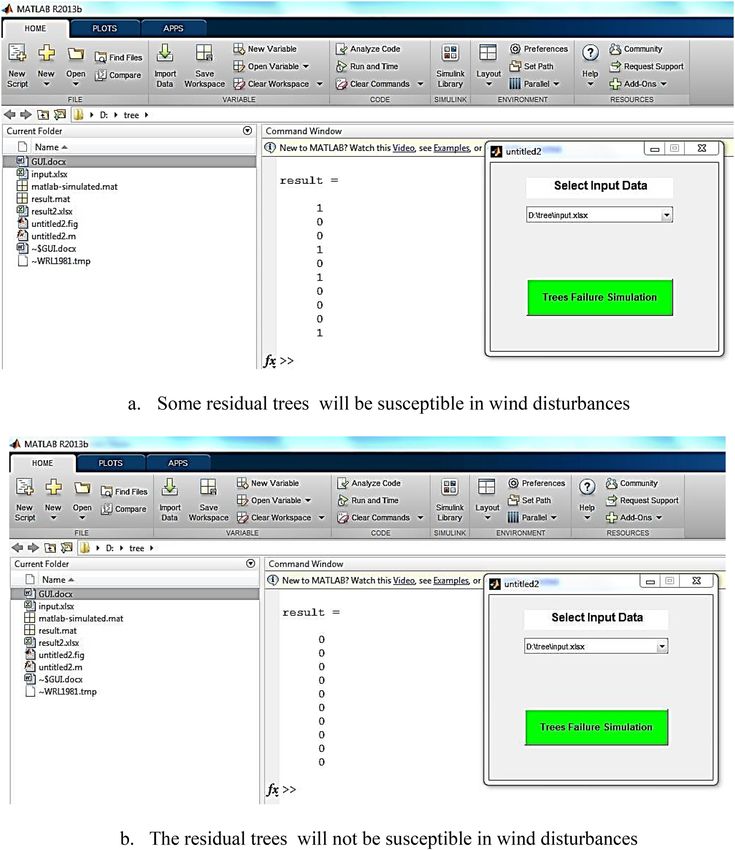
Finally, a graphical user interface (GUI) was designed to run TFM model on new data when the forest
managers are planning for tree cutting. Indeed, after tree harvesting, the characteristics of residual trees and
forest stand will be changed. The changes are detectable before harvesting plan implementation by the designed
EDSS tool. It means that changes on the tree and stand characteristics are measurable before the implementa-
tion of harvesting plan. The forest manager can easily predict the possibility of tree’s failure in the windstorm.
GUI as an EDSS tool, will be run on new data just by pushing "Tree Failure Simulation" button in Fig. 9. As an
example, Fig. 9 illustrates the results of two different tree harvesting plan on ten residual trees. We found four
susceptible trees in the plan "a". Therefore, we modified the harvesting plan "a" to plan "b" (changing selected
trees for harvesting) and as a result, the trees will be stable in future windstorms. The modification is conducted
by changing the most significant factors in sensitivity analysis results and the trends in Fig. 8 (using changes in
selected trees for harvesting).
Discussion
In temperate ecosystems, such as studied Hyrcanian forests, regular and permanent storm damage the environ-
ment heavily every y ear5,32. In this research, we have attempted to determine the accuracy of machine learning
approaches, namely MLP, RBFNN and SVM in susceptible tree classification. Quantitative models such as regres-
sion and ANN were recently developed to model wind throw damage and trees f ailure11,33–36. The most popular
empirical approaches use individual tree variables as predictors to develop wind damage m odels37,38. With the
aim of models comparison, we developed TFMMLP with 15 trees and stand variables as predictors. In related
researches, tree and stand variables have been used for windstorm disturbance modeling, for instance, the model
Forest-GALES uses rooting depth and soil type as explanatory variables of regression models that determine tree
resistance to be uprooted39. The results of our research indicate that the MLP as an ANN modeling approach
can very successfully identify wind-susceptible trees during a storm with an accuracy of up to 93.3%. In this
paper, we claimed to develop an accurate prediction model to identify the susceptible trees in the windstorm.
As the results show, the MLP model identified the susceptible trees in 93.3% of tree samples (120 trees) truly. We
Scientific Reports | (2021) 11:1124 | https://doi.org/10.1038/s41598-020-80426-7 9
Vol.:(0123456789)www.nature.com/scientificreports/
Figure 9. A snapshot of the Graphical User Interface of the Decision Tool for two cases with different plot
characteristics (including trees Mean Height (MH), trees Density (De), Tree Crown Diameter (TCD), Tree
Height (TH), Minimum Distance from Neighbor trees (MiDN), Number of Thicker trees (than the target tree)
(NTh), Mean Distance from Neighbor trees (MeDN), Tree Area (TA), Soil Depth (SD), trees Mean Diameter
at the Breast Height (MDBH), Maximum Distance from Neighbor trees (MaDN), Tree Diameter at the Breast
Height (TDBH), Number of Taller trees (NTa), trees Diversity (Di) and Plot Slope (PS)).
believe that this accuracy is acceptable, but future researches can develop more accurate models with consider-
ing the other variables of forest stands such as forest edge trees or forest harvesting methods. The reliable results
of ANN modeling in tree failure hazard classification have been proved in previous researches, for example
Jahani40 classified the risk of tree failure in an urban area by SFHR (Sycamore Failure Hazard Risk) model with
MLP technique (two classes of tree failure in one and two next years). The results of MLP modeling, especially
its remarkable accuracy (97.7%) in comparison with RBFNN (94%), and SVM (97%) results detected TFMmlp
as a comparative impact assessment model in susceptible tree identification. It’s a rather good idea to have such
models to lead into a (sustainable) policy question, and direct legal decisions and questions. Hanewinkel et al.14
and Jahani41 found that ANN model could identify damaged trees better than the logistic regression models.
The authors believe that the prediction of tree failure, in natural conditions of the site, depends on many tree
Scientific Reports | (2021) 11:1124 | https://doi.org/10.1038/s41598-020-80426-7 10
Vol:.(1234567890)www.nature.com/scientificreports/
attributes. However, we have limited the studied factors on some plot and tree characteristics. The nominated
trees for protection plan would be identified by these factors in studied forest, but the readers should consider
the limitation of this research in the application of the model. Indeed, the MLP model would be the first choice
in susceptible tree identification modeling under windstorms.
Jahani11 designed SFHCM as an environmental decision support system (EDSS) by ANN for tree hazard
classification in an urban green space area when the ANN model output is affected by the root damages and the
degree of leaning trees. But Hart et al.19 indicated that the removal of tree variables such as tree height and tree
diameter at breast height in the sensitivity analysis did not have an adverse effect on ANN or regression model
performance. On the other hand, they believe that ANN is sensitive to the removal of stand variables (gap size,
stand mean diameter at breast height, stand mean height and stand density) and the model performs best when
stand variables are available. The results of our research demonstrate that tree and stand variables play the same
role in the TFMmlp model outputs so that ’mean of trees height’ and ’tree density’ variables are negatively, and
’tree crown diameter’ and ’tree height’ are positively correlated with the susceptibility of trees in the windstorm.
However using other factors such as forest edge, land form and tree diversity that are neglected in this research,
could be help to improve the accuracy of models.
The developed EDSS tool, such as other proposed EDSS tools for ANN models (Refer to Jahani et al.17,42
and Kalantary et al.52), is applicable in forest lands where the forest inventory data has been prepared. The new
data will be based on forest inventory sample plots and forest managers use these sample plots data to identify
susceptible trees for wind-damage. However, forest managers need forest inventory data and maybe the main
TFMmlp application would be in protected forest or where the forests are facing windstorms more frequently.
Conclusions
Such as other prediction models in forests43–46,50,51, TFMmlp was developed for forest managers to assess quickly
the impact of cutting trees or thinning stands on tree failure risk in forest. Such as an early warning s ystem53,54,
TFMmlp would allow simulations of management approaches on the windstorm damage risk. T FMmlp requires
extensive data sets of actual wind-damage for its development and could be applied to other forests if the new
region conditions are comprehensively covered within T FMmlp training data set. However, T FMmlp could be
retrained with new accuracy in any regions that have specific different conditions. The output of model pre-
dictions is applied in forest management planning for wood harvesting; especially when the tree cutting plan
could be modified based on the designed EDSS tool outputs to reduce the risk of tree’s failure in forest wind
circulations. The results revealed that MLP was the most accurate technique in susceptible tree identification
in windstorm disturbance and the mean of trees’ height and density, tree crown diameter and tree’s height are
respectively the most significant variables which influence tree susceptibility and should be considered in forest
activities and tree harvesting.
Data availability
The datasets generated during and/or analysed during the current study are available in the Github and GOOGLE
DRIVE repository, Data in Github: https://github.com/ajahaniajahani/wind-paper-raw-data. Codes in Github:
https://github.com/ajahaniajahani/Wind-paper-data. Data in Google drive: https://docs.google.com/spreadshee
ts/d/1Rorvh LZ_l9j2C- Aw012y pEc3D
rwdGt XInVt vnZu8 3mw/edit?usp=sharin g. Codes in Google drive: https: //
drive.google.com/file/d/1iJak5vqiyOoU6190GVxEJt8knWmQtPMg/view?usp=sharing. Also, all data generated
or analysed during this study are included in this published article (and its Supplementary Information files).
Received: 2 October 2019; Accepted: 21 December 2020
References
1. Gardiner, B., Peltola, H. & Kellomaki, S. Comparison of two models for predicting the critical wind speeds required to damage
coniferous trees. J. Ecol. Mod. 129, 1–23 (2000).
2. Zeng, H., Pukkala, T. & Peltola, H. The use of heuristic optimization in risk management of wind damage in forest planning. For.
Ecol. Manag. 241, 189–199 (2007).
3. Seidl, R., Schelhaas, M. & Lexer, M. Unraveling the drivers of intensifying forest disturbance regimes in Europe. Global Change
Biol. 17, 2842–2852 (2011).
4. Seidl, R., Schelhaas, M., Rammer, W. & Verkerk, P. Increasing forestdisturbances in Europe and their impact on carbon storage.
Nat. Clim. Change 4, 806–810 (2014).
5. Hanewinkel, M., Breidenbach, J., Neeff, T. & Hanewinkel, E. K. M. Seventy-seven years of natural disturbances in a mountain for-
est area - The influence of storm, snow, and insect damage analysed with a long-term time series. Can. J. For. Res. 38, 2249–2261
(2008).
6. Lindner, M., Maroschek, M. & Netherer, S. Climate change impacts, adaptive capacity, and vulnerability of European forest eco-
systems. For. Ecol. Manag. 259, 698–709 (2010).
7. Jahani, A. Forest landscape aesthetic quality model (FLAQM): A comparative study on landscape modelling using regression
analysis and artificial neural networks. J. For. Sci. 65(2), 61–69 (2019).
8. Jahani, A. & Mohammadi Fazel, A. Aesthetic quality modeling of landscape in urban green space using artificial neural network.
J. For. Wood Prod. (JFWP) 69(4), 951–963 (2017).
9. Ancelin, P., Courbaud, B. & Fourcaud, T. Development of an individual tree-based mechanical model to predict wind damage
within forest stands. For. Ecol. Manag. 203, 101–121 (2004).
10. Tu, J. V. Advantages and disadvantages of using artificial neural networks versus logistic regression for predicting medical outcomes.
J. Clin. Epidemid. 49(11), 1225–1231 (1996).
11. Jahani, A. Sycamore failure hazard classification model (SFHCM): an environmental decision support system (EDSS) in urban
green spaces. Int. J. Environ. Sci. Technol. 16, 955–964 (2019).
12. Tsakiri, K., Marsellos, A. & Kapetanakis, S. Artificial neural network and multiple linear regression for flood prediction in Mohawk
River New York. Water 10(1158), 1–20 (2018).
Scientific Reports | (2021) 11:1124 | https://doi.org/10.1038/s41598-020-80426-7 11
Vol.:(0123456789)www.nature.com/scientificreports/
13. Jahani, A., Goshtasb, H. & Saffariha, M. Tourism impact assessment modeling in vegetation density of protected areas using data
mining techniques. J. Land Degrad. Dev. 31(12), 1502–1519 (2020).
14. Hanewinkel, M., Zhou, W. & Schill, C. A neural network approach to identify forest stands susceptible to wind damage. For. Ecol.
Manag. 196, 227–243 (2004).
15. Saffariha, M., Jahani, A. & Potter, D. Seed germination prediction of Salvia limbata under ecological stresses in protected areas:
an artificial intelligence modeling approach. BMC Ecol. https://doi.org/10.1186/s12898-020-00316-4 (2020).
16. Jahani, A. & Rayegani, B. Forest landscape visual quality evaluation using artificial intelligence techniques as a decision support
system. Stoch. Environ. Res. Risk Assess. 34(10), 1473–1486 (2020).
17. Jahani, A. & Saffariha, M. Aesthetic preference and mental restoration prediction in urban parks: an application of environmental
modeling approach. J. Urban For Urban Green. 54, 126775 (2020).
18. Hong, H. et al. Applying genetic algorithms to set the optimal combination of forest fire related variables and model forest fire
susceptibility based on data mining models. The case of Dayu County, China. Sci. Total Environ. 630, 1044–1056 (2018).
19. Hart, E. et al. Use of machine learning techniques to model wind damage to forests. Agric. For. Meterol. 265, 16–29 (2019).
20. Saffariha, M., Azarnivand, H. & Tavili, A. Effects of grazed exclosure on some of nutrient elements of aerial and underground
organs of Artemisia sieberi, Stipa hohenacheriana and Salsola rigida. Int. J. Agric. Res. 4(2), 62–70 (2014).
21. Saffariha, M., Azarnivand, H., Tavili, A. & Mohammadzadeh-Khani, H. Investigation effects of rangeland exclosure on some soil
properties in Artemisia sieberi, Stipa hohenacheriana and Salsola rigida habitats (case study: Roodshoor, Saveh, Iran). J. Biol.
Environ. Sci. 4, 195–204 (2014).
22. Freund, Y. & Schapire, R. E. A decision-theoretic generalization of on-line learning and an application to boosting. J. Comput. Syst.
Sci. 55(1), 119–139 (1997).
23. Breiman, L. Arcing classifiers discussion paper. Ann. Stat. 26(3), 801–824 (1998).
24. Breiman, L., Friedman, J., Stone, C. J. & Olshen, R. A. Classification and Regression Trees 1st edn, 368 (Chapman and Hall/CRC,
Boca Raton. , 1984).
25. Demuth, H. & Beale, M. Neural Network Toolbox For Use With MATLAB®. MathWorks, Inc. User’s Guide Version. 840 (2002).
26. Alexandridis, A. & Chondrodima, E. A. Medical diagnostic tool based on radial basis function classifiers and evolutionary simulated
annealing. J. Biomed. Inform. 49, 61–72 (2014).
27. Kalantary, S., Jahani, A., Pourbabaki, R. & Beigzadeh, Z. Application of ANN modeling techniques in the prediction of the diameter
of PCL/gelatin nanofibers in environmental and medical studies. J. RSC Adv. 9(43), 24858–24874 (2019).
28. He, Q. et al. Landslide spatial modelling using novel bivariate statistical based Naïve Bayes, RBF Classifier, and RBF Network
machine learning algorithms. Sci. Total Environ. 663, 1–15 (2019).
29. Chen, W., Hsu, S. & Shen, H. Application of SVM and ANN for intrusion detection. Comput. Oper. Res. 32(10), 2617–2634 (2005).
30. Wang, W., Shen, K., Yi, J. & Wang, Q. A mathematical model of crevice corrosion for buried pipeline with disbonded coatings
under cathodic protection. J. Loss Prev. Process Ind. 41, 270–281 (2016).
31. Tan, P. N., Steinbach, M. & Kumar, V. Introduction to Data Mining 1st edn, 356–358 (Addison-Wesley Longman Publishing Co.
Inc, Boston, 2005).
32. Javanmiri Pour, M., Jahani, A. & Marvi Mohadjer, M. R. Effects of livestock grazing on vegetation in relation to distance from
corral in Caspian forest north of Iran. Res. J. For. Environ. Prot. 1(1), 1–11 (2013).
33. Dobbertin, M. Influence of stand structure and site factors on wind damage comparing the storms Vivian and Lothar. For. Snow
Landsc. Res. 77, 187–205 (2002).
34. Lindemann, J. D. & Baker, W. L. Using GIS to analyse a severe forest blowdown in the Southern Rocky Mountains. Int. J. Geograph.
Inform. Sci. 16, 377–399 (2002).
35. Kupfer, J. A., Myers, A. T., McLane, S. E. & Melton, G. Patterns of forest damage in a southern Mississippi landscape caused by
hurricane Katrina. J. Ecosyst. 11, 45–60 (2008).
36. Jafari, M., Kalantary, S., Zendehdel, R. & Sarbakhsh, P. Feasibility of substituting ethylene with sulfur hexafluoride as a tracer gas
in hood performance test by ASHRAE-110-95 method. Int. J. Occup. Hyg. 6(1), 31–36 (2014).
37. Peterson, C. J. Within-stand variation in windthrow in southern boreal forests of Minnesota: is it predictable?. Can. J. For. Res. 34,
365–375 (2004).
38. Rich, R. L., Frelich, L. E. & Reich, P. B. Wind-throw mortality in the southern boreal forest: effects of species, diameter and stand
age. J. Ecol. 95, 1261–1273 (2007).
39. Gardiner, B. A. & Quine, C. P. Management of forests to reduce the risk of abiotic damage—a review with particular reference to
the effect of strong winds. For. Ecol. Manag. 135, 261–277 (2000).
40. Jahani, A. Sycamore failure hazard risk modeling in urban green space. Jahani A. Sycamore failure hazard risk modeling in urban
green space. J. Spat. Anal. Environ. Hazards 3(4), 35–48 (2017).
41. Jahani, A. Modeling of forest canopy density confusion in environmental assessment using artificial neural network. J. For. Pop.
Res. 24(2), 310–322 (2016).
42. Jahani, A., Makhdoum, F. M., Feghhi, J. & Omid, M. Environmental decision support systems (EDSSs): the study of concepts,
developments and challenges from past to present. J. Environ. Res. 7(13), 175–188 (2016).
43. Venäläinen, A. et al. Simulations of the influence of forest management on wind climate on a regional scale. Agric. For. Meteorol.
123, 149–158 (2004).
44. Mosaffaei, Z. et al. Soil texture and plant degradation predictive model (STPDPM) in national parks using artificial neural network
(ANN). J. Model. Earth Syst. Environ. 6, 715–729 (2020).
45. Pourbabaki, R., Karimi, A. & Yazdanirad, S. Modeling the consequences and analyzing the dangers of carbon disulfide emissions
using ALOHA software in an oil refinery. J. Health Field 6(3), 24199–24199 (2019).
46. Jahani, R. et al. An in-vivo study on anticonvulsant, anxiolytic, and sedative-hypnotic effects of the polyphenol-rich Thymus
kotschyanus extract; evidence for the involvement of GABA-A receptors. Iran. J. Pharm. Res. 18(3), 1456–1465 (2019).
47. Schmidhuber, J. Deep learning in neural networks: an overview. Neural Netw. J. 61, 85–117 (2015).
48. Iranian Management and Planning Organization. Terms of References for Forest Management Planning and Implementation in
the Caspian Forest of Iran. Iranian Management and Planning Organization Press, No. 305. 56 p (2005).
49. Department of Natural Resources of Mazandaran province. Forest management plan of Neka Zalemroud Forest. 855 p (2016).
50. Shams, S. R., Jahani, A., Moinaddini, M. & Khorasani, N. Air carbon monoxide forecasting using an artificial neural network in
comparison with multiple regression. Model. Earth Syst. Environ. 6(3), 1467–1475 (2020).
51. Pourmohammad, P., Jahani, A., Zare Chahooki, M. A. & Goshtasb Meigooni, H. Road impact assessment modelling oniplants
diversity ininational parks using regression analysis in comparison with artificial intelligence. Model. Earth Syst. Environ. 6(3),
1281–1292 (2020).
52. Kalantary, S., Jahani, A. & Jahani, R. MLR and Ann approaches for prediction of synthetic/natural nanofibers diameter in the
environmental and medical applications. J. Sci. Rep. https://doi.org/10.1038/s41598-020-65121-x (2020).
53. Bahraminejad, M., Rayegani, B., Jahani, A. & Nezami, B. Proposing an early-warning system for optimal management of protected
areas (Case study: Darmiyan protected area, Eastern Iran). J. Nat. Conserv. 46, 79–88 (2018).
54. Barati, B., Jahani, A., Zebardast, L. & Rayegani, B. Integration assessment of the protected areas using landscape ecological approach
(Case Study: Kolah Ghazy National Park and Wildlife Refuge). J. Town Country Plann. 9(1), 153–168 (2017).
Scientific Reports | (2021) 11:1124 | https://doi.org/10.1038/s41598-020-80426-7 12
Vol:.(1234567890)www.nature.com/scientificreports/
Acknowledgements
We are thankful to the experts of natural resources office in Mazandaran province who supported us for data
collection.
Author contributions
A.J. analyzed and interpreted the trees data regarding the wind storm harms. A.J. performed the modeling process
of tree failure. M.S. was a major contributor in writing the manuscript and modeling software management. A.J.
and M.S. read and approved the final manuscript.
Funding
There is no funding for this research and authors used personal budgets in the design of the study and collection,
analysis, and interpretation of data and in writing the manuscript.
Competing interests
The authors declare no competing interests.
Additional information
Supplementary Information The online version contains supplementary material available at https://doi.
org/10.1038/s41598-020-80426-7.
Correspondence and requests for materials should be addressed to A.J.
Reprints and permissions information is available at www.nature.com/reprints.
Publisher’s note Springer Nature remains neutral with regard to jurisdictional claims in published maps and
institutional affiliations.
Open Access This article is licensed under a Creative Commons Attribution 4.0 International
License, which permits use, sharing, adaptation, distribution and reproduction in any medium or
format, as long as you give appropriate credit to the original author(s) and the source, provide a link to the
Creative Commons licence, and indicate if changes were made. The images or other third party material in this
article are included in the article’s Creative Commons licence, unless indicated otherwise in a credit line to the
material. If material is not included in the article’s Creative Commons licence and your intended use is not
permitted by statutory regulation or exceeds the permitted use, you will need to obtain permission directly from
the copyright holder. To view a copy of this licence, visit http://creativecommons.org/licenses/by/4.0/.
© The Author(s) 2021
Scientific Reports | (2021) 11:1124 | https://doi.org/10.1038/s41598-020-80426-7 13
Vol.:(0123456789)You can also read