Land rights, agricultural productivity, and deforestation in Viet Nam - WIDER Working Paper 2018/88 - unu-wider
←
→
Page content transcription
If your browser does not render page correctly, please read the page content below
WIDER Working Paper 2018/88

Land rights, agricultural productivity, and
deforestation in Viet Nam

Ryan Abman1 and Conor Carney2

August 2018
Abstract: This paper studies the relationship between land tenure for smallholder agriculture and
deforestation in Viet Nam. We combine high resolution satellite data on deforestation with rich
household and commune-level, biannual panel data. We study two margins of tenure security,
whether a household has any land title (extensive) and the share of a household’s land held in title
(intensive). Using a household-fixed effects model, we find the increases in crop production and
land investment associated with holding land title are driven by the intensive margin. We then
aggregate the survey data to the commune-level and find evidence that marginal increases in
extensive tenure (share of households with any land title) increase deforestation holding constant
the average intensive tenure (average share of land held in tenure among those with land title). We
find some evidence that increasing the intensive margin of tenure (holding constant the extensive
tenure) decreases deforestation. These results present a more nuanced view of the tenure-
deforestation relationship than is prevalent in the existing literature.

Keywords: Deforestation, agricultural productivity, land tenure, Viet Nam
JEL classification: Q15, Q23, O13

Acknowledgements: We are grateful to UNU-WIDER for supporting this project and providing
access to the VARHS data. This paper benefited from comments and suggestions from
participants of the 2018 ’Waves of VARHS Data’ project workshop at UNU-WIDER in Helsinki.
We thank Jacqueline Myers and Daniel Dal Pino for research assistance. All remaining errors are
our own.

1 San   Diego State University, San Diego, CA, USA, corresponding author: rabman@sdsu.edu; 2 The Brattle Group, Boston, MA,
USA.
This study has been prepared within the UNU-WIDER project on ‘Structural transformation and inclusive growth in Viet Nam’.
Copyright © UNU-WIDER 2018
Information and requests: publications@wider.unu.edu
ISSN 1798-7237 ISBN 978-92-9256-530-5
Typescript prepared by Ans Vehmaanperä.
The United Nations University World Institute for Development Economics Research provides economic analysis and policy
advice with the aim of promoting sustainable and equitable development. The Institute began operations in 1985 in Helsinki,
Finland, as the first research and training centre of the United Nations University. Today it is a unique blend of think tank, research
institute, and UN agency—providing a range of services from policy advice to governments as well as freely available original
research.
The Institute is funded through income from an endowment fund with additional contributions to its work programme from
Finland, Sweden, and the United Kingdom as well as earmarked contributions for specific projects from a variety of donors.
Katajanokanlaituri 6 B, 00160 Helsinki, Finland
The views expressed in this paper are those of the author(s), and do not necessarily reflect the views of the Institute or the United
Nations University, nor the programme/project donors.
1           Introduction

Land tenure may have both direct and indirect effects on deforestation. Research on the direct effects of
land tenure has focused on the impacts of the security of property rights and ownership of land in the
extraction of forest. Deacon (1994), Bohn and Deacon (2000), Ferreira and Vincent (2010), Robinson
et al. (2014), Wendland et al. (2014), Wehkamp et al. (2018), and many others have shown that greater
macro-level protection of property rights results in lower levels of deforestation. Under weak property
right regimes there is an incentive to over extract natural resources that are less capital intensive, such as
forest, or to clear land in order to establish a de facto property right when the de jure property right may
not otherwise be enforced.

In addition, there are a number of indirect effects of land tenure on deforestation, but unlike the direct
effects, the impacts of indirect effects are largely ex-ante ambiguous. There is a large body of research
that links land tenure with improvements in agricultural productivity and land investment. Some notable
examples include Feder (1987) for Thailand, Smith (2004) for Zambia, Markussen (2008) for Cambo-
dia, Deininger and Jin (2006) on land related investment in Ethiopia, in addition to the Viet Nam-specific
work we discuss in the following section.1 If these land-related investments increase overall productiv-
ity, the returns to converting forest land to agriculture may increase and would thus lead to increased
deforestation. However, if the land-related investments allow for more intensive agriculture (i.e. sus-
tained perennial cropping rather than shifting cultivation of annual crops), deforestation could decrease.
This tension is at the heart of the ‘Borlaug hypothesis’ - specifically, Borlaug hypothesized that increas-
ing agricultural productivity would lead to less land in agriculture and thus less deforestation (Angelsen
and Kaimowitz 2001). However, economic models of land clearing for agriculture often predict that
increases in productivity increases the return for clearing land resulting in higher levels of deforestation
(Angelsen 1999).

In this paper, we provide descriptive evidence on the relationship between land title, land investment,
productivity, and deforestation in Viet Nam. We study this question using a combination of unusually
rich household panel data on land title and agriculture as well as spatially explicit satellite data on
deforestation in Viet Nam. In Viet Nam, many farmers work a combination of plots – some of which
they hold a formal right to work, others they do not. Using household fixed-effects regressions, we
find that land title is associated with intensive agricultural investments and increased output (consistent
with the Borlaug hypothesis) but only when households have a large share of their land held in title.
Furthermore, land used for forestry decreases for households when they hold large shares of land in
title. However, we find that forestry production is greater for households who hold any land in title and
local increases in titled land are associated with conversion to perennial crops.

From our survey data, we create a panel of three distinct measures of tenure, the share of households with
any land title (extensive tenure), the average share of worked land in title among households with any title
(intensive measure), and the share of surveyed land area with title across 368 communes. Combining
these data with spatially explicit satellite data on forest loss, we find that increases in the extensive
tenure margin are associated with increases in forest loss while increases in the intensive tenure margin
are associated with decreases in forest loss, though the evidence on the intensive margin is weak. We
find that, among a consistent sample of plots, increasing the titled share of surveyed land is associated
with an increase in deforestation.

The contribution of the present paper is two-fold. First, we examine two margins of land tenure and
estimate their effects on agricultural outcomes with implications for deforestation (extensification vs
intensification). Second, we are able to relate these changes in title to observed changes in deforesta-

1   See Lawry et al. (2017) for a recent, systematic review of this literature.

                                                                   1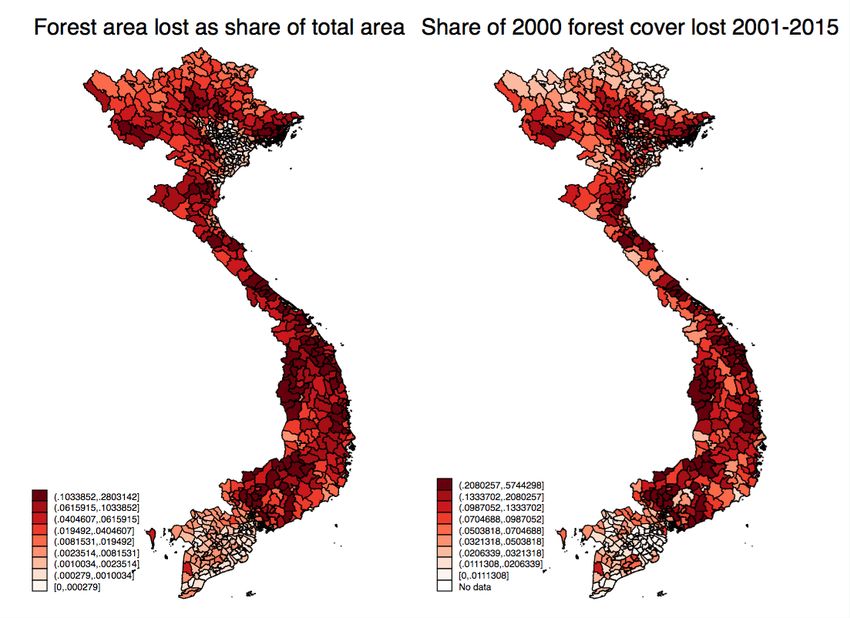
tion over the same time period while controlling for unobservable, time-invariant confounding factors.
Other papers that have studied the relationship between land title, agricultural productivity, and defor-
estation have relied on cross-sectional variation in land title and forest cover (such as Liscow (2013))
or demonstrate agricultural expansion into historically forested areas (such as Kubitza et al. (2018)).
The combination of our unique empirical setting and unusually rich panel data allows us to provide new
evidence on the relationship between land tenure and deforestation.

The rest of the paper proceeds as follows. Section 2 provides background information on deforestation
in Viet Nam as well as a discussion of the Viet Nam-specific literature on land tenure and agricultural
investment and productivity. Section 3 describes the VARHS household data, our satellite data on de-
forestation, as well as our empirical approach taken in the paper. Section 4 presents the results found
from our analysis and their implications. The paper concludes with some final remarks and directions
for future work.

2        Land tenure, agriculture and deforestation in Viet Nam

Viet Nam is a unique country in the region for having gone through the forest transition, meaning net
forest cover is actually increasing. However, much of the original old growth forest in Viet Nam has
been lost to agricultural expansion, timber harvest, and the Viet Nam War. In 2010, nearly 25% of
the forest cover was plantation with another 74% secondary growth forest - only 1% was classified as
primary forest (Pham et al. 2012). Forest exports play an important role in the Vietnamese economy
with the Ministry of Agriculture and Rural Development forecasting 2017 timber exports to reach $7.5
billion.2

Despite the forest transition, deforestation in Viet Nam remains a concern. Between 2002 and 2009,
62,000 ha of forest was lost on average each year (Pham et al. 2012). According to Hoang et al. (2010),
the primary drivers of deforestation in Viet Nam are land conversion for agriculture, land conversion for
infrastructure projects (largely hydropower construction), unsustainable logging practices (both legal
and illegal practices) and forest fires. There is considerable regional variation in these drivers as much
of the conversion in the Northeast was driven by conversion to agricultural land for food crops, while
conversion in the highland plateau driven by commercial and perennial crops, and forest land in the
Mekong Delta converted to shrimp farms and aquaculture (Pham et al. 2012). Van Khuc et al. (2018)
links cross-sectional variation in deforestation and forest degradation in Viet Nam from 2000 - 2010 to
poverty, agricultural production, and local governance.3 Meyfroidt et al. (2013) demonstrate perennial
crops displaced shifting cultivation of perennial crops into forest margins in the Central Highlands in
this same period.

Understanding deforestation in Viet Nam warrants close attention to smallholder actions. Nearly 1/4
of Viet Nam’s forests are owned by smallholders (single families) who are credit constrained and often
forced to clear timber after only 5 years of planting, selling such timber earlier than optimal.4 These same
credit constraints may also accelerate degradation which allows households to purchase agricultural

2http://english.vov.vn/economy/ministry-predicts-wood-exports-at-us75-billion-this-year-350498.vov (accessed on August 7,
2018)
3However, Jadin et al. (2013) finds a weaker relationship between forest dynamics, poverty and agriculture in Northwestern
Viet Nam.
4https://news.mongabay.com/2017/11/in-vietnam-small-farmers-and-timber-magnates-forge-uneasy-alliance/ (accessed on
August 7, 2018)

                                                            2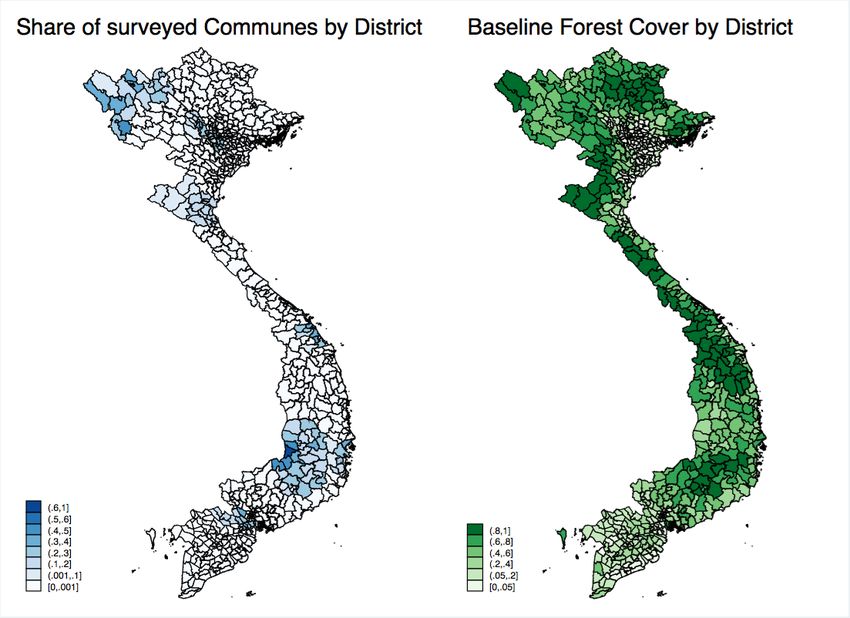
input factors (Pham et al. 2012). Linde-Rahr (2005) finds that poor households are likely to turn towards
extractive non-timber forestry to augment nutrition and short run income.

Land tenure has changed dramatically over the past 25 years in Viet Nam. Following the reunification of
the country in the 1970s, land collectivization was widespread in both North and South Viet Nam. In the
late 1980s, strict collectivization was relaxed to allow for individual certification within collective land
areas. The 1993 land law extended these individual certificates to 20 years for annual crop production
and 50 years for perennial crops. While the land remained nominally owned by the people and managed
by the state, land use certificates resembled private land title, allowing owners to sell, mortgage, inherit,
and lease certified land. The 2013 land law extended the time period for annual crop production to 50
years and further refined the individual’s rights to use the land so long as the land was being used accord-
ing to the regulations (Hirsch et al. 2015). In the early 1990s, the government also began the allocation
of forest use rights to individual families. This program aimed to slow the slash and burn agricultural
practices of farmers who did not have access to paddyland rights and was aimed at encouraging both
forest protection as well as perennial plantations (Castella et al. 2006).

Economists have studied the role that land use certificates play in cropping decisions, land investment,
and household consumption. Do and Iyer (2008) study the initial 1993 land law and argue that titling
allowed households to switch to perennial crops and engage in more off farm income activities. Saint-
Macary et al. (2010) find that land title increases investments in erosion control measures. Markussen
et al. (2011) find that land restrictions do not reduce output, but require more effort and inputs from
the household. Kemper et al. (2015) find land title increases both consumption as well as consumption
volatility as land title allows for potentially risky investment for rural households. Markussen (2015)
shows plot-level investment increases with land use certificates. Newman et al. (2015) find that joint
land titling leads to higher land productivity. Promsopha (2015) finds that the land certificates provide
important insurance for marginalized households. Of direct importance to deforestation, Saint-Macary
et al. (2010) find that land title significantly increases the likelihood of practicing agroforestry (which
reduces erosion, soil degradation, and landslide risk) in the Northern Highlands.

The closest work to the current study is Tachibana et al. (2001). The authors explicitly study land rights
and extensification versus intensification. Looking at two study regions in Northern Viet Nam from
1978 - 1994 the authors find that titling of the upland regions prevented extensification from lowland
agriculture and instead led to intensification and increased yields from existing lowland farms. Our
paper departs from this study in a number of important ways. First, we study a period in Viet Nam after
the 1993 and 2003 land reforms have taken place which drastically changed the nature of land rights in
the country. Second, we look at individual household behavior as a function of the rights owned by the
household itself. Such household data was not available to the researchers at the time of the earlier paper.
Lastly, we are able to identify intensification/extensification from within household and within commune
changes in land tenure due to the panel nature of our household and annual deforestation data. Tachibana
et al. (2001) observe two periods of deforestation and estimate cross-sectional regressions.

That the land use certificates play such an important role in production investment decisions, crop choice,
and household consumption provides the motivation we use to study tenure security’s role in agricultural
intensification/extensification and deforestation in Viet Nam. Below, we discuss the data and empirical
approaches we employ to study this relationship.

                                                     3
3 Data and empirical approach
In this paper, we use a combination of panel survey data at the household and commune level and
combine that data with spatially explicit satellite estimates of deforestation. We detail both of the key
sources below.
3.1 Household data on land title, land investment and agricultural productivity
The first data set is the Vietnam Access to Resources Household Survey (VARHS). This panel survey
has been administered every two years from 2008 through 2016 and includes information on a balanced
panel of 2,131 rural households across 12 provinces and over 418 communes. The data have two main
parts, a commune module which asks a local representative about aggregate commune indicators, and
a household/plot-level module. In this paper we use data from the commune module for descriptive
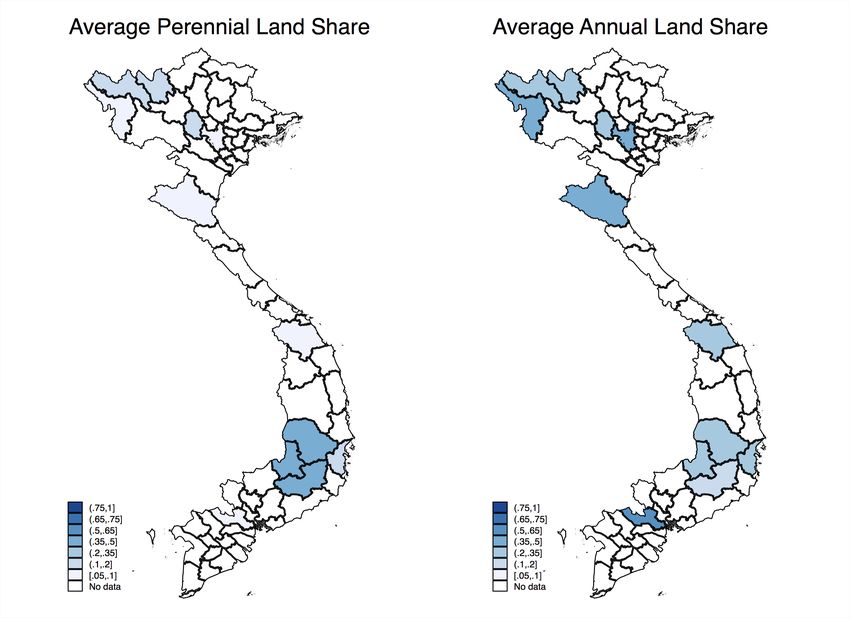
purposes (to show the relationship between perennial agriculture expansion, annual agriculture expan-
sion, and expansion of residential areas on forest loss) but focus largely on the plot/household level
measures of land tenure to study the relationship between land title, agricultural productivity and defor-
estation.
The variables in the data include key demographics about the household and its members as well as
household characteristics that provide measures of land title, agricultural output, and agricultural prac-
tices. Specifically, we collapse plot-level data to the household level and calculate variables that measure
certain agricultural practices such as how much land and the share of land that is: irrigated, in forestry,
fallowed, and in perennials to create dependent variables of interest to understand the relationship be-
tween these agricultural practices and changes in land tenure security. We also examine agricultural
output using data on the value of total crop production, and the value of perennial production. Addition-
ally, we measure household land title in two ways. The first is whether a household has at least one plot
on which they have a formal property right. The second is a continuous measure of the share of a house-
hold’s total land that it has with a formal property right. (See Table 1 for summary statistics).
We analyze the household data to explore the mechanisms underlying the relationship between land
tenure security and deforestation in Viet Nam. Theoretically, the effect of increasing land tenure on
deforestation is ambiguous. Farmers will adjust their agricultural practices and/or shift cultivation to
maximize output in response to the receipt of a land title. This can lead to an increase or decrease
in deforestation depending on whether farmers expand and clear previously forested areas (extensive
margin), or they alter their practices and focus on increasing yields on plots that are already deforested
(intensive margin). We estimate the effects of increased land title on the share of land that is irrigated,
in forestry, fallowed, and in perennials. We also examine productivity by estimating the effect of land
title on the value of total crop production and the value of perennial production. The analysis of these
outcomes are used to understand if the extensive or intensive margin is driving the relationship between
land title and deforestation and what the underlying mechanisms are in this setting.
We create another measure of land title at the commune level through the use of the plot-level data in
the VARHS. We restrict our sample to plots that are consistently observed throughout the sample period
(thus creating a balanced panel). We then calculate the total plot area with title from that panel and
use the ratio of the plot area with title to the total plot area. The province-level variation in this land
title measure is presented in Figure 2. This measure has the advantage that changes in plots worked by
households will not bias our findings and neither will disparities or inequality in household land under
title.
4
These measures of title at the household and commune level are appropriate for studying productivity,
land use, and land investment at the same scale in the VARHS data. However, we do not observe the
explicit location of these plots or households – we only know the commune in which they are located.
Thus, when we link these measures to our deforestation data, our results require the assumption that
changes in patterns of land titling in our sample are representative of changes in patterns of land titling
across the commune as a whole. This is an important caveat to our study.
The VARHS data do include a commune-specific module whereby they ask a local representative about
the total area in the commune under different types of land use as well as the share of land in each use
with title, the responses to the questions on land title are frequently missing (labeled as “Don’t Know”
or “Not Applicable”) and those that are provided seem to lack precision and are likely indicative of
guessing (the distribution has large spikes at round numbers such as 60 and 80% with almost nothing
in between). While these measures may still be useful for broad, cross-sectional comparisons (areas
with high shares of land title against those with low shares of land title) we believe the imprecision and
missing values to be problematic for fixed effects regressions that rely on within-commune variation in
land title. That said, we do use some of the commune-module responses to descriptively relate land use
in perennial agriculture, annual crops, and residential area to forest loss.
3.2 Forest loss data
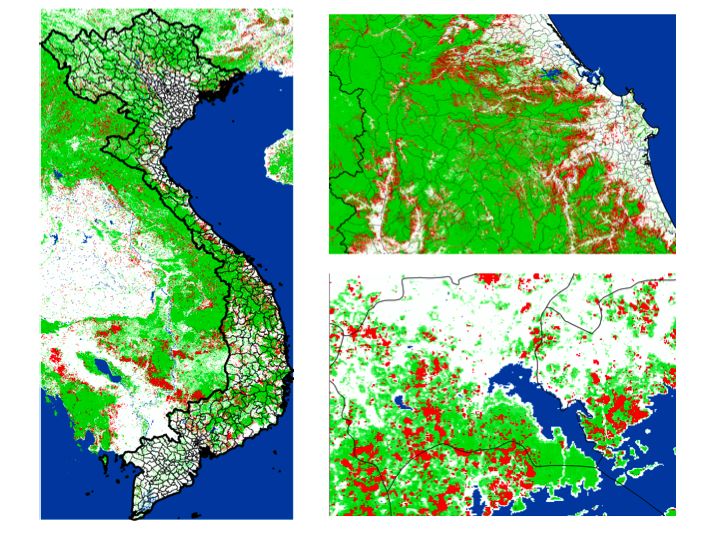
In order to measure forest loss, we use data from Hansen et al. (2013) that provides spatially explicit
estimates of forest cover in 2000 and subsequent forest loss for 2001 - 2015 at an approximately 30m2
resolution. Figure 3 presents examples of the underlying deforestation data. There are important caveats
in working with these data that warrant discussion. First, tree cover is defined as the share of a pixel
(30m2 ) that has vegetation at least 5 meters tall in 2000. This measure does not allow us to separately
identify old growth forest from plantation and/or secondary growth forest. Thus clear-cutting of old
growth forest and timber harvesting both register as forest loss equally. Furthermore, the dataset only
registers the first time trees are cleared and does not account for tree growth that may replace those
cleared. Thus, if a landowner clears trees in 2009 and then replants and clears again in 2014, the forest
loss will only be registered in 2009.
We label individual pixels as ’forested’ at baseline if the baseline tree cover is at least 15% of the pixel
in order to reduce noise in our estimates. We then aggregate the count of pixels that are forested at
baseline and lost in any given year to the commune level. This provides us with a panel of 15 years of
deforestation across roughly 9,000 communes. We match by commune name the communes surveyed
in the VARHS data and are able to connect 368 of the 418 communes in the VARS balanced panel. To
match the time dimension of the biannual VARHS surveys, we take two-year averages of forest loss in
communes such that a VARHS survey in year t is matched with the average deforestation from years
t − 1,t. This is done because the survey month in year t varies from commune to commune and many of
the questions refer to the previous calendar year. The result is a balanced panel of 368 communes across
5 different survey periods.
Figure 4 presents the geographic distribution of surveyed communes as well as baseline forest share at
the district level. Surveyed communes are clustered throughout Viet Nam rather than evenly spread.
We do have a good number of communes in the Central Highlands and Northeast regions, two areas
with substantial natural forest that have faced significant deforestation pressure in recent years. Figure
5 presents district-level deforestation across the 15 year period of our tree cover data. It presents both
the share of land area cleared as well as the share of baseline forest cover cleared. Figure 6 compares
both baseline forest cover and forest loss by surveyed and non surveyed communes. The distributions
are rather comparable between the two groups, which indicates that our surveyed communes are not
5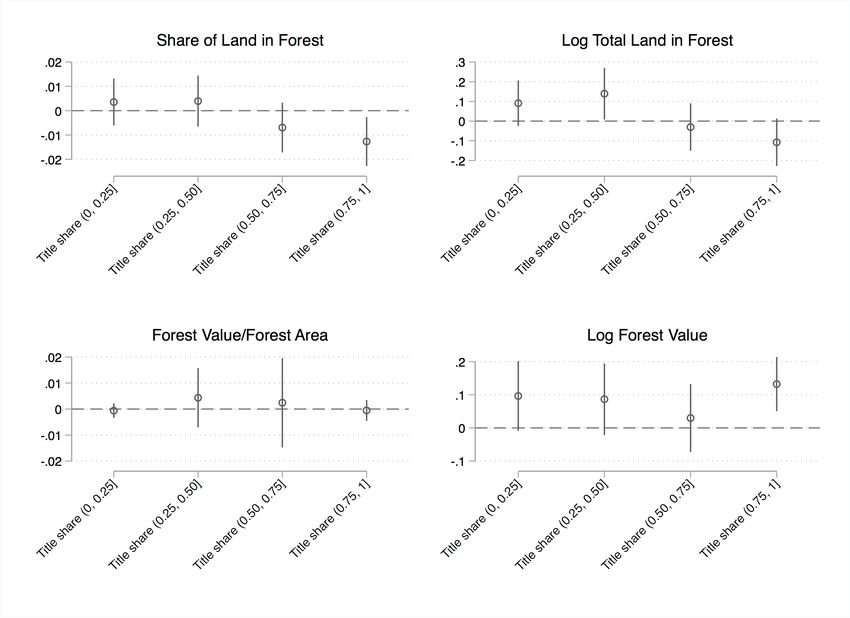
particular outliers either in forest cover or forest loss during this period. There do seem to be relatively
fewer surveyed communes with no forest cover at baseline largely because the survey omitted urban
communes.

3.3     Household analysis

To estimate the relationship between household land title and agricultural investment and productivity,
we use two different measures of title. First, we use an indicator for whether a household has at least one
plot with a land title. Next, we use a continuous variable that measures the share of total land for which
a household has a formal land title. The effects of the first measure are estimated using the following
household fixed effects model:

                              yi,t = β0 + β1 1[Title_Sharei,t > 0] + γi + δt + i,t                            (1)

where yi,t is a measure of agricultural practices or output value for household i in year t, Title_Sharei,t
is a continuous measure of the share of land with title for household i in year t, 1[Title_Sharei,t > 0] is
an indicator function equal to 1 if the household has any land in title and 0 otherwise, γi is a household
fixed effect, δt is a year fixed effect and, finally, i,t is the household-year error term.

Identification of β1 in this model comes from within household changes in holding any title. Cross
sectional differences among households that always hold title and those that never hold title will be
accounted for through γi . As we do not have random assignment of land title nor do we have quasi-
experimental variation in title, our estimates of the β1 coefficient will measure how a household changes
agricultural decisions when receiving some land title after previously holding none. Though these es-
timates are not causal effects, the household fixed effects and the year fixed effects (and the additional
district trends and district by year fixed effects in other specifications) limit the degree to which our
estimates will be driven by cross-sectional unobserved factors or other unobserved factors that change
over time.

For our second measure of title, rather than force the relationship between share of land under title and
the outcomes under study to be linear, we instead create bins according to the share of land under title.
We then estimate the following household fixed effects model:
                             4
                yi,t = β0 + ∑ β j 1[Title_Sharei,t ∈ (0.25 ∗ ( j − 1), 0.25 ∗ j]] + γi + δt + i,t             (2)
                            j=1

where yi,t is a measure of agricultural practices or output value for household i in year t, 1[Title_Sharei,t ∈
(0.25 ∗ ( j − 1), 0.25 ∗ j]] is an indicator variable equal to 1 if the share of land in title is in (0.25 ∗ ( j −
1), 0.25 ∗ j] and 0 otherwise, γi is a household fixed effect, φt is a year fixed effect and, finally, it is the
household-year error term.

In this model, our β j coefficients are identified from within household changes in the share of total land
held in title and are individually interpreted as the effect of that particular share of land held in title
relative to households with no land in title. The marginal effect of increasing the share of land in title
from the lowest bin (> 0, ≤ .25) to the next bin (> .25, ≤ .5) is β2 − β1 .

Again, the main threat to identification in our household analysis is that the decision to seek formal land
title for a particular household is endogenous. Obtaining a formal title can be costly for a household and
the benefits of the title might vary greatly across households. Therefore, we would expect households
with lower costs of obtaining and higher returns to securing land title would seek out ways to obtain
a formal land title for their plots. This would bias simple ordinary least squares (OLS) estimates of

                                                       6
β1 and β j ’s. The household fixed effects eliminate this threat by controlling for all the time-invariant
characteristics of the household that cause the OLS estimates to be biased. Additionally, we include
year fixed effects, district time trends and district-by-year fixed effects in additional specifications to
control for any additional time varying characteristics that might impact out results. Therefore, our
underlying assumption is that there are no time-varying household characteristics that are also changing
over the panel and are correlated with households increasing the amount of titled land they have.

3.4     Commune-level analysis

We use our third measure of land title in the VARHS data at the commune-level. This aggregates
our balanced panel of plots to the commune-level, using the change in the share of this land as our
explanatory variable in the following model:

                                yc,t = β0 + β1 Title_Sharec,t + γc + δt + i,t                           (3)

In this case, our variation is at the commune-year level (rather than household-year level) and we ex-
amine the relationship between the share of land in title and the share of irrigated land, share of land in
fallow, share of land in perennial agriculture, and the share of land in forestry.

Moving to our analysis on deforestation, our ideal empirical setting would analyze deforestation at the
household level using the household land title status. Absent geographic coordinates for the households
surveyed, we instead aggregate the household survey data to the commune-level to get commune-level
averages in share of households with title (our extensive margin of tenure) and average share of land
in title for those with title (our intensive margin of tenure). For these averages to be valid proxies for
the actual title rates in the commune, we require the assumption that changes in household title patterns
observed in our sample be representative of the overall changes in title in the commune more broadly.
Due to the right-skewed underlying distribution of deforested pixels (see Table 6) we log transform the
average number of pixels deforested over the two-year period corresponding to the survey timing. As
such, we interpret our coefficient estimates as percent changes in average annual deforestation.

Our deforestation analysis begins with a descriptive fixed effects regression using the broader commune
module land use estimates for the entire commune. We estimate the elasticities between perennial land
area, annual crop land area, and residential area on deforestation. We then interact perennial area with
province indicators to get province-specific elasticity estimates. These province-specific estimates are
presented visually in the paper with the table of the estimates in the appendix.

We then estimate three different fixed effects models. The first examines the relationship between the
extensive margin of tenure on deforestation and is as follows:

                              yc,t = β0 + β1 Share_HH_Titlec + γc + δt + i,t                            (4)

The coefficient of interest is β1 which captures the relationship between the share of surveyed house-
holds in a commune and the average annual log deforestation in that same commune. The inclusion of
commune-specific fixed-effects (γc ) controls for cross-sectional variation in average annual deforesta-
tion and land tenure which implies that our identification of β1 arises from within-commune changes in
the share of surveyed households with tenure. We control for changes in common year to year factors
that drive deforestation with the inclusion of year fixed effects (δt ). In additional specifications we in-
clude linear district time trends and district-by-year fixed effects to control for common time changes in
a more flexible manner.

                                                     7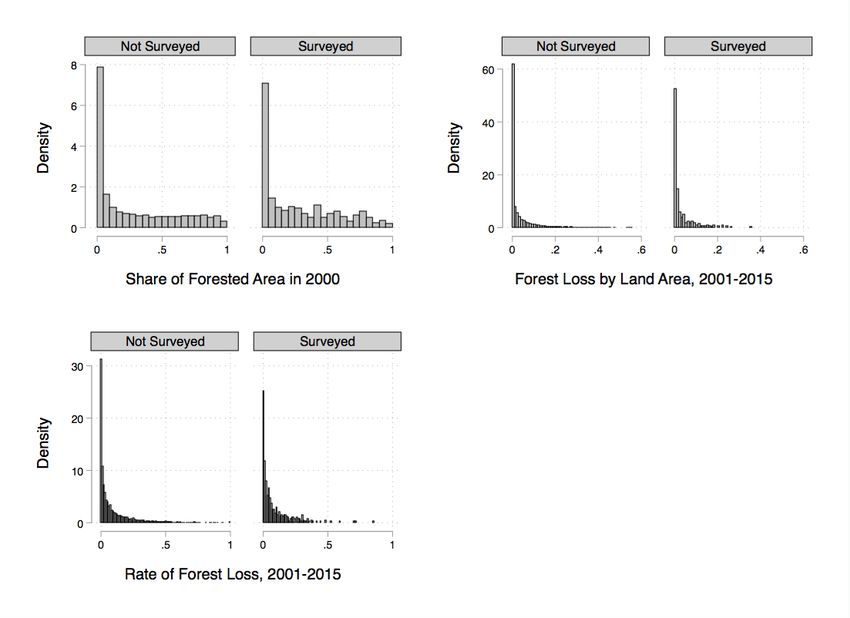
The above specification considers only the relationship between extensive margin of tenure and defor-
estation. We also estimate another model that accounts for both measures of tenure as follows:

           yc,t = β0 + β1 Extensivec + β2 Intensivec + β3 Extensivec × Intensivec + γc + δt + i,t         (5)

The extensive measure is the same as the variable of interest in equation (4), the share of households
surveyed that have any land title. Our other measure of tenure, the intensive variable, is the share of
land held in title among those who have any title in a commune. We include an interaction of the
two measures as their effects on deforestation are likely dependent on one another. In doing so, the
marginal effect of either the extensive or intensive margin is not simply the associated coefficient (β1 for
extensive, β2 for intensive). The marginal effect of an increase in extensive tenure is β1 + β3 Extensivec
and the marginal effect of an increase in extensive tenure is β2 + β3 Intensivec . When we estimate the
coefficients, we also present estimated marginal effects at the means and p-values for the test that these
estimated marginal effects are zero.

Due to the inclusion of commune-level fixed effects, we identify these coefficients from within-commune
variation in both measures of tenure. This requires that we have sufficient within variation in these mea-
sures. The within standard deviation for our intensive measure is 0.15 (with a mean of 0.87) and the
within standard deviation for our extensive measure is 0.17 (with a mean of 0.69). Also, separate identi-
fication of the two effects requires that both measures are not perfectly correlated with one another. The
two have a correlation coefficient of 0.44.

Because of the fixed effects we include in our model, time-invariant cross sectional omitted variables
(such as distance to market, soil suitability for agriculture, etc.) do not pose a threat to identification.
Furthermore, prevailing trends in land titling and deforestation will also not pose a threat to identification
because these will be controlled for via our various time trends and time fixed effects. Our identification
is undermined if there are omitted, time-varying factors that drive both land titling and deforestation at
the local-level. Our identification also assumes that land clearing decisions are driven by land titling,
and not the reverse. If land title required clearing land in order to obtain title (which is the case in some
tropical countries) our model would be misspecified. Below, we discuss further why we believe our
findings (at least partly) refute this potential reverse-causality issue.

Finally, we conclude our analysis with a commune fixed effects regression using the share of surveyed
area with title as our explanatory variable. We include the same series of fixed effects as in our other
deforestation models. Again, this model requires the assumption that changes in the share of land in title
in our sample of plots is representative of changes in title for the commune as a whole.

4       Results

4.1     Land title and agricultural outcomes

The household-level results of increased land title on agricultural outcomes from estimating equation
1 are reported in Table 2. Each panel in the table presents the findings of a different outcome; log of
forestry value, log of perennial value, log of crop value and the share of land irrigated. Each column
presents results of a different model; (1) is the standard model from equation (1), (2) includes linear
district time trends, and (3) includes district-by-year fixed effects.

We find that holding any land in title is associated with an 8 - 12 percent increase in annual value of forest
product production. The value of perennial production increases by nearly 50 percent upon acquiring
any land title, and total crop value increases by 22 to 25 percent. All of these findings are statistically

                                                      8
significant across all models with 11 of the 12 significant at the 5 percent level. Holding any land in title
is associated with a two percent increase in irrigated land share. This finding however, loses significance
upon inclusion of the district by year fixed effects. Taken together, holding any land in title is associated
with increases in forest product production, agricultural production and land investments.
We visually present findings from our estimates of equation (2) using coefficient plots (full tables are
in the appendix). Figures 8 and 9 present our estimates of the β j coefficients from equation (2) with
additional district-by-year fixed effects (thus akin to Column (3) in Table 1). To ensure that our estimated
effects are not driven by households giving up untitled plots (thus increasing the share, but through
changes in the denominator) we present both estimates of log crop value and crop value divided by the
land worked, as well as log irrigated area and share of land irrigated.
These figures present a slightly more nuanced view of the relationship between land title and our out-
comes. While these are consistent with our findings in Table 2, much of the intensification (investments
in irrigation and increases in agricultural production) occurs at the higher end of the share of land in title
(> 50%). Below this 50 percent bin, crop production and irrigation are not statistically different from
holding no land in title.
Figure 9 presents estimates of the relationship between share of land in title and forest practices. While
forestry plays a relatively small role in our sample and declines through the sample period, it does have
direct implications for tenure and deforestation. Our coefficient plots indicate that, at low levels of land
in title, households have slightly more land in forest, but that this declines as the share of land in title
becomes greater than 50%. There does not seem to be a difference in intensity of forest extraction as
the forest value per forest land coefficients are all approximately zero. The finding on forest value then
seems to be driven by differences in forest area rather than extraction intensity.
We present results from estimating equation (3) in Table 3. These commune-level results correspond to
the aggregation across plots that comprise the balanced panel observed in the data. Our explanatory vari-
able is the share of the plot area with title. In this table, we present only results for the base specification
from equation (3), but results are largely similar upon the inclusion of province trends, and province-by-
year fixed effects.5 We find that increases in the share of plot land with title are associated with increases
in the share of irrigated land, increases in the share of land dedicated to perennial agriculture (though
this result is just shy of statistical significance), and decreases in the share of plot area in forestry. We
find no relationship between the share of land with title and the share of land in fallow.
4.2 Deforestation
We begin our deforestation results by using the data available in the commune module of the VARHS
on estimates of total land use by type. Table 4 presents estimates of the relationship of log perennial
area, log annual crop area, and log residential area on log average annual deforestation. Columns (1) -
(3) estimate the relationships individually and column (4) includes all of them together. The estimates
indicate that increases in perennial area are associated with increases in deforestation with small or zero
effects on deforestation from increases in annual crop area or residential area. While these data have
the benefit of providing estimates for the entire commune (rather than just those surveyed households
or the surveyed plots) both missing values as well as imprecise estimates may undermine our ability for
precise estimation and may lead to attenuation bias.
5 These results are available upon request.
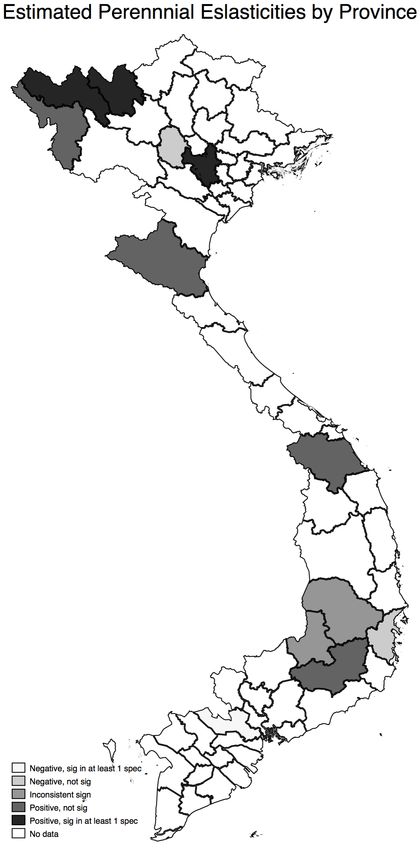
9We examine regional heterogeneity in the relationship between perennial land expansion and forest loss
by allowing for province-specific coefficients on log perennial area. We present these results visually
in figure 10 and include the tabulation of our results in the appendix. We estimate 4 specifications,
one with commune and year fixed effects, another adding province-by-year fixed effects, a third with
year fixed effects including log annual crop area and log annual crop area interacted with province
indicators, and a fourth in which we add province-by-year fixed effects to the third model. We see the
most consistent, positive effects (increases in deforestation associated with perennial increases) in the
Northern Highlands with slightly more mixed results for the Central Highlands.
Next, we turn to our commune-level land title and deforestation analysis. Table 5 presents the estimates
and associated standard errors from equation (4). Panel A uses the share of households that have any
title and Panel B uses an area-weighted share of title as the independent variable. Column (1) presents
estimates of the basic specification, Column (2) includes province-specific linear time trends and Col-
umn (3) includes province-by-year fixed effects. The estimates indicate that a 10% increase in the share
of households with any land title is associated with a 1.6 - 2.7% increase in annual deforestation. The
estimates struggle for conventional statistical significance in Columns (1) and (2) (though the p-value in
Panel A column (2) is 0.117) but are significantly different from 0 at the 5% level upon the inclusion of
province-by-year fixed effects, indicating that there is likely important year-to-year regional variation in
deforestation across provinces in Viet Nam.
Figure 11 presents a coefficient plot of province-specific coefficient estimates from this model. While
many individual estimates are not significantly different from zero, only two coefficients are negative
(Lai Chau and Quang Nam), neither of which is significant with one of them being almost a precise zero
(Lai Chau).
Table 6 presents results from estimating equation (5). As discussed above, we examine both extensive
tenure (share of households surveyed that have any land title) and intensive tenure (average share of land
with title among households who have any title). The coefficient estimates on the extensive measure
and the interaction term are positive in all specifications and the coefficient on the intensive measure is
negative yet none of these are individually statistically significant.6 We also present the marginal effects
at the means for each measure. Because the marginal effects of one tenure measure depend on the level
of the other, we use mean values for each measure when calculating marginal effects. Thus the marginal
effect we present for an increase in the extensive margin of tenure is β̂1 + β̂3 ∗ 0.69 and for the intensive
margin is β̂2 + β̂3 ∗ 0.87.
Our estimates for the marginal effects indicate that a 10% increase in the share of households with any
land title (conditional on maintaining the existing average share of land in title) is associated with a
3.2 - 4.1% increase in average annual deforestation. However, a 10% increase in the average share of
land held in title (holding constant the share of households that have title in a commune) is associated
with a 1.2 - 4.2% decrease in average annual deforestation.7 We reject the hypothesis that the marginal
effect at the mean for extensive change in tenure is zero at the 10% level for the first specification and
at the 5% level for the other two. We can only reject the hypothesis of no marginal effect for the first
specification (rejected at the 5% level). However, upon inclusion of province time trends and province-
by-year fixed effects the estimated marginal effect becomes smaller and the standard errors increase
dramatically.
While we make claims regarding the findings of the intensive tenure effects on deforestation cautiously,
they nevertheless emerge as interesting. According to our household results, increasing the average share
6 The p-value on the individual coefficient on the intensive margin ranges between 0.12 and 0.16.
7 Estimating model (6) and omitting the interaction term yields estimated coefficients qualitatively similar to the marginal
effects presented here both in magnitudes and statistical significance.
10of land with title should lead to more agricultural intensification in ways that a simple increase of the
share of households with any title would not. At the commune-level, these effects on deforestation are
different – we reject the hypothesis of equality of marginal effects at the 5% level in all specifications.
Furthermore, they provide evidence that the relationships we observe between title and deforestation
are not driven by reverse-causality, otherwise both increasing margins of tenure would be positively
correlated with deforestation.
Finally, we present results using the aggregated share of land in title from the balanced panel of plots in
Table 7. While this measure does not disentangle the extensive vs intensive ownership margin as above,
it does ensure that the sample plots are consistent through the period. Across the three specifications, we
find positive associations between land in title and average annual deforestation with our most flexible
specification indicating a 10 percent increase in share of surveyed land in title is associated with a 3
percent increase in average annual deforestation.
5 Concluding remarks
In this paper, we provide evidence that increased land title has a significant effect on household agricul-
tural decisions and deforestation in Viet Nam. Specifically, using household fixed effects, we find that
increased land title increases the value of both total crop production and perennial crop production as
well as the share of land a household has under irrigation on both the extensive and intensive measures
of land title. We also find that land title significantly decreases the share of land a household has in
forestry, but only for the intensive measure of land title. We then collapse the data to the commune
level and use a fixed effects regression model to demonstrate preliminary evidence that increases in our
extensive measure of land title results in increased levels of deforestation. Additionally, we find that
increases in our intensive measure of land title results in decreased levels of deforestation. These results
suggest that the relationship between the share of land a household has land title for and deforestation
is likely non-linear. Our results present a more nuanced view of the tenure-deforestation relationship
than is prevalent in the existing literature although our overall effect suggests that increasing land title is
associated with increasing deforestation.
Despite our efforts, the data limitations impose important caveats and limitations to our findings. First,
as mentioned above, our deforestation results rely on the assumption that changes in household land
title holdings in our sample are representative of overall changes in household land title holdings in
the commune. In our final set of results, despite the fact that we have a balanced panel of plots in
our analysis, we cannot empirically distinguish between forest loss that occurs on the plots we observe
(as they change from forest to annual or perennial agriculture) vs forest loss that may be caused from
indirect land use change from spillovers (as studied by Meyfroidt et al. (2013)). We acknowledge these
caveats as important limitations to our study.
The relationship between land tenure and deforestation may be more complicated than simple extensifi-
cation versus intensification as it is typically framed in the literature. Our findings that tenure increases
intensification and productivity, but mainly for those who hold the largest share of their land in title, sug-
gest a potential reduction in deforestation from increasing land tenure security. However, the conversion
of land out of forestry and into agriculture associated with increased land title suggests that increasing
tenure security may potentially increase deforestation. Overall, our results suggest that the latter effect
dominates in Viet Nam, but there is suggestive evidence the former effect may still play a role.
116 Tables
Table 1: Household Summary Statistics
Mean SD Min Max
Number of HH members 4.587048 1.762494 1 13
Gender of HH head .7911779 .4065624 0 1
Whether HH head is married .8244955 .3804873 0 1
Age of HH head 51.54178 13.48065 21 96
Highest general education HH head 2.749883 .9384053 1 5
Total area owned 7660.382 13994.05 0 227494
Total areas of irrigated plots hh has use rights 4187.725 10752.6 0 224494
Value of crop production in last 12 month 32192.56 68028.48 0 1421529
Value of perennial crop prod. in last 12 month 12078.42 52393.1 0 895128.6
Real, annual hh income 66233.68 87016 -214925.1 2255930
Has any title to Land .857344 .3498038 0 1
Total area in fallow 399.1023 2147.263 0 30000
Total plot area 8775.968 17085.51 40 326000
Total area with title 5266.856 12114.15 0 227494
Total area in forestry 906.6954 7872.722 0 210000
Total area in perennial agriculture 1844.695 7466.524 0 110000
Observations 2,131
Source: Authors’ calculation based on VARHS data.
12Table 2: Household effects of holding any land in title
Panel A Ln(Forestry Value)
(1) (2) (3)
HH has title 0.0828∗∗ 0.0936∗∗ 0.127∗∗∗
(0.0408) (0.0433) (0.0451)
No Obs 10655 10655 10655
R2 0.077 0.101 0.133
Panel B Ln(Perennial Value)
(1) (2) (3)
HH has title 0.484∗∗∗ 0.489∗∗∗ 0.519∗∗∗
(0.114) (0.116) (0.117)
No Obs 10655 10655 10655
R2 0.035 0.048 0.078
Panel C Ln(Crop Value)
(1) (2) (3)
HH has title 0.223∗ 0.253∗∗ 0.252∗∗
(0.116) (0.117) (0.118)
No Obs 10655 10655 10655
R2 0.042 0.053 0.067
Panel D Share of land irrigated
(1) (2) (3)
HH has title 0.0253∗∗ 0.0215∗ 0.0196
(0.0129) (0.0129) (0.0131)
No Obs 12552 12552 12552
R2 0.018 0.028 0.045
Household FEs Yes Yes Yes
Year FEs Yes Yes -
Trend No District No
Dist-by-Year FEs No No Yes
Notes: This table presents results from estimating equation (1). The outcomes are listed at the top of each panel and include
the log of forestry production value, log of perennial crop value, log of total crop value, and the share of land irrigated. Standard
errors are clustered at the household level and are in parenthesis. The series of trends and fixed effects indicated at the bottom
are consistent across panels for each column. Asterisks applied as follows: ∗ p < 0.10, ∗∗ p < 0.05, ∗∗∗ p < 0.01
Source: Authors’ calculation based on VARHS data.
Table 3: Commune-level titled land share
(1) (2) (3) (4)
Irrigation Fallow Perennial Forestry
Share of surveyed land with title 0.0697∗∗ 0.0104 0.0300 -0.0596∗∗∗
(0.0351) (0.0225) (0.0182) (0.0220)
No Obs 2270 2270 2270 2270
R2 0.040 0.019 0.012 0.027
Notes: This table presents results from estimating equation (3). The outcome in all columns is the share of surveyed land (of
the balanced panel plots) irrigated (1), in fallow (2), in perennial agriculture (3), and in forestry (4). All models have commune
fixed effects and year fixed effects. Standard errors are clustered at the commune level and are in parenthesis. Asterisks
applied as follows: ∗ p < 0.10, ∗∗ p < 0.05, ∗∗∗ p < 0.01. The p-value for our coefficient of interest in Column (3) is equal to
0.100.
Source: Authors’ calculation based on VARHS data.
13Table 4: Commune-level reported land use and forest loss
(1) (2) (3) (4)
Log Perennial Area 0.0229∗ 0.0224
(0.0135) (0.0148)
Log Annual Crop Area 0.00923 0.00960
(0.0175) (0.0189)
Log Residential Area 0.00763 -0.00214
(0.0169) (0.0185)
No Obs 1808 1815 1794 1752
R2 0.025 0.025 0.024 0.025
Notes: This table presents coefficient estimates of the elasticities between perennial crop land, annual crop land and
residential land area and deforestation. All specifications include commune fixed effects and year fixed effects.
∗ p < 0.10, ∗∗ p < 0.05, ∗∗∗ p < 0.01.
Source: Authors’ calculation based on data from VARHS and Hansen et al. (2013).
Table 5: Share of surveyed households with land title on deforestation
PANEL A (1) (2) (3)
Share of HHs with title 0.162 0.199 0.277∗∗
(0.143) (0.126) (0.126)
No Obs 1840 1840 1840
R2 0.026 0.174 0.261
PANEL B (1) (2) (3)
Share of HHs with title 0.159 0.182 0.248∗∗
(Area-Weighted) (0.129) (0.120) (0.120)
No Obs 1840 1840 1840
R2 0.026 0.174 0.260
Commune FEs Yes Yes Yes
Year FEs Yes Yes -
Trend No Province No
Province-by-Year FEs Yes Yes Yes
Notes: This table presents results from estimating equation (4). The outcome in all columns is the natural log of 1 + the
average annual number of pixels cleared within the commune. Standard errors are clustered at the commune level and are in
parenthesis. Asterisks applied as follows: ∗ p < 0.10, ∗∗ p < 0.05, ∗∗∗ p < 0.01.
Source: Authors’ calculation based on data from VARHS and Hansen et al. (2013).
14Table 6: Intensive vs extensive tenure on deforestation
(1) (2) (3)
Extensive Tenure 0.292 0.153 0.202
(0.220) (0.191) (0.187)
Intensive Tenure -0.454 -0.410 -0.387
(0.311) (0.263) (0.275)
Extensive × Intensive 0.0394 0.279 0.304
(0.361) (0.300) (0.313)
Marginal Effect at Mean for Extensive 0.319∗ 0.345∗∗ 0.412∗∗
P-Value for Marginal Effect = 0 0.082 0.028 0.012
Marginal Effect at Mean for Intensive -0.419∗∗ -0.168 -0.122
P-Value for Marginal Effect = 0 0.016 0.289 0.434
Commune FEs Yes Yes Yes
Year FEs Yes Yes -
Trend No Province No
Province-by-Year FEs No No Yes
No Obs 1840 1840 1840
R2 0.033 0.176 0.262
Notes: This table presents results from estimating equation (5) and the corresponding estimated marginal effects at the means
and p-values for the test that these estimated marginal effects are zero. The outcome in all columns is the natural log of 1 + the
average annual number of pixels cleared within the commune. Standard errors are clustered at the commune level and are in
parenthesis. Asterisks applied as follows: ∗ p < 0.10, ∗∗ p < 0.05, ∗∗∗ p < 0.01.
Source: Authors’ calculation based on data from VARHS and Hansen et al. (2013).
Table 7: Share of surveyed land with title and deforestation
(1) (2) (3)
Share of surveyed area with title 0.211 0.257∗ 0.334∗∗
(0.155) (0.135) (0.141)
Commune FEs Yes Yes Yes
Year FEs Yes Yes -
Trend No Province No
Province-by-Year FEs Yes Yes Yes
No Obs 1830 1830 1830
R2 0.028 0.176 0.262
Notes: This table presents results from estimating a fixed effects model of share of surveyed land in title on commune-level
deforestation. The outcome in all columns is the natural log of 1 + the average annual number of pixels cleared within the
commune. Standard errors are clustered at the commune level and are in parenthesis. Asterisks applied as follows:
∗ p < 0.10, ∗∗ p < 0.05, ∗∗∗ p < 0.01.
Source: Authors’ calculation based on data from VARHS and Hansen et al. (2013).
157 Figures
Figure 1: Shares of households with title by year
1
Share of surveyed HHs with any land title
.8
Ha Tay
Lao Cai
Phu Tho
Lai Chau
Dien Bien
.6 Nghe An
Quang Nam
Khanh Hoa
Dak Lak
Dak Nong
Lam Dong
.4 Long An
2008 2010 2012 2014 2016
Year
Source:Author’s calculations based on the VARHS data.
16Figure 2: Shares of surveyed plot land with title by year
Source: Author’s calculations based on the VARHS data.
17Figure 3: Spatially explicit estimates of forest loss
Notes: The large panel on the left displays district borders. The panels on the right one have commune borders displayed.
Source: Author’s presentation of the data from Hansen et al. (2013).
18Figure 4: Map of surveyed communes and baseline forest cover by district
Source: Author’s calculations from VARHS and Hansen et al. (2013) data sets.
19Figure 5: Map of forest loss 2001-2015 by district
Source: Author’s calculations based on data from Hansen et al. (2013).
20Figure 6: Distribution of baseline forest cover and deforestation in surveyed and non-surveyed communes
Source: Author’s calculations based on data from Hansen et al. (2013).
21Figure 7: Average commune land area dedicated to perennial vs annual crops
Source: Author’s calculations based on the commune module of the VARHS dataset.
22Figure 8: Coefficient plots from nonparametric regressions of irrigation and crop production
Note: This figure graphs the coefficients and the corresponding standard errors clustered at the household level from
estimating equation (2).
Source: Author’s calculations based on the VARHS dataset.
23Figure 9: Coefficient plots from nonparametric regressions of forestry
Note: This figure graphs the coefficients and the corresponding standard errors clustered at the household level from
estimating equation (2).
Source: Author’s calculations based on the VARHS dataset.
24Figure 10: Spatial variation in deforestation-perennial land area relationship
Source: Author’s calculations from VARHS and Hansen et al. (2013) data sets. The estimation of coefficients is described in
the text.
25Figure 11: Province-specific estimates of share of households with tenure and deforestation
Lao Cai
Phu Tho
Lai Chau
Dien Bien
Nghe An
Quang Nam
Khanh Hoa
Dak Lak
Dak Nong
Lam Dong
Long An
-2 0 2 4
Source: Author’s calculations from VARHS and Hansen et al. (2013) data sets. The estimation of coefficients is described in
the text.
26References
Angelsen, A. (1999). ‘Agricultural expansion and deforestation: modeling the impact of population,
market forces and property rights’. Journal of Development Economics, 58(1): 185–218.
Angelsen, A., and Kaimowitz, D. (2001). ‘When does technological change in agriculture promote
deforestation’. In Trade offs or synergies?: Agricultural intensification, economic development
and the environment. CAB International, Wallingford, Oxon, UK.
Bohn, H., and Deacon, R. T. (2000). ‘Ownership risk, investment, and the use of natural resources’.
American Economic Review, 90(3): 526–549.
Castella, J.-C., Boissau, S., Thanh, N. H., and Novosad, P. (2006). ‘Impact of forestland allocation on
land use in a mountainous province of Vietnam’. Land Use Policy, 23(2): 147–160.
Deacon, R. (1994). ‘Deforestation and the rule of law in a cross-section of countries’. Land Eco-
nomics,(): 414–430.
Deininger, K., and Jin, S. (2006). ‘Tenure security and land-related investment: Evidence from
Ethiopia’. European Economic Review, 50(5): 1245–1277.
Do, Q.-T., and Iyer, L. (2008). ‘Land titling and rural transition in Vietnam’. Economic Development
and Cultural Change, 56(3): 531–579.
Feder, G. (1987). ‘Land ownership security and farm productivity: evidence from Thailand’. The
Journal of Development Studies, 24(1): 16–30.
Ferreira, S., and Vincent, J. R. (2010). ‘Governance and timber harvests’. Environmental and Resource
Economics, 47(2): 241–260.
Hansen, M. C., Potapov, P. V., Moore, R., Hancher, M., Turubanova, S., Tyukavina, A., Thau, D.,
Stehman, S., Goetz, S., Loveland, T., et al. (2013). ‘High-resolution global maps of 21st-
century forest cover change’. Science, 342(6160): 850–853. Retrieved from Dataavailable:"http://
earthenginepartners.appspot.com/science-2013-global-forest"
Hirsch, P., Mellac, M., and Scurrah, N. (2015). ‘The political economy of land governance in Vietnam’.
Vientiane: Mekong Region Land Governance Project,(): .
Hoang, M., Do, T., Van Noordwijk, M., Pham, T., Palm, M., To, X., Doan, D., Nguyen, T., and Hoang,
T. (2010). ‘An assessment of options for reducing emissions from all land uses in Vietnam: ready
for REDD’. Informe nacional. ASB Partnership for the Tropical Forest Margins, Nairobi, Kenya.
85p,(): .
Jadin, I., Vanacker, V., and Hoang, H. T. T. (2013). ‘Drivers of forest cover dynamics in smallholder
farming systems: the case of Northwestern Vietnam’. Ambio, 42(3): 344–356.
Kemper, N., Ha, L. V., and Klump, R. (2015). ‘Property rights and consumption volatility: Evidence
from a land reform in Vietnam’. World Development, 71(): 107–130.
Kubitza, C., Krishna, V. V., Urban, K., Alamsyah, Z., and Qaim, M. (2018). ‘Land property rights,
agricultural intensification, and deforestation in Indonesia’. Ecological Economics, 147(): 312–
321.
Lawry, S., Samii, C., Hall, R., Leopold, A., Hornby, D., and Mtero, F. (2017). ‘The impact of land
property rights interventions on investment and agricultural productivity in developing countries:
a systematic review’. Journal of Development Effectiveness, 9(1): 61–81.
Linde-Rahr, M. (2005). ‘Extractive non-timber forestry and agriculture in rural Vietnam’. Environment
and Development Economics, 10(3): 363–379.
Liscow, Z. D. (2013). ‘Do property rights promote investment but cause deforestation? Quasi-
experimental evidence from Nicaragua’. Journal of Environmental Economics and Management,
65(2): 241–261.
Markussen, T. (2008). ‘Property rights, productivity, and common property resources: insights from
rural Cambodia’. World Development, 36(11): 2277–2296.
Markussen, T. (2015). ‘Land issues in Vietnam 2006-14: Markets, property rights, and investment’.
WIDER Working Paper, No. 2015/088(): .
27You can also read


