Local and Remote Visualization Tech-niques for Interactive Direct Volume Rendering in Neuroradiology1
←
→
Page content transcription
If your browser does not render page correctly, please read the page content below
infoRAD                                                                                                                                          1561

                            Local and Remote
                            Visualization Tech-
                            niques for Interactive
                            Direct Volume Render-
                            ing in Neuroradiology1
                            Bernd F. Tomandl, MD ● Peter Hastreiter, PhD ● Christof Rezk-Salama,
                            Dipl-Inf ● Klaus Engel, Dipl-Inf ● Thomas Ertl, PhD ● Walter J. Huk, MD
                            Ramin Naraghi, MD ● Oliver Ganslandt, MD ● Christopher Nimsky, MD
                            Knut E. W. Eberhardt, MD

                            The increasing capabilities of magnetic resonance (MR) imaging and mul-
                            tisection spiral computed tomography (CT) to acquire volumetric data
                            with near-isotropic voxels make three-dimensional (3D) postprocessing a
                            necessity, especially in studies of complex structures like intracranial ves-
                            sels. Since most modern CT and MR imagers provide limited postpro-
                            cessing capabilities, 3D visualization with interactive direct volume ren-
                            dering requires expensive graphics workstations that are not available at
                            many institutions. An approach has been developed that combines fast
                            visualization on a low-cost PC system with high-quality visualization on a
                            high-end graphics workstation that is directly accessed and remotely con-
                            trolled from the PC environment via the Internet by using a Java client.
                            For comparison of quality, both techniques were applied to several neuro-
                            radiologic studies: visualization of structures related to the inner ear, intra-
                            cranial aneurysms, and the brainstem and surrounding neurovascular
                            structures. The results of pure PC-based visualization were comparable
                            with those of many commercially available volume-rendering systems. In
                            addition, the high-end graphics workstation with 3D texture-mapping
                            capabilities provides visualization results of the highest quality. Combining
                            local and remote 3D visualization allows even small radiologic institutions
                            to achieve low-cost but high-quality 3D visualization of volumetric data.

Abbreviations: DICOM ⫽ Digital Imaging and Communications in Medicine, MCA ⫽ middle cerebral artery, MIP ⫽ maximum-intensity projec-
tion, SSD ⫽ shaded-surface display, 2D ⫽ two-dimensional, 3D ⫽ three-dimensional

Index terms: Computed tomography (CT), image processing ● Computed tomography (CT), three-dimensional, 10.12117 ● Computed tomography
(CT), volume rendering ● Computers ● Magnetic resonance (MR), image processing ● Magnetic resonance (MR), three-dimensional, 10.121419

RadioGraphics 2001; 21:1561–1572
1From   the Division of Neuroradiology (B.F.T., W.J.H., K.E.W.E.), Computer Graphics Group (P.H., C.R.S.), and Department of Neurosurgery (P.H.,
R.N., O.G., C.N.), University of Erlangen-Nuremberg, Schwabachanlage 6, D-91054 Erlangen, Germany; and the Visualization and Interactive Systems
Group, University of Stuttgart, Germany (K.E., T.E.). Presented as an infoRAD exhibit at the 2000 RSNA scientific assembly. Received March 12, 2001;
revision requested May 23 and received June 6; accepted June 18. Address correspondence to B.F.T. (e-mail: bernd.tomandl@stud.uni-erlangen.de).
©
 RSNA, 2001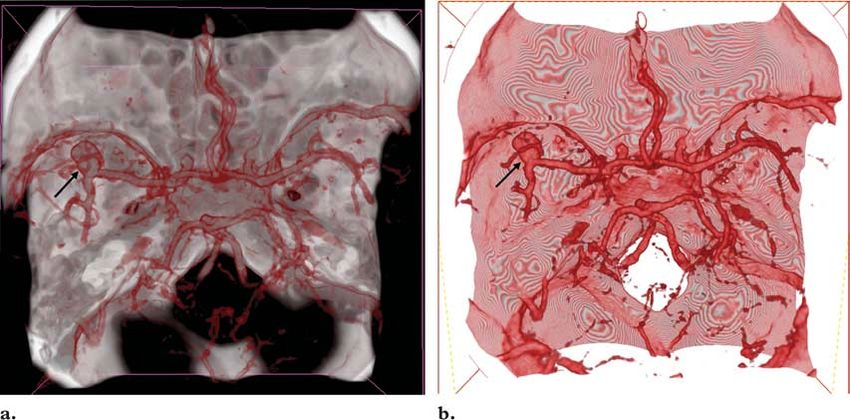
1562   November-December 2001                                              RG f Volume 21     ●   Number 6

                 Introduction                          developments like the VolumePro board (Mitsu-
Interactive three-dimensional (3D) visualization       bishi Electric, Tokyo, Japan) (11) or GeForce
is a prerequisite for comprehensive analysis and       graphics boards (nVidia, Santa Clara, Calif) will
understanding of volumetric data from computed         soon enable real-time volume rendering with high
tomography (CT) and magnetic resonance (MR)            quality even on personal computers.
imaging. When one is dealing with a large num-            In this article, two approaches to direct volume
ber of high-resolution images, interactive multi-      rendering are presented, which consist of a low-
planar reformation is mandatory for a first inspec-    cost, PC-based direct volume-rendering system
tion of the data (1,2). Investigation of complex       and a high-end graphics computer with hardware-
3D structures like the intracranial vasculature        accelerated sophisticated visualization software,
requires 3D visualization, which enables the in-       remotely controlled from the PC system. These
vestigator to follow the vessels and to simulate the   systems are combined into a low-cost, high-end
display of digital subtraction angiography. These      3D visualization tool. This method was applied to
methods are called CT angiography and MR an-           several neuroradiologic investigations, which are
giography and are widely used for investigation of     presented in this article.
intra- and extracranial vessels (3). In addition, 3D
visualization is often helpful for surgical planning             Visualization Methods
(4). However, there are no defined standards for
application of 3D visualization tools, and the         General Considerations
same data will give completely different informa-      The images provided by sectional imaging tech-
tion when presented with several visualization         niques (CT, MR imaging, ultrasonography) show
algorithms like maximum-intensity projection           the originally 3D objects in two-dimensional (2D)
(MIP), shaded-surface display (SSD), and direct        sections. It is up to the viewer to mentally recon-
volume rendering (5,6). MIP and SSD have been          struct the structures (eg, bones, vessels, cranial
widely used for visualization of medical data be-      nerves) from the section images. For a 3D dis-
cause these methods provide fast “volume render-       play, the data have to be transferred to a worksta-
ing” by using only about 10% of the image data         tion, where a volume is created out of the sec-
(7).                                                   tions. Multiplanar reformation is an excellent tool
    Owing to the rapid improvements in computer        for getting a better idea about the relations of 3D
power and memory size in recent years, MIP and         objects within a volume, especially when used
SSD are being replaced by direct volume render-        interactively (12). Although multiplanar reforma-
ing (8 –10), which is now available on commercial      tion is still a 2D method, it has the advantage that
workstations, allowing fast and direct 3D visual-      no information is lost. When an isotropic volume
ization of the complete information within volu-       is used, axial, coronal, sagittal, and all kinds of
metric data. There are enormous differences in         curved planes can be reconstructed with the same
the quality of images created with direct volume       quality as the source images (2).
rendering, which depend on both hardware and              There are several techniques for extracting the
software. Low-end, low-cost systems often pro-         information of interest from a volume. In all of
vide inferior image quality in comparison with         these methods, an imaginary ray from a defined
high-end systems. Since the technical develop-         viewing position is traced through the volume to a
ment of computer hardware and software is in-          screen behind it, where the extracted object is
credibly fast, a visualization system should pro-      displayed. The most commonly used methods for
vide the user with good image quality and be in-       3D visualization are MIP, SSD, and direct vol-
expensive and thus easy to replace. New technical      ume rendering. In the remainder of this section,
                                                       we present the typical features of these methods,
                                                       with a focus on the different ways of applying di-
                                                       rect volume rendering.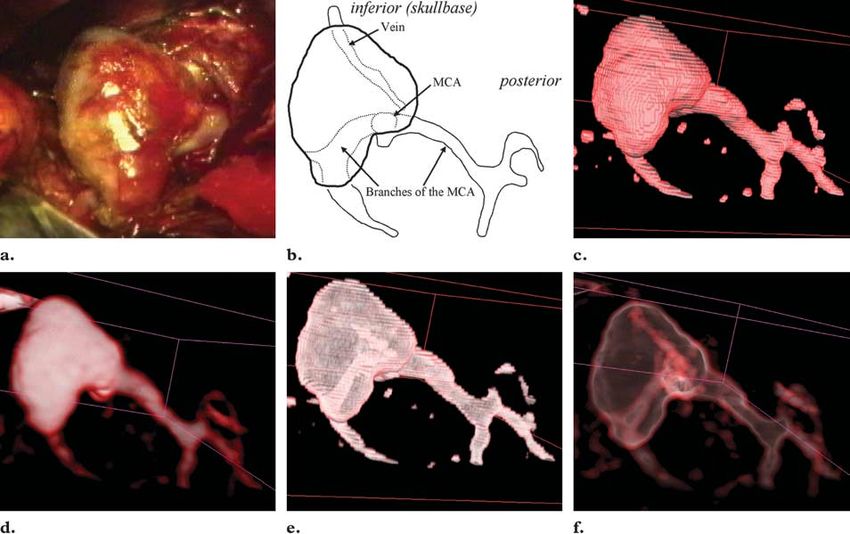
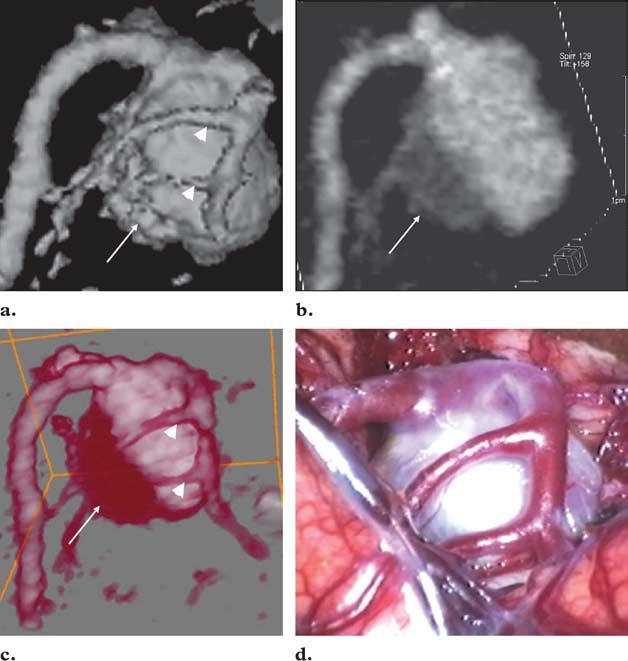
RG f Volume 21       ●   Number 6                                                             Tomandl et al    1563

Figure 1. Demonstration of different results depending on the applied vi-
sualization technique. Detailed analysis of an intracranial aneurysm with par-
tial thrombosis of the left middle cerebral artery (MCA) was performed, and
the results were compared with intraoperative findings. SSD, MIP, and di-
rect volume rendering were used to produce an anterolateral view (skull base
on top). (a) SSD image shows the aneurysm and small MCA branches (ar-
rowheads), thus providing good information about the shape of the aneurysm
and related vessels (depth information). It is not possible to differentiate the
thrombus (arrow) from the blood-filled part of the aneurysm (loss of bright-
ness information). (b) MIP image shows the thrombus (arrow), thus provid-
ing some brightness information. The MCA branches are not visualized (loss
of depth information). (c) High-resolution image created with direct volume
rendering shows both the MCA branches (arrowheads) and the thrombus
(arrow), thus providing brightness and depth information. (d) Photograph
shows intraoperative findings. (Fig 1d courtesy of Michael Buchfelder, MD,
University of Erlangen-Nuremberg, Germany.)

MIP and SSD                                                    direction, it is possible to get some information
MIP and SSD are still widely used for 3D visual-               about the brightness of an object (eg, differentia-
ization of volumetric data (Fig 1a, 1b). A feature             tion of calcification and a contrast material–filled
they have in common is that only one layer of                  blood vessel), but the depth information is lost
voxels within the volume is used for visualization             (we cannot say what is in front or behind) (Fig
(2,9), leading to loss of information. With MIP,               1b).
only one layer of the brightest voxels parallel to
the viewing ray is used for display. All other infor-
mation is ignored. Thus, from a given viewing
1564   November-December 2001                                                      RG f Volume 21       ●   Number 6

                 Figure 2. Effect on image quality of different algorithms for direct volume rendering. (a) Top:
                 Diagram shows an approach based on bilinear (2D) interpolation, which requires three copies of
                 the original volume consisting of sections in three orthogonal directions (object aligned). The vol-
                 ume with sections most parallel to the viewing plane (the view port) is chosen, depending on the
                 viewing direction. Bottom: Anteromedial view of the inner ear created from spiral CT data with
                 this approach clearly shows line artifacts (arrows). The best image quality is achieved when the
                 viewing direction is parallel to one of the planes. (b) Top: Diagram shows trilinear (3D) interpola-
                 tion, which allows rendering of sections parallel to the viewing plane, independent of the viewing
                 direction (“view port aligned”). Bottom: Corresponding anteromedial view shows the structures of
                 the inner ear without artifacts.

    The opposite is true for SSD. This technique            Direct Volume Rendering
uses the first layer of voxels lying within defined         Direct volume rendering uses all of the informa-
threshold values for display (2,9). Thus, the               tion contained in a volume; thus, there is theoreti-
brightness information is lost. For example, dif-           cally no unwanted loss of information (9). By as-
ferentiation of calcification or thrombosis within a        signing a specific color and opacity value to every
blood vessel is not possible (Fig 1a). However,             attenuation or signal intensity value of the CT or
the depth information is preserved. When an arti-           MR imaging data, groups of voxels are selected
ficial light source is used (shading), SSD gives a          for display. The information from all of these vox-
good impression of the shape of a 3D object.                els is collected along the viewing ray, and the in-
    Owing to these limitations, image analysis              formation from every voxel is integrated into the
should not be based on MIP or SSD images                    resulting image on the screen. Meaningful 3D
alone. Since the information provided by MIP                representations of even overlying structures like
and that provided by SSD complement each                    intracranial vessels within the skull are possible,
other, the methods can be combined if direct vol-           depending on the selected opacity (high opacity
ume rendering is not available. Within the medi-            produces low transparency and vice versa). Both
cal community, there is still some confusion                brightness information and depth information are
about the nomenclature of “volume-rendering”                presented (Fig 1c).
techniques. From the point of view of a computer               There are various rendering algorithms for
scientist, MIP and SSD are types of volume ren-             both the PC and the high-end workstation. The
dering in which only one layer of voxels is used            popular “shear-warp” approach (13) is often used
for visualization. In the medical literature, the           in commercially available workstations. In this
term volume rendering is reserved for the technique         approach, the sections of a volume are set parallel
described next, in which all voxels of a volume are         to the coordinate axes of the rectilinear volume
considered for visualization.                               data grid (“object-aligned” sections) (Fig 2a). A
                                                            2D texture-based variant of the shear-warp algo-
                                                            rithm was used for our local PC-based direct vol-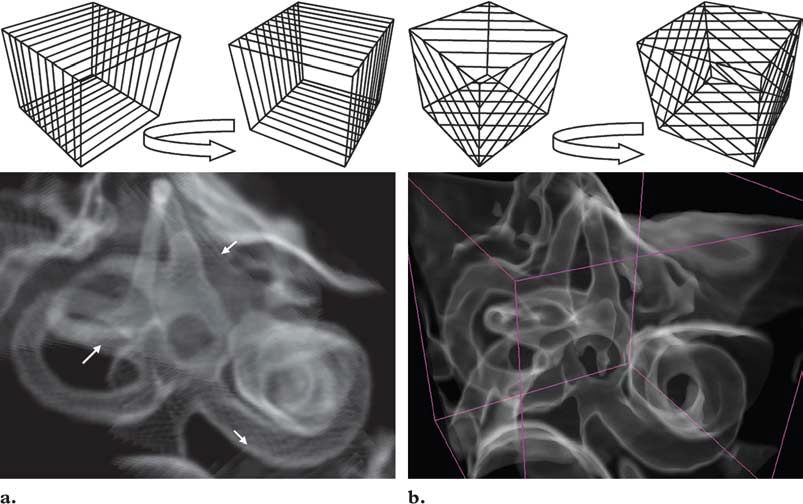
RG f Volume 21      ●   Number 6                                                            Tomandl et al    1565

Figure 3. Diagram of the data stream in a local network. The DICOM images
obtained with a CT scanner and MR imager are transferred to the local PC. Then,
the image data are transferred to the visualization (Vis) server, which is remotely
controlled from the PC environment via the Java client. FTP ⫽ file transfer proto-
col, GUI ⫽ graphical user interface, IRIX SGI ⫽ IRIX operating system (Silicon
Graphics, Mountain View, Calif), NT ⫽ Windows NT (Microsoft, Redmond,
Wash).

ume-rendering system. This approach requires us               allows visualization of volume data with any de-
to keep three copies of the data set in the main              vice with minimal graphics capabilities, anywhere
memory, one set of sections for each section di-              in the world. Local rendering makes use of
rection. Despite the high memory requirements,                Java3D, the 3D extension of the Java program-
the major drawback of the 2D texture-based                    ming language. An approach similar to the shear-
implementation is the missing spatial interpola-              warp approach that makes use of locally available,
tion. As a result, the images contain visual arti-            low-cost 2D texture-mapping hardware was real-
facts, especially when small objects are visualized           ized. First, the data from CT and MR imaging
and zoomed closely (Fig 2a). The image appear-                were electronically retrieved from the imagers via
ance can be improved by using 2D multitexture                 a local-area network and a Digital Imaging and
interpolation, in which additional sections are               Communications in Medicine (DICOM) inter-
calculated (14).                                              face (Fig 3). The personal data of the patients
    If 3D textures are supported by hardware, it is           were removed from the image headers for data
possible to render sections parallel to the image             protection and privacy.
plane with respect to the current viewing direc-                 The Java client displays the data in a sectioning
tion (Fig 2b). However, if the viewing matrix                 tool, which allows inspection of the section im-
changes, these view port–aligned sections must be             ages. A subregion of the data can be selected and
recomputed. Since trilinear texture interpolation             visualized in 3D with the Java3D renderer. A
is supported by the hardware of the remote work-              frame rate of three to eight frames per second is
station, it can be performed at interactive frame             possible with this setup, depending on the data
rates without distracting artifacts (15).                     size.
                                                                 Since Java3D is a platform-independent graph-
          Materials and Methods                               ics programming interface, it does not allow use
                                                              of the special features of modern low-cost graph-
Local Volume Rendering                                        ics adapters. The advances of these graphics
For local rendering, a desktop PC (Pentium III                adapters, which were mainly developed for com-
processor [Intel, Santa Clara, Calif], 500 MHz,               puter games, are enormous. To make use of the
128 Mbytes of random-access memory) equipped                  newest rendering features, like multitextures, we
with a GeForce256 graphics adapter (nVidia)                   also developed a client based on the C⫹⫹ pro-
with 32 Mbytes of double-data random-access                   gramming language and the OpenGL standard
memory was used as the local client. The client               that allows us to access the graphics hardware
application was implemented with Java and                     directly, without the additional abstraction layer
Java3D. Java, a programming language for the                  introduced by Java3D. This client provides even
Internet (16), allows one to use the same applica-            better image quality and rendering speed due to
tion from any kind of machine: a PC, a Macin-                 the use of multitexturing hardware for trilinear
tosh (Apple Computer, Cupertino, Calif), a net-               interpolation (14).
work computer, or even new technologies like
personal digital assistants (PDAs) or Internet
screen phones (17). This platform independence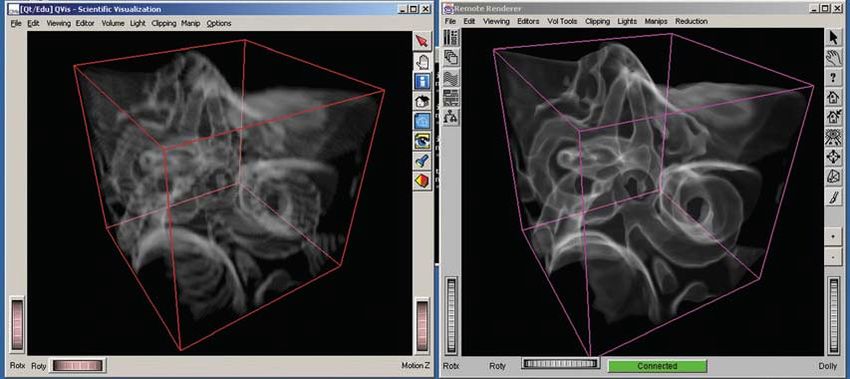
1566   November-December 2001                                                     RG f Volume 21      ●   Number 6

           Figure 4. Anterolateral view of the inner ear created from CT data with direct volume rendering.
           Computer screen shows the results of local (left) and remote (right) rendering within a Microsoft Win-
           dows environment. The difference in image quality is obvious. Although the local renderer offers real-
           time interactivity, the performance of the remote renderer depends on the Internet connection. In our
           experimental setup, frame rates of three frames per second could be achieved.

   This approach allows use of a low-cost PC                server, the visualization process is interactively
connected to the MR imager and CT scanner and               controlled from the local PC via the Java-based
provides the user with good interaction capabili-           client (18) (Fig 3). Mouse interactions and key-
ties due to small latencies. However, it yields re-         board input are sent from the local PC to the
duced image quality when compared with special-             workstation, which immediately renders new im-
purpose high-end graphics hardware.                         ages and sends a stream of resulting images back
   To enable the user to access remotely available          to the PC (19). The images are compressed for
high-end graphics hardware, the Java client also            the network transfer to allow remote visualization
allows one to display and interact with remotely            on low-bandwidth network connections. We tested
generated images (Fig 4). For this purpose, the             a number of different connections, ranging from
volume data have to be transferred from the local           high-speed research networks down to Integrated
machine to the remote visualization server.                 Services Digital Network (ISDN) connections.
                                                               The data size and image size of this setup allow
Remote Volume Rendering                                     frame rates of up to 10 frames per second, de-
The remote 3D visualization was performed on                pending on the data exchange rate. In our experi-
an Octane workstation (R10000 processor, 250                mental setup, with the local PC in Erlangen, Ger-
MHz) with MXE graphics hardware (Silicon                    many, and the workstation located in Stuttgart,
Graphics), which provides 4 Mbytes of texture               200 km away, we achieved an average frame rate
memory. Rendering was performed with the 3D                 of three frames per second using standard Inter-
texture-mapping hardware of the graphics work-              net access via the German research network.
station, which allows high image quality and high           When this approach was presented at the RSNA
interaction rates. These results are possible due to        meeting in Chicago, Ill, in November 2000, a
the trilinear interpolation of the original data pro-       frame rate of about one frame per second was
vided by the 3D texture hardware and the high-              achieved between the PC located in Chicago and
resolution shading provided by postinterpolation            the workstation in Stuttgart.
lookup tables.                                                 Remote volume rendering allows the sharing of
   The local PC uploads the data to the remote              expensive remote graphics hardware via the Inter-
graphics workstation via the Internet. In our               net by using a simple client computer. By con-
setup, we used a fast Internet connection (155              necting more clients to the rendering server, the
Mbits/sec) provided by the German research net-             collaboration of many experts from different loca-
work. For a CT angiography data set of 150 im-              tions is possible. However, owing to signal propa-
ages, about 3 minutes of upload time was neces-             gation delays, latencies are introduced, which are
sary. Once the data are loaded into the graphics            noticeable as a delayed reaction to user input.
                                                            Especially for the remote visualization setup in
                                                            Chicago, this was the main drawback. Combining
                                                            the local and remote visualization approaches can
                                                            prevent these latencies. During interaction, local
RG f Volume 21 ● Number 6 Tomandl et al 1567
graphics hardware is used to provide low latencies To investigate the use of the two systems under
and fast rendering. After the user stops interaction, routine conditions, the CT angiography data of
an image with high resolution and high quality is the five patients with intracranial aneurysms were
requested from the remote graphics workstation. transferred to both the local and remote worksta-
tions directly after the investigation. The average
Neuroradiologic Studies time for the complete visualization process in our
For comparison of the local and remote direct experimental setup, including data transfer, was
volume-rendering systems, we used the CT an- 15–25 minutes, depending on the complexity
giography data of five patients with intracranial of the vascular structures. This is already fast
aneurysms and the MR imaging data of two pa- enough for this method to be used in the clinical
tients who had been examined for suspected neu- situation of a patient with subarachnoid hemor-
rovascular compression syndromes. The CT rhage under emergency conditions. CT angiogra-
studies were performed on a multisection spiral phy is a well-known tool for therapy planning of
CT scanner (Somatom Plus4 VZ; Siemens, Er- intracranial aneurysms. In contrast to the results
langen, Germany) with the following parameters: achieved with digital subtraction angiography, not
collimation ⫽ 4 ⫻ 1 mm, table feed ⫽ 2.7 mm per only the shape of the aneurysms but also the rela-
rotation, section thickness ⫽ 1.25 mm, increment ⫽ tion to the skull base, thromboses, and calcifica-
0.5 mm, field of view ⫽ 120 mm2, 100 mL of tions are clearly demonstrated (21–24). An opti-
contrast medium, flow rate of 4 mL/sec. The MR mal quality of 3D images is mandatory for ex-
imaging studies were performed on a 1.5-T sys- tracting all available information from the data.
tem (Magnetom Symphony; Siemens) by using a As demonstrated in Figure 1, MIP and SSD can
3D constructive interference in the steady state be used in combination to demonstrate both the
(CISS) sequence with 0.7-mm-thick sections. brightness and depth information of the data.
For the CT angiographic studies, additional However, only direct volume rendering has the
reconstruction of the temporal bones was per- capability of showing the complete information in
formed (field of view ⫽ 60 mm2, high-resolution a single 3D image. For therapy planning, high-
kernel) so that these data could be used for visual- quality close-up views are important.
ization of the structures of the inner ear. In our setup, the PC-based system was used to
get fast information about the shape and location
Results of an aneurysm with real-time interaction. Once
To demonstrate the difference in visualization the ideal viewing position for therapy planning
quality between the two volume-rendering sys- was found on the PC system, the selected area
tems, we applied the methods to visualize the was remotely evaluated on the high-end system
structures of the inner ear and intracranial aneu- and high-resolution 3D images were created. The
rysms from spiral CT data and for 3D display of performances of both systems in visualization of
neurovascular structures surrounding the brain- intracranial aneurysms were compared (Figs 5,
stem from MR imaging data. Three-dimensional 6). Although the PC-based system allowed very
visualization of the inner ear from CT data per- fast, real-time visualization of good quality, the
formed with direct volume rendering without ex- close-up views were still disturbed by line arti-
plicit segmentation requires optimal quality to facts. The high-end workstation produced clearer
obtain clear and meaningful images (20). Thus, images that showed more detail information, es-
this is a suitable application for getting an impres- pecially on the semitransparent images. The abil-
sion of the visualization capabilities of a direct ity to create semitransparent images that show
volume-rendering system. As mentioned earlier, even structures lying behind the aneurysm with-
we used spiral CT scans of the normal temporal out choosing another viewing position is an ad-
bone. The small field of view of 60 mm2 not only vantage of the remote rendering system. This ca-
leads to better in-plane resolution but also allows pability can be used to demonstrate hidden struc-
preselection of the subvolume containing mainly tures from the viewpoint of the neurosurgeon’s
the required information. Figures 2 and 4 demon- surgical microscope. Of course, the ability to in-
strate the results achieved with both systems. Al- teractively move the structures rather than look-
though the PC-based system provided a coarse ing at static images like those in Figure 6 supports
display of the inner-ear structures due to interpo- detail analysis.
lation artifacts, these structures can be recognized
much more clearly on images created with the
high-end graphics system by using trilinear inter-
polation.1568 November-December 2001 RG f Volume 21 ● Number 6
Figure 5. Comparison of two different direct volume-rendering systems applied to visualization of an
intracranial aneurysm of the left MCA (arrow). (a) Superior opaque view created with the remote high-
end system shows the vessels and skull base. (b) Corresponding view created with the PC-based system
shows more artifacts within the skull base. There is no significant difference in quality in the visualization
of vascular structures.
Figure 6. Comparison of two different direct volume-rendering systems applied to detailed analysis of an intracra-
nial aneurysm of the MCA. All images are lateral views. (a) Image from the intraoperative video shows the neurosur-
geon’s view. The large aneurysm hides adjacent vessels, thus necessitating surgical manipulations to obtain more in-
formation. (Courtesy of Christian Strauss, MD, University of Erlangen-Nuremberg, Germany.) (b) Diagram shows
the aneurysm and adjacent vessels. (c) Opaque image created with PC-based direct volume rendering clearly shows
the shape of the aneurysm. However, the image quality is reduced by line artifacts. (d) Opaque image created with
the suggested remote direct volume-rendering approach shows the aneurysm without visible artifacts. (e) Trans-
parent image created with PC-based direct volume rendering shows only a rough outline of the vasculature behind
the aneurysm due to artifacts. (f) Transparent image created with remote direct volume rendering shows a view
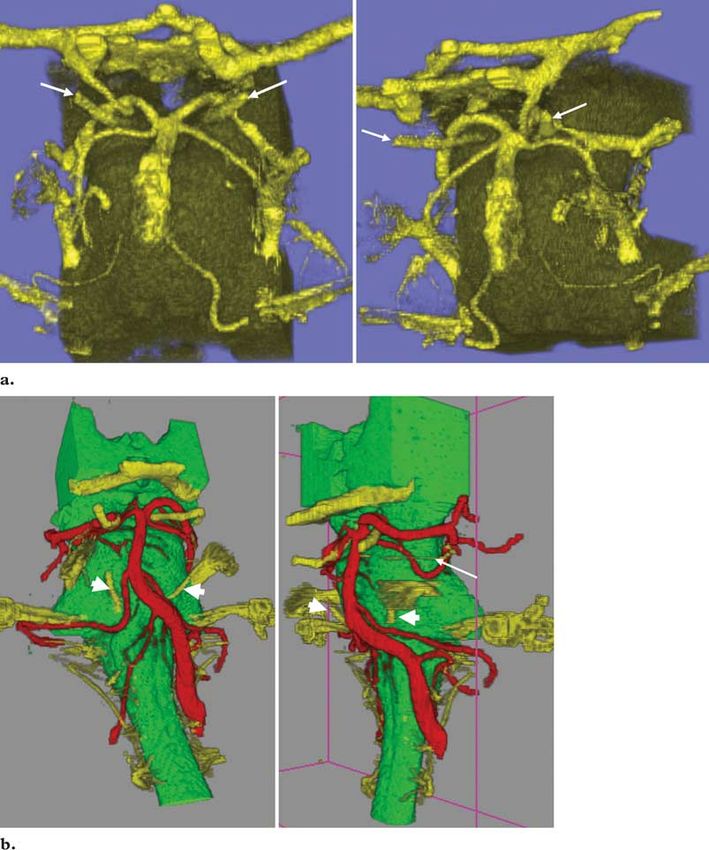
“through” the aneurysm, thus providing additional information about the adjacent vasculature.RG f Volume 21 ● Number 6 Tomandl et al 1569 Figure 7. Three-dimensional visualization of the cranial nerves from the MR imaging data of two patients. Frontal (left) and frontolateral (right) views were created. Two subvolumes had been created prior to the visualization, which contained the brainstem and the structures within the ce- rebrospinal fluid space. (a) Image created with PC-based direct volume rendering shows the larger structures adjacent to the brainstem, such as the oculomotor nerves (arrows), as well as the space between the posterior cerebral artery and superior cerebellar artery. It is not possible to visualize very small structures like the trochlear nerves. (b) High-resolution image created with remote di- rect volume rendering shows the brainstem and related structures. Even very small structures like the trochlear nerve (thin arrow) and the abducent nerves (thick arrows) are visible. The remote system allows assignment of different colors to differentiate nerves (yellow) and vessels (red). To evaluate the capabilities of the two visual- created subvolumes of the brainstem and the ization systems for MR imaging data, we used the structures within the cerebrospinal fluid space data of the two patients investigated for suspected (26). The PC-based system was able to create neurovascular compression syndromes (25). For meaningful 3D images of sufficient quality that a better understanding of the 3D relationships of clearly demonstrated the relationships of the the small neurovascular structures in the area of neurovascular structures (Fig 7). However, the the brainstem, we used direct volume rendering following semiautomatic segmentation, which
1570   November-December 2001                                              RG f Volume 21     ●   Number 6

close-up views demonstrated the typical line arti-     eurysm within a narrow field of view (eg, 60
facts, so that very small structures like the troch-   mm2), which facilitates detail analysis. An opti-
lear nerve could not be identified. The images         mal volume would contain nothing more than the
created with the high-end system demonstrated          structures to be visualized.
the trochlear nerve in both cases, thus allowing          It is often stated that with volume rendering
higher-quality visualization.                          there is no information loss from the volume data
    Both systems allowed interactive manipulation      and extensive editing and segmentation are not
of the data, with some latency when the remote         necessary (8,9). In fact, at this time, some of the
system was used. Nevertheless, frame rates of          commercially available products are not able to
three frames per second could be achieved, which       handle large numbers of high-resolution images;
is sufficient for fine-tuning following fast, real-    therefore, reduction of the image matrix to 2562 is
time visualization of the volume on the PC-based       often used for faster manipulation of the data and
system.                                                thus less need of memory. Obviously, this tech-
                                                       nique leads to information loss and reduced qual-
                  Discussion                           ity of the 3D images, which are unfavorable fac-
The quality of 3D visualization depends on mul-        tors when dealing with small objects, as in neuro-
tiple factors. Of highest importance is the quality    radiologic studies.
of the source images. Although in-plane resolu-           The quality of the 3D images depends strongly
tions of less than 0.5 mm are easily achieved with     on the applied hardware and software. There is a
modern CT scanners and MR imagers by using             difference between rendering algorithms like the
a 5122 matrix and a narrow field of view, the          shear-warp algorithm (13), which is based on 2D
through-plane resolution in most studies will be       texture mapping, and the more challenging 3D
greater than or equal to 1 mm. Therefore, in clini-    texture mapping used in our remote workstation,
cal practice, real isotropic voxels in a volumetric    which requires specific hardware acceleration
data set are an exception. When spiral CT is           (15). At this time, only 3D texture mapping re-
used, this problem can be overcome to some de-         sults in artifact-free visualization of small struc-
gree by using smaller reconstruction increments        tures due to the calculation of parallel planes ac-
(eg, 0.5 mm), leading to higher visualization qual-    cording to the viewing position. The quality of
ity at the cost of a greater number of images; how-    visualization based on 2D texture mapping can be
ever, at this time, this technique is reasonable       enhanced by the interpolation of intermediate
only for small volumes to allow interactive ma-        sections, leading to clearer images (14).
nipulation within the renderer. For small vol-            When one is dealing with very small objects,
umes, even a collimation of 0.5 mm is technically      like the examples shown in this article, some kind
possible when multisection CT is used (1).             of segmentation will always be necessary (6). In
    Use of a narrow field of view not only provides    most cases, segmentation can be performed suffi-
higher in-plane resolution but also leads to pre-      ciently by using clip planes, which can be used
segmentation of the volume, reducing it to data of     interactively to eliminate parts of the volume to
diagnostic interest and thus facilitating 3D visual-   give a clearer view of deeper-lying structures. For
ization. It is often useful to create two data sets,   visualization of intracranial arteries from CT an-
with the first containing the whole examined vol-      giography data, it is always necessary to eliminate
ume and the second containing mainly the infor-        the upper parts of the venous system to give a free
mation of interest. When using CT angiography          view to the basilar artery when one is looking
for investigation of intracranial aneurysms, we        from above. Direct visualization of the cranial
first reconstruct the raw data from the whole          nerves from MR imaging data was possible to
circle of Willis (field of view ⫽ 120 mm2) and         some degree, but the results were not sufficient to
then create a data set containing the detected an-     provide enough information about the relation-
                                                       ships of the neurovascular structures. By semiau-
                                                       tomatically creating two subvolumes of the brain-
                                                       stem and the surrounding cerebrospinal fluid
RG f Volume 21 ● Number 6 Tomandl et al 1571
space, the visualization results were of much bet- Conclusions
ter quality. The approach of combining a local, low-cost, PC-
The presented approach offers many advan- based volume-rendering system with a remotely
tages. First, it is cost-effective, since expensive accessed high-end graphics workstation makes
specialized workstations are no longer necessary this fascinating and promising tool for 3D visual-
for every institution. Owing to the mass market of ization available to all institutions dealing with
computer games and entertainment software, PC volume data. In the near future, even high-quality
graphics accelerator boards have become more visualization will be possible on standard personal
flexible and powerful. A low-cost PC system computers equipped with modern graphics adapt-
equipped with a high-end graphics adapter (cost ers. The ability to access these workstations from
about $300) is sufficient to provide satisfactory almost anywhere will help radiologists develop
direct volume-rendering visualization for routine new applications for standardized 3D visualiza-
studies. In the near future, even hardware-accel- tion.
erated 3D texture mapping will be possible on
standard PC systems (14). In cases in which the References
highest quality is essential, the high-end hardware 1. Rydberg J, Buckwalter KA, Caldemeyer KS, et al.
and software can be accessed from the local sys- Multisection CT: scanning techniques and clinical
applications. RadioGraphics 2000; 20:1787–1806.
tem via the Java client. Since many users can use
2. Blank M, Kalender WA. Medical volume explora-
the high-end workstation, conferences about case tion: gaining insights virtually. Eur J Radiol 2000;
studies are possible. Remote rendering allows ac- 33:161–169.
cess to expensive high-end graphics workstations 3. Schwartz RB, Tice HM, Hooten SM, Hsu L, Stieg
with any Java-enabled device from anywhere in PE. Evaluation of cerebral aneurysms with helical
CT: correlation with conventional angiography
the world (16,17). Therefore, it is theoretically
and MR angiography. Radiology 1994; 192:717–
possible to view and manipulate the images via a 722.
mobile phone. The client has to be able only to 4. Kikinis R, Gleason PL, Moriarty TM, et al. Com-
display remotely generated images and send inter- puter-assisted interactive three-dimensional plan-
action events. Remote rendering introduces a ning for neurosurgical procedures. Neurosurgery
1996; 38:640 – 649.
higher latency due to the transfer of user com-
5. Johnson PT, Halpern EJ, Kuszyk BS, et al. Renal
mands from the client to the server and the trans- artery stenosis: CT angiography— comparison of
fer of rendered images back to the client. To real-time volume-rendering and maximum inten-
avoid this latency, we experimented with a combi- sity projection algorithms. Radiology 1999; 211:
nation of local and remote rendering. During in- 337–343.
6. Udupa JK. Three-dimensional visualization and
teraction with the data, local 3D graphics hard-
analysis methodologies: a current perspective. Ra-
ware is used for image generation. After the inter- dioGraphics 1999; 19:783– 806.
action, a high-quality image from the server is 7. Heath DG, Soyer PA, Kuszyk BS, et al. Three-
requested and displayed (18). dimensional spiral CT during arterial portography:
Remotely controlled visualization also allows comparison of three rendering techniques. Radio-
Graphics 1995; 15:1001–1011.
the neurosurgeon to obtain a position-controlled
8. Rubin GD, Beaulieu CF, Argiro V, et al. Perspec-
view of the surgical situation (22) without the tive volume rendering of CT and MR images: ap-
need for expensive high-end hardware. It will also plications for endoscopic imaging. Radiology
be possible to integrate this information into the 1996; 199:321–330.
surgical microscope of the microsurgeon. 9. Calhoun PS, Kuszyk BS, Heath DG, Carley JC,
Fishman EK. Three-dimensional volume render-
Although interactive use of 3D visualization is
ing of spiral CT data: theory and method. Radio-
often helpful, it has the limitation of being user Graphics 1999; 19:745–764.
dependent and thus leading to inaccurate results 10. Pretorius ES, Fishman EK. Spiral CT and three-
(9). In the future, standardized visualization dimensional CT of musculoskeletal pathology:
tools, with which defined video sequences are emergency room applications. Radiol Clin North
Am 1999; 37:953–974.
produced that can be evaluated for sensitivity and
11. Pfister H, Hardenbergh J, Knittel J, Lauer H,
specificity, should replace individual interactive Seiler L. The VolumePro real-time ray-casting
3D visualization. These standard tools can be system. In: Proceedings of SIGGRAPH ’99. New
provided by remotely accessed workstations. In York, NY: Association for Computing Machinery,
addition, specialists who could also provide the 1999; 251–260.
local institution with a report could evaluate the
findings.1572 November-December 2001 RG f Volume 21 ● Number 6
12. Prokop M. Multislice CT angiography. Eur J Ra- ization. In: de Leeuw WC, van Liere R, eds. Data
diol 2000; 36:86 –96. visualization 2000. Vienna, Austria: Springer-Ver-
13. Lacroute P, Levoy M. Fast volume rendering us- lag Wien, 2000; 167–177,291.
ing a shear-warp factorization of the viewing trans- 20. Tomandl BF, Hastreiter P, Eberhardt KE, et al.
formation. In: Proceedings of SIGGRAPH ’94. Virtual labyrinthoscopy: visualization of the inner
New York, NY: Association for Computing Ma- ear with interactive direct volume rendering. Ra-
chinery, 1994; 451– 458. dioGraphics 2000; 20:547–558.
14. Rezk-Salama C, Engel K, Bauer M, Greiner G, 21. Korogi Y, Takahashi M, Katada K, et al. Intracra-
Ertl T. Interactive volume rendering on standard nial aneurysms: detection with three-dimensional
PC graphics hardware using multi-textures and CT angiography with volume rendering— com-
multi-stage-rasterization. In: Proceedings of SIG- parison with conventional angiographic and surgi-
GRAPH ’00. New York, NY: Association for cal findings. Radiology 1999; 211:497–506.
Computing Machinery, 2000; 109 –118,147. 22. Wilkinson EP, Shahidi R, Wang B, Martin DP,
15. Ertl T, Hastreiter P. Visualization of scalar volume Adler JR, Steinberg GK. Remote-rendered 3D CT
data. In: Girod B, Greiner G, Niemann H, eds. angiography (3DCTA) as an intraoperative aid in
Principles of 3D image analysis and synthesis. cerebrovascular neurosurgery. Comput Aided
Boston, Mass: Kluwer Academic, 2000; 261–269. Surg 1999; 4:256 –263.
16. Fernandez-Bayo J, Barbero O, Rubies C, Sentis 23. Velthuis BK, Rinkel GJ, Ramos LM, et al. Sub-
M, Donoso L. Distributing medical images with arachnoid hemorrhage: aneurysm detection and
Internet technologies: a DICOM Web server and a preoperative evaluation with CT angiography. Ra-
DICOM Java viewer. RadioGraphics 2000; 20: diology 1998; 208:423– 430.
581–590. 24. Villablanca JP, Martin N, Jahan R, et al. Volume-
17. Lee SK, Peng CH, Wen CH, Huang SK, Jiang rendered helical computerized tomography an-
WZ. Consulting with radiologists outside the hos- giography in the detection and characterization of
pital by using Java. RadioGraphics 1999; 19: intracranial aneurysms. J Neurosurg 2000; 93:
1069 –1075. 254 –264.
18. Engel K, Hastreiter P, Tomandl B, Eberhardt K, 25. Johnson D, Coley SC, Brown J, Moseley IF. The
Ertl T. Combining local and remote visualization role of MRI in screening for neurogenic hyperten-
techniques for interactive volume rendering in sion. Neuroradiology 2000; 42:99 –103.
medical applications. In: Proceedings of IEEE Vi- 26. Hastreiter P, Tomandl B, Eberhardt K, Ertl T.
sualization ’00. Piscataway, NJ: Institute of Elec- Interactive and intuitive visualization of small and
trical and Electronics Engineers, 2000; 449 – 452. complex vascular structures in MR and CT. In:
19. Engel K, Sommer O, Ertl T. A framework for in- Proceedings of the Engineering in Medicine and
teractive hardware accelerated remote 3D-visual- Biology Society (EMBS), Institute of Electrical
and Electronics Engineers. Vol 20. New York,
NY: Springer-Verlag, 1998; 532–535.You can also read