FOR PUBLIC RELEASE - NICD
←
→
Page content transcription
If your browser does not render page correctly, please read the page content below
Estimating cases for COVID-19 in South Africa:

           Assessment of alternative scenarios

                       Report Update: 5 Sept 2020

              FOR PUBLIC RELEASE

                  Prepared by MASHA, HE2RO, and SACEMA

         on behalf of the South African COVID-19 Modelling Consortium

Please address all queries and comments to: Harry Moultrie at HarryM@nicd.ac.za

The projections in this report are intended for planning purposes by the South
                              African government.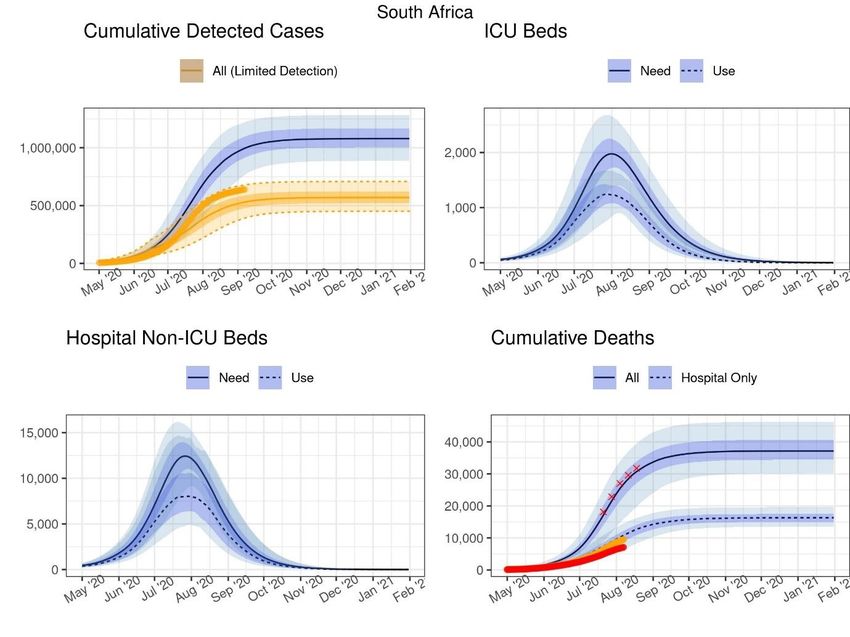
Key messages
The South African COVID-19 Modelling Consortium was established to project the spread of
the disease to support policy and planning in South Africa over the coming months. Due to the
rapidly changing nature of the outbreak globally and in South Africa, the projections are
updated regularly as new data become available. As such, projections should be interpreted
with caution. Changes in testing policy, contact tracing, and hospitalisation criteria will all
impact the cases detected as well as the number of hospital admissions and deaths that can
be positively identified as associated with COVID-19.
Given the substantial uncertainty regarding overall population susceptibility and changes in
population behaviour in reaction to the increase in cases and deaths, in this report we updated
a number of our original assumptions. We added the notion of overall behavioural
heterogeneity into our main scenario, i.e., the idea that some members of society experience
different risks and exhibit different behavioural patterns, introducing substantial variation in the
number of people that different people infect, with highly connected individuals becoming
infected earlier in the epidemic and infecting more contacts.
We also added a number of additional outputs in this report. Firstly, we now produce estimates
not only of the number of needed general hospital and ICU beds, but also of the number of
beds that were in fact used- as in all provinces only a subset of the beds needed for patients
with severe and critical disease were in fact used, due to lack of capacity or lack of treatment
seeking, or both. Secondly, we acknowledge that the officially reported COVID-19 related
deaths are only a subset of all excess natural deaths summarised from the death registry
statistics over the last months, and that many of these excess deaths might have occurred at
home- also in keeping with the fact that fewer severe COVID-19 cases were hospitalised than
previously projected. We thus now estimate both the deaths in hospital and all deaths,
regardless of whether the patient has been hospitalised at the time of death.
Our updated projections show the following:
The COVID-19 pandemic peaked in mid-July, earlier and at a lower total number of
active cases than in our optimistic scenario published in May.
The model estimates that there have been 15.20 million infections to date, equating to
25.5% (uncertainty range: 22.0%-28.6%) of the population.
Since testing guidelines and practices change, we estimate cumulative detected cases
under two scenarios i) moderate testing coverage as implemented in May and June,
and ii) a more limited testing coverage policy that prioritises testing in hospitalised
cases and in healthcare workers. Under the moderate testing scenario, cumulative
detected cases will continue to grow until 1.2 million in early November, and only
marginally so thereafter. Whereas only about 567,500 cases (447,800-707,100) were
estimated to be detected under limited testing, the actual number of detected cases
has already surpassed the median of the limited testing scenario and will likely end up
lying somewhere between these two scenarios.
The peak number of general hospital (i.e., non-ICU) beds in use was estimated to be
reached in early-August, at around 8,000 beds (when around 12,500 beds would have
been needed). The peak number of ICU beds in use was estimated to be reached
2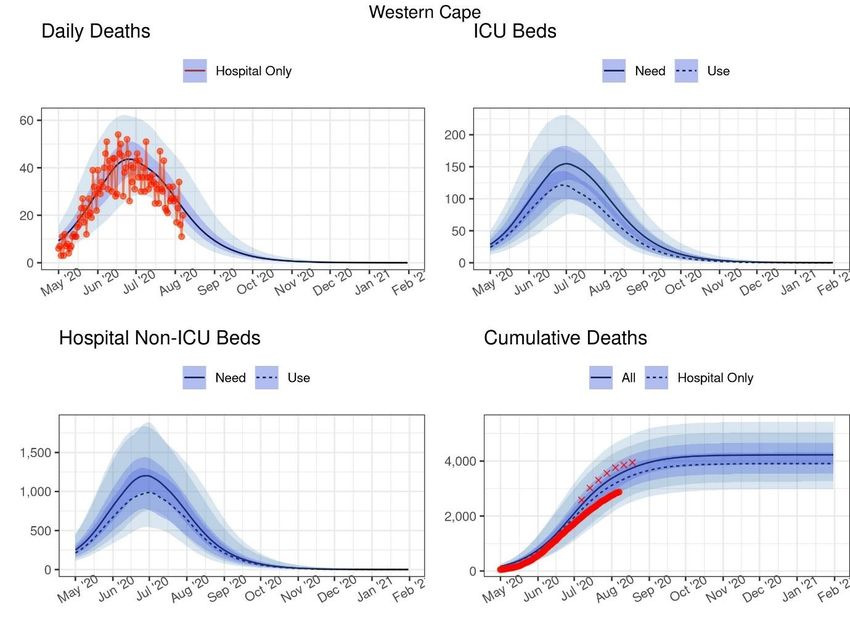
around the same time, with around 1,100 beds (when more than 2,000 beds would
       have been needed). Total deaths are estimated to continue to increase until early
       November when the cumulative number of all deaths will reach 37,000 (of which
       16,000 will have been in hospital); thereafter the growth rate will be very low.
While the number of COVID-19 cases in South Africa appears to have peaked, there is much
uncertainty in the remaining course of the epidemic, its duration and consequences. The future
of the spread of SARS-CoV-2 and the impact of COVID-19 on health and health resources
depends on many unknowns. We do not yet know whether those already infected will have
long-lasting immunity or short-term immunity, and whether this immunity will offer complete or
partial protection. In the absence of a vaccine, SARS-CoV-2 transmission remains largely
dependent on the proportion of population still susceptible, individual behaviour and the ability
of the population to adopt preventative measures like mask-wearing and practise social
distancing whilst going about their daily lives. Depending on the nature of immunity and/or the
development of a vaccine, the future of SARS-CoV-2 could become regular annual epidemics,
seasonal epidemics, epidemics occurring every few years or even sporadic, unpredictable
epidemics. It is therefore important to continue to monitor the epidemic and remain vigilant to
detect localised outbreaks as and when they occur. Additional work on modelling the impact
of the above-mentioned factors on the timing, frequency and amplitude of a future resurgence
in COVID-19 cases is currently under way.

About the South African COVID-19 Modelling Consortium
The South African COVID-19 Modelling Consortium is a group of researchers from academic,
non-profit, and government institutions across South Africa. The group is coordinated by the
National Institute for Communicable Diseases, on behalf of the National Department of Health.
The mandate of the group is to provide, assess and validate model projections to be used for
planning purposes by the Government of South Africa. For more information, please contact
Dr Harry Moultrie (harrym@nicd.ac.za).

Structure of this report
This report starts by summarising the changes made since the last set of long-term projections
and gives some context for interpreting the findings. We then report how well the model fits
developments in deaths and admissions over the last four months, and discuss the
implications of a number of scenario analyses on the projections for a sub-set of the provinces
with more advanced epidemics (Western Cape, Eastern Cape, Gauteng and KwaZulu-Natal),
We report on our most recent projections of cases, deaths and hospital and ICU beds (needed
and used) nationally and per province. We end with an assessment that summarises our
findings.

                                                                                               3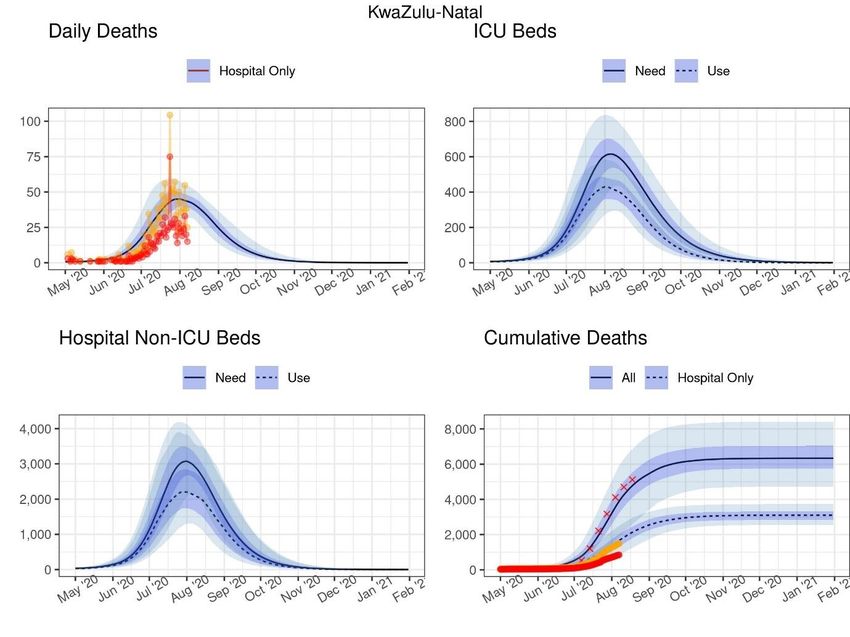
Changes since last set of long-term projections
In this section, we summarise changes that have been made to the modelling approach and
parameterization since the previously released version of the long-term projections. The main
changes are as follows:

         The spatial scale of the model is now at the district level (as opposed to the
province level, in the previous release), reflecting the population size and connectivity of each
district. Model calibration to hospital admissions and deaths is still done at the provincial level,
due to limited district-level data. While all provinces were individually calibrated, provinces with
smaller numbers of confirmed cases, hospitalisations and deaths (Free State, Limpopo,
Mpumalanga, North West, and Northern Cape) were less easily calibrated due to sparse data
at this stage. These calibrations will improve with additional data.

       Movement between districts is estimated based on aggregate cell phone mobility
data provided by Vodacom. District-to-district connectivity matrices were constructed based
on the proportion of mobile phone pings that occur in each district outside the home district.
The home district is defined as the location where a mobile device is normally located between
10pm and 4am. Separate matrices were constructed for each lockdown phase (pre-lockdown,
Level 5, Level 4, Level 3 (disaggregated) and Level 2) to reflect the average levels of
movement within each period.

       Inputs regarding the reproductive number have been updated based on analyses
by the National Institute for Communicable Diseases (NICD) for lockdown levels 5 and 41,2.
Thereafter changes in contact rates at the provincial level are updated based on reductions in
google mobility trends for places of residence3. (details see Table A1 in the Appendix).

         Instead of relying on data from international studies, local data are now used to
define the parameters on care pathways in hospital. Data-based estimates were derived
from DATCOV, the NICD’s sentinel hospital surveillance dataset, which records the details of
COVID-19 associated hospitalisations4. As only 53% of public hospitals are participating in
DATCOV, admissions would be underrepresented in the public sector. To adjust for this, we
calculated a province-specific inflation factor for general and ICU admissions based on the
total number of hospital beds available in both sectors versus the number of beds in hospitals
represented in the DATCOV dataset. This inflation factor was applied to the admissions data
and used for calibration. Both sets of admissions data are presented in the figures below, with
the inflated data referred to as “adjusted DATCOV data”. This includes the length of hospital
stay and the proportion of patients in general vs. ICU wards (see Table A1 for details).

        Mortality assumptions continue to incorporate local hospital fatality data. The
infection fatality rates used in the May projections included an allowance for asymptomatic
cases that was misspecified. This was corrected in the June publication and all updates
onwards where hospital and publicly reported fatality data were used to estimate fatality due
to COVID-19. Mortality in hospital is now estimated from the DATCOV dataset with province-
specific estimates for Eastern Cape, Gauteng, KwaZulu-Natal and Western Cape, and
national estimates for the remaining provinces. Additionally, we calculate the potential
mortality impact of not receiving necessary care, either because of patients not seeking care
or because care capacity has been breached, and the required hospital beds are no longer
available. We parameterised these additional deaths, which do not occur in hospital, by using

                                                                                                  4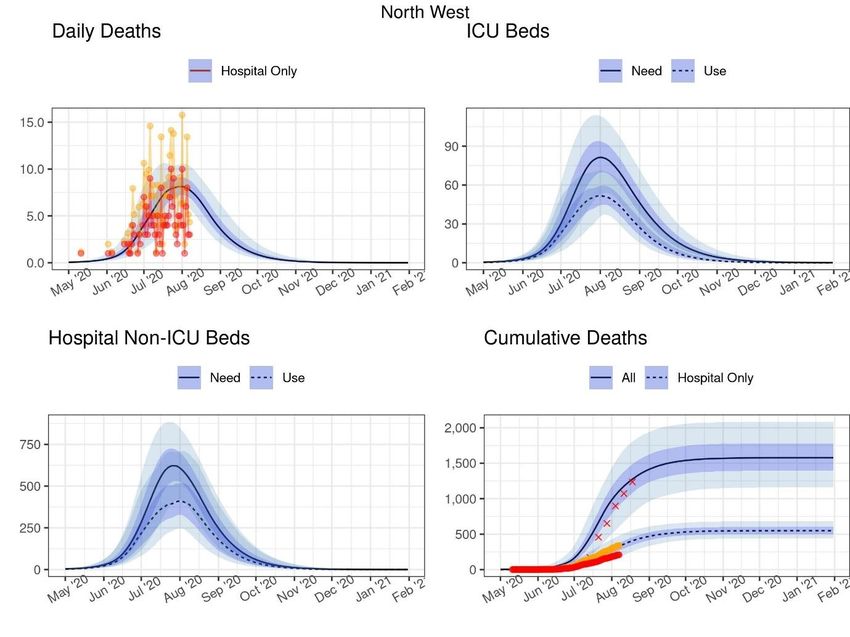
the excess mortality from natural causes estimated by the South African Medical Research
Council (MRC) on a weekly basis that compares current deaths reported to the vital registry
by way of death certificates to projections based on mortality in the same calendar week in
previous years5. While not all excess deaths will be COVID-19 deaths, the spatio-temporal
patterns of excess deaths, confirmed COVID-19 cases and officially reported COVID-19
deaths suggest that the bulk of excess deaths are from COVID-19 rather than from collateral
causes. For example, in the Western Cape Province, which has a provincial health data centre
that integrates patient level health data across facilities and services in the province6,
confirmed COVID-19 deaths are approximately two thirds of the excess deaths7. Based on
these and other data, we assume that 80% of the estimated excess deaths are due to Covid-
19, with treatment seeking for inpatient care overall reducing during periods of peak hospital
admission as a result of overwhelmed inpatient capacity.

        The model now incorporates behavioural heterogeneity as a mechanism to
explain the lower- and earlier-than-expected peak in cases, deaths and admissions in the
Western and Eastern Cape in particular. This acknowledges the fact that some members of
society experience different risks and exhibit different behavioural patterns, with highly
connected individuals becoming infected earlier in the epidemic and infecting more contacts.
It is modelled through altering the transmission function (force of infection) to decrease as
immunity builds up in the most connected individuals early on.

        The following parameters were updated: While the original paper estimated that
>90% of presymptomatic infections occurred within 2 days before the onset of symptoms, a
correction to the analysis revealed that >90% of presymptomatic infections were estimated to
occur within 4 days before symptom onset8. Additionally, the relative infectiousness of
asymptomatic infections was updated from 75% to 80%.

        The model now incorporates both the need for hospitalisations, including for
critical care, and the actual use of hospital care, informed by the fact that only a subset of
those beds predicted to be needed in most provinces were in fact used, in particular at the
ICU level, due to constraints in capacity leading to less admissions and shorter lengths of stay,
lower than expected presentation of patients for hospital care, or both.

         The model code for the provincial model has been made available under
https://sacovid19mc.github.io/.

                                                                                               5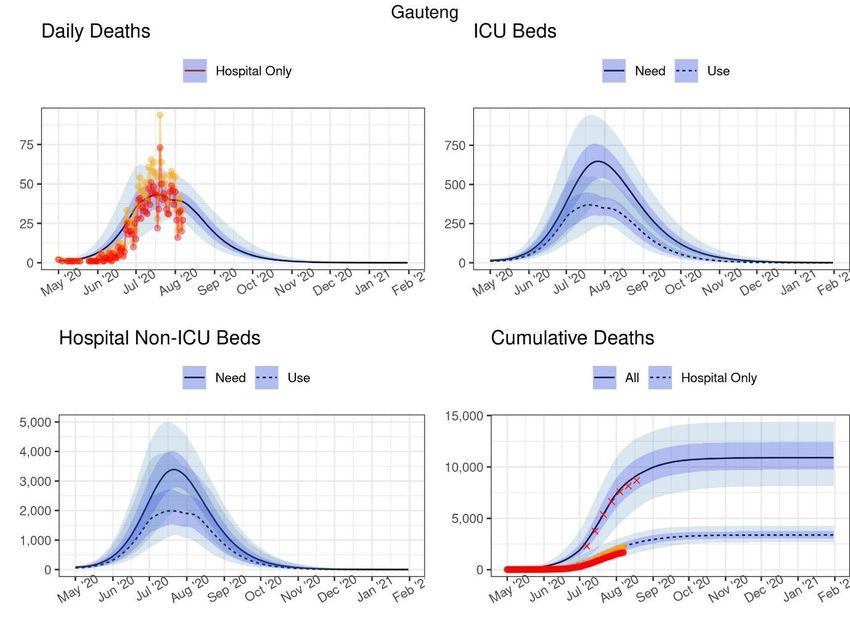
Context for interpreting projections
The results presented below must be interpreted considering the following points of context:

         Not all COVID-19 infections will be detected. Many infected individuals will be
asymptomatic or mildly symptomatic and are not likely to seek out a diagnostic test.
Additionally, owing to the severe laboratory capacity constraints in South Africa, not all
individuals can be tested even if they present for a test. Previous projections from the NCEM
have assumed that while all hospitalised cases will receive a laboratory-confirmed diagnosis,
only 1 of 4 mildly symptomatic cases will be detected. This fraction was based on inflation
factors determined by reviewing the number of confirmed COVID-19 cases, evolution of
‘person under investigation’ (PUI) criteria for COVID-19 testing, the number of contacts
identified and proportion traced, and publications/reports on under-detection rates in other
countries. However, a change in policy to prioritise testing of hospitalised patients, health care
workers, elderly individuals and individuals with co-morbidities with respiratory symptoms, has
been implemented in the Western Cape, and a similar policy that also includes staff and
inhabitants of nursing homes, entrants into quarantine facilities and a fraction of essential
workers has been implemented to varying extents in other provinces. It can be assumed that
this prioritised strategy led to a decreased detection of mild cases from mid-June onwards,
with approximately 1 in 10 mild cases now being detected. The Cumulative Detected Cases
panels below show detected cases under two policy scenarios: a) assuming the current testing
policy (blue) and b) detected cases projected under a limited policy of detecting only
hospitalised cases from mid-June (orange). Projections of detected cases may deviate from
observed detected cases if testing practices change, and actual detected cases are likely to
fall between the two scenarios.

        Projections at the population level do not capture local clustering of cases. The
methods used in this report make simplifying assumptions regarding how contacts between
infectious and uninfected people occur. The models therefore cannot capture the specific
differences in risk experienced by some members of society – e.g. health care workers or
those living in close, confined quarters such as informal settlements. They also cannot capture
the effects of specific events – e.g. religious gatherings or re-opening of individual schools –
on local transmission. While we have incorporated some level of contact heterogeneity, as
described above, this is captured at a population level and does not account for specific
contexts, such as those leading to superspreading events.

         Understanding of the virus’s epidemiology is continually evolving, both locally
and globally. Important parameters about which there remains substantial uncertainty in the
scientific literature include the proportion of infections that are truly asymptomatic, the relative
infectiousness of these asymptomatic individuals, the relative duration of infectiousness for
these individuals, as well as the severity profile of cases in different contexts. In the absence
of reliable serology data, there also remains significant uncertainty with regards to population
susceptibility to the virus and the overall attack rate (i.e. what proportion of the population
needs to have been infected for transmission to stagnate). Whether existing T-cell derived-
immunity after prior exposure to other coronaviruses exists is also unclear (and if so, how
much of a role it plays). We have included a reduction in the proportion of the population that
is susceptible as an alternative scenario below.

                                                                                                  6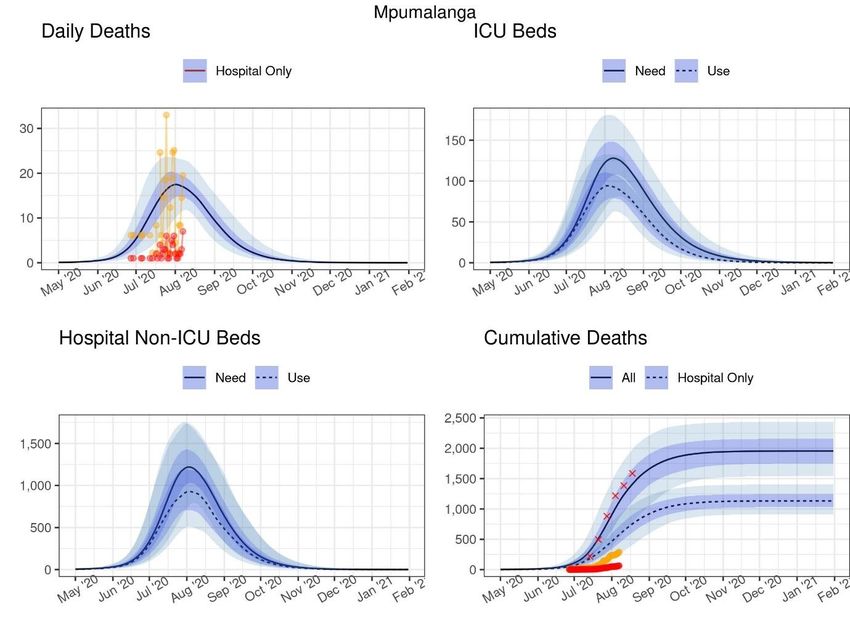
Findings: Model performance
On 12 June, we published a set of short-term projections to estimate cases and deaths for
June/July. Figure 1 shows the projected (black line) and observed (red dots) cumulative
detected cases (left) and cumulative deaths (right) from 21 March to 15 July for select
provinces. These projections were made on 12 June and show that the NCEM model closely
estimated the actual cumulative detected cases observed for the projection period. It was
during this period that daily deaths and admissions began to flatten in the Western Cape, for
reasons that are not yet well understood. Given that infectious disease models such as the
NCEM are mechanistic models driven by the underlying biology of the virus and the care
pathways, without knowledge of the reason behind the deceleration in daily deaths, it was not
possible to predict this change in trajectory. We however performed a number of scenario
analyses to interrogate the impact that four distinct factors could have had in explaining the
difference between our projections from June and real case and death development.

Figure 1: Model performance: Previously projected (12 June) vs observed cumulative detected
cases and cumulative deaths (select provinces)

The factors that we took into account as offering potential plausible explanations for the
earlier-than-expected plateauing of admissions and deaths in the Western Cape included the
following:

      a) A lower than assumed population attack rate, possibly due to different levels of
susceptibility in different population groups (including children) or the presence of existing T-

                                                                                               7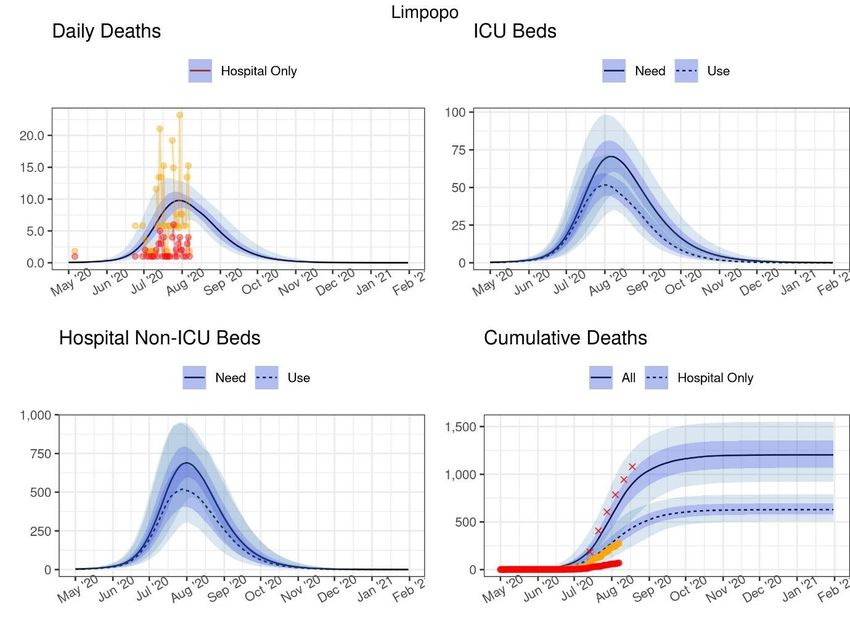
cell derived-immunity after prior exposure to other coronaviruses. This is modelled by allowing
a proportion of individuals to be immune throughout the course of the epidemic.

         b) Behaviour change in response to an increased local death rate. This scenario
takes into account a potential impact of public awareness of the increasing deaths and the
looming threat of overwhelmed healthcare facilities in the Western Cape, which, combined
with communication campaigns, may have resulted in better adherence to non-pharmaceutical
interventions (NPIs) (e.g. masks, hand washing and physical distancing) and in those most at
risk for severe COVID-19 disease taking additional precautions to isolate themselves. This is
modelled by allowing the population in each district to reduce interactions when district death
rates are high and increase interactions when death rates are low.

         c) Better adherence to NPIs regardless of death rate is incorporated to reflect the
population’s will to adhere to NPIs regardless of a national directive to do so, or at a time when
restrictions are being relaxed. This is modelled by assuming that the level of adherance to
NPIs in Level 4 (measured by population contact rate) does not increase when restrictions
were relaxed to Level 3 and beyond.

        d) Behavioural heterogeneity acknowledges that some members of society
experience different risks and exhibit heterogeneous/ different behavioural patterns,
introducing substantial variation in the number of people that different people infect, with highly
connected individuals becoming infected earlier in the epidemic and infecting more contacts.
This is modelled through altering the transmission function (force of infection) to be inflated at
the start of the epidemic, but decrease as immunity builds up in the most connected individuals
early on.

Table 1 summarises how we implemented each of these scenarios by changing model
parameters; Figure 2 shows the results for projected Covid-19 deaths in the Western Cape. It
is probable that the explanation for the earlier-than-projected plateauing of admissions and
deaths in the Western Cape is a combination of these factors, and there is not as enough
evidence in the international literature or local data for any of these factors. Nonetheless, we
ran a number of scenario analyses to see how well these factors would explain the early
plateau in the Western Cape, and what the impact of similar phenomena in the three provinces
with the most progressed epidemics over the next months would be.

Note that the purpose of the analysis is to demonstrate how each one of these phenomena
may be a possible explanation for the observed trends in the Western Cape, rather than
attempting to find a best fitting parameter set for each phenomenon.

Table 1: Scenario parameters

 Scenario Description
 Reduced susceptibility
 redSus1   12.5% of the population assumed to be completely immune to infection.
           Additional curvature achieved by assuming a further 20% reduction in
           contacts from Level 3 restrictions. (Asymptomatic proportion: 0.75)
 redSus2   6% of the population assumed to be completely immune to infection.
           (Asymptomatic proportion: 0.75)

                                                                                                 8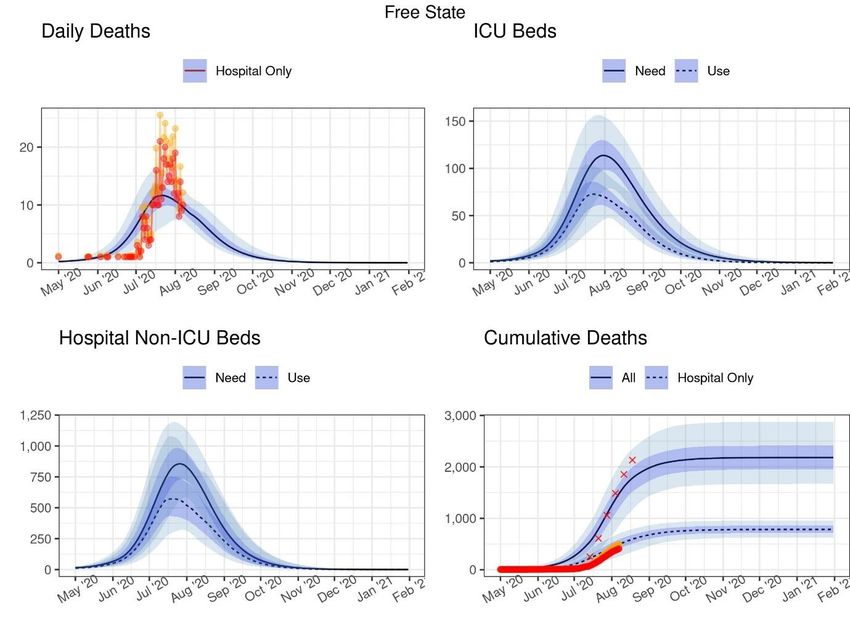
Note that different combinations of asymptomatic proportion and immune
           proportion can yield similar results.
Behaviour response to high mortality
behResp1 Half-saturation point / response threshold is assumed to be 110 deaths per
           day
behResp2 Half-saturation point / response threshold is assumed to be 30 deaths per day
           with a reduced seed
Better adherence to NPIs
effNPI1    Average contacts during level 4 decreased to 80% during level 3 and beyond
effNP!2    Average contacts during level 4 decreased to 65% during level 3 and beyond
Behavioural heterogeneity
behHet1    Concavity parameter k = 0.3, with increased seed
behHet2    Concavity parameter k=1, with reduced seed

                                                                                         9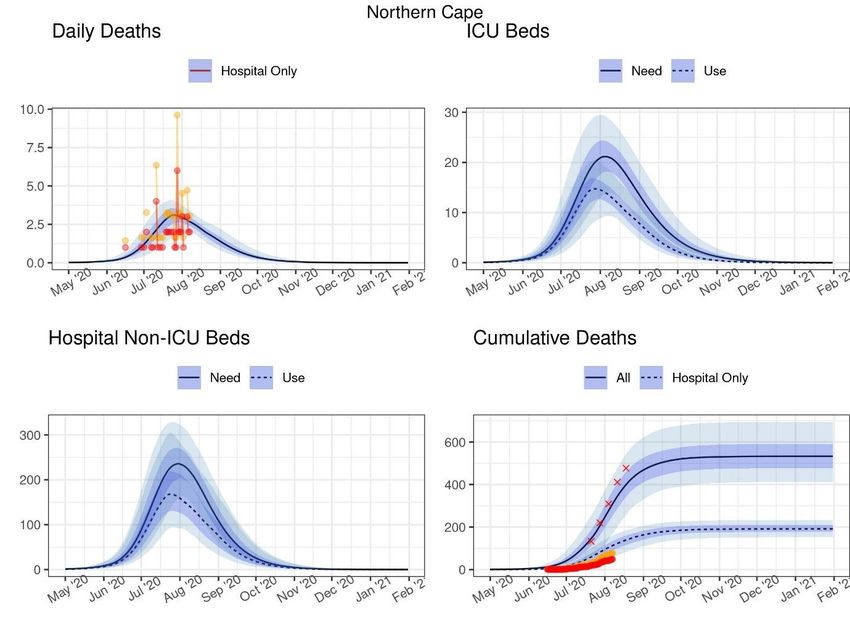
Figure 2: Impact of alternative scenarios on current and projected deaths in the Western Cape

When applying each scenario to the three provinces with the next most advanced epidemics,
Eastern Cape, Gauteng and KwaZulu-Natal, we noticed that each in turn led to either later or
lower peaking of cases than our original projections, with the exception of the behResp1
scenario, the behaviour response to high mortality scenario in which the behavioural response
threshold is assumed to be 110 deaths per day, which peaked at roughly the same level but
shifted the peak forward slightly in all three provinces (Figure 3).

                                                                                          10
Figure 3: Impact of alternative scenarios on current and projected deaths in the Eastern Cape,
Gauteng and KwaZulu-Natal
Based on these analyses, we chose to include the notion of behavioural heterogeneity as the
most plausible explanation as it is a known infectious disease phenomenon that is broadly
true of all social contact networks.
11Findings: Projected national cases and resource needs (May
2020 – Jan 2021)
12Figure 4 summarises our projected cumulative detected cases at the national level assuming
the current testing policy (blue) and a limited policy of detecting only hospitalised cases from
mid-June (orange), required ICU and non-ICU beds, as well as total COVID-19 deaths.
Importantly, a change in the testing policy only affects the number of detected cases, not any
of the other projections.
13Table 2 gives an overview of our projections at select dates.
The total number of projected cases has been reduced in comparison to the projections from
May, owing in part to our update of the reproductive numbers by province and in part to the
inclusion of behavioural heterogeneity. Active symptomatic cases are now projected to have
peaked in mid-July, i.e., at a time point that is earlier and at a level that is lower than our
previously-projected optimistic trend. The model estimates that while continued mass testing
across the country would have resulted in approximately 1.2 million detected cases by
November, the limited testing scenario of targeting diagnoses in inpatient settings would have
resulted in approximately 550,000 detected cases (median 567,500 cases (range, 447,800-
707,100) in early November).
The current number of detected Covid-19 cases is at the upper bound of the projected limited
testing scenario. For the estimation of hospital bed requirements, scenarios of both the
estimated need and the actual use of ICU and non-ICU beds are depicted. The peak number
of hospital beds in use was estimated to be reached in early-August, at around 8,000 general
hospital and 1,100 ICU beds (when around 12,500 general and around 2,000 ICU beds would
have been needed). While hospital-based deaths are projected to be approximately 16,000
by November, total COVID-19 deaths occurring both in and out of hospital assuming that 80%
of estimate excess deaths are due to COVID-19, are projected to be approximately 37,000 by
November.
14Figure 4: Projected cases and inpatient bed need and use at the national level. The red
crosses in the bottom right-hand panel represents 80% of the excess deaths found in the
SAMRC analysis
Current testing policy
Limited testing policy
DATCOV data
Adjusted DATCOV data
15Table 2: Projections of national cases, deaths and resources needed at select dates (Main
scenario)
16Findings: Provincial variability
Owing to our updates of the reproductive number, and the fact that we had enough data to
allow it to vary in each province, we now see considerable increased variation in the projected
timing and height of peak infection between the provinces (Figure 5). This means that the
strain on healthcare resources is more spread out, potentially allowing for more healthcare
capacity if resources such as beds, oxygen, test kits and reagents and staff can be shifted
between provinces (and within provinces, patients needing hospitalisation can be moved
between under- and better resourced districts).
Figure 5: Development of active symptomatic cases by province
17Findings: Projected provincial cases and resource needs in the
next six months (May 2020 – Jan 2021)
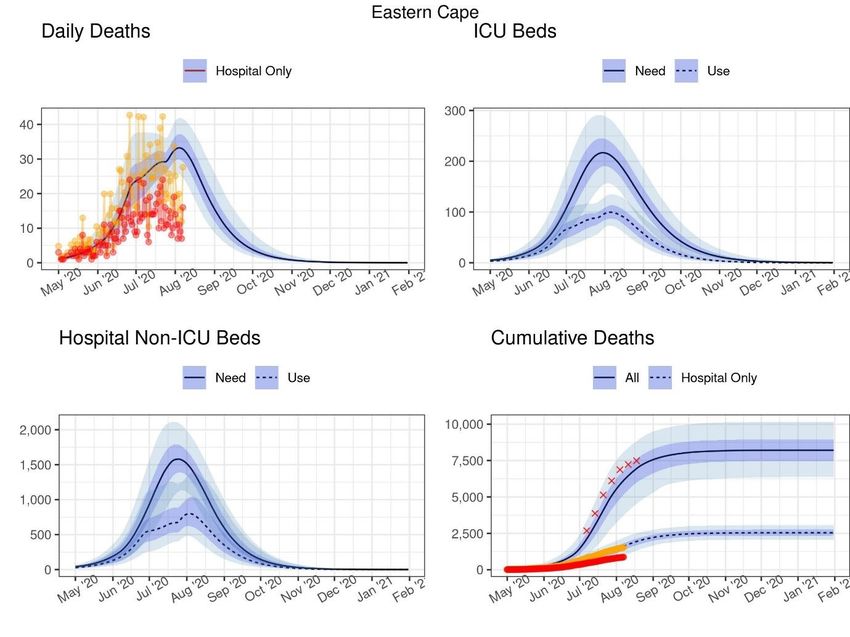
Across provinces, projections of deaths and cases requiring hospitalisation are lower than our
previous sets of estimates (Figures 6-14 and Tables 3-11). Across provinces, estimates of all
Covid-19 related deaths are almost double those of the reported Covid-19 related deaths
occurring in hospital which the DATCOV dataset aims to capture, and the number of hospital
beds that we estimated would have been needed are more than those estimated to have been
used over the last weeks, with the largest difference in the Eastern Cape where more than
twice as many ICU beds would have been required.
Figure 6: Projections of cases, deaths and resources needed: Eastern Cape. The red crosses
in the bottom right-hand panel represents 80% of the excess deaths found in the SAMRC
analysis
DATCOV data
Adjusted DATCOV data
18Table 3: Projections of cases, deaths and resources needed at select dates: Eastern Cape
19Figure 7: Projections of cases, deaths and resources needed: Free State. The red crosses in
the bottom right-hand panel represents 80% of the excess deaths found in the SAMRC
analysis
DATCOV data
Adjusted DATCOV data
20Table 4: Projections of cases, deaths and resources needed at select dates: Free State
21Figure 8: Projections of cases, deaths and resources needed: Gauteng. The red crosses in
the bottom right-hand panel represents 80% of the excess deaths found in the SAMRC
analysis
DATCOV data
Adjusted DATCOV data
22Table 5: Projections of cases, deaths and resources needed at select dates: Gauteng
23Figure 9: Projections of cases, deaths and resources needed: KwaZulu-Natal. The red crosses
in the bottom right-hand panel represents 80% of the excess deaths found in the SAMRC
analysis
DATCOV data
Adjusted DATCOV data
24Table 6: Projections of cases, deaths and resources needed at select dates: KwaZulu-Natal
25Figure 10: Projections of cases, deaths and resources needed: Limpopo. The red crosses in
the bottom right-hand panel represents 80% of the excess deaths found in the SAMRC
analysis
DATCOV data
Adjusted DATCOV data
26Table 7: Projections of cases, deaths and resources needed at select dates: Limpopo
27Figure 11: Projections of cases, deaths and resources needed: Mpumalanga. The red crosses
in the bottom right-hand panel represents 80% of the excess deaths found in the SAMRC
analysis
DATCOV data
Adjusted DATCOV data
28Table 8: Projections of cases, deaths and resources needed at select dates: Mpumalanga
29Figure 12: Projections of cases, deaths and resources needed: Northern Cape. The red
crosses in the bottom right-hand panel represents 80% of the excess deaths found in the
SAMRC analysis
DATCOV data
Adjusted DATCOV data
30Table 9: Projections of cases, deaths and resources needed at select dates: Northern Cape
31Figure 13: Projections of cases, deaths and resources needed: North West. The red crosses
in the bottom right-hand panel represents 80% of the excess deaths found in the SAMRC
analysis
DATCOV data
Adjusted DATCOV data
32Table 10: Projections of cases, deaths and resources needed at select dates: North West
33Figure 14: Projections of cases, deaths and resources needed: Western Cape. The red
crosses in the bottom right-hand panel represents 80% of the excess deaths found in the
SAMRC analysis
DATCOV data
Adjusted DATCOV data
34Table 11: Projections of cases, deaths and resources needed at select dates: Western Cape
35Assessment
Our assessment of the Covid-19 situation in South Africa based on our scenario analyses is
as follows:
1. Covid-19 cases, admissions and deaths in all provinces plateaued and declined
earlier, and at a lower level, than our original model projections predicted, despite the
easing of lockdown. The reasons for this remain unclear but likely include a combination of
the following:
a) A lower than assumed population attack rate, possibly due to different levels of
susceptibility in different population groups (e.g. in children) or the presence of existing
T-cell derived-immunity after prior exposure to other coronaviruses.
b) Behaviour change in response to an increased local death rate through a
potential impact of public awareness of the increasing deaths and the looming threat
of overwhelmed healthcare facilities resulting in better adherence to non-
pharmaceutical interventions.
c) Better adherence to NPIs regardless of death rate, i.e. the population’s will to
adhere to NPIs regardless of a national directive to do so, or at a time when restrictions
are being relaxed.
d) Behavioural heterogeneity meaning that some members of society experience
different risks and exhibit heterogeneous / different behavioural patterns, introducing
substantial variation in the number of people that different people infect, with highly
connected individuals becoming infected earlier in the epidemic and infecting more
contacts.
We have incorporated the last aspect into the model projections presented in this report.
2. Though hospital capacity was breached in parts of the Eastern Cape, it was not
breached to the extent originally expected in Western Cape and Gauteng. Possible
reasons for this include the lower-than-expected case load as well as lower levels of
presentation for inpatient care. Our analysis of excess mortality suggests that many people
may have been unable to be accommodated in Eastern Cape hospitals during June and early
July.
3. While the number of COVID-19 cases in South Africa appears to have peaked, there
is much uncertainty in the remaining course of the epidemic, its duration and
consequences. The future of the spread of SARS-CoV-2 and the impact of COVID-19 on
health and health resources depends on many unknowns. We do not yet know whether those
already infected will have long-lasting immunity or short-term immunity, and whether this
immunity will offer complete or partial protection. In the absence of a vaccine, SARS-CoV-2
transmission remains largely dependent on the proportion of population still susceptible,
individual behaviour and the ability of the population to adopt preventative measures like
mask-wearing and practise social distancing whilst going about their daily lives. Depending on
the nature of immunity and/or the development of a vaccine, the future of SARS-CoV-2 could
become regular annual epidemics, seasonal epidemics, epidemics occurring every few years
or even sporadic, unpredictable epidemics. It is therefore important to continue to monitor the
epidemic and remain vigilant to detect localised outbreaks as and when they occur. Additional
work on modelling the impact of the above-mentioned factors on the timing, frequency and
amplitude of a future resurgence in COVID-109 cases is currently under way.
36Recommendations
In order to increase preparedness for a potential resurgence of Covid-19 cases and / or future
novel pathogens, our recommendations following from the above are two-fold:
Invest in equipment and infrastructure which will have long-term benefit to public health
care system.
This includes investment in a continuous supply of protective equipment for health care
workers for the months to come, general hospital bed capacity (while most stand-alone field
hospitals could be demoted or used for other purposes), oxygen delivery and reticulation
systems in general hospital wards, and additional ICU capacity, as well as emergency medical
services (vehicles such as ambulances as well as training of EMS staff).
Invest in additional data required to improve model estimates and surveillance
The country’s ability to detect and react swiftly to a resurgence of Covid-19 cases or other
novel pathogens depends on an improved surveillance data infrastructure. This could include
a complete hospitalisation database, the generation of SARS CoV-2 seroprevalence data from
routine care (e.g., antenatal care clinics and primary healthcare for chronic conditions) and
testing of residual samples routinely submitted for other tests (HIV viral load, etc), and robust
case and mortality data at district level.
37Appendix
Key parameter values
Tables A1 and A2 below show the values of key parameters used to inform the model.
Parameter values have been selected for use by an expert panel of clinicians on the SA Covid-
19 Modelling Consortium and updated with inputs from recent South African data where
indicated. Parameter values that are provided as ranges only differ by province.
Table A1. Results of NICD analysis of estimated national and provincial reproductive numbers
[1,3]*
Restriction level National Eastern Gauteng KwaZulu Western
Cape Natal Cape
None (R0) 2.5 (2, 3) 2.5 (2, 3) 2.5 (2, 3) 2.5 (2, 3) 2.5 (2, 3)
Level 5 Rt2 1.3 1.4 1.2 1.1 1.5
(1.0, 1.6) (1.1, 1.7) (1.0, 1.4) (0.9, 1.43 (1.2, 1.8)
Level 4 Rt: NICD Rt estimates 1.6 1.6 1.8 1.6 1.6
calibrated to fit hospital-based (1.3, 1.9) (1.2, 1.8) (1.4, 2.2) (1.3, 1.9) (1.3, 1.9)
provincial deaths2
Other Eastern Gauteng KwaZulu Western
Provinces Cape Natal Cape
Level 3 (1–30 June): increase in (21.1%, 21.0% 4.3% 20.5% 8.1%
contacts (relative to previous 26.0%) (16.8, (3.4, 5.2) (16.4, (6.5, 9.7)
period) estimated from a 25.2) 24.6)
decrease in residential mobility3
Level 3 (1 July – 17 August): (0.5%, 3.0% 1.8% 0.8% 6.6%
increase in contacts (relative to 2.5%) (2.4, 3.6) (1.4, 2.2) (0.6, 1.0) (5.3, 7.9)
previous period) estimated from a
decrease in residential mobility3
Level 2 (18 August ->): increase (3.3%, 5.4% 1.7% 4.8% 3.1%
in contacts (relative to previous 5.8%) (4.3, 6.5) (1.4, 2.0) (3.8, 5.8) (2.5, 3.7)
period) estimated from a
decrease in residential mobility3
* We utilised national estimates where provincial data was too sparse. R0, and Rt for Level 5 and
Level 4 from symptom onset date adjusted for testing volumes
Table A2. Key model parameters
Parameter Value (range) Sources
Infection Proportion of cases that are [9-12]
75% (70% - 80%)
severity asymptomatic
Relative infectiousness of asymptomatic 80% (77.5%, 82.5%) [13-15]
cases Estimated through
calibration to
admissions and
fatalities count data
(DATCOV) [4]
38Mild to moderate cases among the Estimated through
symptomatic (94.55% - 97.13%) calibration to
admissions and
Severe cases among the symptomatic fatalities count data
(2.58% - 5.00%)
(DATCOV) [4]
Critical cases among the symptomatic
(0.18% - 0.55%)
Fatal cases among the admitted Estimated from
(6.82% - 20.28%)
(general) NICD COVID-19
Fatal cases among the admitted (ICU Hospital Sentinel
(43.01% - 85.03%)
ventilated) Surveillance
Fatal cases among the admitted (ICU database
(22.73% - 43.35%) (DATCOV) [4] &
non-ventilated)
Proportion of cases in ICU requiring Western Cape Line
ventilation (19.44% - 51.47%) List Data (SPV) [16]
Fatal cases among the critically infected Expert opinion of
requiring ventilation, in the absence of 100% clinicians convened
appropriate care by the National
Fatal cases among the critically infected Unchanged: Fatal COVID-19
not requiring ventilation, in the absence cases among the Modelling
of appropriate care admitted (ICU non- Consortium
ventilated)
Fatal cases among the critically infected
requiring oxygen, in the absence of 100%
appropriate care
Fatal cases among the severely
infected requiring oxygen, in the 90%
absence of appropriate care
Probability of seeking hospital-level care Estimated through
for severely and critically ill (50.00% - 97.00%) calibration to 80%
of excess mortality
[5]
Timeframes Time from infection to onset of [8, 17-26]
2 days (1.0 - 3.0)
& treatment infectiousness with input from the
durations Time from onset of infectiousness to National COVID-19
onset of symptoms 4 days (3.0 - 5.0) Modelling
Consortium
Duration of infectiousness from onset of [26, 27]
5 days (4.0 - 6.0)
symptoms
Time from onset of symptoms to testing [17,18, 28-32]
4 days (3.0 - 5.0)
Time from onset of symptoms to
5 days (4.0 - 6.0)
hospitalisation
Time in non-ICU (never ICU) to Lengths of stay:
8 days (4.0 - 12·0)
death/recovery values and ranges
Time in non-ICU for those destined for sourced from NICD
0 days (0.0 - 2.0) COVID-19 Hospital
ICU
Time in ICU for those ventilated and Sentinel
14 days (7.0 - 27.0) Surveillance
destined to die
Time in ICU for those never ventilated database
11 days (7.0 - 18.0) (DATCOV) [4]
and destined to die
Time in ICU for those ventilated and
19 days (15.0 - 37.0)
recovered
Time in ICU for those never ventilated
5 days (1.0 - 10.0)
and recovered
Time in non-ICUs for those who were in
0 days (0.0 - 6.0)
ICU and recovered
* A full list of parameters are available in the code.
39Summary of data sources
National case and hospitalisation data from the South African National Institute for
Communicable Diseases
Statistics South Africa projected 2020 district population projections33
Coronavirus COVID-19 (2019-nCoV) Data Repository for South Africa, Data Science
for Social Impact Research Group @ University of Pretoria34
Vodacom Mobile Event Database
Google COVID-19 Community Mobility Reports
Published and pre-print academic literature (cited in Table A2)
Expert input from members of the SA COVID-19 Modelling Consortium, and
https://sacoronavirus.co.za/category/press-releases-and-notices/
About the National COVID-19 Epi Model
The National COVID-19 Epi Model (NCEM) is a stochastic compartmental transmission model
to estimate the total and reported incidence of COVID-19 in the nine provinces of South Africa.
The outputs of the model may be used to inform resource requirements and predict where
gaps could arise based on the available resources within the South African health system. The
model follows a generalised Susceptible-Exposed-Infectious-Recovered (SEIR) structure
accounting for disease severity (asymptomatic, mild, severe and critical cases) and the
treatment pathway (outpatients, non-ICU and ICU beds) as shown in Figure A1. Contributors
to the NCEM include Sheetal Silal, Rachel Hounsell, Jared Norman, Saadiyah Mayet, Frank
Kagoro, Juliet Pulliam, Roxanne Beauclair, Jeremy Bingham, Jonathan Dushoff, Reshma
Kassanjee, Michael Li, Cari van Schalkwyk, Alex Welte, Lise Jamieson, Brooke Nichols and
Gesine Meyer-Rath. For more information please contact Dr Sheetal Silal
(sheetal.silal@uct.ac.za).
40Figure A1: Updated NCEM model structure (generalised SEIR model)
Note that a series of ‘waiting’ compartments have been added to represent individuals who
are in need of a hospital or ICU bed but unable to occupy one due to capacity constraints
(i.e., beds are full).
4142
References

  1. National Institute for Communicable Diseases. The Daily COVID-19 Effective
      Reproductive Number (R) in South Africa – week 33 2020. Available from:
      https://www.nicd.ac.za/wp-content/uploads/2020/08/COVID-19-Effective-
      Reproductive-Number-in-South-Africa-week-33_draft04.pdf
  2. National Institute for Communicable Diseases. The Initial and Daily COVID-19
      Effective Reproductive Number (R) in South Africa 10 June 2020. Available from:
      https://www.nicd.ac.za/wp-content/uploads/2020/06/Initial-and-Daily-COVID-19-
      Effective-Reproductive-Number-R-in-SA-11_6_2020.pdf
  3. Google LLC "Google COVID-19 Community Mobility Reports".
      https://www.google.com/covid19/mobility/ Accessed: .
  4. National Institute for Communicable Diseases. COVID-19 Hospital Sentinel
      Surveillance database (DATCOV). [cited 2020 July 29]. (Unpublished)
  5. Bradshaw D, et al., Report on weekly deaths in South Africa, 1 January -18 August
      2020 (Week 33). 2020, South African Medical Research Council Cape Town, South
      Africa.
  6. Boulle, A., et al., Data Centre Profile: The Provincial Health Data Centre of the
      Western Cape Province, South Africa. International Journal of Population Data
      Science, 2019. 4(2).
  7. Moultrie, T., et al. Excess deaths: additional measures and approaches to
      understanding covid-19 related mortality in South Africa. 2020; Available from
      https://www.samrc.ac.za/sites/default/files/files/2020-08-
      12/Excess%20deaths_4%20Aug%202020.pdf
  8. Peter, A., Huisman, J.S., Sonja, L., Bouman, J.A., Althaus, C.L., Regoes, R.R. and
      Sebastian, B., 2020. COVID-19 infectivity profile correction. Swiss Medical
      Weekly, 150.
  9. Inui S, Fujikawa A, Jitsu M, Kunishima N, Watanabe S, Suzuki Y, et al. Chest CT
      Findings in Cases from the Cruise Ship “Diamond Princess” with Coronavirus
      Disease 2019 (COVID-19). Radiol Cardiothorac Imaging [Internet]. 2020 Apr 1 [cited
      2020 Mar 23];2(2):e200110. Available from:
      http://pubs.rsna.org/doi/10.1148/ryct.2020200110
  10. Sutton D, Fuchs K, D’Alton M, Goffman D. Universal Screening for SARS-CoV-2 in
      Women Admitted for Delivery. N Engl J Med [Internet]. 2020 Apr 13. Available from:
      https://www.nejm.org/doi/full/10.1056/NEJMc2009316
  11. Day, M., 2020. Covid-19: four fifths of cases are asymptomatic, China figures
      indicate. BMJ [Internet]. 2020 Apr 2. Available from:
      https://doi.org/10.1136/bmj.m1375
  12. Ing AJ, Cocks C, Green JP. COVID-19: in the footsteps of Ernest Shackleton. Thorax
      [Internet]. 2020 May 27 [cited 2020 Jun 4]. Available from:
      http://www.ncbi.nlm.nih.gov/pubmed/32461231
  13. Li, R., Pei, S., Chen, B., Song, Y., Zhang, T., Yang, W. and Shaman, J., 2020.
      Substantial undocumented infection facilitates the rapid dissemination of novel
      coronavirus (SARS-CoV-2). Science, 368(6490), pp.489-493.

                                                                                        43
14. Furukawa NW, Brooks JT, Sobel J. Evidence Supporting Transmission of Severe
Acute Respiratory Syndrome Coronavirus 2 While Presymptomatic or Asymptomatic.
Emerg Infect Dis. 2020;26(7):6059.
15. Zhou R, Li F, Chen F, Liu H, Zheng J, Lei C, et al. Viral dynamics in asymptomatic
patients with COVID-19. Int J Infect Dis [Internet]. 2020;96:288–90. Available from:
https://doi.org/10.1016/j.ijid.2020.05.030
16. Western Cape Department of Health. Single Patient Viewer Database (SPV). [cited
2020 July 29]. (Unpublished)
17. Tindale L, Coombe M, Stockdale JE, Garlock E, Lau WYV, Saraswat M, et al.
Transmission interval estimates suggest pre-symptomatic spread of COVID-19.
medRxiv [Internet]. 2020 Mar 6;2020.03.03.20029983. Available from:
https://www.medrxiv.org/content/10.1101/2020.03.03.20029983v1
18. Nie X, Fan L, Mu G, Tan Q, Wang M, Xie Y, et al. Epidemiological Characteristics
and Incubation Period of 7015 Confirmed Cases With Coronavirus Disease 2019
Outside Hubei Province in China. J Infect Dis [Internet]. 2020 [cited 2020 Jun 10];1–
8. Available from: https://academic.oup.com/jid/advance-article-
abstract/doi/10.1093/infdis/jiaa211/5825699
19. Linton NM, Kobayashi T, Yang Y, Hayashi K, Akhmetzhanov AR, Jung S, et al.
Incubation Period and Other Epidemiological Characteristics of 2019 Novel
Coronavirus Infections with Right Truncation: A Statistical Analysis of Publicly
Available Case Data. J Clin Med [Internet]. 2020 Feb 17 [cited 2020 Jun 10];9(2):538.
Available from: https://www.mdpi.com/2077-0383/9/2/538
20. Thompson RN, Lovell-Read FA, Obolski U. Time from Symptom Onset to
Hospitalisation of Coronavirus Disease 2019 (COVID-19) Cases: Implications for the
Proportion of Transmissions from Infectors with Few Symptoms. J Clin Med
[Internet]. 2020 May 1 [cited 2020 Jun 10];9(5):1297. Available from:
https://www.mdpi.com/2077-0383/9/5/1297
21. Backer JA, Klinkenberg D, Wallinga J. Incubation period of 2019 novel coronavirus
(2019- nCoV) infections among travellers from Wuhan, China, 20 - 28 January 2020.
Vol. 25, Eurosurveillance. European Centre for Disease Prevention and Control
(ECDC); 2020. Available from:
https://www.ncbi.nlm.nih.gov/pmc/articles/PMC7014672/
22. Jing Q, You C, Lin Q, Hu T, Yu S, Zhou X-H. Estimation of incubation period
distribution of COVID-19 using disease onset forward time: a novel cross-sectional
and forward follow-up study. medRxiv [Internet]. 2020 Mar 10;2020.03.06.20032417.
Available from: https://www.ncbi.nlm.nih.gov/pmc/articles/PMC7217033/
23. Lauer SA, Grantz KH, Bi Q, Jones FK, Zheng Q, Meredith HR, et al. The incubation
period of coronavirus disease 2019 (CoVID-19) from publicly reported confirmed
cases: Estimation and application. Ann Intern Med [Internet]. 2020 May
5;172(9):577–82. Available from: https://www.acpjournals.org/doi/10.7326/M20-0504
24. Ganyani T, Kremer C, Chen D, Torneri A, Faes C, Wallinga J, et al. Estimating the
generation interval for coronavirus disease (COVID-19) based on symptom onset
data, March 2020. Eurosurveillance [Internet]. 2020 Apr 30;25(17). Available from:
https://www.eurosurveillance.org/content/10.2807/1560-
7917.ES.2020.25.17.2000257
25. Nishiura H, Linton NM, Akhmetzhanov AR. Serial interval of novel coronavirus
(COVID-19) infections. Int J Infect Dis [Internet]. 2020 Mar [cited 2020 Mar 16];
Available from: https://linkinghub.elsevier.com/retrieve/pii/S1201971220301193
4426. He X, Lau EHY, Wu P, Deng X, Wang J, Hao X, et al. Temporal dynamics in viral
shedding and transmissibility of COVID-19. Nat Med [Internet]. 2020 May
1;26(5):672–5. Available from: https://www.nature.com/articles/s41591-020-0869-5
27. Wölfel R, Corman VM, Guggemos W, Seilmaier M, Zange S, Müller MA, et al.
Virological assessment of hospitalized patients with COVID-2019. Nature. 2020 May
28;581(7809):465–9. Available from: https://www.nature.com/articles/s41586-020-
2196-x
28. World Health Organization. Report of the WHO-China Joint Mission on Coronavirus
Disease 2019 (COVID-19) [Internet]. 2020 [cited 2020 Mar 14]. Available from:
https://www.who.int/docs/default-source/coronaviruse/who-china-joint-mission-on-
covid-19-final-report.pdf
29. Huang C, Wang Y, Li X, Ren L, Zhao J, Hu Y, et al. Clinical features of patients
infected with 2019 novel coronavirus in Wuhan, China. Lancet [Internet]. 2020 [cited
2020 Mar 14];395:497. Available from:
https://www.thelancet.com/journals/lancet/article/PIIS0140-6736(20)30183-5/fulltext
30. Gaythorpe K, Imai N, Cuomo-Dannenburg G, Baguelin M, Bhatia S, Boonyasiri A, et
al. Report 8: Symptom progression of COVID-19 [Internet]. 2020 Mar [cited 2020 Mar
18]. Available from: https://doi.org/10.25561/77344
31. Zhou F, Yu T, Du R, Fan G, Liu Y, Liu Z, et al. Clinical course and risk factors for
mortality of adult inpatients with COVID-19 in Wuhan, China: a retrospective cohort
study. Lancet [Internet]. 2020 Mar [cited 2020 Mar 14];0(0). Available from:
https://linkinghub.elsevier.com/retrieve/pii/S0140673620305663
32. Wang D, Hu B, Hu C, Zhu F, Liu X, Zhang J, et al. Clinical Characteristics of 138
Hospitalized Patients with 2019 Novel Coronavirus-Infected Pneumonia in Wuhan,
China. JAMA - J Am Med Assoc. 2020 Mar 17;323(11):1061–9. Available from:
https://jamanetwork.com/journals/jama/fullarticle/2761044
33. Statistics South Africa. Mid-year district population estimates 2020 (unpublished)
34. Data Science for Social Impact Research Group @ University of Pretoria,
Coronavirus COVID- 19 (2019-nCoV) Data Repository for South Africa. Available at:
https://github.com/dsfsi/covid19za.
45Acknowledgements
We acknowledge the support of our funders and the assistance of Ida Jooste from InterNews
and Andre Smith in editing a previous version of this report.
Funders
MASHA HE2RO SACEMA
46You can also read