Changes in Air Quality during the COVID-19 Lockdown in Singapore and Associations with Human Mobility Trends Jiayu Li*, Federico Tartarini
←
→
Page content transcription
If your browser does not render page correctly, please read the page content below
Special Issue on COVID-19 Aerosol Drivers, Impacts and Mitigation (IV)

Aerosol and Air Quality Research, 20: 1748–1758, 2020
ISSN: 1680-8584 print / 2071-1409 online
Publisher: Taiwan Association for Aerosol Research
https://doi.org/10.4209/aaqr.2020.06.0303

Changes in Air Quality during the COVID-19 Lockdown in Singapore and
Associations with Human Mobility Trends

Jiayu Li*, Federico Tartarini
Berkeley Education Alliance for Research in Singapore, 138602, Singapore

ABSTRACT

   On the 7th of April, the Singaporean government enforced strict lockdown measures with the aim of reducing the
transmission chain of the coronavirus disease 2019. This had a significant impact on the movement of people within the
country. Our study aims to quantify the impact that these measures had on outdoor air pollution levels. We obtained air
quality and weather data from April 2016 to May 2020, satellite data for 2019 and 2020 and mobility data for 2020 from
Apple, Google, and the Singaporean Housing & Development Board. We determined that outdoor air pollution during the
lockdown significantly decreased when compared with the same period in the previous four years even if we included
corrections for long time trends in the analysis. The concentrations of the following pollutants PM10, PM2.5, NO2, CO, and
SO2 decreased by 23, 29, 54, 6, and 52%, respectively, whilst that of O3 increased by 18%. The Pollutant Standard Index
decreased by 19%. The trends of PM2.5 and NO2 were significantly correlated with mobility data. The NO2 and SO2
tropospheric concentrations and the total aerosol optical depth at 550 nm obtained from satellite data during the lockdown
in 2020 were also lower than during the same period in 2019. Our results can be used to evaluate possible mitigation
strategies for outdoor air quality in a longer term beyond this lockdown.

Keywords: Air pollutant; Anthropogenic pollution; Circuit breaker; SARS-CoV-2.

INTRODUCTION                                                                       to describe these measures. During the lockdown period
                                                                                   schools were closed, all workers working in non-essential
   On the 23rd January 2020, Ministry of Health of                                 sectors were imposed to work from home, and shops were
Singapore confirmed the first imported case of coronavirus                         closed with the exclusion of those providing essential
disease 2019 (COVID-19) caused by the infection of severe                          services to the community (Lim et al., 2020; Ng, 2020).
acute respiratory syndrome coronavirus 2 (SARS-CoV-2)                              People were allowed to exit their home only for purchasing
(Ministry of Health, 2020a; Wong et al., 2020). On the 7th                         essential products or exercising, no social gatherings were
of February 2020, the Singaporean government raised the                            allowed. These measures confined the population at home
Disease Outbreak Response System Condition (DORSCON)                               and reduced the vehicular traffic on the roads and emissions
to Orange, slowly implementing measures to limit social                            from industrial activities which in turn may had affected the
gatherings and on the 23rd of March banned all short-term                          concentration of anthropogenic pollutants in the outdoor air
visitors from entering the country. However, due to the                            (Dutheil et al., 2020; Filonchyk et al., 2020; Le et al., 2020;
increasing rate of transmission of SARS-CoV-2 in the                               Muhammad et al., 2020; Safarian et al., 2020; Xu et al., 2020).
community, as shown in Fig. S1 in the Appendix, on the 7th                         Lockdown measures in Singapore were implemented on the
of April 2020 Singapore implemented strict safe distancing                         7th of April 2020 and started to progressively ease on the
measures (Ministry of Health, 2020b; Pung et al., 2020). The                       12th of May 2020 (Ministry of Health, 2020c). Hence, we
Singaporean government named these measures “Circuit-                              labeled these 35 days from 7th April to 11th May 2020 as the
Breaker”, however effectively were analogous to what other                         lockdown period in this study.
Countries referred as “lockdown” or “shutdown” measures. In                           Although the lockdown measures are designed to protect
this paper we, therefore, decided to use the term “lockdown”                       people from the disease, these measures have a severe
                                                                                   impact on the economy and people’s daily lives. A silver
                                                                                   lining under this scenario may come in the form of health
                                                                                   benefits resulting from the reduction of air pollution (Lal et
*
    Corresponding author.                                                          al., 2020). The World Health Organization (WHO) defines
    Tel.: 65-85251223                                                              outdoor air pollution as a major environmental risk to health,
    E-mail address: jiayu.li@berkeley.edu;                                         which negatively affects cardiovascular and respiratory health.
    jiayuliaq@gmail.com                                                            The WHO classifies particulate matter with diameters less

   Copyright The Author(s). This is an open access article distributed under the terms of the Creative Commons Attribution License (CC BY 4.0), which permits
unrestricted use, distribution, and reproduction in any medium, provided the original author and source are cited.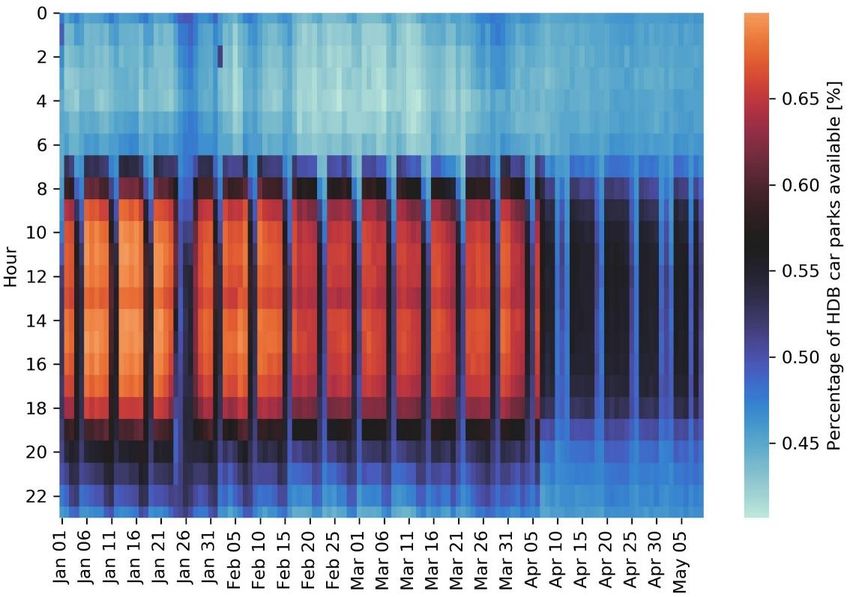
S
                       Li and Federico Tartarini, Aerosol and Air Quality Research, 20: 1748–1758, 2020                         1749

or equals to 10 micrometers (PM10) and 2.5 micrometers                stations can be found on the NEA website (MSS, 2018, p.
(PM2.5), nitrogen dioxide (NO2), sulfur dioxide (SO2) and             Annex 3; National Environment Agency, 2020d).
ozone (O3) as the major outdoor air pollutants (WHO,                     To better analyze the spatial temporal variations of NO2
2006). In Singapore the main sources of outdoor pollutants            and SO2 concentrations in Singapore during the lockdown
are industries and motor vehicles (National Environment               period, we obtained data from the European Space Agency
Agency, 2020a). Sporadic elevated haze pollution from                 (ESA) Sentinel-5P TROPOMI satellite (European Space
neighboring countries during the monsoon seasons (Velasco             Agency, 2020). We also obtained the total aerosol optical
and Rastan, 2015) or caused by El Niño (Atwood et al.,                depth (AOD) at 550 nm data from the Copernicus
2013) also have an impact on outdoor air quality. In Europe           Atmosphere Monitoring Service (CAMS) (Benedetti et al.,
a report (Myllyvirta, 2020) estimated that the lockdown               2009; Huijnen et al., 2016; Morcrette et al., 2009). Data
measures have avoided 11,000 pollution-related deaths in              were processed and plotted using the Earth Engine Data
April 2020. The avoided NO2 and PM2.5 related deaths in               Catalog (Gorelick et al., 2017). The spatial resolution of the
China due to the cleaner air were estimated as 8911 and               Sentinel-5P TROPOMI satellite is 7 by 7 km2 and the satellite
3214, respectively (Chen et al., 2020a). The reduction of air         scans the earth with a daily revisit frequency. However, for
pollutant has the potential to decrease the mortality rate of         same specific days date were either not available or may have
COVID-19 (Brandt et al., 2020; Fattorini and Regoli, 2020;            been filtered out due to the presence of clouds. Consequently,
Ogen, 2020) and mitigate the spread of the virus (Jiang et            since we plotted the average data collected over a relative
al., 2020; Pani et al., 2020; Sciomer et al., 2020; Yao et al.,       short period of time, from the 7th of April to the 11th of May,
2020).                                                                the mean concentration calculated for some areas may not be
   Our aim is to quantify the change in outdoor pollutants            accurate due to missing data (Kramer, 2002).
concentrations during the lockdown period in Singapore and
to evaluate their associations with mobility trends. This             Mobility Data
would allow us to better understand how anthropogenic                    We use the datasets from both Apple and Google to
activities and various sources in Singapore affect the overall        analyze how changes in mobility affected the air quality.
air quality.                                                          Both datasets show a relative trend of how people movements
                                                                      changed within Singapore each day due to the impact of the
METHODS                                                               COVID-19 pandemic. Google’s dataset is built from data
                                                                      collected from users who allowed Google to access their
Air Quality Data                                                      location information. Google’s data are classified into the
   The National Environment Agency (NEA) in Singapore                 following macro categories: workplaces, residential, retail &
provides Application Programming Interfaces (API)s for                recreation, grocery & pharmacy, transit stations, and parks
real-time weather readings and air quality data. The weather          (Google LLC, 2020). Google uses as baseline the median
data APIs provide 1-minute intervals data of temperature,             value for the corresponding day of the week during the
relative humidity, precipitations and wind conditions for a           period from the 3rd of Jan to the 6th of Feb 2020. The data
total of 64 weather stations across Singapore (National               reflects how the lockdown impacted each category. The data
Environment Agency, 2020b).                                           in Apple’s dataset is based on the direction requested by the
   Data on pollutants were obtained from five monitoring              users in Apple Maps, and classified into three categories:
stations distributed strategically throughout Singapore               driving, public transit, and walking (Apple Inc., 2020).
(National Environment Agency, 2020c). The Singaporean                 From both datasets, we selected the mobility parameters
government refers to these stations as Central (1°21'N                which have the potential to impact air quality. The selected
103°49'E), East (1°21'N 103°56'E), West (1°21'N 103°42'E),            parameters are workplaces, residential, and transport station
South (1°18'N, 103°49'E), and North (1°25'N, 103°49'E)                in Google’s dataset and the data of driving and public transit
according to their locations in Singapore, and the national           in Apple’s dataset.
level is calculated as the main value among these five                   In addition to the smartphone data we acquired data
stations. We obtained outdoor air quality data from April             regarding the Housing and Development Board (HDB) carpark
2016 and May 2020 using Python. The NEA releases on an                availability using the API provided by the Singaporean
hourly basis data regarding pollutants mass concentrations            Government (HDB, 2020). Approximately 81% of the whole
for: 24-h mean PM10 and PM2.5, 1-h mean NO2, 8-h mean                 population in Singapore lives in HDB apartments (HDB,
CO, 24-h mean SO2, and 8-h mean O3 and their relative sub-            2018; Li et al., 2020), hence this data provides a meaningful
indices for each of the above-mentioned stations. In addition,        estimation of how many Singaporean used their personal
it provides data on the 24-h Pollutant Standard Index (PSI).          vehicle during the lockdown period. We gathered aggregate
The NEA calculates the 24-h PSI value firstly by linearly             data on an hourly basis regarding the total number of
mapping each individual sub-pollutant (i.e., 24-h PM10, 24-h          residential occupied and free car spots across the whole
PM2.5, 8-h CO, 24-h SO2, 1-h NO2, 8-h O3) to a sub-index              country. We used this information to estimate at any point
ranging from 0 to 500. Then the overall 24-h PSI value is             in time the percentage of people who commuted from and
assumed to be equal to the maximum value of any of the                to their houses using a vehicle. From those data we could
pollutants sub-indices (National Environment Agency,                  not infer how many cars were on the streets, since we only
2014). More information regarding the accuracy of the                 knew when the car left the residential parking and when it
instrumentation used by NEA and the location of the                   returned in the evening.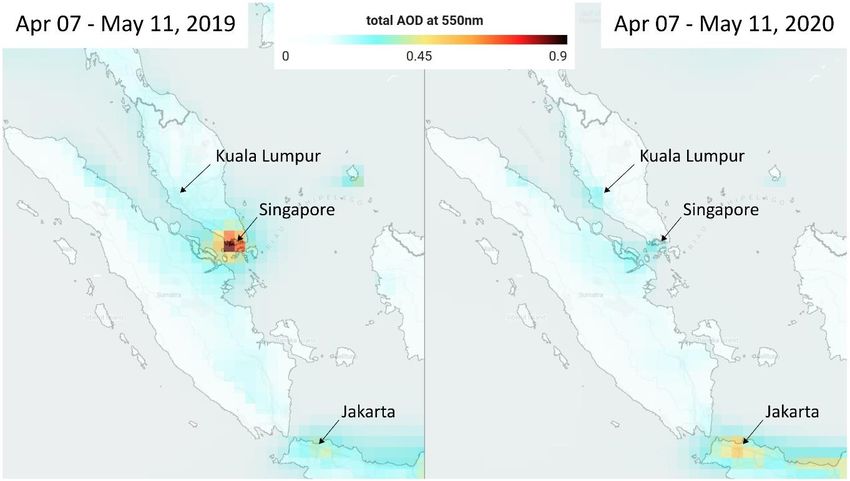
S
1750                        Li and Federico Tartarini, Aerosol and Air Quality Research, 20: 1748–1758, 2020

Data Analysis                                                          correlation between air quality and mobility. We analyzed
   To estimate the influence of the lockdown on the outdoor            the data in the R programming language. We processed and
air pollutants concentrations, we firstly had to estimate the          transformed the data with data, table, lubridate, and magrittr
concentrations without COVID-19 measures. We call this                 packages and visualized them with ggplot2 and patchwork
the counterfactual concentrations. For each parameter at               packages. We have published the data sets and source codes
each location, we linearly regressed the data collected over           we used on a public GitHub repository (https://github.com/
the previous four years (2016, 2017, 2018, and 2019) during            JiayuLIAQ/COVID-19_vs_air_quality_weather/), to allow
the period from the 7th April to the 11th of May to test whether       other researchers to reproduce a similar analysis in other
there was a consistent change of pollutants concentrations             cities or countries.
over the years. We used two methods to estimate the
counterfactual value for 2020. If the p-value of the linear            RESULTS
regression is lower than 0.01 we used the value estimated
by the linear regression; alternatively, we used the mean                 The meteorological parameters in Singapore during the
value of the last four years. The reduction was defined as             period between the 07th of April and the 11th of May from
the change from the counterfactual value to the measured               2016 to 2020 are summarized in Table 1. During the lockdown
one during the lockdown.                                               period in 2020, temperature, relative humidity, rainfall, and
   We have listed below the reasons why we chose to                    wind direction were not significantly different from those
compare the outdoor concentrations to those measured in                recorded during the same period in previous years. Wind
the same period of the last four years, instead of using the           speed during the lockdown period was significantly higher
methodology proposed by (Kerimray et al., 2020; Otmani et              than the previous years. However, while the difference was
al., 2020) who compared the lockdown data to a period of               statistically significant, it only increased by 0.8 m s–1. More
time in 2020 preceding the lockdown.                                   detailed comparisons can be found in Figs. S2–S5 in the
   Firstly, we observed that the difference of meteorological          Appendix.
parameters in the same period over different years is much
smaller than the variation between two consecutive periods             The Reduction of Air Pollutant Due to COVID-19
before and after the lockdown due to seasonal trends, as               Lockdown
shown in Figs. S2–S5 in Appendix. The total rainfall in                   The national level of daily PSI and mass concentrations
April is significantly higher than the rainfall in March, as           of PM10, PM2.5, NO2, CO, SO2, and O3 measured from 07
shown in Fig. S4 in Appendix. Meteorological monthly or                April and 11 May for five consecutive years (2016–2020)
seasonal trends affect significantly some air pollutants in            are plotted using boxplots in Fig. 1. The filled boxes are the
Singapore within each year. Hence, the difference between              interquartile ranges (IQR) for the air quality values in each
the lockdown period and the period of time preceding it could          year. The horizontal line in the box is the median, and the
be inherently different and not related to the COVID-19                rhombus dot is the arithmetic mean. Whiskers of the boxes
pandemic. On the contrary, the difference of the air pollutant         start from the upper and lower limits of the box and end at
between the same period in different years are much smaller.           the length of 1.5 times the IQR or at the maximum and
   Secondly, after the first confirmed cases in Singapore on           minimum values whichever is reached first.
23 January, Singaporean government started to implement                   During the lockdown period, the PSI was always lower
measures to contain the local transmission of the virus, such          than 50, which is classified by the NEA as “Good” on a 5–
as raising the DORSCON level to orange (7 February) and an             point scale with the following categories “Good (PSI: 0–
advisory about encouraging people work by telecommuting                50)”, “Moderate (PSI: 51–100)”, “Unhealthy (PSI: 101–200)”,
from home. These early measures may have impacted the                  “Very Unhealthy (PSI: 201–300)” and “Hazardous (PSI:
air quality in Singapore even before the lockdown. Hence,              above 300)”. All air pollutant levels during the lockdown
air quality during a period before the lockdown is not suitable        period were below the Singapore Targets by 2020 (National
to serve as the baseline.                                              Environment Agency, 2011) which are listed in the Table S1
   We used the Wilcoxon signed-rank test to compare the                in Appendix. On the other hand, the PSI for the same period
difference of the parameter during between different periods.          of last four years were higher than 50 (“Moderate”) for more
We performed Spearman’s rank correlation to access the                 than 65% of the time. All the air quality parameters in 2020

Table 1. Mean and standard deviation (SD, in parentheses) of the meteorological parameter from 7th of April to 11th of May
in 2020, 2019, and 2016–2019 overall.
  Parameters                   2020                          2019                          2016–2019
  Temperature (°C)             28.7 (0.9)                    28.9 (0.9) NS.                28.3 (0.9) NS.
                                                                         NS.
  Relative humidity (%)        79.7 (5.5)                    78.7 (4.5)                    80.6 (4.4) NS.
                                                                         NS.
  Daily rainfall (mm)          8.2 (10.8)                    7.4 (12.1)                    6.3 (9.2) NS.
                                                                             NS.
  Wind direction (°)           145.2 (53.9)                  167.0 (54.9)                  162.4 (48.6) NS.
  Windspeed (m s–1)            4.7 (0.5)                     3.9 (0.6) ***                 4.2 (0.9) ***
***     NS.
    and denote that the difference between the noted value and the corresponding value in 2020 are with high and no
significance, respectively.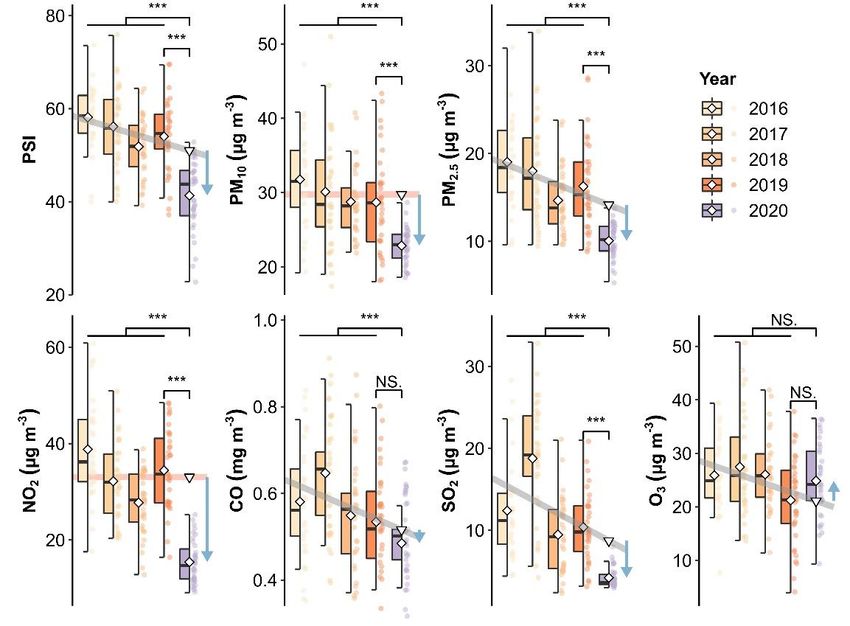
S
Li and Federico Tartarini, Aerosol and Air Quality Research, 20: 1748–1758, 2020 1751
Fig. 1. National air quality parameters for the period starting on the 7th of April and ending on the 11th of May, from 2016
to 2020. NS., *, **, and *** denote the difference between two samples is at the level of no (Wilcoxon p ≥ 0.05), low (0.01 ≤ p
< 0.05), medium (0.001 ≤ p < 0.01), and high (p < 0.001) significances, respectively. The inverted triangle is the
counterfactual concentration.
during the lockdown period were significantly lower than Though PM10 and CO were decreasing this year nationally
those in the previous years, with the exception of O3. Fig. 1 in general, we observed an increase in concentrations for
shows that some of the air quality variables (PSI, PM2.5, CO, some of the locations. In particular, we observed a nationwide
SO2, and O3) improved over the years, others not (PM10 and increase of O3 during the lockdown period, except for the
NO2). We used semi-transparent grey lines to depict those western area. Similarly, increased O3 concentrations were
values with significantly decreased over the last 4 years observed during the lockdown period in several cities around
(i.e., PSI, PM2.5, CO, SO2, and O3) in Fig. 1. For these world (Chen et al., 2020b; Collivignarelli et al., 2020;
parameters, predicted values in the year 2020 are used as the Dantas et al., 2020; Kerimray et al., 2020), which may be
counterfactual concentration and marked as inverted triangles explained by a significant reduction of NO2 concentrations
in Fig. 1. We then calculated the reduction by subtracting (Sicard et al., 2020).
the average value measured this year from the counterfactual The different reduction rates among locations could be
value. We showed these differences as blue arrows in Fig. 1, caused by the spatial distribution of the different pollution
and summarized the results into Table 2. sources in Singapore. All the heavy industries, refineries
During the lockdown period the national PSI decreased and the harbor in Singapore are located in the south-west
by 19% compared to the predicted value for 2020, which part of the island. Singapore is one of biggest harbor in the
suggests that the lockdown due to the COVID-19 pandemic world. To better understand the spatial variations of outdoor
had a positive impact on the reduction of the overall PSI pollutants in the outdoor air we obtained data from the ESA
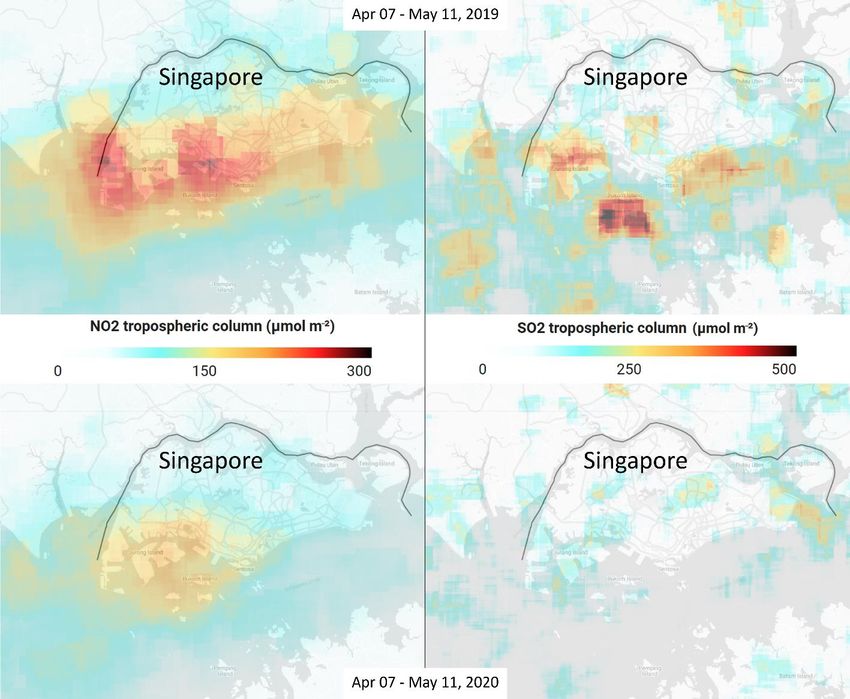
value. The reduction of 29% in the southern area of Copernicus Sentinel 5P satellite. Fig. 2 shows the mean
Singapore was the highest, and 17% in the west and north value of the NO2 and SO2 tropospheric column over Singapore.
was the lowest. PM2.5 dominated PSI in Singapore, which Satellite images show similar trends to those observed by
had the third-highest reduction of 29% nationally. The ground stations and the biggest reductions of NO2
PM2.5 level decreased by nearly a half in the southern area, concentrations were observed in the south and west regions
which was the highest reduction among the five stations. of the island. The biggest reductions of SO2 concentrations
NO2 and SO2 had the highest and second-highest reduction where observed over the island of Pulau Bukom which is an
regarding percentage change rates, which decreased by 54% oil and petrochemicals site with manufacturing facilities for
and 52% nationally in this year, respectively. The change in fuels, lubricant base oils and specialty chemicals. These
PM10, CO, and O3 concentrations were relatively low when results would, therefore, suggest that the COVID-19 and
compared to other pollutants. Also, their concentration related and concurrent oil crisis may have led to a reduction
variations were not consistent among the various locations. of petrochemical activities in Singapore. From Fig. 2, it can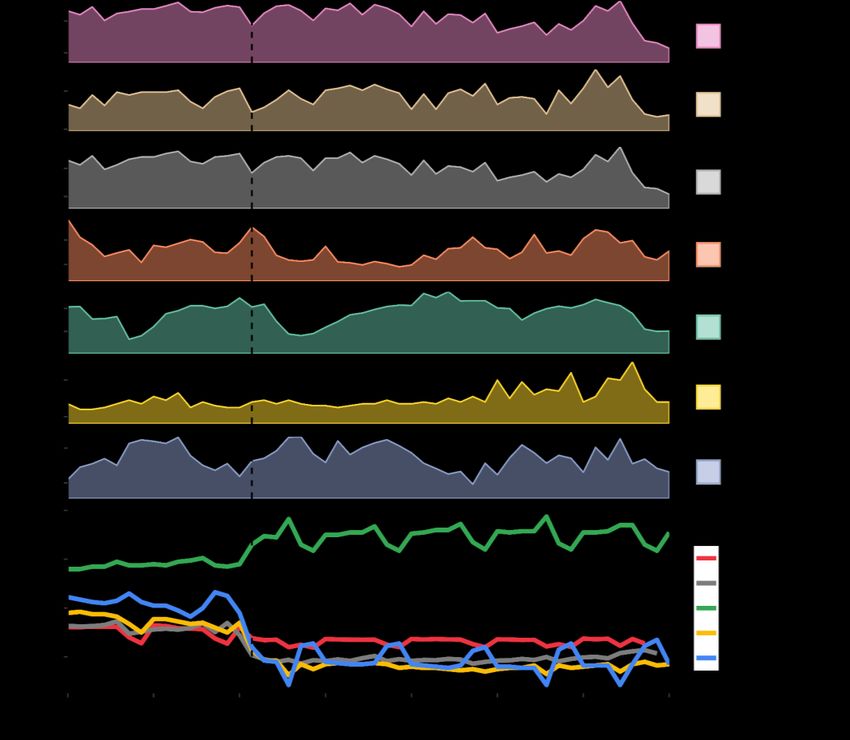
S
1752                       Li and Federico Tartarini, Aerosol and Air Quality Research, 20: 1748–1758, 2020

Table 2. The change of air quality parameters during the COVID-19 pandemic at national level and at five different locations
in Singapore.
                                   National                             Central                              East
 Parameter
                     Baseline      Lockdown         Δ % Baseline        Lockdown       Δ % Baseline         Lockdown      Δ%
   PSI               51 ||         41.3             –19    54.9 ***     43.7           –20    53.1 ***      42.6          –20
   PM10 (µg m–3)     29.8 ***      23               –23    28.1 ***     23.4           –17    32.5 ||       25.5          –21
   PM2.5 (µg m–3)    14.4 ||       10.1             –30    16.8 ***     11             –34    15.7 ***      10.4          –34
   NO2 (µg m–3)      33.1 ***      15.1             –54    27.7 ||      14.4           –48    27.8 ***      14            –50
   CO (mg m–3)       0.5 ||        0.5              –6     0.4 ||       0.4            –9     0.5 ***       0.6           35
   SO2 (µg m–3)      8.7 ||        4.2              –52    6.1 ||       3.6            –41    11.4 ***      2.9           –74
   O3 (µg m–3)       21.1 ||       24.9             18     25.5 **      30             17     23.4 NS.      23.7          1
                                     West                                South                               North
   Parameter
                       Baseline    Lockdown         Δ % Baseline        Lockdown       Δ % Baseline         Lockdown      Δ%
   PSI                 46.6 ||     38.6             –17    57.3 ***     40.5           –29    50.7 ||       42            –17
   PM10 (µg m–3)       22.6 ||     22.9             1      34.1 ***     21.5           –37    19.2 ||       21.5          12
   PM2.5 (µg m–3)      12.3 ||     9.2              –25    18.3 ***     9.8            –46    13.9 ||       10.2          –27
   NO2 (µg m–3)        22.9 ||     15.2             –33    31.6 ***     18.9           –40    33.7 ***      14.1          –58
   CO (mg m–3)         0.6 ***     0.5              –18    0.5 *        0.5            –13    0.6 ||        0.4           –26
   SO2 (µg m–3)        15.4 ***    7.1              –54    10.1 ||      5.3            –48    8.7 ***       2.2           –74
   O3 (µg m–3)         25.7 ***    15.9             –38    13.9 ||      31.9           129    20.9 ||       23            10
||
   denotes that the predicted value in 2020, i.e., the counterfactual concentration, was used for the baseline. Otherwise, the
mean value of same period of last four years was used for the baseline, and star signs are given according to p values
(*: 0.01 ≤ p < 0.05, low significance; **: 0.001 ≤ p < 0.01, medium significance; ***: p < 0.001, high significance) after
Wilcoxon signed-rank tests with the value in this year during the lockdown.

Fig. 2. Shows the mean tropospheric column concentrations of NO2 (left side) and SO2 (right side) from 7th of April and 11th
of May 2019 (top side) and 2020 (bottom side). Data were obtained from the ESA Copernicus Sentinel 5P satellite.
S
Li and Federico Tartarini, Aerosol and Air Quality Research, 20: 1748–1758, 2020 1753
also be observed that NO2 concentrations decreased in the same period, changes in outdoor pollutants concentrations
east side of Singapore. The reduction could be attributed to were less pronounced than those observed in the mobility
the reduced number of flights that landed and departed from data. We can observe fluctuating downward trends for
Singapore’s airport (located on the east side of the country) PM2.5, and NO2 levels during the lockdown period, while an
and possible due to the decrease in operation of the heavy increasing trend for SO2 levels.
industry in Malaysia located in Pasir Gudang (north east of To better understand the impact that the reduction in
Singapore). mobility observed in Fig. 3 had on the number of people
Due to the low spatial resolution of AOD data, we could commuting to and from their home using a motorized
not analyze the spatial variations within Singapore, and we vehicle, we plotted the HDB carpark availability in 2020 in
decided to report the data collected in the Southeast Asia Fig. 5. The figure shows that while in January during working
region. Comparing to the same period in 2019, the total days between 9 and 19 up to 70% of the parking spots were
AOD at 550 nm in Singapore decreased significantly in available, this percentage reduced to 55% during the
2020 during the lockdown. From Fig. 3, we observed that lockdown period.
areas around Singapore also experienced a decrease of the The correlations between air quality and mobility
AOD during this year. However, capitals of nearby countries parameters were tested via Spearman’s rank test and the
such as Kuala Lumpur and Jakarta, showed an increase of results are listed in Table 3. PM2.5 concentrations were
the AOD level. significantly correlated with all the mobility trends and had
the highest correlation coefficients with trends of people
Correlations between Air Quality and Mobility who visited transit stations comparing to other mobility data.
In order to better understand the relationship between The second-highest coefficient of PM2.5 was the workplace
outdoor air pollution and mobility data. We plotted in Fig. 4 from Google database, which implies that the shutdown of
the daily average levels of PSI, PM10, PM2.5, NO2, CO, SO2, some industries could contribute to the reduction of PM2.5.
and O3 along with the selected mobility trends from HDB, NO2 only significantly correlated with the mobility trends of
Apple, and Google databases. car park availability (HDB dataset), driving (Apple dataset),
Fig. 4 shows an immediate change in community mobility and transit station (Google dataset), but did not with the
on the 07th of April 2020 when the lockdown measures were workplace and residential ones. Both workplaces and traffic
implemented. Fewer people drove, took public transportation are among the main sources of PM2.5, but NO2 are more
and went to work, while more people stayed at home. traffic related. For SO2, we found positive correlations with
Mobility levels declined before and after the day the the human mobility trend in residential places but negative
lockdown measures were implemented but in a much correlations with the other mobility trends. For PM10, CO,
gentler way. This suggests that the measures were effective and O3, we did not find any significant correlation with
and widely adopted by the public. The daily averaged HDB mobility data, while O3 concentrations showed a negative
car park availability decreased from 54% to 49%. Over the correlation with car park availability.
Fig. 3. Shows the mean total AOD at 550 nm from 7th of April and 11th of May 2019 (left side) and 2020 (right side). Data
were obtained from the Copernicus Atmosphere Monitoring Service (CAMS).S
1754 Li and Federico Tartarini, Aerosol and Air Quality Research, 20: 1748–1758, 2020
Fig. 4. Daily trends of the air quality parameter and the mobility levels since the start of earlier measures on 20 Mar 2020.
h, a,
and g denote that sources of the dataset are from HDB, Apple, and Google, respectively.
Fig. 5. HDB carpark availability prior and during the lockdown period. We centered the color bar using the percentage of
car spaces available on the 7th of April (first day of the lockdown period) at 11:00 the time of the day when generally the
highest percentage of parking spots are available.S
Li and Federico Tartarini, Aerosol and Air Quality Research, 20: 1748–1758, 2020 1755
Table 3. Spearman’s rank correlation coefficients (Spearman's ρ) between air quality and mobility parameters.
Car park h Driving a Workplace g Transit station g Residential g
PM10 (µg m–3) –0.03 NS. –0.05 NS. –0.07 NS. –0.05 NS. 0.09 NS.
PM2.5 (µg m–3) 0.14 * 0.17 ** 0.21 *** 0.28 *** –0.19 ***
NO2 (µg m–3) 0.33 *** 0.24 *** 0.03 NS. 0.18 ** –0.06 NS.
CO (mg m–3) 0.07 NS. –0.01 NS. –0.08 NS. –0.07 NS. 0.06 NS.
SO2 (µg m–3) –0.12 * –0.08 NS. –0.21 *** –0.19 *** 0.22 ***
O3 (µg m–3) –0.2 *** –0.06 NS. –0.02 NS. 0.04 NS. 0.02 NS.
h, a,
& g denote that the mobility data is from HDB, Apple and Google datasets, respectively. *, **, and *** denote
correlations between two samples are significant at the levels of 0.01 ≤ p < 0.05, 0.001 ≤ p < 0.01, and p < 0.001;
NS.
denotes two samples are not significant corelated (p ≥ 0.05).
It is important to note that in Singapore the great majority drop of PM2.5 between 11.3 and 23.7% during 18 March to
of the population uses public transportation to commute and 14 April 2020 compared to 14 to 17 March 2020 (Abdullah
to move around. In 2018, in Singapore there were 957,006 et al., 2020). Suhaimi et al. (2020) showed a reduction of
registered vehicles out of which 615,452 were cars (Land PM2.5, NO2, CO, and SO2 by 3 to 36%, 43 to 68%, 1 to 48%,
Transport Authority, 2018). Consequently, less than 11% of and 2 to 48% according to different regions between 18
the people living in Singapore owned a car. During the March and 21 April 2020 in Malaysia (Suhaimi et al., 2020).
lockdown period the daily bus and train ridership decreased Nadzir et al. (2020) reported that CO concentrations decreases
by more than 71% and 75%, respectively. The Singaporean ranging from 40.5 to 47.5%, but PM2.5 levels showed a both
Transport Authority from the 15th of April announced a that increase and decrease according to different regions in
few lines were closed, however, the great majority of the bus Malaysia during the period from 18 March to 08 April 2020
lines, and metro trains continued to operate (Land Transport (Nadzir et al., 2020). In general, the reported reductions of
Authority, 2020). Thus, while the number of people going to air pollutants during the lockdown were comparable with
work and using public transportation decreased significantly the results we obtained. Compared to those studies in Southeast
the pollution released by public transportation sector did not Asia, the reductions of PM2.5, NO2, and SO2 concentrations
decrease by the same percentage. in Singapore were higher, while the reductions in CO were
lower than in the neighboring regions, respectively.
DISCUSSION
Limitation
Heath Benefits of the Reduction of Air Pollutant In Singapore outdoor pollutants concentrations vary as a
Particulate matter negatively affects the health of people function of those pollutants generated within the country
since it can penetrate inside the lungs and those particles and those from neighboring countries. In this study, we did
with a diameter smaller than 2.5 microns can even enter the not account the contribution of air pollutants from
blood stream. This contributes to higher risks of developing neighboring countries. The lockdown periods of Singapore
cardiovascular, respiratory diseases and lung cancer. The and other neighboring countries were overlapped with each
World Health Organization (WHO) estimates that a reduction other, which may have had a mutual impact on the air
in the annual average concentration of particulate matter quality of this region. Another limitation of this study was
(PM2.5) from 35 to 10 µg m–3 (WHO, 2018), reductions similar that while we gathered information on mobility from various
to those observed during the lockdown period, correspond sources, we did not have sufficient data to estimate the exact
to a reduction in pollution related deaths by around 15%. reduction of vehicular traffic on the roads. We also did not
Consequently, the reduction in outdoor pollutants during the have data on how much some industrial activities (e.g., port,
COVID lockdown may have had a positive impact both in refineries, airport, power generation) decreased during the
the short- and long-term health of Singaporeans. We observed lockdown period. Consequently, while we observed that they
PM10 and PM2.5 24-h mean concentrations lower than the play a significant role in generating harmful outdoor pollutants,
WHO recommended level which are 50 µg m–3 and 25 µg m–3, we were not able to correlate a decrease in emission from
respectively. Moreover, the measured PM concentrations industrial activities with a reduction in outdoor concentrations.
fluctuated around the recommended annual mean annual mean Finally, while we observed a significant decrease in outdoor
concentrations which are 20 µg m–3 for PM10 and 10 µg m–3 pollutants, it would be difficult to estimate the positive health
for PM2.5. effect on the population since the great majority of the
population stayed indoor during the lockdown period and
Changes in Air Quality in Southeast Asia was exposed to the cleaner air only for a short period of time.
In southeast Asia, NO2 levels decreased by 27, 30, 22, 34,
34% in Kuala Lumpur, Singapore, Bangkok, Jakarta, CONCLUSIONS
Manila based on satellite images during 10 to 24 April in
2020 comparing to the average of the same period from In this study, we used nationwide data of PSI, PM10,
2015 to 2019 (Kasturi Devi Kanniah et al., 2020). The PM2.5, NO2, CO, SO2, and O3 from 2016 to 2020 to
neighboring nation of Malaysia reported a national-wide determine how outdoor pollutants concentrations varies1756 Li and Tartarini, Aerosol and Air Quality Research, 20: 1748–1758, 2020
during the lockdown period (from the 7th April to the 11th Atwood, S.A., Reid, J.S., Kreidenweis, S.M., Yu, L.E.,
May) in Singapore. Detailed spatial distribution characteristics Salinas, S.V., Chew, B.N. and Balasubramanian, R. (2013).
of NO2 and SO2 were analyzed using data from the Analysis of source regions for smoke events in Singapore
European Space Agency Copernicus Sentinel 5P satellite. for the 2009 El Nino burning season. Atmos. Environ. 78:
Mobility datasets from the Singaporean Housing Development 219–230. https://doi.org/10.1016/j.atmosenv.2013.04.047
Board, Apple, and Google were used to identify the influence Benedetti, A., Morcrette, J.J., Boucher, O., Dethof, A.,
factors of the improvement of air quality. The main findings Engelen, R.J., Fisher, M., Flentje, H., Huneeus, N., Jones,
are listed below: L., Kaiser, J.W., Kinne, S., Mangold, A., Razinger, M.,
1. Nationwide, the reductions in PSI, PM10, PM2.5, NO2, Simmons, A.J. and Suttie, M. (2009). Aerosol analysis
CO, and SO2 were 19, 23, 29, 54, 6, and 52%, and forecast in the European Centre for medium-range
respectively, while O3 increased by 18%. weather forecasts integrated forecast system: 2. Data
2. The levels of PSI, PM2.5, NO2, and SO2 decreased during assimilation. J. Geophys. Res. 114: D13205. https://doi.org/
the lockdown in all the five areas of Singapore, while 10.1029/2008JD011235
PM10 in the north and CO in the east showed opposite Brandt, E.B., Beck, A.F. and Mersha, T.B. (2020). Air
trends. O3 decreased only in the west but increased in the pollution, racial disparities and COVID-19 mortality. J.
other four areas. The southern and western areas had the Allergy Clin. Immunol. 146: 61–63. https://doi.org/10.10
most substantial reduction of air pollution in Singapore, 16/j.jaci.2020.04.035
which is due to the local spatial distribution of heavy Chen, K., Wang, M., Huang, C., Kinney, P.L. and Anastas,
industries and the airport. P.T. (2020a). Air pollution reduction and mortality
3. The levels of PM2.5 and NO2 were significantly correlated benefit during the COVID-19 outbreak in China. Lancet
with the reduction trend of human mobility data. The Planetary Health 4: e210–e212. https://doi.org/10.1016/
reduced visits to workplaces and transit stations had the S2542-5196(20)30107-8
highest two correlation coefficient with PM2.5, and the Chen, Q.X., Huang, C.L., Yuan, Y. and Tan, H.P. (2020b).
reduction of traffic-related mobility data, such as, car Influence of COVID-19 event on air quality and their
park availability and driving, correlated with NO2. association in Mainland China. Aerosol Air Qual. Res. 20:
4. The satellite data showed that the slowdown in the 1541–1551. https://doi.org/10.4209/aaqr.2020.05.0224
aviation, refining, and port activities contributed to the Collivignarelli, M.C., Abbà, A., Bertanza, G., Pedrazzani,
reduction of NO2, SO2 and AOD concentrations. R., Ricciardi, P. and Carnevale Miino, M. (2020).
Lockdown for CoViD-2019 in Milan: What are the
ACKNOWLEDGMENTS effects on air quality? Sci. Total Environ. 732: 139280.
https://doi.org/10.1016/j.scitotenv.2020.139280
This research was funded by the Republic of Singapore's Dantas, G., Siciliano, B., França, B.B., da Silva, C.M. and
National Research Foundation through a grant to the Arbilla, G. (2020). The impact of COVID-19 partial
Berkeley Education Alliance for Research in Singapore lockdown on the air quality of the city of Rio de Janeiro,
(BEARS) for the Singapore-Berkeley Building Efficiency Brazil. Sci. Total Environ. 729: 139085. https://doi.org/
and Sustainability in the Tropics (SinBerBEST) Program. 10.1016/j.scitotenv.2020.139085
BEARS has been established by the University of Dutheil, F., Baker, J.S. and Navel, V. (2020). COVID-19 as
California, Berkeley as a center for intellectual excellence a factor influencing air pollution? Environ. Pollut. 263:
in research and education in Singapore. 114466. https://doi.org/10.1016/j.envpol.2020.114466
European Space Agency (2020). Sentinel-5P TROPOMI
DISCLAIMER user guide. Sentinel Online. https://sentinel.esa.int/web/
sentinel/user-guides/sentinel-5p-tropomi
The authors declare that they have no conflict of interest. Fattorini, D. and Regoli, F. (2020). Role of the chronic air
pollution levels in the COVID-19 outbreak risk in Italy.
SUPPLEMENTARY MATERIAL Environ. Pollut. 264: 114732. https://doi.org/10.1016/j.e
nvpol.2020.114732
Supplementary data associated with this article can be Filonchyk, M., Hurynovich, V., Yan, H., Gusev, A. and
found in the online version at https://aaqr.org/ Shpilevskaya, N. (2020). Impact assessment of COVID-
19 on variations of SO2, NO2, CO and AOD over East
REFERENCES China. Aerosol Air Qual. Res. 20: 1530–1540.
https://doi.org/10.4209/aaqr.2020.05.0226
Abdullah, S., Mansor, A.A., Napi, N.N.L.M., Mansor, Google LLC. (2020). COVID-19 community mobility report.
W.N.W., Ahmed, A.N., Ismail, M. and Ramly, Z.T.A. COVID-19 Community Mobility Reports. https://www.g
(2020). Air quality status during 2020 Malaysia Movement oogle.com/covid19/mobility
Control Order (MCO) due to 2019 novel coronavirus Gorelick, N., Hancher, M., Dixon, M., Ilyushchenko, S.,
(2019-nCoV) pandemic. Sci. Total Environ. 729: Thau, D. and Moore, R. (2017). Google Earth Engine:
139022. https://doi.org/10.1016/j.scitotenv.2020.139022 Planetary-scale geospatial analysis for everyone. Remote
Apple Inc. (2020). COVID‑19 - Mobility trends reports. Sens. Environ. 202: 18-27. https://doi.org/10.1016/j.rse.2
https://www.apple.com/covid19/mobility 017.06.031Li and Tartarini, Aerosol and Air Quality Research, 20: 1748–1758, 2020 1757 Housing and Development Board (HDB) (2018). Annual dynamics of indoor and outdoor fluorescent biological Reports - Housing & Development Board (HDB). aerosol particles in a bedroom: A one-month case study in https://www.hdb.gov.sg/cs/infoweb/about-us/news-and- Singapore. Indoor Air https://doi.org/10.1111/ina.12678 publications/annual-reports Lim, L.W., Yip, L.W., Tay, H.W., Ang, X.L., Lee, L.K., Housing and Development Board (HDB) (2020). HDB Chin, C.F. and Yong, V. (2020). Sustainable practice of Carpark Information. Data.gov.sg. https://data.gov.sg/da ophthalmology during COVID-19: challenges and taset/hdb-carpark-information solutions. Graefes Arch. Clin. Exp. Ophthalmol. 258: 1427– Huijnen, V., Eskes, H.J., Wagner, A., Schulz, M., 1436. https://doi.org/10.1007/s00417-020-04682-z Christophe, Y., Ramonet, M., Basart, S., Benedictow, A., Meteorological Service Singapore (MSS) (2018). Annual Blechschmidt, A.M., Chabrillat, S., Clark, H., Cuevas, climatological report 2018. http://www.weather.gov.sg/ E., Flentje, H., Hansen, K.M., Im, U., Kapsomenakis, J., wp-content/uploads/2019/03/Annual-Climatological-Re Langerock, B., Richter, A., Sudarchikova, N. and Thouret, port-2018.pdf V. (2016). Validation report of the CAMS near-real-time Ministry of Health (2020a). Confirmed imported case of global atmospheric composition service: System evolution novel coronavirus infection in Singapore. https://www.moh. and performance statistics. Status up to 1 June 2016. gov.sg/news-highlights/details/confirmed-imported-case- https://pure.au.dk/portal/en/persons/ulas-im(e2356d82- of-novel-coronavirus-infection-in-singapore-multi-minis 8e7b-49c9-b660-76e719a4058e)/publications/validation- try-taskforce-ramps-up-precautionary-measures report-of-the-cams-nearrealtime-global-atmospheric- Ministry of Health (2020b). circuit breaker to minimise composition-service-system-evolution-and-performance- further spread of COVID-19. https://www.moh.gov.sg/n statistics-status-up-to-1-june-2016(d3511b2f-b56a-4fe5- ews-highlights/details/circuit-breaker-to-minimise-furth 9400-1e469b1de93f).html er-spread-of-covid-19 Jiang, Y., Wu, X.J. and Guan, Y.J. (2020). Effect of ambient Ministry of Health (2020c). Easing the tighter circuit air pollutants and meteorological variables on COVID- breaker measures, preparing for gradual resumption of 19 incidence. Infect. Control Hosp. Epidemiol. 1–5. activity after 1 June. https://www.moh.gov.sg/news- https://doi.org/10.1017/ice.2020.222 highlights/details/easing-the-tighter-circuit-breaker-mea Kanniah, K.D., Zaman, N.A.F.K., Kaskaoutis, D.G. and sures-preparing-for-gradual-resumption-of-activity-after- M.T. (2020). COVID-19’s impact on the atmospheric 1-june environment in the Southeast Asia region. Sci. Total Morcrette, J.J., Boucher, O., Jones, L., Salmond, D., Environ. 736: 139658. https://doi.org/10.1016/j.scitotenv. Bechtold, P., Beljaars, A., Benedetti, A., Bonet, A., Kaiser, 2020.139658 J.W., Razinger, M., Schulz, M., Serrar, S., Simmons, Kerimray, A., Baimatova, N., Ibragimova, O.P., Bukenov, A.J., Sofiev, M., Suttie, M., Tompkins, A.M. and Untch, B., Kenessov, B., Plotitsyn, P. and Karaca, F. (2020). A. (2009). Aerosol analysis and forecast in the European Assessing air quality changes in large cities during Centre for medium-range weather forecasts integrated COVID-19 lockdowns: The impacts of traffic-free urban forecast system: Forward modeling. J. Geophys. Res. conditions in Almaty, Kazakhstan. Sci. Total Environ. 730: 114: D06206. https://doi.org/10.1029/2008JD011235 139179. https://doi.org/10.1016/j.scitotenv.2020.139179 Muhammad, S., Long, X. and Salman, M. (2020). COVID- Kramer, H.J. (2002). Observation of the Earth and its 19 pandemic and environmental pollution: A blessing in environment: Survey of missions and sensors, Springer- disguise? Sci. Total Environ. 728: 138820. https://doi.org/ Verlag, Berlin Heidelberg. 10.1016/j.scitotenv.2020.138820 Lal, P., Kumar, A., Kumar, S., Kumari, S., Saikia, P., Myllyvirta, L. (2020). 11,000 air pollution-related deaths Dayanandan, A., Adhikari, D. and Khan, M.L. (2020). avoided in Europe as coal, oil consumption plummet. The dark cloud with a silver lining: Assessing the impact Centre for Research on Energy and Clean Air. of the SARS COVID-19 pandemic on the global https://energyandcleanair.org/air-pollution-deaths-avoid environment. Sci. Total Environ. 732: 139297. ed-in-europe-as-coal-oil-plummet/ https://doi.org/10.1016/j.scitotenv.2020.139297 Nadzir, M.S.M., Ooi, M.C.G., Alhasa, K.M., Bakar, Land Transport Authority (2018). Annual Vehicle Statistics M.A.A., Mohtar, A.A.A., Nor, M.F.F.M., Latif, M.T., 2018. Hamid, H.H.A., Ali, S.H.M., Ariff, N.M., Anuar, J., Land Transport Authority (2020). Changes to public bus Ahamad, F., Azhari, A., Hanif, N.M., Subhi, M.A., and train operating hours and frequency. https://www.lt Othman, M. and Nor, M.Z.M. (2020). The impact of a.gov.sg/content/ltagov/en/newsroom/2020/april/news- Movement Control Order (MCO) during pandemic releases/Changes_to_public_bus_and_train_operating_h COVID-19 on local air quality in an urban area of Klang ours.html Valley, Malaysia. Aerosol Air Qual. Res. 20: 1237–1248. Le, T., Wang, Y., Liu, L., Yang, J., Yung, Y.L., Li, G. and https://doi.org/10.4209/aaqr.2020.04.0163 Seinfeld, J.H. (2020). Unexpected air pollution with marked National Environment Agency (2011). Executive summary emission reductions during the COVID-19 outbreak in report of the advisory committee on ambient air quality. China. Science 2020: eabb7431 https://doi.org/10.1126/s https://www.nea.gov.sg/docs/default-source/our-services/ cience.abb7431 pollution-control/air-pollution/air-quality/executive-sum Li, J., Wan, M.P., Schiavon, S., Tham, K.W., Sultan, Z., mary.pdf Xiong, J., Fang, M. and Gall, E. (2020). Size-resolved National Environment Agency (2014). Computation of the
1758                           Li and Tartarini, Aerosol and Air Quality Research, 20: 1748–1758, 2020

  Pollutant Standards Index (PSI). https://www.haze.gov.sg/       Sciomer, S., Moscucci, F., Magrì, D., Badagliacca, R.,
  docs/default-source/faq/computation-of-the-pollutant-st           Piccirillo, G. and Agostoni, P. (2020). SARS-CoV-2
  andards-index-(psi).pdf                                           spread in Northern Italy: What about the pollution role?
National Environment Agency (2020a). Air quality in                 Environ. Monit. Assess. 192: 325. https://doi.org/10.1007/
  Singapore. https://www.nea.gov.sg/our-services/pollutio           s10661-020-08317-y
  n-control/air-pollution/air-quality                             Sicard, P., De Marco, A., Agathokleous, E., Feng, Z., Xu,
National Environment Agency (2020b). Realtime weather               X., Paoletti, E., Rodriguez, J.J.D. and Calatayud, V.
  readings across Singapore. Data.gov.sg. https://data.gov.         (2020). Amplified ozone pollution in cities during the
  sg/dataset/realtime-weather-readings                              COVID-19 lockdown. Sci. Total Environ. 735: 139542.
National Environment Agency (2020c). Pollutant standards            https://doi.org/10.1016/j.scitotenv.2020.139542
  index. (PSI) Data.gov.sg. https://data.gov.sg/dataset/psi       Suhaimi, N.F., Jalaludin, J. and Latif, M.T. (2020).
National Environment Agency (2020d). The national                   Demystifying a possible relationship between COVID-
  environment agency. https://www.nea.gov.sg/index                  19, air quality and meteorological factors: Evidence from
Ng, N.M. (2020). Things you need to know about                      Kuala Lumpur, Malaysia. Aerosol Air Qual. Res. 20:
  Singapore’s “circuit breaker” measures. Time Singap.              1520–1529. https://doi.org/10.4209/aaqr.2020.05.0218
  https://www.timeout.com/singapore/things-to-do/things-          Velasco, E. and Rastan, S. (2015). Air quality in Singapore
  you-need-to-know-about-singapores-circuit-breaker-me              during the 2013 smoke-haze episode over the Strait of
  asures                                                            Malacca: Lessons learned. Sustain. Cities Soc. 17: 122–
Ogen, Y. (2020). Assessing nitrogen dioxide (NO2) levels            131. https://doi.org/10.1016/j.scs.2015.04.006
  as a contributing factor to coronavirus (COVID-19)              Wong, J.E.L., Leo, Y.S. and Tan, C.C. (2020). COVID-19
  fatality. Sci. Total Environ. 726: 138605. https://doi.org/       in Singapore—current experience: Critical global issues
  10.1016/j.scitotenv.2020.138605                                   that require attention and action. JAMA 323: 1243–1244.
Otmani, A., Benchrif, A., Tahri, M., Bounakhla, M., Chakir,         https://doi.org/10.1001/jama.2020.2467
  E.M., El Bouch, M. and Krombi, M. (2020). Impact of             World Health Organization (WHO) (2006). WHO Air
  COVID-19 lockdown on PM10, SO2 and NO2                            quality guidelines for particulate matter, ozone, nitrogen
  concentrations in Salé City (Morocco). Sci. Total Environ.        dioxide and sulfur dioxide: Global update 2005:
  735: 139541. https://doi.org/10.1016/j.scitotenv.2020.13          Summary of risk assessment. World Health Organization,
  9541                                                              Geneva.
Pani, S.K., Lin, N.H. and RavindraBabu, S. (2020).                World Health Organization (WHO) (2018). Ambient (outdoor)
  Association of COVID-19 pandemic with meteorological              air pollution. https://www.who.int/news-room/fact-sheet
  parameters over Singapore. Sci. Total Environ. 740:               s/detail/ambient-(outdoor)-air-quality-and-health
  140112. https://doi.org/10.1016/j.scitotenv.2020.140112         Xu, K., Cui, K., Young, L.H., Hsieh, Y.K., Wang, Y.F., Zhang,
Pung, R., Chiew, C.J., Young, B.E., Chin, S., Chen, M.I.C.,         J. and Wan, S. (2020). Impact of the COVID-19 event on
  Clapham, H.E., Cook, A.R., Maurer-Stroh, S., Toh,                 air quality in central China. Aerosol Air Qual. Res. 20:
  M.P.H.S., Poh, C., Low, M., Lum, J., Koh, V.T.J., Mak,            915–929. https://doi.org/10.4209/aaqr.2020.04.0150
  T.M., Cui, L., Lin, R.V.T.P., Heng, D., Leo, P.Y.S., Lye,       Yao, M., Zhang, L., Ma, J. and Zhou, L. (2020). On airborne
  D.C., … Ang, L.W. (2020). Investigation of three clusters         transmission and control of SARS-Cov-2. Sci. Total
  of COVID-19 in Singapore: Implications for surveillance           Environ. 731: 139178. https://doi.org/10.1016/j.scitoten
  and response measures. Lancet 395: 1039–1046.                     v.2020.139178
  https://doi.org/10.1016/S0140-6736(20)30528-6
Safarian, S., Unnthorsson, R. and Richter, C. (2020). Effect
  of coronavirus disease 2019 on CO2 emission in the world.                                 Received for review, June 11, 2020
  Aerosol Air Qual. Res. 20: 1197–1203. https://doi.org/1                                                 Revised, July 2, 2020
  0.4209/aaqr.2020.04.0151                                                                             Accepted, July 16, 2020
You can also read