Environment Canterbury Greenhouse Gas Emissions 2017 Calendar Year
←
→
Page content transcription
If your browser does not render page correctly, please read the page content below
Environment Canterbury
Greenhouse Gas Emissions
   2017 Calendar Year

                           1
Contents
1 INTRODUCTION .................................................................................................................. 5
1.1 Organisation Description............................................................................................. 5
1.2 Statement of Intent ..................................................................................................... 5
1.3 Approach and Scope ................................................................................................... 6
1.4 Report Layout .............................................................................................................. 7
1.5 Organisational Boundaries .......................................................................................... 7
1.6 Operational Boundaries & Exclusions ......................................................................... 8
1.7 Reporting Period: Calendar Year 2017 ........................................................................ 8
2 TOTAL EMISSIONS............................................................................................................... 9
3 EMISSION SOURCE METHODOLOGY ................................................................................ 11
4 GREENHOUSE GAS EMISSIONS ......................................................................................... 12
4.1 Scope 1. Emissions .................................................................................................... 12
4.1.1 Stationary Combustion of Fuels ......................................................................... 12
4.1.2 Transport Fuels .................................................................................................. 13
4.1.3 Rental Cars ......................................................................................................... 13
4.1.4 Taxis ................................................................................................................... 14
4.2 Scope 2. Emissions .................................................................................................... 15
4.2.1 Purchased Electricity .......................................................................................... 15
4.3 Scope 3. Emissions .................................................................................................... 17
4.3.1 Transmission & Distribution Line Losses for Purchased Electricity ................... 17
4.3.2 Air Travel ............................................................................................................ 17
4.3.3 Waste to Landfill ................................................................................................ 18
5 REMOVALS ........................................................................................................................ 19
5.1 Background................................................................................................................ 19
5.2 Emissions Trading Scheme ........................................................................................ 19
5.3 Forestry Removals ..................................................................................................... 19
5.4 Double Counting & Offsetting ................................................................................... 20
Recommendations: ............................................................................................................... 20
6 NET EMISSIONS ................................................................................................................. 20
7 SUMMARY OF RECOMMENDATIONS ............................................................................... 21
28 METHODOLOGY ................................................................................................................ 22
8.1 Scope 1. ..................................................................................................................... 22
8.1.1 Stationary Combustion of Fuels ......................................................................... 22
8.1.2 Transport Fuels .................................................................................................. 23
8.1.3 Rental Cars ......................................................................................................... 24
8.1.4 Taxis ................................................................................................................... 25
8.2 Scope 2 ...................................................................................................................... 26
8.2.1 Purchased Electricity .......................................................................................... 26
8.3 Scope 3 ...................................................................................................................... 27
8.3.1 Transmission and Distribution Line Losses for Purchased Electricity ................ 27
8.3.2 Air Travel ............................................................................................................ 27
8.3.3 Waste to Landfill ................................................................................................ 29
8.4 Forestry Removals ..................................................................................................... 30
9 REFERENCES ...................................................................................................................... 31
3List of Figures
Figure 2.1 Total Emissions by Scope ..................................................................................................... 10
Figure 2.2 Total Emissions by Activity ................................................................................................... 10
Figure 4.1 Purchased Electricity (kWh) ................................................................................................. 15
Figure 4.2 Composition of Waste.......................................................................................................... 18
List of Tables
Table 2-1 Total Emissions........................................................................................................................ 9
Table 3-1 Methodology and Data Sources ............................................................................................ 11
Table 4-1 Stationary Combustion of Fuels Emissions ........................................................................... 12
Table 4-2 Transport Fuels Emissions ..................................................................................................... 13
Table 4-3 Rental Cars Emissions............................................................................................................ 14
Table 4-4 Taxis Emissions ...................................................................................................................... 14
Table 4-5 Purchased Electricity Emissions ............................................................................................ 16
Table 4-6 Purchased Electricity Emissions per Staff ............................................................................. 16
Table 4-7 Electricity Transmission and Distribution Losses Emissions ................................................. 17
Table 4-8 Air Travel Emissions .............................................................................................................. 17
Table 4-9 Waste to Landfill Emissions .................................................................................................. 18
Table 5-1 Forestry Removals................................................................................................................. 19
Table 6-1 Net Emissions ........................................................................................................................ 20
Table 7-1 Summary of Recommendations............................................................................................ 21
Table 8-1 Stationary Combustion of Fuel Calculations ......................................................................... 22
Table 8-2 Transport Fuels Emissions Factors ........................................................................................ 23
Table 8-3 Transport Fuels Calculations ................................................................................................. 23
Table 8-4 Litres of Fuel Purchased ........................................................................................................ 24
Table 8-5 Transport Fuel Calculations................................................................................................... 24
Table 8-6 Rental Car Calculations ......................................................................................................... 25
Table 8-7 Taxi Trips ............................................................................................................................... 25
Table 8-8 Taxi Calculations.................................................................................................................... 26
Table 8-9 Actual Energy Use ................................................................................................................. 26
Table 8-10 Purchased Electricity Calculations ...................................................................................... 26
Table 8-11 Air Travel Emissions Factors................................................................................................ 27
Table 8-12 Domestic Flight Trips........................................................................................................... 28
Table 8-13 Air Travel Calculations......................................................................................................... 28
Table 8-14 Waste and Recycling Volumes ............................................................................................ 29
Table 8-15 Waste to Landfill Calculations ............................................................................................. 30
Disclaimer
This report has been prepared by Madworld Ltd. Every effort has been made to ensure the reporting
methodology is consistent with the requirements of ISO 14064-1:2006, however Madworld Ltd does
not accept any responsibility whether in contract, tort, equity or otherwise for any action taken, or
reliance placed on it, or for any error or omission from this report.
41 INTRODUCTION
1.1 Organisation Description
Environment Canterbury is the Regional Council for Canterbury, the largest region in the
South Island, New Zealand. Environment Canterbury’s jurisdiction covers of all the river
catchments on the east coast of the South Island from the Clarence River, north of Kaikoura,
to the Waitaki River, in South Canterbury. This encompasses an area of just under 45,000
kilometres squared and a population of 612,000 people.
The Regional Council’s vision is to facilitate sustainable development in the Canterbury region
and has strategic responsibility across air, land and water. Environment Canterbury
undertakes a wide range of responsibilities, which include regional policy and planning, land
use consents, coastal permits, water permits, discharge permits, biosecurity, river
engineering, transportation, and environmental monitoring.
Environment Canterbury employs approximately 650 staff. The main office is in Tuam Street,
Christchurch, where the majority of the Council’s staff are located. There is another key office
in Timaru. Both offices are owned by Environment Canterbury.
1.2 Statement of Intent
New Zealand is a signatory to the Paris Agreement, adopted under the United Nations
Framework Convention on Climate Change. The Agreement commits countries to take action
on climate change, with the aim of limiting global average temperature increases, by reducing
emissions. Achieving a low carbon economy will require action at all levels across society.
Environment Canterbury has a role in supporting the region and communities to better
understand and proactively respond to climate change risks and opportunities. As an
organisation with its own carbon footprint, Environment Canterbury seeks to reduce the
greenhouse gas emissions from its day-to-day operations.
A greenhouse gas (GHG) inventory is a comprehensive analysis of all GHG emissions and
removals from an organisation over a specified period of time. This report is the first annual
GHG emissions inventory report undertaken by Environment Canterbury. The Council has no
reporting obligation and this inventory has been undertaking on a voluntary basis, primarily
for an internal audience, with the following key aims:
Provide a base year for data, which will allow Environment Canterbury to understand their
emission profile and subsequently track and compare GHG emissions or removals over
subsequent years.
Provide a starting point for action, which enables Environment Canterbury to make
informed decisions when managing GHG emissions.
Recommend measures to reduce emissions, thereby providing a means to encourage staff
to contribute towards reducing emissions during their day-to-day work practices, through
informed choices.
51.3 Approach and Scope
This report follows guidance given by the New Zealand Government, Guidance for Voluntary
Greenhouse Gas Reporting (MfE 2016). These include adopting the methodology outlined by
The GHG Protocol (World Business Council & World Resources Institute 2001) and ISO 14064-
1: 2006 standard (International Standards Organisation 2006).
A GHG is a gaseous constituent of the atmosphere, both natural and anthropogenic. There
are six GHGs [carbon dioxide (CO2), methane (CH4), nitrous oxide (N2O), hydrofluorocarbons
(HFCs), perfluorocarbons (PFCs) and sulphur hexafluoride (SF6)] covered by ISO 14064-1: 2006
and the GHG Protocol. Each gas absorbs and emits radiation at different wavelengths, within
a specific atmospheric residence time. These differences result in different global warming
potentials (GWPs). In order to make comparisons, GHG emissions are typically measured as
tonnes of carbon dioxide equivalent (CO2-e) [note: in order to help the reader comprehend
smaller units, this report uses kilograms as well as tonnes of CO2-e]. The quantification
methodology in this report uses calculations based on GHG activity data multiplied by GHG
emissions or removal factors.
Activity data relates to a measure of activity that results in a GHG emission or removal (e.g.
litres of diesel fuel from vehicle travel). Emissions factors are calculated from activity data to
estimate GHG emissions. These emission factors have been calculated using GWPs sourced
from the IPCC’s Fourth Assessment Report (2007). Wherever possible the calculations in this
report use actual activity data, which has been accurately recorded throughout the reporting
period. However, there are data limitations and gaps with regards to some of Environment
Canterbury’s activity data. In these situations estimates have been made, by extrapolating
available data across the entire year.
The GHG Protocol categorises emission sources into three activities, which are all covered by
this report:
Scope 1 Direct GHG emissions: defined as ‘emissions from sources that are owned or
controlled by the organisation’. This scope includes stationary combustion (e.g.
heating and generators), transport fuels, rental cars and taxis.
Scope 2 Indirect GHG emissions: defined as ‘emissions from the consumption of
electricity, steam, or other sources of energy generated upstream from the
organisation’. This scope includes purchased electricity.
Scope 3 Other indirect GHG emissions: defined as ‘emissions that are a consequence
of the operations of an organisation, but are not directly owned or controlled by the
organisation’. This scope includes transmission and distribution losses from purchased
electricity, air travel and waste.
The calculations in this report are for gross and net GHG emissions, thereby including GHG
removals. Environment Canterbury manages 2,700 hectares or forestry, which provides a
carbon sink by taking up carbon dioxide from the atmosphere. Due to availability of data, only
forestry associated with the Emissions Trading Scheme is included in this report.
61.4 Report Layout
This report is in two sections:
• Section 1: Outlines the GHG emissions and removals, with explanatory details on
the activity data and emissions factors.
• Section 2: Provides more technical details on the methodology of how the activity
data has been calculated (using either actual data, or estimates from samples),
and specific figures relating to calculations.
1.5 Organisational Boundaries
Organisational boundaries have been determined as required by the methodology in the ISO
14064-1: 2006 standard, which allows for two approaches:
Control: the organisation accounts for all quantified GHG emissions and/or removals
from facilities over which it has financial or operational control; or
Equity share: the organisation accounts for its portion of GHG emissions and/or
removals from respective facilities.
This report takes an operational control consolidation approach to account for emissions,
which is recommended as best practice. This approach allows Environment Canterbury to
focus on the emissions sources over which the organisation has control and can consequently
implement management decisions.
Environment Canterbury does have responsibilities for other areas, including planning and
tendering out the bus and ferry services, marketing and providing information such as
timetables, telephone services and websites. The city and district councils are responsible for
the transport infrastructure, including bus exchanges, stops and shelters. Red Bus Ltd, Go Bus
Ltd, Ritchies Transport Holdings Limited and Black Cat Ltd are responsible for supplying the
vehicles and drivers for the bus and ferry routes that they have been awarded through tender
processes for the Greater Christchurch and Timaru passenger transport network. As
Environment Canterbury makes no operational decisions about the day-to-day running of
these services, and has no direct control over the infrastructure and vehicles, the emissions
for the transport network has been excluded.
71.6 Operational Boundaries & Exclusions
This report focuses on Environment Canterbury’s two main offices:
Tuam Street Office: The Christchurch office has been in full operation since April 2016,
and is designed to accommodate over 450 staff. The building has five floors across two
wings, encompassing a total area of 9,600 square metres, of which 7,000 square
metres are dedicated to office space. The building has a best practice 4 Green Star
rating, which assesses energy, water, materials, indoor environmental quality,
transport, land use and ecology, management, emissions and innovation when rating
a building’s overall environmental impact.
Timaru Office: The Timaru office is located in Church Street and accommodates 100
staff. In 2014 the renovations on this office were completed.
Outside of the two main offices a number of staff members are located at regional facilities.
The Regional Council has a varying degree of control over the 15 sites that these staff occupy,
with facilities either owned or leased by Environment Canterbury. These facilities are all
relatively minor, housing between two and ten staff members. Some staff members are also
co-located with other organisations (e.g. Kaikoura District Council).
This report excludes all direct and indirect emission associated outside of the Tuam Street
and Timaru Offices. The ISO 14064-1: 2006 standard allows exclusions of direct or indirect
emissions, which are not material or whose quantification would not be technically feasible
or cost effective. This report also excludes emissions from refrigerants which are a scope 3
emission. HFCs are associated with unintentional leaks and spills from refrigeration units, air
conditioners and heat pumps. However, these emissions are estimated to be de minimus,
being well below the 5% threshold of the entire inventory.
1.7 Reporting Period: Calendar Year 2017
This report covers the period from 1 January 2017 to 31 December 2017, which will be
established as a base year for comparative purposes within future reports. It is recommended
that Environment Canterbury undertakes a GHG emissions inventory annually.
Organisations can choose to report on a calendar or financial year basis. In this instance the
2017 calendar year has been chosen as the base year, due to the availability of data during
this period. During recent years Environment Canterbury has changed providers across many
of the key activity areas, with data being more limited and harder to access prior to the start
of 2017. Furthermore, Environment Canterbury moved into the Tuam street office in mid-
2016. Therefore, it was determined that it would be reasonable to allow for a ‘settling-in’
period of six months, while staff, systems and operations became accustomed to the new
building.
82 TOTAL EMISSIONS
This total gross carbon dioxide equivalents for Environment Canterbury’s Tuam Street and Timaru Offices are 914 tonnes. This equates to 2
tonnes per staff member (based on 450 staff in the two offices). The most significant emissions are associated with transportation and travel,
which are 79% of all emissions:
Kilograms Tonnes
Scope Activity Activity Data Units Total CO2-e CO2-e CH4 N2O Total CO2-e CO2-e CH4 N2O
Scope 1 Stationary Combustion 14,080 Litres: Diesel 37,875 37,593 128 92 37.9 37.6 0.1 0.1
Scope 1 Transport Fuels 248,691 Litres: Fuel 639,921 619,724 3,626 15,352 639.9 619.7 3.6 15.4
Scope 1 Rental Vehicles 20,135 Kilometres 4,208 4,027 42 137 4.2 4.0 0.0 0.1
Scope 1 Taxis 20,174 Kilometres 4,025 3,853 41 131 4 3.9 0.0 0.1
Scope 2 Purchased Electricity 1,023,016 kWh 121,739 121.7 0.0 0.0 0.0
Scope 3 Transmission & Distribution Losses 1,023,016 kWh 9,923 9.9 0.0 0.0 0.0
Scope 3 Air Travel 570,036 Kilometres 77,843 77.8 0.0 0.0 0.0
Scope 3 Waste 24,787 Kilograms 17,995 18.0 0.0 0.0 0.0
Environment Canterbury Total 913,529 665,197 3,838 15,713 914 665 3.8 16
Table 2-1 Total Emissions
9Scope 1 emissions account for the largest proportion of emissions:
Scope 1: Direct GHG emissions,
including stationary combustion,
transport fuels, rental cars and
taxis.
Scope 2: Indirect GHG emissions,
including purchased electricity.
Scope 3: Other indirect GHG
emissions, including
transmission and distribution
losses from purchased electricity,
air travel and waste.
Scope 1 Scope 2 Scope 3
Figure 2.1 Total Emissions by Scope
By activity transport fuels accounting for 70% of total emissions, purchased electricity 13%,
and air travel 9%:
Figure 2.2 Total Emissions by Activity
103 EMISSION SOURCE METHODOLOGY
This following table provides a summary of the methodology and data sources. For full details see Section 2.
Scope Category Emissions Source Data Source Methodology/ Uncertainties
1 Stationary combustion ~250 kVA diesel generator at Diesel generator fuel Estimate based on good records of dollars spent on diesel, and
of fuels Tuam Street. (dollars). utilising average cost of a litre of fuel.
1 Transport Fuels Fleet of 100 vehicles, using Fuel summary 2017 Actual emissions based on vehicles associated with the Tuam
regular/ premium petrol & (litres per vehicle). Street and Timaru Offices. Significant emissions from the
diesel. remaining fleet vehicles have not been included in overall
inventory, as focus is on two main offices (Tuam Street &
Timaru).
1 Rental Cars Default rental vehicles (1600 -< Orbit World Travel Estimate based on four month sample, using available
2000 cc category). data for Environment kilometre travelled records and number of car rental days.
Canterbury. High uncertainty due to incompleteness of available records.
1 Taxis Default taxi (average of the Orbit World Travel Estimate based on four month sample, using airport data and
1350 - < 1600 & 1600 -4 GREENHOUSE GAS EMISSIONS
The following sections provide results for each GHG emission across each scope, along with
initial recommendations that Environment Canterbury may consider to reduce emissions
further. Environment Canterbury has no formal strategy for achieving a lower footprint,
however considers it as an important factor as part of the decision making process. Overall
recommendations are to:
Develop a climate action management plan, including targets, for managing and reducing
emissions.
Establish training opportunities (including staff inductions) and communications to ensure
that all staff are aware of their impact on the organisation’s emissions; make data
available to staff to understand Environment Canterbury’s emissions inventory and their
own contribution to it.
Address gaps in record keeping to prevent data limitations in future emission inventories.
Undertake an annual emissions inventory and consider applying for programme
certification.
4.1 Scope 1. Emissions
4.1.1 Stationary Combustion of Fuels
Stationary combustion emissions result from sources such as heaters, generators, and boiler,
which generate heat, energy and hot water.
The only significant form of stationary combustion utilised in the two offices is a ~250 kVA
generator at Tuam Street, which is used to reduce electricity network demand during peak
periods. Diesel is the fuel used to run this generator, however consumption is relatively minor.
Diesel Commercial Emissions Factors (kg)
Litres Total CO2-e CO2-e CH4 N 2O
Total Activity 37,875
Data 14,080 [37.9 tonnes] 37,593 128 92
Table 4-1 Stationary Combustion of Fuels Emissions
Note that the reason that the emission weight is higher than the starting weight of the diesel
fuel, is that through the combustion process oxygen is added to create carbon dioxide.
124.1.2 Transport Fuels
Environment Canterbury has an extensive fleet of vehicles, with 100 of the total 158 vehicles
associated with the Tuam Street and Timaru Offices. These vehicles generate emissions through
the consumption of fuel.
The Council encourages the use of alternative, low carbon transport options to staff, such as
cycling and public transport. Electric bikes have recently been added as another way for staff to
get to meetings in other parts of the city, with electric scooters also under consideration.
Environment Canterbury does not currently have electric cars in its fleet due to the high capital
cost of the vehicles and infrastructure, however is a foundation member of the Yoogo electric car
sharing scheme in Christchurch (http://www.yoogo.co.nz/).
Environment Canterbury have been repositioning the fleet within the allocated capital budget,
with the 4WD vehicles taking priority. Environment Canterbury is aiming to have 50% of the
passenger vehicles to be electric by 2020. However, in a region the size of Canterbury and
the terrain that staff work in, vehicles are necessary for the Council to undertake its work.
Face to face meetings will continue to be an important way to effectively reach organisational
goals
GHG emissions from vehicles depend on the amount of fuel that is consumed. When fuel is
burnt in a vehicle the reaction results in the release of carbon dioxide, along with other
compounds that include nitrous oxides and sulphide. Different fuels have different GWPs
(Global Warming Potentials), with Environment Canterbury’s vehicles using a range of fuels
that include regular petrol (48% of emissions), premium petrol (2%), and diesel (50%):
Regular Premium
Petrol Petrol Diesel Emissions Factors (kg)
Litres Total CO2-e CO2-e CH4 N2O
Timaru Office 36,118 735 53,987 236,760 230,014 1,099 5,212
Tuam Street 89,017 4,369 64,464 403,161 389,709 2,527 10,141
Total Activity 639,921
Data 125,135 5,105 118,452 [640 tonnes] 619,724 3,626 15,352
Table 4-2 Transport Fuels Emissions
Recommendations:
Expand future GHG emissions inventories to include Environment Canterbury’s entire
fleet.
Consider opportunity to offset carbon emissions when travel costs are passed onto
third parties, such in resource consent applications, with fees used in carbon offset
schemes.
Encourage staff to use alternative transport options for appropriate trips rather than
being a single occupant in a fleet vehicle.
Use video conferencing as an alternative to face-to-face meetings whenever possible.
Transition to small engine vehicles, electric cars and hybrids.
4.1.3 Rental Cars
13Rental cars are primarily used by staff when working outside of the region. Based on available
data Environment Canterbury incurred an estimated 186 days of rental car charges in 2017,
with an average of 108 kilometres travelled per day.
Rental Car
(mid-size) Emissions Factors (kg)
Kilometres Total CO2-e CO2-e CH4 N2O
Total Activity 4,208
Data 20,135 [4.2 tonnes] 4,026 42.5 137
Table 4-3 Rental Cars Emissions
Recommendation:
Improve travel booking record keeping for rental car use, to capture usage ideally
including litres of fuel consumed, so that accurate calculations of GHG emissions can
be undertaken.
4.1.4 Taxis
Taxis are used by staff for a range of reasons, including to and from domestic airports. Staff
are also encouraged to use buses whenever possible. Data is extremely limited on actual
usage, so this report makes an estimated based on assumed taxi journeys to and from
airports.
Taxis Emissions Factors (kg)
Kilometres Total CO2-e CO2-e CH4 N2O
Total Activity 4,025
Data 20,174 [4 tonnes] 3,853 41 131
Table 4-4 Taxis Emissions
Recommendations:
Improve travel booking record keeping for taxi use, so that accurate figures for kilometres
travelled can be captured.
Ensure that staff members share taxis whenever possible, or utilise buses.
144.2 Scope 2. Emissions
4.2.1 Purchased Electricity
These are indirect emissions from energy, consumed in owned or controlled equipment by
Environment Canterbury, but generated by another company. Meridian Energy supplies
electricity to Environment Canterbury, via the electricity distribution company Orion.
In the commissioning review of Environment Canterbury’s new Tuam Street office it was
estimated that the office would use approximately 1,105,500 kWh/year of electricity, with an
energy intensity for the building of 158 kWh per square metre a year (Enercon 2017).
However, for the 2017 calendar year actual electricity consumption for Tuam Street was
921,976 kWh, with an energy intensity of 132 kWh per square metre. This lower than
predicted annual consumption may be the result of improved energy management.
Electricity consumption at the Timaru Office was 101,040 kWh for 2017.
Environment Canterbury Purchased Electricity (kWh)
120,000
100,000
80,000
60,000
40,000
20,000
0
Jan. 17 Feb. 17 Mar-17 Apr-17 May-17 Jun-17 Jul-17 Aug. 17 Sept. 17 Oct. 17 Nov. 17 Dec. 17
Tuam Street Timaru Office
Figure 4.1 Purchased Electricity (kWh)
15As with fuels for stationary combustion emission factors, this emission factor does not
incorporate emissions associated with the extraction, production and transport of the fuels
used in the production of electricity.
Purchased Electricity Unit Total CO2-e
Emissions Factor kWh 0.119
109,715
Tuam Street Activity Data 921,976 [110 tonnes]
12,024
Timaru Office Activity Data 101,040 [12 tonnes]
Total Environment 121,739
Canterbury Activity Data 1,023,016 [122 tonnes]
Table 4-5 Purchased Electricity Emissions
The following table details the amounts of electricity consumed and emissions produced from
purchased electricity per staff member. These figures are based on 450 staff members at
Tuam Street and 100 staff members at the Timaru Office:
Per Staff Member kWh Total CO2-e (kg)
Tuam Street 2,049 244
Timaru Office 1,010 120
Both Offices 1,860 221
Table 4-6 Purchased Electricity Emissions per Staff
Recommendations:
Continue to implement the range of energy management opportunities
recommended by Enercon (2017), including implementing controlled lighting, and
placing computers in sleep mode.
Undertake further energy audits every five years.
Develop internal awareness raising initiatives to make staff more energy aware,
including training, communication and general encouragement.
164.3 Scope 3. Emissions
These indirect emissions are a consequence of the activities of Environment Canterbury, but
are not owned or controlled by the organisation.
4.3.1 Transmission & Distribution Line Losses for Purchased Electricity
This factor accounts for emissions from generation, required to compensate for electricity
lost in the transmission and distribution network, resulting from inefficiencies in the grid.
Electricity Transmission & Distribution Losses kWh Total CO2-e (Kg)
Tuam Street Activity Data 921,976 8,943 [9 tonnes]
Timaru Office Activity Data 101,040 980 [1 tonne]
Total Activity Data 1,023,016 9,923 [10 tonnes]
Table 4-7 Electricity Transmission and Distribution Losses Emissions
4.3.2 Air Travel
Air travel emissions are based on the total distance travelled and on the area of the plane that
each passenger takes up. If a plane is comprised totally of business-class seats, as opposed to
more densely-packed economy class seats, this means that fewer passengers can fly.
Therefore, business class travel incurs higher emissions. However, all flights undertaken by
Environment Canterbury were in economy class. The emission factors in this report refer to
direct carbon dioxide (CO2), methane (CH4), and nitrous oxide (N2O) emissions only. The
science around other impacts, such as water vapour and NOx is currently uncertain and these
other aviation gases and effects have not been taken into account. However, the calculations
in this report do take into account non-direct routes taken by plans and delays/ circling.
International: Environment Canterbury undertakes a limited number of international flights,
at just under 20 per year, of which all in 2017 were short haul (less than 3,700 kilometres) to
and from Australia.
Domestic: Staff from Christchurch and Timaru made just under 1,000 domestic flights in the
report year, travelling to a total of 14 different domestic destinations. Christchurch Airport in
understandably the most popular destination (with 44% of domestic flights), followed by
Wellington (25%), Auckland (10%), and Hamilton (11%).
Flights Emissions Factors
Class Kilometres Total CO2-e (kg)
International 47,997 4,021 [4 tonnes]
Domestic 522,039 73,822 [74 tonnes]
Total Activity Data 570,036 77,843 [78 tonnes]
Table 4-8 Air Travel Emissions
Recommendations:
Use video conferencing as an alternative to face-to-face meetings whenever possible.
Evaluate and where possible reduce the number of staff that need to travel to
meetings in other parts of the country.
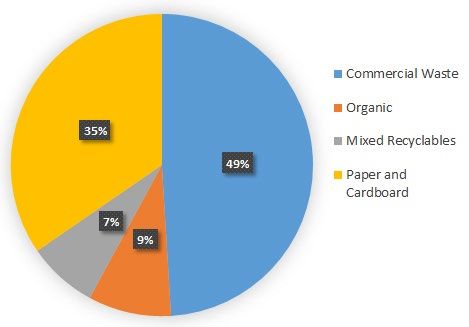
174.3.3 Waste to Landfill
The biological decomposition of waste, particularly organic matter, in landfills results in the
production of landfill gases. The main gases produced are carbon dioxide (CO2) and methane
(CH4). Methane is of particular concern, being a potent greenhouse gas that has a global
warming potential that is over 21 times that of carbon dioxide (IPCC 2007). Methane can be
destroyed through combustion, with some landfills recovering, flaring or combusting
methane for energy. Consequently, there is an adjustment for the emissions factors for
organisations that send their waste to landfills with landfill gas collection systems.
Tuam Street Office has
excellent facilities and systems
of separating out waste, as well
as detailed records on volumes
of waste produced.
Organic waste, such as food
scraps, are collected for
composting. Mixed plastic and
metal materials are separated
for recycling, along with paper
and cardboard.
The remaining waste, which is
approximately half of all waste
Figure 4.2 Composition of Waste
produced, is sent to landfill.
However, the exact composition of this waste is not known. The receiving landfill, Kate Valley
at Amberley, has landfill gas collection and energy generation systems in place.
Timaru Office also separates waste for recycling and composting, however this office does
not keep detailed records on volumes of waste produced. Consequently, this report has
utilised Tuam Street data in order to give an estimate of potential volumes. The receiving
landfill, Redruth, has landfill gas collection and flaring systems in place.
Waste to landfill Tonnes Total CO2-e (kg)
Tuam Street Activity Data 20,280 14,723 [15 tonnes]
Timaru Office Activity Data 4,507 3,272 [3 tonnes]
Total Activity Data 24,787 17,995 [18 tonnes]
Table 4-9 Waste to Landfill Emissions
Recommendations:
Establish systems for recording waste at Timaru Office.
Undertake waste audits at both offices in order to develop a detailed understanding
of the types of waste produced, and therefore determine the exact greenhouse gas
emissions factor.
185 REMOVALS
5.1 Background
Environment Canterbury has extensive landholdings of 25,800 hectares, which includes:
• 11,000 hectares that are leased for a variety of purposes, predominantly agriculture.
• 11,800 hectares that is river bed and berm land, with variable crown cover.
• 3,000 hectares of pine forest, which is comprised of:
o 605 hectares of post 1989 forest.
o 2,395 hectares of pre 1990 forest.
Ecosystems, including forests, play an important role in the stocks and flows of the global
carbon cycle. Forests can act as carbon sinks when trees absorb carbon from the atmosphere
through photosynthesis. The carbon stock is measured by the amount of carbon stored in the
tree’s biomass - the roots, trunk, branches and leaves. This process is referred to as carbon
sequestration. Conversely, forests can act as emission sources, with carbon released into the
atmosphere through respiration, and in more significant volumes when trees burn or decay
after dying. Carbon stock values are expressed in units of tonnes of carbon dioxide equivalents
per hectare. They are equivalent to the weight of carbon dioxide that is removed from the
atmosphere and stored in the forest during growth. This is also the same weight of carbon
that would be released back to the atmosphere if the forest fully decayed.
5.2 Emissions Trading Scheme
Environment Canterbury participates in the Emissions Trading Scheme (ETS). The ETS puts a
price on GHG emissions and encourages landowners to establish and manage forests in a way
that increases carbon storage. Eligible post 1989 forest can voluntarily become part of the
scheme, earning New Zealand emissions units (NZUs), which must be surrendered if trees are
subsequently deforested or removed through burning. One NZU represents one tonne of
carbon dioxide. These units can be held or bought or sold within New Zealand.
This report only focuses on forest owned and managed by Environment Canterbury, which is reported
under the ETS. Data is not available for other forests. There is uncertainty over the amount
sequestered by these other forests, as carbon flows will depend on a range of attributes,
including species type and age. Leased land is out of Environment Canterbury’s day-to-day
control and has not been examined in this report.
5.3 Forestry Removals
The calculations in this report utilise Environment Canterbury’s Mandatory Emissions Returns
under the ETS for the current five year reporting period:
Forestry Removal Factors
Hectares Total CO2-e
Post 1989 forest 605 (7,883)
Table 5-1 Forestry Removals
195.4 Double Counting & Offsetting
Double counting occurs when emissions have been offset in the GHG emissions inventories
of two different organisations. This applies to forest registered under voluntary offsetting, as
well as national level schemes. Any carbon removals used for offsetting cannot be further
traded. The Council has a policy of retaining NZUs. Consequently, there has been no double-
counting by Environment Canterbury with regards to these removals.
If Environment Canterbury’s ETS policy changes in the future then the Council must be aware
of double counting prior to selling any NZUs. The amount of carbon removals through forestry
provides a significant balance to Environment Canterbury’s emissions. These forestry
removals currently offset the Council’s emissions by a factor of just under nine (914 tonnes
of emissions and 7,883 tonnes of removals). Although, it must be noted that these emissions
do not include the wider vehicle fleet.
Caution should be used by organisations when attempting to claim the offsetting of emissions
through forests that are also accounted for at the national level. Without due care, claiming
offsets through this route can lead to double counting. The purpose of this report has been
to establish a GHG inventory for Environment Canterbury’s emissions, and the sequestration
through the Council’s forests. Establishing the extent to which forests formally offset
Environment Canterbury’s emissions will require assessment and advice not within scope of
an inventory.
Recommendations:
Continue to positively manage forestry in order to provide a carbon sink and reduce
Environment Canterbury’s GHG footprint.
Determine Environment Canterbury’s future policy with NZUs and the balance
between offsetting requirements and potentially selling units.
6 NET EMISSIONS
Taking into account Environment Canterbury’s emissions outlined in the previous section and
the above forest removals results in net emissions of (6,969) tonnes:
Total CO2-e
Environment Canterbury 914
Gross Emissions
Environment Canterbury (7,883)
Removals
Net Emissions (6,969)
Table 6-1 Net Emissions
Environment Canterbury’s forest removals ensure that the Council is making a positive
contribution towards reducing its impact on climate change. However, in subsequent GHG
inventories it is recommended that wider implications are also taken into account, including
GHG emissions from the wider vehicle fleet and operations. This will allow the Council to have
a deeper understanding of the gross and net emissions.
207 SUMMARY OF RECOMMENDATIONS
Scope Recommendation
General Develop a climate action management plan, including targets, for managing and
reducing emissions.
Establish training opportunities (including staff inductions) and communications to
ensure that all staff are aware of their impact on the organisation’s emissions; make
data available to staff to understand Environment Canterbury’s emissions inventory and
their own contribution to it.
Address gaps in record keeping to prevent data limitations in future emission
inventories.
Undertake an annual emissions inventory and consider applying for programme
certification, which confirms that the inventory is a fair representation of the actual
situation.
Transport Expand future GHG emissions inventories to include Environment Canterbury’s entire
Fuels fleet.
Consider opportunity to offset carbon emissions when travel costs are passed onto third
parties, such in resource consent applications, with fees used in carbon offset schemes.
Encourage staff to use alternative transport options for appropriate trips rather than
being a single occupant in a fleet vehicle.
Use video conferencing as an alternative to face-to-face meetings whenever possible.
Transition to small engine vehicles, electric cars and hybrids.
Rental Improve travel booking record keeping for rental car use, to capture usage ideally
Cars including litres of fuel consumed, so that accurate calculations of GHG emissions can be
undertaken.
Taxis Improve travel booking record keeping for taxi use, so that accurate figures for
kilometres travelled can be captured.
Ensure that staff members share taxis whenever possible, or utilise buses.
Purchased Continue to implement the range of energy management opportunities recommended
Electricity by Enercon (2017), including implementing controlled lighting, and placing computers in
sleep mode.
Undertake further energy audits every five years.
Develop internal awareness raising initiatives to make staff more energy aware,
including training, communication and general encouragement.
Air Travel Use video conferencing as an alternative to face-to-face meetings whenever possible.
Evaluate and where possible reduce the number of staff that need to travel to meetings
in other parts of the country.
Waste to Establish systems for recording waste at Timaru Office.
Landfill Undertake waste audits at both offices in order to develop a detailed understanding of
the types of waste produced, and therefore determine the exact greenhouse gas
emissions factor.
Forestry Continue to positively manage forestry in order to provide a carbon sink and reduce
Environment Canterbury’s GHG footprint.
Determine Environment Canterbury’s future policy with NZUs and the balance
between offsetting requirements and potentially selling units.
Table 7-1 Summary of Recommendations
218 METHODOLOGY
GHG emissions sources were identified with reference to the methodology described in the
GHG Protocol and ISO14064-1: 2006 standards.
Identification of emissions sources was undertaken via communications with Environment
Canterbury staff, using established databases for Environment Canterbury’s activities. Where
available records exist, calculations used actual data for the entire 2017 calendar year. In
other cases, available records were utilised as a sample, with data then extrapolated across
the entire year in order to provide a best estimate. In these instances data was also checked
against available records for the 2018 year, so that any anomalies could be identified.
Emission Factors have been sourced using best available recommendations, predominantly
obtained from the Ministry for the Environment, in order to ensure that they are the most
applicable for a New Zealand context.
Note all emissions in this section are in kilograms, unless otherwise stated.
8.1 Scope 1.
8.1.1 Stationary Combustion of Fuels
There is no data on actual litres of diesel utilised by the generator at Tuam Street, with records
only showing expenditure. Consequently, this report has used total expenditure and average
annual prices of diesel to determine estimated litres of fuel:
Average 2017 price of commercial diesel fuel, excluding GST: $0.7908/ litre (MBIE
2018).
Environment Canterbury direct spend on diesel fuel of $3,464, plus credit note from
electricity supplier of $7,670, giving a total of $11,134.
$11,134 (total fuel cost) divided by $.07908 (average price/ litre) results in a total of
14,080 litres of diesel
Diesel Commercial Emissions Factors
Unit Total CO2-e CO2-e CH4 N2O
Emission Factors Litre 2.69 2.67 0.00912 0.00652
Environment
Canterbury Total 14,080 37,875 37,593 128 92
Table 8-1 Stationary Combustion of Fuel Calculations
228.1.2 Transport Fuels
Environment Canterbury has records for vehicle fleet use, with data for each vehicle. These
records include total litres of fuel, which provides the most accurate way to quantify vehicle
emissions. Driver behaviour and individual engine performance are not taken into account.
As this study has focussed on the two main offices, only vehicles associated with Tuam Street
and Timaru Office have been included in this GHG emissions inventory. This incorporates a
total of 100 vehicles. The CO2-e per activity unit emission factors are derived by the Ministry
of Business, Innovation and Employment using calorific values, and incorporate relevant
oxidation factors sourced from The IPCC Guidelines for National Greenhouse Gas Inventories
(2006).
Emissions Factors
Fuel Unit Total CO2-e CO2-e CH4 N2O
Regular petrol Litre 2.44 2.33 0.0246 0.0793
Premium petrol Litre 2.43 2.33 0.0247 0.0797
Diesel Litre 2.72 2.67 0.00356 0.0424
Table 8-2 Transport Fuels Emissions Factors
Regular Premium Total
Group Petrol Petrol Diesel CO2-e CO2-e CH4 N2O
Timaru 554 26 1,151 4,546 4,425 18 95
Timaru Biosecurity 15 0 15,898 43,280 42,483 57 675
Timaru Groundwater 0 0 5,186 14,105 13,846 18 220
Timaru Hydrology 360 0 20,113 55,586 54,541 80 881
Timaru Investigation & Incident R. 4,280 0 0 10,443 9,972 105 339
Timaru Managers 2,659 0 538 7,952 7,632 67 234
Timaru Pool Cars 23,883 710 8,191 82,279 79,171 634 2,298
Timaru Surface Water 4,356 0 0 10,627 10,148 107 345
Timaru River Engineering 0 0 318 864 848 1 13
Timaru Survey 11 0 2,592 7,078 6,948 10 111
Executive Management Group 4,902 3,663 3,704 30,936 29,845 224 838
Tuam St. Air Quality 0 0 1,732 4,710 4,624 6 73
Tuam St. Biosecurity 3,707 0 3,417 18,340 17,762 103 439
Tuam St. Investigation & Incident R. 7,709 66 5,028 32,646 31,540 209 830
Tuam St. Pool Cars 46,996 211 10,171 142,847 137,148 1,198 4,175
Tuam St. Property 8,354 22 23,570 84,548 82,448 290 1,664
Tuam St. River Engineering 0 0 4,023 10,943 10,742 14 171
Tuam St. RMO 1,534 287 0 4,440 4,243 45 145
Timaru Office Total 36,118 735 53,987 236,760 230,014 1,099 5,212
Tuam Street Total 89,017 4,369 64,464 403,161 389,709 2,527 10,141
Environment Canterbury Total 125,135 5,105 118,452 639,921 619,724 3,626 15,352
Table 8-3 Transport Fuels Calculations
23Emissions Profile for Entire Fleet (Including satellite offices): In total there are 238 vehicles
within the fleet, which include cars, heavy vehicles, tractors, a bulldozer, a jet boat, a jet ski
and two motor bikes. The majority of this fleet is determined to be outside the boundaries of
this inventory which is solely focused on Tuam Street and Timaru Offices. However, for
completeness, the following tables outline the emissions associated with the entire fleet, in
order to provide a comparison with the vehicles associated with the two main offices.
In summary, emissions from vehicles associated directly with the two main offices represent
33% of total fleet emissions.
The Council is in the process of changing suppliers, so calculations have involved analysis of
litres of fuel purchased from three different providers:
Regular 91 Premium 95 Diesel Total
LeasePlan 169,610 5,565 509,393 684,567
BP 16,729 628 16,212 33,569
McKeown 5,934 940 22,948 29,822
Total Fuel 192,273 7,133 548,553 747,959
Table 8-4 Litres of Fuel Purchased
The high volumes of regular petrol and in particularly of diesel, results in a large volume of
GHG emissions:
Fuel Litres Total CO2-e CO2-e CH4 N2O
Regular petrol 192,273 469,147 447,997 4,730 15,247
Premium petrol 7,133 17,332 16,619 176 568
Diesel 548,553 1,492,065 1,464,638 1,953 23,259
Environment
Canterbury Total 1,978,544 1,929,253 6,859 39,074
Table 8-5 Transport Fuel Calculations
8.1.3 Rental Cars
Records for rental car use were obtained from Orbital World Travel, Environment
Canterbury’s travel agent. In mid-2017 Environment Canterbury changed travel agents and
earlier records from the previous provider are not attainable. Consequently, data for rental
car usage is only available from September 2017. Records only include basic car-hire details,
including name of staff member, dates, and car type. Only a few records include actual
kilometres travelled. As such, the calculations in this report are based on extremely limited
data within a four month period, and there is consequently a high level of uncertainty:
Average daily travel based on only four days of recorded travel was 108.25 kilometres/
day.
Across a four month period Environment Canterbury incurred 62 days of rental car
charges. Rental car use is deemed to be fairly consistent throughout the year, so this
data has been extrapolated to give 186 days of rental car across an entire year.
186 days at 108.25 kilometres results in an estimate of 20,135 kilometres travelled in
rental vehicles for 2017.
24The most accurate way to calculate emissions is based on fuel consumption data. However, this data is not available so calculations have been based on kilometres travelled. The default emission factor for rental cars is the same as that for vehicles in the 1600 -
The default emission factor for taxis is the average of the 1350 - < 1600 and the 1600 -
8.3 Scope 3
8.3.1 Transmission and Distribution Line Losses for Purchased Electricity
The emissions factor is an average figure that makes no allowance for location of the end-
user within the national grid, or for emissions associated with the extraction, production and
transport of the fuels burnt to produce the electricity. The calculation in this report was based
on a total of 1,023,016 kWh and an emissions factor of 0.0097, resulting in 9,923 Total CO2-e.

8.3.2 Air Travel
Records for air travel were obtained from Orbital World Travel, Environment Canterbury’s
travel agent. In mid-2017 Environment Canterbury changed travel agents and earlier records
from the previous provider are not easily attainable. Consequently, records are only available
from September to December 2017, requiring data extrapolation across the whole year in
order to determine an estimate of total travel.
The emission factors utilised in this report follow those published by the UK Department for
Business, Energy & Industrial Strategy, which are deemed by the Ministry for the Environment
to be the most suitable emission factors currently available (MfE 2016).
The calculations in this report incorporate a circle distance uplift factor to take into account
non-direct routes between airports and delays/ circling. The UK Department for Business,
Energy & Industrial Strategy applies an eight percent uplift factor, based on analysis of UK
flights. There is no comparable New Zealand analysed figure, therefore this report takes a
conservative approach and utilises a nine percent uplift factor. This figure is based on the
Intergovernmental Panel on Climate Change (IPCC) publication Aviation and the Global
Atmosphere (Penner 1999).
International Flights: A total of six international flights were made between September and
December 2017, with all travel being between New Zealand and Australia. This included a
total of four flights between Christchurch and Melbourne, and two flights between
Christchurch and Brisbane, incurring a total of 14,678 actual kilometres. This data has been
extrapolated across the entire 2017 year, resulting in an estimated 44,034 kilometres of
international air travel. Multiplying this figure by 1.09 to incorporate the uplift factor, results
in a total distance of 47,997 kilometres.
The following calculations utilise the 2017 UK Government Conversion Factors for Company
Reporting:
                   International Flights                   Emissions Factors
                   Class                                   Unit           Total CO2-e
                   International short haul                Kilometres           0.08378
                   Environment Canterbury
                   Activity Data                                 44,034          3,689
                   Additional Uplift Factor                      47,997          4,021
                 Table 8-11 Air Travel Emissions Factors

                                                                                                27
Domestic Flights: A total of 331 domestic flights were made between September and
December 2017, within New Zealand, which gives an estimated annual figure of 993 flights.
This includes two domestic flights made in Australia during the four month sample period (for
the purposes of this report these flights have been classed as domestic). The following table
outlines the number of domestic trips to each city airport within New Zealand, during the four
month sample period:
Percentage of
To City Trips Trips
Auckland 33 10%
Chatham Islands 6 2%
Christchurch 148 45%
Dunedin 7 2%
Hamilton 22 7%
Invercargill 1 0%
Marlborough 1 0%
Napier 11 3%
Nelson 4 1%
New Plymouth 5 2%
Palmerston North 1 0%
Queenstown 1 0%
Rotorua 1 0%
Tauranga 2 1%
Timaru 5 2%
Wellington 81 25%
Total 329
Table 8-12 Domestic Flight Trips
During this four month period a total of 159,645 actual kilometres of domestic air travel were
incurred. This data has been extrapolated across the entire 2017 year, resulting in an
estimated 478,935 kilometres of domestic air travel. Multiplying this figure by 1.09 to
incorporate the uplift factor, results in a total distance of 522,039 kilometres.
The following calculations utilise the 2017 UK Government Conversion Factors for Company
Reporting:
Domestic Flights Emissions Factors
Class Unit Total CO2-e
Domestic Kilometres 0.14141
Environment Canterbury
Activity Data 478,935 67,726
Additional Uplift Factor 522,039 73,822
Table 8-13 Air Travel Calculations
28You can also read