Stock Market Valuation Using Internet Search Volumes: US-China Comparison - ScholarlyCommons
←
→
Page content transcription
If your browser does not render page correctly, please read the page content below
University of Pennsylvania
                                                                                        ScholarlyCommons
Summer Program for Undergraduate Research
                                                                                                              Wharton School
(SPUR)

2016

Stock Market Valuation Using Internet Search
Volumes: US-China Comparison
Wan Jiang
University of Pennsylvania

Follow this and additional works at: http://repository.upenn.edu/spur
    Part of the Portfolio and Security Analysis Commons

Recommended Citation
Jiang, W. (2016). "Stock Market Valuation Using Internet Search Volumes: US-China Comparison," Summer Program for
Undergraduate Research (SPUR). Available at http://repository.upenn.edu/spur/10

This paper is posted at ScholarlyCommons. http://repository.upenn.edu/spur/10
For more information, please contact repository@pobox.upenn.edu.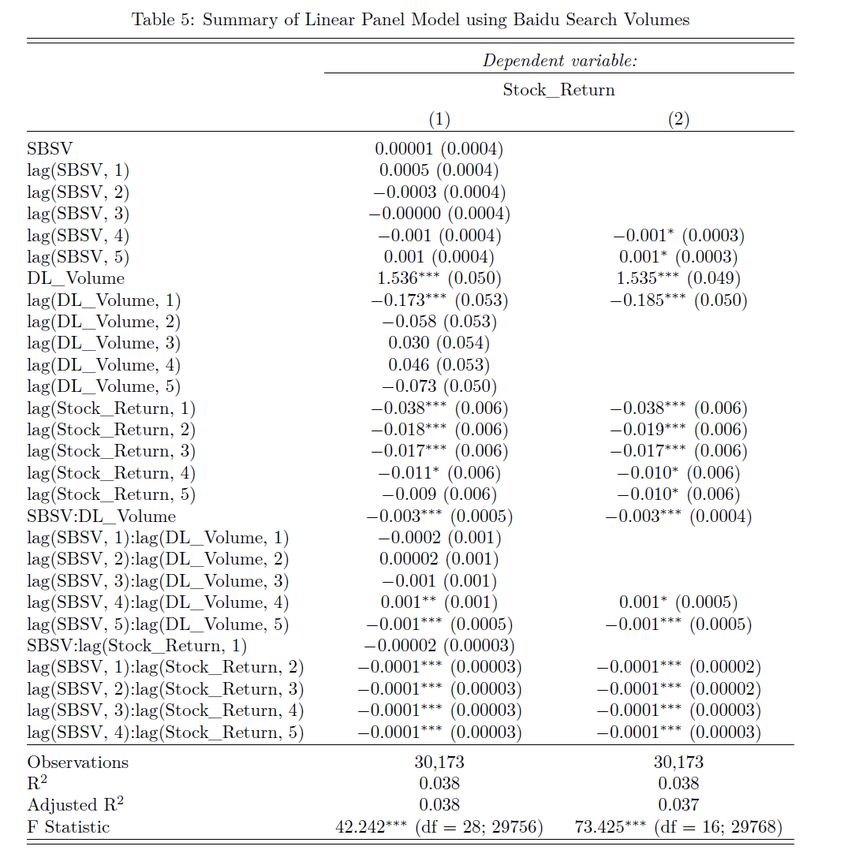
Stock Market Valuation Using Internet Search Volumes: US-China
Comparison
Abstract
Search engine query data, which provide information on individuals’ attention allocation, have been proven
by scholars to be useful in interpreting financial market performance. This paper explores the use of search
volumes in stock market valuation and seeks to identify underlying stock market differences between the U.S.
and China by extracting search volume data from their respective dominant search engines – Google and
Baidu. On the overall market level, this paper investigates how search terms about financial markets relate to
weekly returns of important market indices in each country; on the individual stock level, search volumes of
selected company names in each country’s stock market are used to study fluctuations in stock prices. Finally,
a set of trading strategies are recommended after combining research results in this paper with search-based
strategies proposed in previous studies.

Keywords
search volumes, investor attention, stock market returns, U.S.-China comparison, search-based trading
strategies

Disciplines
Portfolio and Security Analysis

                                  This working paper is available at ScholarlyCommons: http://repository.upenn.edu/spur/10
STOCK MARKET VALUATION USING INTERNET SEARCH VOLUMES:
U.S.-CHINA COMPARISON
Wan Jiang
Candidate for Bachelor of Science in Economics | Class of 2019
The Wharton School, University of Pennsylvania
E-mail: wanjiang@wharton.upenn.edu
Faculty Advisor: Lynn Wu
Assistant Professor of Operations, Information and Decisions
The Wharton School, University of Pennsylvania
E-mail: wulynn@wharton.upenn.edu
Research discipline: Business – Portfolio and Security Analysis
Acknowledgements: The author would like to acknowledge additional help and suggestions
from Xiao Qian, Elliot Oblander, and Prof. Catherine Schrand
1ABSTRACT
Search engine query data, which provide information on individuals’ attention allocation, have
been proven by scholars to be useful in interpreting financial market performance. This paper
explores the use of search volumes in stock market valuation and seeks to identify underlying
stock market differences between the U.S. and China by extracting search volume data from
their respective dominant search engines – Google and Baidu. On the overall market level, this
paper investigates how search terms about financial markets relate to weekly returns of
important market indices in each country; on the individual stock level, search volumes of
selected company names in each country’s stock market are used to study fluctuations in stock
prices. Finally, a set of trading strategies are recommended after combining research results in
this paper with search-based strategies proposed in previous studies.
Keywords: search volumes, investor attention, stock market returns, U.S.-China comparison,
search-based trading strategies
2INTRODUCTION
The advent of the "big data" age has allowed scientists to explain various phenomena and
predict the future using huge volumes of easily accessible data. However, the financial market
has always been characterized with a high degree of volatility, which presents significant
challenges for scientists to accurately model the market behavior. Empirical inquiries in stock
market volatility have centered on using the theory of power-law distributions to explain large
fluctuations in stock prices, trading volumes, and frequency of trades (Gabaix et al. 2003;
Plerou et al. 2004). It was not until the 2010s that scholars proposed a new perspective in
evaluating financial market performance - using Internet search query data to generate more
useful and accurate results. The demonstration that query data from search engines such as
Google and Baidu are correlated with financial market performance has shed new light on the
studies of behavioral finance and financial modeling.
Google Trends vs. Baidu Index
Thanks to the convenience and popularity of search engines in today's Internet era, scientists
have been able to inspect individuals' interest in specific queries and topics through examining
search volume data. Not long before research on their financial applications emerged, search
volumes had been used to analyze disease trends (Ginsberg et al. 2008) and economic
conditions such as unemployment rates (Askitas and Zimmermann 2009). Preis, Reith, and
Stanley (2010) conducted a pioneering investigation in the link between search volumes and
trading volumes of listed companies. Most of these inquiries have shown that search volume
movements offer insight on current statuses and future trends of various aspects in human life.
3Most research on search engine query data has been devoted to the analysis of Google Trends,
which is a Google service providing search volumes of terms that Internet users enter into
Google. According to comScore, Google is by far the most popular web search engine around
the globe. It leads the search engine market in the United States, with a market share of 63.8%
in January 2016. Nevertheless, in some areas of the world, Google tends to have negligible
usage due to different Internet policies in different countries. The Chinese equivalent of Google
is Baidu, which dominates the Mainland China search engine market with a share of 74.4% in
January 2016, according to AJPR's data. Like Google, Baidu offers a similar service for search
volumes named Baidu Index, which records searches by Baidu users. Although both services
measure search interest, there are certain differences between the two in terms of specific
features and calculation algorithms.
Vaughan and Chen (2015) conducted a comprehensive comparison of Google Trends and Baidu
Index. While both services report search volumes based on specific time periods and provide
volume comparison of a group of terms, only Google Trends can limit to specific search-term
categories. Google Trends collects search volumes in different countries, while Baidu Index
only shows search interest in China as Baidu is predominantly used by Chinese users. While
Google Trends generates relative search volumes, that is, values scaled from 0 to 100 based on
relevant time and location parameters, Baidu Index reports absolute search data that do not
change with the time and location specified. In terms of matching algorithm, Google Trends is
able to accomplish partial match, a Beta feature that counts different search queries relating to
the same topic; however, Baidu Index only uses complete matching due to linguistic difficulties
in breaking Chinese phrases into meaningful parts. These differences between Google Trends
4and Baidu Index suggest that inquiries on the same subject matter using different services might
generate different results.
Since search engine query statistics were proven to have significant relationship with trading
behavior (Preis, Reith, and Stanley 2010), there has been a surge of interest in this field and
scholars have made noticeable progress in both Google Trends based and Baidu Index based
stock market investigations. As it is generally believed that stock investors are more attracted
to domestic markets than foreign markets (Preis, Moat, and Stanley 2013), most scholars
analyzing the U.S. stock market have used Google Trends data restricted to U.S. Internet users,
while scholars studying the Chinese market use Baidu Index. This paper also follows this
principle.
Explaining and Forecasting Stock Market Movements
Initial research on stock market valuation using search volumes focused on assessing whether
there is a significant correlation between search volumes and financial market fluctuations,
specifically movements in trading volumes and stock prices of listed companies. The
pioneering paper of Preis, Reith, and Stanley (2010) provides evidence that there is statistically
significant relationship between weekly Google search volumes of S&P 500 companies and
weekly transaction volumes of corresponding stocks. Moreover, present stock prices are found
to affect search volumes of respective companies in the following weeks.
The research of Preis, Reith, and Stanley (2010) opened up investigations in financial market
valuation using search engine query data. Scholars have expanded the scope of research by not
only studying the underlying relationship between searches and stocks, but also exploring the
5use of search volumes in forecasting future stock movements through both an individual stock
approach and a market approach. Scholars that take an individual stock perspective derive stock
market patterns by analyzing search data for specific stock names or tickers. Inspired by the
research of Mondria, Wu, and Zhang (2010) which is believed to be the first paper that uses
search engine query data to measure attention allocation, Da, Engelberg, and Gao (2011)
propose that search engine volumes serve as a direct proxy for investor attention, which
influences stock market volatility to a great deal. After analyzing Russell 3000 stocks from
2004 to 2008, Da, Engelberg, and Gao (2011) conclude that increases in Google search volumes
lead to higher stock returns for the following two weeks, but the trend will then reverse. Joseph,
Wintoki, and Zhang (2011) also use Google search volumes as a proxy for investor attention,
discovering that search volumes can be used to predict stock returns and trading volumes,
especially abnormal movements due to significant correlation between investor sentiment and
the market risk factor. Building upon previous research findings, Bijl et al. (2016) employ a
more recent search query dataset spanning from 2008 to 2013 and demonstrate that high
Google search volumes result in negative returns. The reason for the difference in findings
proposed by Da, Engelberg, and Gao (2011) and Bijl et al. (2016) might be that they cover data
from different time periods. This suggests that the predictive nature of search engine query data
might change over time, resulting in different kinds of correlation observed between searches
and stock returns as time progresses.
In addition to research at the individual stock level, scholars have also looked at correlation
between search volumes and stock market changes by taking a market-level approach. Instead
of collecting search volumes of individual stocks, Preis, Moat, and Stanley (2013) analyze
6movements in Google search data for keywords related to stock markets such as "portfolio",
"investment", and "hedge". They propose that increasing amounts of investor attention
generally precede declining stock market conditions. This indicates that large-scale collective
attention of investors can be a valuable measure of stock market strength and can lead to more
profitable trading decisions.
On the side of Baidu search volumes, there have been fewer research projects conducted than
on Google searches. Research on Baidu Index and stock market performance has also
discovered significant relationship between the two. Yu and Zhang (2012) use daily Baidu
search volumes of companies in the Growth Enterprise Market of Shenzhen Stock Exchange
to measure the limited attention of Chinese investors due to Baidu's dominance in the China
search engine market. Similar to the findings of Da, Engelberg, and Gao (2011), studies
conducted by Yu and Zhang (2012) reveal that an increase in Baidu Index forecasts rise in stock
price on the same day and reversal in the next few days. They also show that investor attention
on non-trading days is correlated with stock price movements on the next trading day.
Deriving Trading Strategies from Search Volume Data
Because search engine query volumes and stock market performance are demonstrated to be
correlated, some scholars have recommended specific trading strategies based on this
relationship. To test the robustness of search-volume-based prediction, Challet and Bel Hadj
Ayed (2013) confirm the predictive power of Google Trends data, proving the intuition of Preis,
Moat, and Stanley (2013) that financial market downturns are preceded by rising investor
concern. As a result, trading strategies that take a "short" position when search engine query
7volumes increase tend to generate profitable outcomes.
Search engine query data can also provide insight on stock portfolio diversification, as is
suggested by Kristoufek (2013). Because investor sentiment on a stock is strongly correlated
with its risk factor, a potentially profitable strategy is to assign popularly searched stocks with
lower portfolio weights and those less popular with higher weights. According to Kristoufek
(2013), this strategy decreases the total riskiness of the portfolio and tends to perform better
than uniformly weighted portfolios.
Employing similar principles as adopted by Kristoufek (2013), Bijl et al. (2016) propose selling
stocks with high Google search volumes and buying those with low search popularity. This
trading strategy is shown to generate profits if the transaction cost is not considered.
Nevertheless, according to Bijl et al. (2016), high transaction costs might erode profits brought
by the strategy.
Research Scope and Methodology of This Paper
Although Google searches and Baidu searches have been found to correlate with stock market
performance in the U.S. and China respectively, there are fundamental differences between the
two countries in terms of market system and investor demographics. Through search engine
query data, one could potentially understand these differences that characterize each particular
network of trading activities and interactions. In addition, most of previous studies on analyzing
stock movements with search volumes only considered companies that belong to certain market
indices such as S&P 500 (Preis, Reith, and Stanley 2010; Bijl et al. 2016). However, these
companies are relatively popular corporations that tend to draw the attention of not only stock
8investors but also many non-investors who may simply be interested in learning about their
senior management or their products. Bijl et al. (2016), who use S&P 500 companies for their
analysis, point out that the search data have a large amount of noise. As a result, although
overall search attention can contribute to a company's financial performance and subsequently
influence stock movements, the large noise in search volumes of popular companies should
make the data unable to serve as a valid proxy for investor attention.
This paper seeks to effectively compare stock market performance in the U.S. and in China
through the lens of search engine query volumes while reducing the effect of search noise. The
research consists of three parts. First, this paper uses a penalized linear regression method -
LASSO - to investigate how search terms about financial markets relate to weekly returns of
important market indices in the U.S. and China. This is a market-level approach to
understanding stock market trends. Next, this paper tries to capture market movements through
analyzing individual stock data as studying the influence of search volumes and stock trading
volumes on stock returns. Believing that search volumes of large and popular companies are
not reliable, this paper selects companies that are small and undervalued but continuously
growing for both the U.S. stock market and the Chinese stock market, since attention involving
this type of companies can better represent interest in stock as opposed to other miscellaneous
effects. A panel data set covering 261 weeks of observations for 374 U.S. equities and 134
Chinese equities is prepared and an autoregressive linear panel model is then built for each
market to assess how search volumes correlate with stock returns. Finally, a set of trading
strategies are recommended after combining research results in this paper with search-volume-
based strategies proposed in previous studies.
9SEARCH VOLUMES AND MARKET PERFORMANCE
Data
Stock investors' attention to financial phenomena and events can be considered a key driver of
market performance, in that it reflects their confidence with the market and subsequently
influences their trading decisions which characterize the stock market landscape. Nowadays,
the financial world is so dynamic and ever-changing that investors are constantly gathering up-
to-date information in order to keep up with the changes. According to Preis, Moat, and Stanley
(2013), search engines offer a convenient way to obtain important financial information, and
search query data thus become a great proxy for capturing investor attention.
To study how search engine query data can reveal performance of the entire stock market, this
paper analyzes the relationship between return rates of key market indices and search volumes
of terms related to the financial environment. Google search volumes of 98 terms are collected
from Google Trends for the U.S. market. These terms are derived from the work of Preis, Moat,
and Stanley (2013) who use search volumes of these terms to evaluate trading decisions. Table
1 lists the 98 search terms. For the Chinese market, Baidu Index volumes are gathered for
mostly the same terms in Chinese version but minor adjustments are made to several terms to
make them suitable for the Chinese language and the Chinese market. Specifically, the phrase
"dow jones" is changed to "china securities index", "nasdaq" to "Hong Kong Stock exchange",
and "nyse" to "Shanghai Stock Exchange". The words "return", "gain", "returns", and "gains"
are combined because they are the same in Chinese; the same treatment applies to "short
selling" and "short sell", "investment" and "invest", "housing" and "house", and "consume" and
10"consumption". As a result, there are 91 search terms after adjustments for the Chinese market.
The data set covers a time period of 5 years (261 weeks) from June 05, 2011 to June 04, 2016.
Search volumes for each term are standardized in order to transform all predictors to
comparable scales and equalize the range and variability across them. The standardization
formula used is as follows (SV i,t represents the search volume of term i during week t; SSV i,t
represents the standardized search volume of term i during week t):
Next, weekly closing prices (week ending Friday) of key market indices are collected over the
same time period. For the U.S. market, three important indices are selected- Standard & Poor's
500 (SP 500), Dow Jones Industrial Average (DJIA), and NASDAQ Composite
11(NASDAQCOM). Data sets of weekly closing prices of these indices are obtained from the
Federal Reserve Bank of St. Louis Research Database. For the Chinese market, this paper looks
at two essential indices - China Securities Index 300 (CSI 300) and Hang Seng Index (HSI).
Data sets for Chinese market indices are acquired from Investing.com. Weekly rates of return
in percentage point are then calculated for each index as shown below (R t represents index
return and P t represents closing price for week t).
LASSO Regression
Because the number of search terms is very large and each of them influences returns of
different indices to different degrees, one needs to identify among all 98 (or 91) terms a set of
terms that are most important for each market index. Therefore, this paper chooses to
implement a penalized linear regression method - LASSO regression to analyze the effect of
search volumes on index returns. LASSO (least absolute shrinkage and selection operator)
performs variable selection and regularization in order to increase prediction accuracy while
making the resulting statistical model easier to interpret. LASSO regression has the effect of
shrinking coefficients towards zero. In ordinary least squares (OLS) regression, one only
needs to minimize the residual sum of squares, whereas in LASSO, one also minimizes
, which is a shrinkage penalty. The degree of penalty depends on the size of λ. As λ
increases, the effect of the shrinkage increases, bringing the coefficients towards zero. As a
result, the estimated coefficients in the LASSO regression are generally smaller but more
reliable than the coefficients in the original least squares (OLS) regression. This paper uses
12the glmnet package in R to conduct LASSO regression (Friedman, Hastie, and Tibshirani
2010).
To generate LASSO regression on each market index, one first needs to determine the values
of two parameters: α and λ. α=1 indicates the use of LASSO method. To select a λ for each
LASSO fit, this paper runs a 10-fold cross-validation, which is a model validation technique
for estimating prediction accuracy, and then chooses a λ value that not only leads to small
prediction error but also directs LASSO method to select a reasonable number of predictors.
Results
Table 2 shows coefficients from LASSO regression on SP 500, DJIA, and NASDAQCOM,
and Table 3 shows coefficients from LASSO regression on CSI 300 and HSI. Blank entries in
the two tables indicate that the term is not selected when performing LASSO regression on the
corresponding index, but is considered significant for other index/indices in the table. The
values in parentheses represent coefficient standard errors, which are obtained using the
Bootstrap method by replicating the LASSO procedure 1000 times. In Table 2, terms suggested
by LASSO regression to be most important in influencing returns of U.S. market indices
include "debt", "housing", "money", "headlines", "stock market", "nasdaq", "house", "bubble",
"rare earths", "freedom", and "dividend". "Debt", "house", "freedom", and "dividend" are
shown to be positively correlated with index returns. Although frequently associated with
financial crisis, the word "debt" has positive effect in the analysis of the U.S. market, possibly
because more "debt" can also indicate higher repaying capacity and may increase firm value
so long as the firm is not at too large of a bankruptcy risk. "House" is directly related to the real
13estate market; construction and acquisition activities tend to boost economic growth and hence
stock market growth. Although the coefficient of "housing", a close term to "house", is negative,
the net effect of "house" and "housing" is still positive. "Freedom", despite having political
meaning, can signify people's overall satisfaction with their lives and more confidence in the
stock market. More "dividends" means more earnings and also increases investor confidence.
On the other side, in addition to "housing", "money", "headlines", "stock market", "nasdaq",
"bubble", and "rare earths" show negative impact. It makes immediate sense that "bubble"
signifies investor concern and "rare earths" mining will bring environmental damage, so
increases in their search volumes relate to market downturn. The reason that the effect of
"headlines" is negative might be that widely searched pieces of news are most likely to be
events that cause significant worry and concern in the society. It is unusual that "money", "stock
market" and "nasdaq" also carry negative coefficients; a plausible interpretation may be that
increases in attention on these terms can result from financial issues or high market volatility
which prompt investors to investigate what is going on.
14Notes:
1. “SP 500” stands for Standard & Poor’s 500; “DJIA” stands for
Dow Jones Industrial Average; “NASDAQCOM” stands for
NASDAQ Composite.
2. Each entry gives the coefficient of the corresponding variable
and includes the coefficient standard error in parenthesis.
3. Coefficient “0.0597” signifies that, controlling for other
variables, a 1-unit increase in standardized Google search
volume of the word “debt” corresponds to an increase of 0.0597
units in the return of SP 500.
15In Table 3, it can be seen that important search terms on Chinese market indices are "debt",
"color", "stocks", "derivatives", "economics", "headlines", "society", "fine", "bank of china",
"travel", "holiday", "water", "opportunity", "success", "war", "forex", "transaction", health",
"culture", "tourism", and "labor". Only two terms overlap with results on U.S. indices - "debt"
and "headlines", but their coefficients carry different signs. The word "debt" has positive effect
on U.S. indices, while on both CSI 300 and HSI it is negative. In China where the economy is
still in a developing stage, investors tend to associate "debt" with bad debts rather than an
indication of firm value; the fear of bad debt expenses thwarts people from making investments.
The word "headline" becomes positive in China, as opposed to negative in the U.S. This may
arise from the Chinese regulatory agencies controlling the spread of news and requiring the
press to only report positive events. Similar to U.S. results on "money", "stock market", and
"nasdaq", words like "stocks", "economics", "bank of china", "society", and "forex" which
represent the big picture display negative influences. "Derivatives", "transaction", and
"opportunity" are positive possibly because these financial activities boost market growth.
Moreover, negative "color" might be related to superstitions in Chinese culture as red color
usually represents growth while green color is downturn. Another three notable terms are
"travel", "holiday", and "tourism". As is widely recognized, tourism is a big industry in China
and is most profitable during holidays. Chinese investors generally are vigilant about holidays
because they fear that a long holiday might cause stock prices to fall, so they will short-sell
stocks before holidays as a safe investment strategy, thereafter causing "holiday" and "tourism"
to be negatively correlated with index returns. Nevertheless, "travel" is still positive since it is
closely related to transportation which leads to GDP growth.
16Notes:
1. “CSI 300” stands for China Securities Index 300; “Hang
Seng” stands for Hang Seng Index.
2. Each entry gives the coefficient of the corresponding variable
and includes the coefficient standard error in parenthesis.
3. Coefficient “-0.2691” signifies that, controlling for other
variables, a 1-unit increase in standardized Baidu search
volume of the word “debt” corresponds to a decrease of
0.269 units in the return of CSI 300.
17Comparing Table 2 and Table 3, one can see that there are noticeable differences in the terms
selected by LASSO regression. While important terms for U.S. indices are very close to the
concept of stock market, terms for Chinese indices have more diversity and include words such
as "tourism", "water", and "culture" that are more related to the general economic landscape
rather than to the stock market specifically. This shows that U.S. investors tend to focus most
of their attention on stock-market-specific inquiries. On the other hand, Chinese investors make
estimations about the stock market based on overall economic strength. In addition, the
regression results can also signal that the U.S. stock market is more institutionalized than the
Chinese market. According to Reuters and Investopedia, 85 percent of trades in China's stock
markets are implemented by retail investors and over two-thirds of China's newest retail
investors have no high school degree. As a result, Chinese investors tend to base their trading
strategies on overall economic trends and rough estimations rather than conduct market and
industry analyses or corporate valuations and therefore have less exposure to stock market
terminologies. In the U.S., institutional investors dominate the stock market, managing a
proportion of equities with 67 percent of market capitalization as of 2010. Professional research
analysts working for these institutional investors tend to focus on more advanced terms in order
to gather useful information for building financial models.
Moreover, coefficients of selected terms for Chinese indices are generally higher in magnitude.
For instance, the magnitude of coefficient for "debt" on HSI is 0.3931, whereas coefficients for
the U.S. market are mostly below 0.1 in magnitude. Nevertheless, the coefficient standard
errors are also larger in the China model, especially for CSI 300. Therefore, there is no
sufficient evidence to determine the statistical significance of the larger coefficient magnitudes.
18SEARCH VOLUMES AND STOCK RETURNS
Data
Screening Companies
As was discussed before, search volumes of large and popular companies contain large noise
from non-investors' searches and are therefore not a reliable proxy for investor attention. To
effectively examine the relationship between search volumes and stock market movements at
the individual stock level, this paper chooses small and undervalued but continuously growing
companies as attention involving these companies can better represent interest in stock as
opposed to other miscellaneous effects. The following 4 criteria are used in company selection.
The first criterion is a must; for the next three criteria, a company only needs to satisfy two of
them to be considered.
• Companies that are small-sized, i.e., those with market capitalization under USD 10 billion
on U.S. stock exchanges, under CNY 30 billion on Shanghai and Shenzhen Stock
Exchanges, and under HKD 35 billion on Hong Kong Stock Exchange.
• Companies that maintain competitive advantage, i.e., those having consistently above 12%
return on equity (ROE) over the past 5 years. In the long-run the ROE will become the
average return investors get from holding the stock.
• Companies that are undervalued, i.e., those with PEG ratios (price/earnings divided by
earnings-per-share growth rate) that are less than 1.
• Companies that bear low debt, i.e., those with debt to equity (D/E) ratios that are
consistently under 25% over the past 5 years.
19This paper uses the Equity Screening function on Bloomberg Terminal to run the selection
process for U.S. stocks and Chinese stocks respectively. Stocks from all U.S. exchanges and
all Chinese exchanges are included in the selection pool. There are 459 U.S. stocks and 497
Chinese stocks qualified based on the above 4 criteria.
Obtaining Stock Data
Next, using the Bloomberg Add-in tool in Excel, this paper imports weekly closing prices
(week ending Friday) and weekly total trading volumes of stocks that passed the screening tests
from June 05, 2011 to June 04, 2016, covering a period of 5 years (261 weeks). The rates of
return for all remaining stocks are calculated as shown below (r i,t represents return of stock i
in week t).
In addition, this paper detaches the trend in trading volume data for each stock by transforming
original trading volumes into detrended log volumes (DL_Volume). The formula used in
calculating detrended log volumes is derived from the work of Bijl et al. (2016), in which the
removed trend is a rolling average of past 12 weeks of log volumes.
Collecting Google and Baidu search volumes
To measure investor attention on U.S. stocks, this paper collects Google search volumes of
respective company names from Google Trends. Since Preis, Moat, and Stanley (2013)
20discover that search volumes of U.S. Internet users are more representative of the U.S. stock
market than global search volumes, this paper restricts search data collections to the U.S. only.
Names of companies are used as the query terms as this paper assumes that the majority of
investors tend to search the names they are interested in rather than tickers as tickers are usually
difficult to remember; also, some tickers such as "SAVE" for Spirit Airlines Incorporated refer
to subject matters unrelated to the company or the stock. In getting search volume data, this
paper omits parts such as "Inc." and "ADR" at the end of company names as it is reasonable
assumption that investors do not include these parts in a company name when running the
searches. In addition, this paper also takes advantage of the Beta feature of Google Trends
which provides accurate measurements of overall search interest on "topics". When measuring
a company name as a "topic", the Google Trends algorithms count many search queries that
relate to the same company so that variations of the company name will be considered
collectively.
For Chinese stocks, Baidu search volumes of their company names are collected. The list of
Chinese stocks includes those from the three stock exchanges in China – Shanghai Stock
Exchange, Shenzhen Stock Exchange, and Hong Kong Stock Exchange. Because Google
search engine is largely inaccessible in Mainland China, Baidu is the main source of Mainland
China investors to research Shanghai and Shenzhen listed. In Hong Kong, investors use various
types of search engines due to diversity in investor demographics. This paper chooses to use
Baidu Index as well for Hong Kong stocks because of their close connections with Mainland
China. Due to the proximity of HK to Mainland China, most stocks listed in Hong Kong are
mainland companies or have significant portion of operations in Mainland China. Mainland
21investors have long been trading Hong Kong stocks or watching them closely because of how
the Mainland and Hong Kong markets can impact each other. The Shanghai-Hong Kong Stock
Connect program initiated in November 2014 further expanded mainland investors'
participation in Hong Kong stock market. Moreover, most of the web attention on HK stocks
should have been coming from the mainland due to the sheer number of mainland china internet
users. According to Internet World States, China has the largest web user population in the
world, contributing 41.6% of users while Hon Kong only uses 0.4%. Therefore, even though
google is the dominant search engine in Hong Kong, considering the close connection between
Hong Kong and Chinese markets, Baidu Index should be the most reliable in capturing investor
attention. The search volume data sets cover the same 5-year period (261 weeks).
To transform search data into comparable scales, this paper standardizes search volume data as
follows (SV i,t represents search volume of company i in week t; SSV i,t represents standardized
search volume of company i in week t).
Afterwards, the data sets are cleaned up by keeping only companies that have complete and
reasonable (no missing or irregular) stock performance data and search volume data, resulting
in 374 U.S. stocks and 134 Chinese stocks.
Autoregressive Linear Panel Model
To build stock valuation models, this paper puts all data sets collected above together into a
22panel data with 261 weeks of observation for 374 U.S. stocks and another panel data also with
261 weeks of observation for 134 Chinese stocks. Panel data, also called cross-sectional time
series data, involve measurements of individuals over time. In other words, each row of the
data set represents a specific individual at a specific time. According to Croissant and Millo
(2008), a linear panel data model can be described using the following general formula.
where i is the individual index (in this case the stock), t is the time index (in this case the week
number) and μ i,t a random disturbance term of mean 0.
The linear panel models are built using the plm package in R (Croissant and Millo 2008). The
modeling procedure follows Bijl et al. (2016). Current Stock Return is used as the dependent
variable. This paper not only seeks to analyze current effects but also looks at how previous
weeks' data influence current performance. Thus for predictors, this paper uses five lags of
Stock Return (stocks returns in previous five weeks), current and five lags each for
Standardized Google/Baidu Search Volumes (SGSV/SBSV) and Detrended Log Volumes
(DL_Volume), current and five lags for the interaction between Standardized Google/Baidu
Search Volumes and Detrended Log Volumes, as well as five lags for the interaction between
Standardized Google/Baidu Search Volumes and previous weeks' Stock Return. The interaction
variables are determined based on the conclusion of Preis, Reith, and Stanley (2010) that
current search volumes are correlated with current trading volumes, and that present stock
prices influence search volumes of the corresponding company names in the following weeks.
For the linear panel regression, this paper builds a Two-ways Effects Within Model. "Two-
23ways" means that the model takes into account both individual and time effects. The "Within"
model, also called "fixed effects" model, specifies that the individual component of the error
term μ i.t is correlated with the predictors. Using fixed effects, coefficients are estimated by
Ordinary Least Squares (OLS) on transformed data, giving consistent estimates for β. The
"within" specification is selected over "random" specification (when the individual component
of error is uncorrelated with predictors) through Hausman Test (Hausman 1978).
As a result, the model for U.S. stocks can be shown as follows.
where L denotes the lag operator, denotes five most recent lags, and denotes current
and five most recent lags.
Results
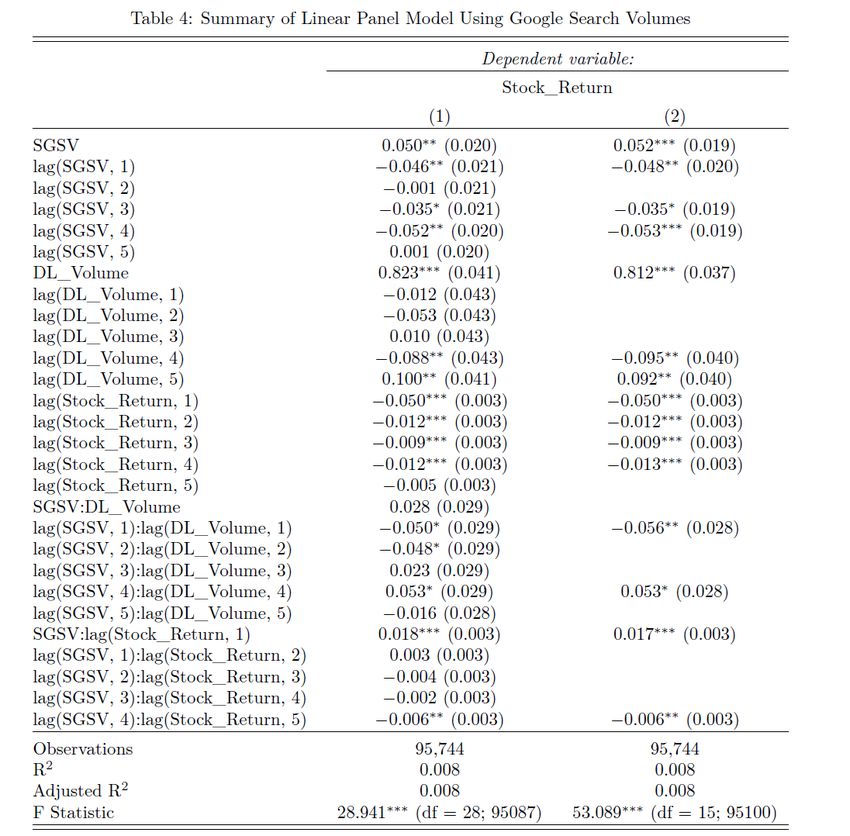
Table 4 shows the summary results of linear panel model using Google search volumes for
U.S. stocks, and Table 5 shows summary results of linear panel model using Baidu search
volumes for Chinese stocks. In each table, Column (1) shows the estimated coefficients after
fitting the regression using all predictors listed on the left of the table, while Column (2) are
results after eliminating predictors one at a time until all predictors left are significant at an α
level of 0.1. The stars next to some coefficients represent p-value ranges. One star indicates a
p-value less than 0.1, two stars less than 0.05, and three stars less than 0.01. The values in
parantheses are standard errors of the corresponding coefficients.
24Notes: 1. “Stock_Return” denotes the percentage change in stock price; “SGSV” denotes standardized Google search volume; “DL_Volume” denotes detrended log trading volume; “SGSV:DL_Volume” denotes the interaction between standardized Google search volume and detrended log trading volume; “lag(Var, x)” denotes the xth lag of variable Var. 2. Each entry gives the coefficient of the corresponding variable and includes the coefficient standard error in parenthesis. 3. *p-value
Notes:
1. “Stock_Return” denotes the percentage change in stock price; “SBSV” denotes
   standardized Baidu search volume; “DL_Volume” denotes detrended log trading
   volume; “SBSV:DL_Volume” denotes the interaction between standardized
   Baidu search volume and detrended log trading volume; “lag(Var, x)” denotes the
   xth lag of variable Var.
2. Each entry gives the coefficient of the corresponding variable and includes the
   coefficient standard error in parenthesis.
3. *p-value
Examining Table 4 for the U.S. stock market, the following findings can be obtained.

•   Current and previous week's Google search volumes have significant relationship with

    current stock return.

•   Current Google search volumes are positively correlated with current stock return, while

    Google search volumes of previous 4 weeks have negative impact. This resonates with the

    findings of Bijl et al. (2016) that high Google search volumes are followed by negative

    returns, confirming that information in Google searches is assimilated into the U.S. stock

    market faster and hence, although higher searches can lead to higher returns in the current

    week, they forecast lower returns in the future.

•   Current trading volumes are positively correlated with current stock return, and show high

    statistical significance (p-value less than 0.01) and the highest coefficient estimate among

    all coefficient values (0.823). This makes sense because high trading volumes indicate that

    investors are incentivized to buy the stock because of its high current return. Trading

    volumes in previous two weeks are negatively correlated with current stock return,

    suggesting that investor expectations for high return lead to large-scale buying activities,

    which can subsequently bring returns down.

•   Stock returns in previous 4 weeks are significantly negatively correlated with current return

    due to the autoregressive nature of the stock return time series. Also, high returns in the

    current week inflate investor expectations and buying activities which may fade away in

    following weeks.

•   The interaction between search volumes and trading volumes in the previous week has

    significant negative correlation with current stock return. Both search volumes and trading
                                                                                              27
volumes of the previous week separately have negative impact on current return, and the
interaction shows that their collective effect is also significantly negative.
• The interaction between current search volumes and previous week's stock return is
positively related to current return with high significance, suggesting that their collective
effect leads to higher stock return.
Examining Table 5 for the Chinese stock market, the following results are derived.
• Baidu search volumes do not seem to have significant relationship with stock return, which
contradicts the conclusions in Yu and Zhang (2012). Although search volumes in the 4th
and 5th weeks prior show some significance after variable selection, the significance is only
slight (p-value less than 0.1 but larger than 0.05). The different results might have arisen
from the fact that Yu and Zhang (2012) use only companies in the Growth Enterprise
Market of Shenzhen Stock Exchange in their analysis, whereas this paper considers all
China-listed companies, selecting small and undervalued but continuously growing
companies. This paper also uses a more recent data set covering a period from June 05,
2011 to June 04, 2016 while Yu and Zhang (2012) use one-year data from April 01, 2011
to March 31, 2012.
The lack of significance of Baidu search volumes in this paper might also result from the
less institutionalized nature of the Chinese market. Since all China-listed companies in the
model are small in market capitalization, they are less popular compared to larger ones.
While U.S. institutional investors are generally skilled at identifying potentially profitable
28investments regardless of popularity, most retail investors in China are not likely to focus
on undervalued yet continuously growing companies except really experienced investing
professionals. As a result, a relatively small group of investors only generate limited
transactions and the attention contributed by them is not enough to trigger significant
fluctuations in stock prices.
• Similar to U.S. results, current trading volumes are positively correlated with current stock
return, and show high statistical significance (p-value less than 0.01) and the highest
coefficient estimate among all coefficient values (1.536). Trading volumes in previous two
weeks are also negatively correlated with current stock return.
• Similar to U.S. results, stock returns in previous 4 weeks are significantly negatively
correlated with current return.
• While in the U.S. model the interaction between search volumes and trading volumes in
the previous week has significant negative correlation with current stock return, in the
China model it is the interaction between current search volumes and trading volumes that
is significant. Although search volumes are insignificant as a separate variable, the
collective effect of current search volumes and trading volumes is significant and positive.
• The effect of interaction between search volumes and previous weeks' stock return is more
outstanding in the China model than in the U.S. model.
29TRADING STRATEGY RECOMMENDATIONS
Based on research results in the above sections and search-based trading strategies proposed in
previous studies, this paper provides the following recommendations for stock investors:
• To estimate strength of the entire stock market in either the U.S. or China, one could use
search volumes of the important terms found in Section 2 to gauge if the returns of key
stock market indices will increase or decrease.
• To forecast stock returns for U.S.-listed companies, one can follow the trend that higher
Google search volumes in the current week lead to lower stock returns in following weeks.
• As is evidenced in the model results for the U.S., increased search volumes and trading
volumes have negative impact on future stock returns as they tend to boost investor
expectations and trading activities but this positiveness will eventually reverse. Moreover,
previous studies have also noted that market downturns are preceded by rising investor
attention (Preis, Moat, and Stanley 2013), and that stocks with high searches suggest high
riskiness (Kristoufek 2013; Bijl et al. 2016). Therefore, one can take the recommendation
of Kristoufek (2013) to assign lower portfolio weights to stocks with high Google searches
and higher weights for less popular stocks, or take the recommended action of Bijl et al.
(2016) to sell stocks with high Google searches and buy those with low searches.
• For China-listed companies, however, it would be hard to forecast future returns using
Baidu search volumes, but one may look at previous weeks' stock returns which should be
negatively correlated with current returns. Moreover, higher trading volumes in the
previous week do lead to negative stock returns in the current week. This is also an
indication that high investor expectations drive down stock returns, and one could capitalize
on this trend in developing trading strategies.
30CONCLUSION
This paper takes both a market level approach and an individual stock level approach to
examine how Internet search activity’s influence on stock market performance differs between
the U.S. and China by treating search volumes of markets-related terms and company names
as proxy for investor attention. On the market level, LASSO regression is used to select the
most influential terms to stock market indices for both countries. The composition of selected
terms turns out to be different between the two countries. While terms strictly related to the
stock market are found to be most important to the U.S., terms selected for China tend to be
biased toward more general financial and economic concepts, suggesting that the U.S. stock
market is more institutionalized than its Chinese counterpart.
On the individual stock level, small and undervalued but continuously growing companies are
chosen for each country to reduce the amount of noise in search data. Search volumes of
company names are discovered to be significantly correlated with stock returns in the U.S.
stock market, whereas search volumes do not appear significant to stock returns in China. This
indicates that Chinese stock investors are less likely to discover undervalued yet potentially
profitable investments, confirming the less institutionalized nature of the Chinese stock market.
This paper also provides recommendations on search-based trading strategies by integrating
research results with findings in previous studies. U.S. investors could make investing
decisions by noting that increased search volumes and trading volumes have negative
correlation with future stock returns; Chinese investors may look at previous weeks’ stock
returns and trading volumes which should be negatively related to current week’s stock return.
31REFERENCES
Askitas, N., and K. F. Zimmermann. 2009. Google econometrics and unemployment
forecasting. Applied Economics Quarterly 55 (2): 107-120.
Bijl, L., G. Kringhaug, P. Molnár, and E. Sandvik. 2016. Google searches and stock returns.
International Review of Financial Analysis 45 (5): 150-156.
Challet, D., and A. Bel Hadj Ayed. 2013. Predicting financial markets with google trends and
not so random keywords. Available at: http://arxiv.org/abs/1307.4643 (August 14, 2013).
Croissant, Y., and G. Millo. 2008. Panel data econometrics in R: the plm package. Journal of
Statistical Software 27 (2): 1-43.
Da, Z., J. Engelberg, and P. Gao. 2011. In search of attention. The Journal of Finance 66 (5):
1461-1499.
Friedman, J., T. Hastie, and R. Tibshirani. 2010. Regularization paths for generalized linear
models via coordinate descent. Journal of Statistical Software 33 (1): 1-22.
Gabaix, X., P. Gopikrishnan, V. Plerou, and H. E. Stanley. 2003. A theory of power-law
distributions in financial market fluctuations. Nature 423 (6937): 267-270.
Ginsberg, J., M. H. Mohebbi, R. S. Patel, L. Brammer, M.S. Smolinski, and L. Brilliant. 2008.
Detecting influenza epidemics using search engine query data. Nature 457 (7232): 1012-
1014.
Hausman, J. A. 1978. Specification tests in econometrics. Econometrica 46(6): 1251-1271.
Joseph, K., M. B. Wintoki, and Z. Zhang. 2011. Forecasting abnormal stock returns and trading
volume using investor sentiment: Evidence from online search. International Journal of
Forecasting 27 (4): 1116-1127.
32Kristoufek, L. 2013. Can google trends search queries contribute to risk diversification?
Scientific Reports 3: 2713. Available at: http://www.nature.com/articles/srep02713
Mondria, J., T. Wu, and Y. Zhang. 2010. The determinants of international investment and
attention allocation: Using internet search query data. Journal of International Economics
82 (1): 85-95.
Plerou, V., P. Gopikrishnan, X. Gabaix, and H. E. Stanley. 2004. On the origin of power-law
fluctuations in stock prices. Quantitative Finance 4 (1): 11-15.
Preis, T., H. S. Moat, and H. E. Stanley. 2013. Quantifying trading behavior in financial markets
using google trends. Scientific Reports 3: 1684.
Preis, T., D. Reith, and H. E. Stanley. 2010. Complex dynamics of our economic life on
different scales: Insights from search engine query data. Philosophical Transactions of the
Royal Society of London A: Mathematical, Physical and Engineering Sciences 368 (1933):
5707-5719.
Vaughan, L., and Y. Chen. 2015. Data mining from web search queries: A comparison of google
trends and baidu index. Journal of the Association for Information Science and Technology
66 (1): 13-22.
Yu, Q., and B. Zhang. 2012. Limited attention and stock performance: an empirical study using
Baidu Index as the proxy for investor attention [Chinese]. Journal of Financial Research
2012(8): 152-165.
33You can also read