Rainfall Nowcasting Using Commercial Microwave Links
←
→
Page content transcription
If your browser does not render page correctly, please read the page content below
RESEARCH LETTER Rainfall Nowcasting Using Commercial Microwave Links
10.1029/2020GL089365
 R. O. Imhoff1,2 , A. Overeem1,3 , C. C. Brauer1 , H. Leijnse3 , A. H. Weerts1,2 ,
Key Points:
 and R. Uijlenhoet1
• Probabilistic rainfall nowcasts are
 constructed with rainfall estimates 1 Hydrology and Quantitative Water Management Group, Wageningen University & Research, Wageningen, The
 from commercial microwave links
• The nowcasts are compared to Netherlands, 2 Operational Water Management & Early Warning, Department of Inland Water Systems, Deltares, Delft,
 radar rainfall nowcasts for 12 The Netherlands, 3 R&D Observations and Data Technology, Royal Netherlands Meteorological Institute, De Bilt, The
 summer days Netherlands
• Nowcast skill depends on link
 network density and is generally
 comparable to that of radar rainfall
 nowcasts Abstract Accurate and timely precipitation forecasts are crucial for early warning. Rainfall
 nowcasting, the process of statistically extrapolating recent rainfall observations, is increasingly used for
Supporting Information:
 short-term forecasting. Nowcasts are generally constructed with high-resolution radar observations.
• Supporting Information S1 As a proof of concept, we construct nowcasts with country-wide rainfall maps estimated from signal level
• Movie S1 data of commercial microwave links (CMLs) for 12 summer days in the Netherlands. CML nowcasts
• Movie S2
 compare well to radar rainfall nowcasts. Provided well-calibrated CML rainfall estimates are employed,
 CML nowcasts can outperform unadjusted real-time radar nowcasts for high rainfall rates, which are
Correspondence to: underestimated as compared to a reference. Care should be taken with the sensitivity of the advection field
R. O. Imhoff,
ruben.imhoff@wur.nl
 derivation to areas with low CML coverage and the inherent measurement scale of CML data, which can
 be larger than the application scale. We see potential for rainfall nowcasting with CML data, for example,
 in regions where weather radars are absent.
Citation:
Imhoff, R. O., Overeem, A.,
Brauer, C. C., Leijnse, H., Plain Language Summary Capturing the amount, timing and location of rainfall are of
Weerts, A. H., & Uijlenhoet, R. key importance for water management and the agricultural sector. Nowcasting of rainfall, a computational
(2020). Rainfall nowcasting using approach where the most recent rainfall observations are spatially extrapolated, is increasingly used for
commercial microwave links.
Geophysical Research Letters, 47, short-term rainfall forecasts. The required rainfall observations normally originate from weather radars,
e2020GL089365. https://doi.org/10. but it has previously been demonstrated that rainfall can also be estimated from rain-induced signal
1029/2020GL089365 attenuation from the commercial microwave links (CMLs) in cellular telecommunication networks,
 which are used worldwide. In this study, we use such estimates to construct rainfall nowcasts for
Received 16 JUN 2020 12 summer events in the Netherlands, which we compare to nowcasts using operational radars. The results
Accepted 6 SEP 2020 demonstrate that there is potential for using rainfall estimates from CML data to nowcast rainfall up
Accepted article online 14 SEP 2020
 to a few hours ahead, for example, in (low- and middle-income) regions where high-resolution rainfall
 observations or weather radars are absent.

 1. Introduction
 Accurate and timely precipitation forecasts are crucial for flood early warning, water management, and
 agriculture (Ingram et al., 2002; Pappenberger et al., 2015; Thorndahl et al., 2017). The required forecast hori-
 zon depends on the application and can range from weeks to less than an hour ahead. For forecast horizons
 of 3 hr or less, rainfall nowcasts, the (statistical) process of extrapolating real-time remotely sensed quantita-
 tive precipitation estimates (QPEs), are increasingly used (e.g., Ebert et al., 2004; Foresti et al., 2016; Liguori
 & Rico-Ramirez, 2012; Pierce et al., 2012; Wilson et al., 2010). Most nowcasts are made with radar-based
 QPE, but these and other high-resolution rainfall observations are not omnipresent (Kidd et al., 2017;
 Lorenz & Kunstmann, 2012; Saltikoff et al., 2019; World Meteorological Organization, 2020).
 Alternative sources are needed to increase the coverage and spatiotemporal resolution of rainfall informa-
 tion and to enable or improve high-resolution quantitative precipitation forecasting (QPF). A promising
©2020. The Authors.
This is an open access article under the option is signal level data from the roughly four million commercial microwave links (CMLs) worldwide
terms of the Creative Commons (Ericsson, 2016). These are near-ground radio connections used in cellular telecommunication networks.
Attribution License, which permits As these links operate at frequencies where raindrops significantly absorb and scatter radio waves
use, distribution and reproduction in
any medium, provided the original (Atlas & Ulbrich, 1977; Hogg, 1968; Olsen et al., 1978), rainfall attenuates the signals between the trans-
work is properly cited. mitting and receiving CML antennas. Although this is a nuisance from the telecommunication perspective,

IMHOFF ET AL. 1 of 10
Geophysical Research Letters 10.1029/2020GL089365

 rain-induced attenuation can be used to estimate path-averaged rainfall intensities (e.g., Chwala et al., 2012;
 Chwala & Kunstmann, 2019; Doumounia et al., 2014; Gosset et al., 2015; Leijnse et al., 2007; Messer
 et al., 2006; Overeem et al., 2011; Rayitsfeld et al., 2012; Uijlenhoet et al., 2018; Zinevich et al., 2009).
 When two-dimensional rainfall fields are constructed from the CML data (Graf et al., 2020; Overeem et al.,
 2013, 2016b), (operational) nowcasting may become feasible. In this study, the opportunities and limitations
 of nowcasting rainfall with CML data are explored for the first time. Its potential is evaluated by comparing
 to gauge-adjusted radar rainfall data and nowcasts. Nowcasts are created with both CML and radar QPE by
 employing pySTEPS (Pulkkinen et al., 2019) in a probabilistic sense for 12 summer days. We focus on the
 Netherlands, as country-wide rainfall maps from CML data are already available and have been evaluated
 (Overeem et al., 2013). Hence, the Netherlands acts as a testbed for rainfall nowcasting with CML data.

 2. Data and Methods
 2.1. CML Rainfall Estimates
 Data from 1,751 CMLs covering the Netherlands (Figure 1b) were provided by T-Mobile NL. A CML is the
 link along one path, often having two sublinks for communication in both directions. Minimum and maxi-
 mum received powers over 15-min intervals were obtained from on average 2,400 sublinks with a precision
 of 1 dB, based on 10-Hz sampling. The links measured 10–30 m above the ground, used microwave frequen-
 cies ranging from ∼13 to 40 GHz (majority 37–40 GHz) and had an average length of 3.1 km. The transmitted
 signal levels, which were not available, were constant for each link.
 The CML QPE in this study was the same as the validation data set in Overeem et al. (2013), who retrieved
 rainfall maps with RAINLINK on a 1-km2 spatial and 15-min temporal resolution for 12 days from June,
 August, and September 2011. RAINLINK parameters were based on an independent calibration data set
 with events in June and July 2009 and 2011 (Overeem et al., 2011, 2013, 2016a). Overeem et al. (2013, 2016a)
 and Rios Gaona et al. (2015) provide more information on the characteristics and QPE performance of the
 12-day validation data set.
 First, RAINLINK performs several corrections to the data and determines the reference attenuation belong-
 ing to dry weather (Overeem et al., 2011, 2013, 2016a). Subsequently, it computes minimum and maximum
 specific attenuation (dB/km) from the decrease in received signals with respect to the reference, correcting
 for wet antennas. Rainfall intensity is estimated from specific attenuation using a power-law relationship
 (Atlas & Ulbrich, 1977, 2016a; Olsen et al., 1978), with coefficients derived from climatological rain drop-size
 distributions and computed electromagnetic scattering by raindrops (Leijnse et al., 2008). Fifteen-minute
 average rainfall intensities are then computed using a weighted average of minimum and maximum inten-
 sities. Finally, path-averaged rainfall intensities are spatially interpolated to obtain rainfall maps using
 ordinary kriging with a variogram model based on rain gauge data (for parameter values, see Overeem et
 al., 2016a; Van de Beek et al., 2012).

 2.2. Radar Rainfall Estimates
 We used rainfall estimates of an unadjusted and a gauge-adjusted (“reference”) radar data set with a 1-km2
 and 5-min resolution. Both data sets originate from two C-band weather radars (Figure 1b), operating at
 a single horizontal polarization (see Beekhuis & Holleman, 2008; Beekhuis & Mathijssen, 2018). Rainfall
 intensities are estimated with a standard Z-R relationship (Marshall et al., 1955) from constant-altitude
 Doppler-filtered radar reflectivity composites at 1,500 m. In the reference data set (referred to as “A-Rad”
 from here onward), the rainfall estimates are adjusted with data from 31 automatic and 325 manual rain
 gauges (Overeem, Buishand et al., 2009; Overeem, Holleman et al., 2009; Overeem et al., 2011). These
 adjustments are omitted in the unadjusted radar data (referred to as “U-Rad”), which makes this product
 representative of the best available real-time radar QPE at that time. A gauge-adjusted operational QPE prod-
 uct was not available at the time but is since recently provided by KNMI. Application of this product would
 likely lead to improved radar rainfall nowcasts as compared to this study.
 Nowcasts with both data sets were produced at a 5-min temporal resolution. This is a finer resolution than
 for the CML nowcasts (15-min), because this allowed to make full use of the data as it would have been
 operationally available. For a fair comparison, we evaluated the nowcasts at a 15-min interval by accumu-
 lating the nowcasts to 15-min rainfall sums. To correct for the resulting shift between rainfall patterns in

IMHOFF ET AL. 2 of 10
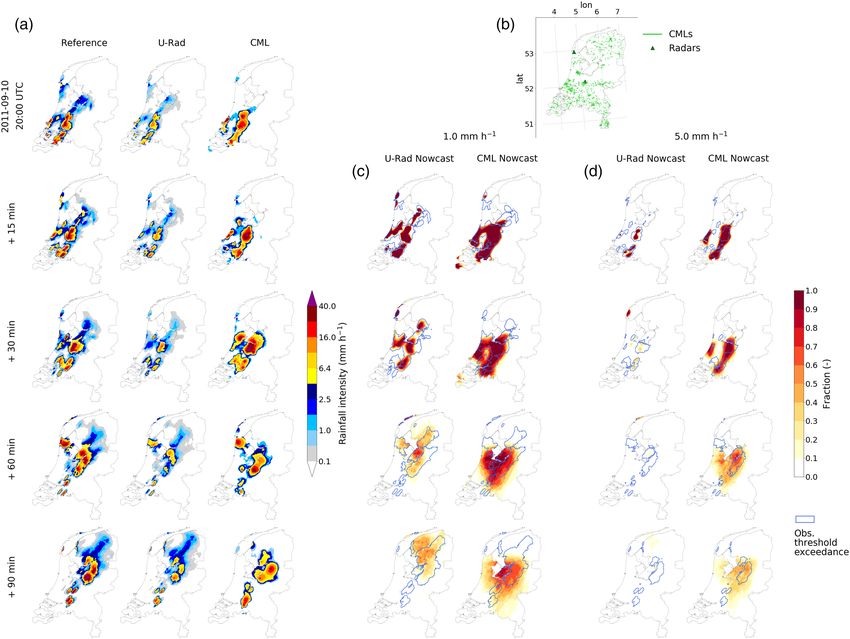
Geophysical Research Letters 10.1029/2020GL089365

Figure 1. Comparing CML estimates and nowcasts to radar for the Netherlands at 10 September 2011 20:00 UTC. (a) The reference rainfall intensity (A-Rad)
and the QPE of U-Rad and CML for five lead times. (b) Link coverage at the start of the nowcast and radar locations. (c and d) Probabilities of exceeding rainfall
intensities of (c) 1.0 and (d) 5.0 mm/hr, based on ensemble nowcasts created with U-Rad and CML QPE. Blue contour lines indicate regions where the
threshold is exceeded in the reference.

 consecutive maps, a significant effect when rainfall moves or develops quickly, advection correction (tempo-
 ral interpolation) was applied following the method of Anagnostou and Krajewski (1999). In this procedure,
 the interval of the discrete temporal interpolation was 1 min, and the advection vectors were estimated with
 the optical flow algorithm used in the nowcasts (section 2.3.1 Lucas & Kanade, 1981). The same method
 was applied to accumulate the QPE data sets to a 15-min resolution.
 2.3. Experimental Setup
 2.3.1. Nowcasts for 12 Summer Days
 Nowcasts were made with the rainfall estimates for the 12 summer days in 2011 (see section 2.1). Summer
 is an important period from an early warning perspective in the Netherlands, because rainfall intensities
 are relatively high. The rainfall estimation technique from CMLs also performs well during this period
 (Overeem et al., 2016b), which makes the selected period an ideal test case for summer or high-intensity
 rainfall nowcasting.
 Probabilistic nowcasts with 20 ensemble members and a forecast horizon of 3 hr were made with pySTEPS
 (v1.1.1 Pulkkinen et al., 2019) at the temporal resolution of the input data (5 min for radar and 15 min
 for CML). pySTEPS is a state-of-the-art probabilistic nowcasting framework, which has the advantage of

IMHOFF ET AL. 3 of 10

Geophysical Research Letters 10.1029/2020GL089365

 being open-source. It has a modular nowcasting framework and is based on S-PROG (Seed, 2003) and
 STEPS (Bowler et al., 2006; Seed et al., 2013). We used the same pySTEPS setup as Imhoff et al. (2020):
 the Lucas-Kanade optical flow method (Lucas & Kanade, 1981) using the QPE from t−3 to t, a backward
 semi-Lagrangian advection method (Germann & Zawadzki, 2002), and the STEPS nowcasting procedure
 with a nonparametric noise method (Bowler et al., 2006; Seed et al., 2013). See Imhoff et al. (2020) for
 the performance of this setup under different circumstances for a large sample of rainfall events in the
 Netherlands.
 2.3.2. Verification Metrics
 To assess the nowcast skill, A-Rad (the reference) was regarded as “truth.” Only pixels over land were con-
 sidered when calculating the verification metrics, because both the CML and A-Rad data are limited to the
 land surface. Two verification methods were applied to every (15-min) forecast in the 12 events and to every
 separate ensemble member.
 A spatial assessment took place with the Critical Success Index (CSI Schaefer, 1990). The CSI gives the
 fraction of forecasts that correctly exceed a predefined threshold over the total number of hits, misses, and
 false alarms in all forecasts. For a perfect forecast, CSI is equal to 1. Here, we calculated the CSI with the
 forecast rainfall sum during the first hour after the nowcasts were issued (with advection correction applied
 for the accumulations) for two thresholds: 1.0 and 5.0 mm. Higher sums would be of interest for application
 in (sub-)tropical regions, but these were hardly present in the events (Figure S1).
 Overeem et al. (2016b) show that the CML QPE is generally better represented on a coarser resolution than
 1 km2 , and we expect the same for the QPF. This holds for most forecasts, particularly due to the mislocation
 of rainfall fields at the highest resolution (e.g., Mittermaier, 2006). To assess and compare the nowcast-
 ing skill over successively larger aggregation scales, we used the Fractions Skill Score (FSS), which uses a
 fractions-based Brier score (Jolliffe & Stephenson, 2012; Roberts & Lean, 2008). Fractions are the number of
 threshold exceedances in a square of a given size. When the size increases, mislocation of rainfall becomes
 less important. The metric ranges from 0 to 1, with 1 corresponding to a perfect forecast. The minimum
 upscaling resolution to attain a skillful forecast is reached when the FSS exceeds the random forecast skill

 (= 0.5 + 20 , with f 0 the observed fractional rainfall coverage exceeding the threshold at t = 0). As for the
 CSI, the FSS was calculated for two intensity thresholds (1.0 and 5.0 mm/hr) and three lead times (15, 30,
 and 60 min) with forecast rainfall amounts accumulated up to that lead time.

 3. Results
 3.1. Comparing Nowcasts for One Event
 We initially focus on the squall line passing from southwest to northeast on 10 September 2011 (Figure 1a,
 Movie S1 and S2), which, because of the convective character and high rainfall sum, is more exemplary of
 events for other climates than the Dutch temperate maritime climate. For this event, the CML QPE resem-
 bles the radar-based products (Figure 1a), but despite similarities in the larger-scale rainfall fields, the CML
 QPE generally misses the fine-scale precipitation features present in the QPE of A-Rad (the reference) and
 U-Rad. This is a result of the lower and irregular link coverage (on average 0.22 km/km2 for the 12 events;
 Figure 1b), whereas the radars cover every 1 km2 . The interpolation of the CML data to a 1-km grid results
 in a more smoothed display of specifically the convective cells. Rainfall volumes, however, are underesti-
 mated by the U-Rad QPE (on average 61% lower for these time intervals), whereas the volumes from the
 CML QPE are closer to the reference data for this event (4% lower).
 These differences in the QPE affect the nowcasts indicated in Figure 1, which shows the fraction of ensemble
 members that exceed a threshold of (c) 1.0 and (d) 5.0 mm/hr. Compared to A-Rad (blue contours) and for a
 rainfall intensity of 1.0 mm/hr, the storm locations in the forecast rainfall fields from the U-Rad nowcasts are
 more accurate than those from the CML nowcasts up to at least 30 min ahead. After that forecast horizon,
 both nowcasts become more uncertain, and more rain is missed, particularly in the newly formed rainfall
 cells in the southwest.
 The perspective changes for a rainfall intensity of 5.0 mm/hr. Due to underestimations in the U-Rad QPE,
 the nowcast misses most of the observed threshold exceedances and only captures parts of the rainfall fields
 during the first 15 min. The CML nowcast still captures the higher intensities with storms that are generally
 well located up to at least 30 min ahead. For longer lead times, the forecast becomes more uncertain with
 false alarms in the west, but note that the U-Rad nowcast has no skill anymore at this point.

IMHOFF ET AL. 4 of 10
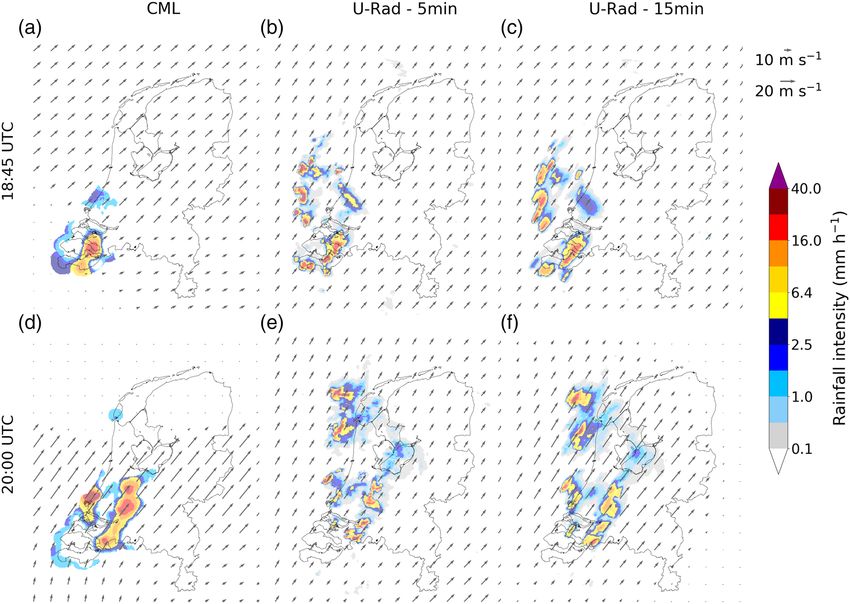
Geophysical Research Letters 10.1029/2020GL089365

Figure 2. Motion field estimates at the start of the nowcast (t = 0), derived with the Lucas-Kanade algorithm (QPE from t−3 to t used; Lucas & Kanade, 1981),
during the event on 10 September 2011, with nowcasts starting at (a–c) 18:45 UTC or (d–f) 20:00, obtained from (a and d) CML, (b and e) U-Rad with 5-min
resolution, and (c and f) U-Rad QPE when only 15-min accumulations would have been available. In contrast to Figure 1, the displayed QPE is not clipped to
the Dutch land surface.

 3.1.1. Rainfall Field Advection
 The nowcasts strongly depend on the rainfall field advection determined with the optical flow algorithm at
 the start of the nowcast (e.g., Pierce et al., 2012). The domain of the radar composite, with a radius of 200 km,
 provides rainfall estimates beyond the border of the Netherlands, resulting in a coherent motion field above
 and just outside the country (Figures 2b and 2e). As the CML data are limited to the Dutch land surface area,
 in combination with a lower and irregular data coverage, the derived motion fields show sharp transitions
 (Figures 2a and 2d). At 18:45 hr, the advection vectors are smaller in the south(west) than as derived with
 the U-Rad QPE, which is partly explained by the absence of data over sea. In addition, the interpolation
 procedure in the CML QPE derivation, based on, e.g., only eight links on the most southwesterly region
 Zeeuws-Vlaanderen, results in a stationary rainfall field where rainfall enters the southwest of the country.
 This pseudo-stationarity leads to smaller vectors in this region. A similar process takes place at 20:00 hr
 with minimal advection in the north. This is caused by the rainfall field on one of the Wadden Islands in
 the northwest, which advects in northeasterly direction, but is not observed southwest and northeast of
 the island due to the absence of links there. This apparently small difference affects the entire motion field
 estimates in the north of the domain.
 To test whether the coarser temporal resolution of the CML QPE is a limiting factor too, motion fields are
 derived with the U-Rad QPE when only 15-min accumulations (and thus a 15-min interval) would have
 been available (Figures 2c and 2f). The differences between the optical flow fields in (b) and (c) are minimal.
 At 20:00 hr, however, the motion in the central part of the Netherlands is ∼40% stronger for the 15-min reso-
 lution (f) than for the 5-min resolution (e), and similar for CML (d). In addition, the observed near-absence
 of motion around the eastern borders (Figure 2f) is caused by the radial interpolation (applied in the motion
 field derivation) of the decreasing vector sizes in easterly directions.

IMHOFF ET AL. 5 of 10
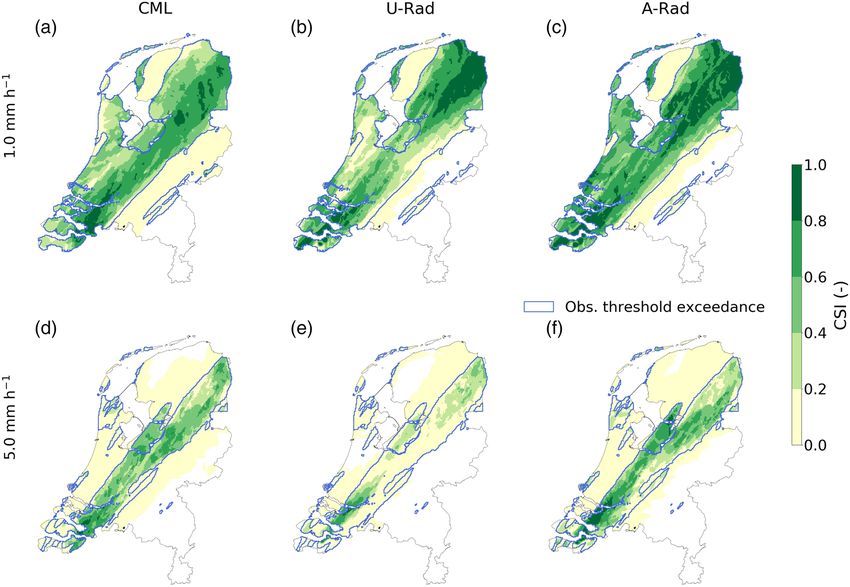
Geophysical Research Letters 10.1029/2020GL089365

Figure 3. Performance of CML and radar nowcasts. Critical Success Index (CSI) of forecast hourly rainfall sums for the land surface area of the Netherlands
during the event of 10 September 2011, using thresholds of (a–c) 1.0 or (d–f) 5.0 mm/hr, for the (a and d) CML nowcasts, (b and e) U-Rad nowcasts, and (c and
f) A-Rad nowcasts (the reference). All available nowcasts at a 15-min interval are taken into account. Blue contours indicate the threshold exceedances in the
reference (A-Rad) QPE for all considered time intervals.

 Hence, both the lower data coverage and the coarser temporal resolution of CML QPE impact the rainfall
 field advection. The lack of CML data over sea results in sharp transitions in the derived optical flow fields.
 3.1.2. Quality Assessment
 The average skill for all CML nowcasts (18:45–23:45 UTC) is comparable to the skill of the U-Rad nowcasts,
 given a 1.0-mm/hr threshold and a 1-hr accumulation time (Figures 3a and 3b). The rainfall fields moved in
 a narrow band from southwest to northeast, indicated by the blue contours (A-Rad). CSI scores outside these
 contoured regions are always lower than 0.2, as only false alarms occur there. More false alarms are present
 in the CML nowcasts than in the other nowcasts, e.g., southeast of the rainfall band, due to more misplaced
 rainfall fields (Figure 1) and differences in the estimated motion (Figure 2). Apart from the number of misses,
 CSI exceeds 0.4 in 68% (CML) and 61% (U-Rad) of the areas with observed threshold exceedances in the
 reference data. The forecasts in the northeast of the Netherlands are better for the U-Rad nowcasts (CSI
 above 0.8) than for the CML nowcasts (CSI is 0.6–0.8, and a minority over 0.8). Using the gauge-adjusted
 radar data (A-Rad) for the nowcasts (Figure 3c) leads to spatially similar nowcasts compared to the U-Rad
 nowcasts, but with much higher CSI values (generally above 0.6).
 Corresponding to Figure 1c, the performance of the U-Rad nowcasts decreases significantly for a threshold
 of 5.0 mm/hr, with CSI values below 0.4, except for small regions in the southwest and northeast (Figure 3e).
 The skill of the CML nowcasts (Figure 3d), however, remains comparable to that of the A-Rad nowcasts
 (Figure 3f). For both nowcasts, average CSI values exceed 0.6 in parts of the SW-NE oriented rainfall band,
 although both nowcasts have many false alarms outside this region and missed events in the northwest.
 To conclude, the CML nowcasts are comparable to radar rainfall nowcasts. Whereas the U-Rad nowcasts out-
 perform the CML nowcasts for a rainfall intensity of 1.0 mm/hr, the reverse holds for a 5.0-mm/hr intensity.
 Nowcasts for the other eleven events show similar behavior (Figures S2–12).

IMHOFF ET AL. 6 of 10
Geophysical Research Letters 10.1029/2020GL089365

Figure 4. Skill of the forecast rainfall accumulations at different spatial scales. Average FSS of all 15-min nowcasts for 12 events (thick lines) using three lead
times (15, 30, and 60 min, with the rainfall accumulated over these intervals up to that lead time) from the rainfall nowcasts constructed with CML data
(green), U-Rad (dark blue), and A-Rad (light blue). The FSS is calculated for two thresholds: (a) 1.0 and (b) 5.0 mm/hr. Shaded areas indicate the interquartile
ranges of the average FSS per event.

 3.2. Nowcast Verification on 12 Summer Events
 On average, these differences remain when assessing the nowcasts for all 12 events with the FSS for
 three lead times (Figure 4; forecast rainfall amounts are accumulated up to that lead time). Analogous to
 the results for 10 September 2011, the U-Rad nowcasts outperform the CML nowcasts for a threshold of
 1.0 mm/hr (Figure 4a), whereas the CML nowcasts generally have higher FSS values when a threshold of
 5.0 mm/hr is considered (Figure 4b). In all cases, the FSS is highest for the 15-min lead times. The continuous
 ranked probability score (following Hersbach, 2000) for these nowcasts, also indicates that the maximum
 skillful lead time is around 15 min at the 1-km2 scale (Figure S13).

 Both radar nowcasts are skillful at all spatial resolutions (FSS > 0.5 + 20 ) for the 1.0-mm/hr threshold, when
 the lead time is 30 min or less. This is not the case for the CML nowcasts, with FSS values in between 0.36 and
 0.46 at 1 km2 for all three lead times. Upscaling the forecast leads to skillful nowcasts, e.g., for length scales
 of 11 km or more for the 15-min lead time. Although the radar rainfall nowcasts generally approximate an
 asymptotic FSS value, e.g., after a length scale of approximately 25 km for the 15-min lead time, the CML
 nowcast skill keeps improving with increasing resolutions, even beyond the indicated 150-km length scale.
 Beside the misplacement of forecast rainfall fields, as also present in the radar nowcasts, this result can be
 explained by larger regions with a low density of CMLs and the resulting effective measurement scale of the
 CMLs, which is typically much coarser than the 1-km2 grid the data are projected on (Overeem et al., 2016b).
 For the 5.0-mm/hr threshold, only the A-Rad and CML nowcasts are skillful, and the latter only after upscal-
 ing to length scales of 50 km or more. This is supposedly an unfeasibly large upscaling resolution for most
 applications in urban areas and small catchments. Such scales are, however, important for larger-scale
 hydrological and agricultural applications.

 4. Discussion and Conclusion
 Nowcasts are increasingly used to forecast rainfall up to several hours ahead. The underlying data are com-
 monly QPEs from operational radars. In this study, we demonstrate that nowcasts can be constructed with
 country-wide rainfall maps as estimated with received signal level data from CMLs in the Netherlands.
 Probabilistic nowcasts were created with both CML and radar QPE using pySTEPS for 12 summer days
 in 2011. The CML nowcasts generally compare well to radar rainfall nowcasts. Compared to a reference

IMHOFF ET AL. 7 of 10
Geophysical Research Letters 10.1029/2020GL089365

 gauge-adjusted radar data set, we found that for low rainfall intensities, the radar rainfall nowcasts outper-
 form the CML nowcasts due to a more coherent advection field and more detailed rainfall structures in the
 QPE. Most nonbias-corrected radar QPE products underestimate rainfall volumes, however, which results
 in many misses in the forecasts of high-intensity rainfall cells. The CML QPE and resulting nowcasts gave
 more accurate rainfall volumes, making this data source suitable for real-time nowcasting of high-intensity
 rainfall events. This result could be different in the absence of a well-calibrated CML rainfall estimation
 algorithm, e.g., due to a lack of a high-quality reference, or when real-time bias-adjusted radar QPE would
 be available.
 We identify two limitations for nowcasting with CML data. First, the regionally low CML density and the
 inherent measurement scale of the CML data for longer links makes the 1-km2 resolution on which the
 data is projected, not representative of the actual measurement scale. To attain skillful forecasts, forecasts
 have to be upscaled to resolutions of 11 × 11 km2 or more for most of the considered events. This may be
 unfeasibly large for some small scale (urban) applications. Second, the rainfall advection derivation is found
 to be sensitive to the more limited data coverage of the CML data. We expect that a blended system with
 advection estimations from for instance (satellite) remotely sensed motion fields can overcome this issue.
 A coarser derivation resolution than 1 km2 also leads to have more CML information per vector, especially
 when this derivation scale depends on the local link density.
 This study analyzed summer rainfall in a temperate climate with a mixture of stratiform and convective rain-
 fall. Despite some resemblance of the higher intensity showers with rainfall from, e.g., (sub)tropical regions,
 we expect other nowcasting performances in those regions. A pilot study on CML rainfall estimation in
 Burkina Faso, Nigeria, São Paolo, and Sri Lanka successfully demonstrated the potential of this technology
 (Doumounia et al., 2014; GSMA, 2019; Rios Gaona et al., 2018). Potentially, this makes rainfall nowcasting
 feasible for areas without radar coverage but with high CML density, like developing regions. A prerequi-
 site for operational use is the real-time availability of CML data. Recent acquisition method developments
 by Chwala et al. (2016) and the project TEL4RAIN (2020) are promising in this direction. Moreover, the
 introduction of 5G cellular networks can lead to new opportunities as E-band CMLs are an essential part of
 these networks (Ericsson, 2019; Fencl et al., 2020). Provided that the nowcasts are skillful on the relevant
 spatial resolutions and lead times, CML nowcasts can provide an opportunity to reduce fatalities and eco-
 nomic loss, e.g., by improving hazardous weather and (flash-)flood early warning(s). To achieve this, the
 CML QPE and QPF need to be optimized and evaluated on data sets with a high density of CMLs covering
 entire (rainy) seasons. This is part of ongoing efforts.

 Data Availability Statement
 The archived gauge-adjusted and gauge-unadjusted radar QPE are available via https://dataplatform.
 knmi.nl/catalog/datasets/index.html?x-dataset=rad_nl25_rac_mfbs_em_5min&x-dataset-version=2.0 and
 https://doi.org/10.4121/uuid:05a7abc4-8f74-43f4-b8b1-7ed7f5629a01. The CML data can be found at
 https://doi.org/10.4121/uuid:323587ea-82b7-4cff-b123-c660424345e5, pySTEPS (v1.1.1) at https://www.
 doi.org/10.5281/zenodo.3517815, and the used pre-processing and run-scripts at https://www.doi.org/10.
 5281/zenodo.3970960.

Acknowledgments References
We would like to thank Ronald Kloeg
 Anagnostou, E. N., & Krajewski, W. F. (1999). Real-time radar rainfall estimation. Part I: Algorithm formulation. Journal of Atmospheric
and Ralph Koppelaar (T-Mobile NL)
 and Oceanic Technology, 16(2), 189–197. https://doi.org/10.1175/1520-0426(1999)0162.0.CO;2
for providing the CML data, and we
 Atlas, D., & Ulbrich, C. W. (1977). Path- and area-integrated rainfall measurement by microwave attenuation in the 13 cm band. Journal
would like to thank two anonymous
 of Applied Meteorology, 16(12), 1322–1331. https://doi.org/10.1175/1520-0450(1977)0162.0.CO;2
reviewers for their constructive
 Beekhuis, H., & Holleman, I. (2008). From pulse to product, highlights of the digital-IF upgrade of the Dutch national radar network. In
feedback and interest in our work.
 Proceedings of the Fifth European Conference on Radar in Meteorology and Hydrology (ERAD 2008), Helsinki, Finland.
This study was supported by funding
 Beekhuis, H., & Mathijssen, T. (2018). From pulse to product, highlights of the upgrade project of the Dutch national weather radar
from the DAISY2-project (European network. In L. de Vos, H. Leijnse, & R. Uijlenhoet (Eds.), 10th European Conference on Radar in Meteorology and Hydrology (ERAD
Regional Development Fund 2018): 1-6 july 2018, Ede-Wageningen, The Netherlands (pp. 960–965). Wageningen, the Netherlands: Wageningen University &
PROJ-00581). Research. https://doi.org/10.18174/454537
 Bowler, N. E., Pierce, C. E., & Seed, A. W. (2006). STEPS: A probabilistic precipitation forecasting scheme which merges an extrapolation
 nowcast with downscaled NWP. Quarterly Journal of the Royal Meteorological Society, 132(620), 2127–2155. https://doi.org/10.1256/qj.
 04.100
 Chwala, C., Gmeiner, A., Qiu, W., Hipp, S., Nienaber, D., Siart, U., et al. (2012). Precipitation observation using microwave backhaul links
 in the alpine and pre-alpine region of Southern Germany. Hydrology and Earth System Sciences, 16(8), 2647–2661. https://doi.org/10.
 5194/hess-16-2647-2012

IMHOFF ET AL. 8 of 10
Geophysical Research Letters 10.1029/2020GL089365

 Chwala, C., Keis, F., & Kunstmann, H. (2016). Real-time data acquisition of commercial microwave link networks for hydrometeorological
 applications. Atmospheric Measurement Techniques, 9(3), 991–999. https://doi.org/10.5194/amt-9-991-2016
 Chwala, C., & Kunstmann, H. (2019). Commercial microwave link networks for rainfall observation: Assessment of the current status
 and future challenges. WIREs Water, 6(2), e1337. https://doi.org/10.1002/wat2.1337
 Doumounia, A., Gosset, M., Cazenave, F., Kacou, M., & Zougmore, F. (2014). Rainfall monitoring based on microwave links from cellular
 telecommunication networks: First results from a West African test bed. Geophysical Research Letters, 41, 6016–6022. https://doi.org/
 10.1002/2014GL060724
 Ebert, E. E., Wilson, L. J., Brown, B. G., Nurmi, P., Brooks, H. E., Bally, J., & Jaeneke, M. (2004). Verification of nowcasts from the WWRP
 Sydney 2000 forecast demonstration project. Weather and Forecasting, 19(1), 73–96. https://doi.org/10.1175/1520-0434(2004)019
 2.0.CO;2
 Ericsson (2016). Ericsson microwave outlook: Trends and needs in the microwave industry. Stockholm, Sweden. https://www.ericsson.
 com/4adebb/assets/local/reports-papers/microwave-outlook/2016/ericsson-microwave-outlook-report-2016.pdf
 Ericsson (2019). Ericsson microwave outlook: Enhancing 5G with microwave. Stockholm, Sweden. https://www.ericsson.com/en/
 reports-and-papers/microwave-outlook/reports/2019
 Fencl, M., Dohnal, M., Valtr, P., Grabner, M., & Bare, V. (2020). Atmospheric observations with E-band microwave links—Challenges and
 opportunities. Atmospheric Measurement Techniques Discussions, 2020, 1–29. https://doi.org/10.5194/amt-2020-28
 Foresti, L., Reyniers, M., Seed, A., & Delobbe, L. (2016). Development and verification of a real-time stochastic precipitation nowcasting
 system for urban hydrology in Belgium. Hydrology and Earth System Sciences, 20(1), 505–527. https://doi.org/10.5194/hess-20-505-2016
 GSMA (2019). Mobile technology for rural climate resilience: The role of mobile operators in bridging the data gap. London, UK.
 https://www.gsma.com/mobilefordevelopment/wp-content/uploads/2019/10/GSMA_AgriTech_Climate_Report.pdf
 Germann, U., & Zawadzki, I. (2002). Scale-dependence of the predictability of precipitation from continental radar images. Part I:
 Description of the methodology. Monthly Weather Review, 130(12), 2859–2873. https://doi.org/10.1175/1520-0493(2002)130
 2.0.CO;2
 Gosset, M., Kunstmann, H., Zougmore, F., Cazenave, F., Leijnse, H., Uijlenhoet, R., et al. (2015). Improving rainfall measurement in
 gauge poor regions thanks to mobile telecommunication networks. Bulletin of the American Meteorological Society, 97(3), ES49–ES51.
 https://doi.org/10.1175/BAMS-D-15-00164.1
 Graf, M., Chwala, C., Polz, J., & Kunstmann, H. (2020). Rainfall estimation from a German-wide commercial microwave link network:
 Optimized processing and validation for 1 year of data. Hydrology and Earth System Sciences, 24(6), 2931–2950. https://doi.org/10.
 5194/hess-24-2931-2020
 Hersbach, H. (2000). Decomposition of the continuous ranked probability score for ensemble prediction systems. Weather and
 Forecasting, 15(5), 559–570. https://doi.org/10.1175/1520-0434(2000)0152.0.CO;2
 Hogg, D. C. (1968). Millimeter-wave communication through the atmosphere. Science, 159(3810), 39–46. https://doi.org/10.1126/science.
 159.3810.39
 Imhoff, R. O., Brauer, C. C., Overeem, A., Weerts, A. H., & Uijlenhoet, R. (2020). Spatial and temporal evaluation of radar rainfall
 nowcasting techniques on 1,533 events. Water Resources Research, 56, e2019WR026723. https://doi.org/10.1029/2019WR026723
 Ingram, K. T., Roncoli, M. C., & Kirshen, P. H. (2002). Opportunities and constraints for farmers of West Africa to use seasonal precipitation
 forecasts with Burkina Faso as a case study. Agricultural systems, 74(3), 331–349. https://doi.org/10.1016/S0308-521X(02)00044-6
 Jolliffe, I. T., & Stephenson, D. B. (2012). Forecast verification: A practitioner's guide in atmospheric science (2nd ed.). Chichester, West
 Sussex, United Kingdom: John Wiley & Sons.
 Kidd, C., Becker, A., Huffman, G. J., Muller, C. L., Joe, P., Skofronick-Jackson, G., & Kirschbaum, D. B. (2017). So, how much of the
 Earth's surface is covered by rain gauges? Bulletin of the American Meteorological Society, 98(1), 69–78. https://doi.org/10.1175/
 BAMS-D-14-00283.1
 Leijnse, H., Uijlenhoet, R., & Stricker, J. N. M. (2007). Rainfall measurement using radio links from cellular communication networks.
 Water Resources Research, 43, W03201. https://doi.org/10.1029/2006WR005631
 Leijnse, H., Uijlenhoet, R., & Stricker, J. N. M. (2008). Microwave link rainfall estimation: Effects of link length and frequency, temporal
 sampling, power resolution, and wet antenna attenuation. Advances in Water Resources, 31(11), 1481–1493. https://doi.org/10.1016/j.
 advwatres.2008.03.004
 Liguori, S., & Rico-Ramirez, M. A. (2012). Quantitative assessment of short-term rainfall forecasts from radar nowcasts and MM5
 forecasts. Hydrological Processes, 26(25), 3842–3857.
 Lorenz, C., & Kunstmann, H. (2012). The hydrological cycle in three state-of-the-art reanalyses: Intercomparison and performance
 analysis. Journal of Hydrometeorology, 13(5), 1397–1420. https://doi.org/10.1175/JHM-D-11-088.1
 Lucas, B. D., & Kanade, T. (1981). An iterative image registration technique with an application to stereo vision. In Proceedings of the 7th
 international joint conference on Artificial intelligence - Volume 2 (pp. 674–679). Vancouver, British Columbia, Canada: Morgan
 Kaufmann Publishers Inc.
 Marshall, J. S., Hitschfeld, W., & Gunn, K. L. S. (1955). Advances in radar weather. In H. E. Lansberg (Ed.), Advances in geophysics (Vol. 2,
 pp. 1–56). New York, NY: Academic Press Inc.
 Messer, H., Zinevich, A., & Alpert, P. (2006). Environmental monitoring by wireless communication networks. Science, 312(5774),
 713–713. https://doi.org/10.1126/science.1120034
 Mittermaier, M. P. (2006). Using an intensity-scale technique to assess the added benefit of high-resolution model precipitation forecasts.
 Atmospheric Science Letters, 7(2), 36–42. https://doi.org/10.1002/asl.127
 Olsen, R. L., Rogers, D. V., & Hodge, D. B. (1978). The aRb relation in the calculation of rain attenuation. IEEE Transactions on Antennas
 and Propagation, 26(2), 318–329. https://doi.org/10.1109/TAP.1978.1141845
 Overeem, A., Buishand, T. A., & Holleman, I. (2009). Extreme rainfall analysis and estimation of depth-duration-frequency curves using
 weather radar. Water Resources Research, 45, W10424. https://doi.org/10.1029/2009WR007869
 Overeem, A., Holleman, I., & Buishand, A. (2009). Derivation of a 10-year radar-based climatology of rainfall. Journal of Applied
 Meteorology and Climatology, 48, 1448–1463. https://doi.org/10.1175/2009JAMC1954.1
 Overeem, A., Leijnse, H., & Uijlenhoet, R. (2011). Measuring urban rainfall using microwave links from commercial cellular
 communication networks. Water Resources Research, 47, W12505. https://doi.org/10.1029/2010WR010350
 Overeem, A., Leijnse, H., & Uijlenhoet, R. (2013). Country-wide rainfall maps from cellular communication networks. Proceedings of the
 National Academy of Sciences, 110(8), 2741–2745.
 Overeem, A., Leijnse, H., & Uijlenhoet, R. (2016a). Retrieval algorithm for rainfall mapping from microwave links in a cellular
 communication network. Atmospheric Measurement Techniques, 9(5), 2425–2444. https://doi.org/10.5194/amt-9-2425-2016

IMHOFF ET AL. 9 of 10
Geophysical Research Letters 10.1029/2020GL089365

 Overeem, A., Leijnse, H., & Uijlenhoet, R. (2016b). Two and a half years of country-wide rainfall maps using radio links from commercial
 cellular telecommunication networks. Water Resources Research, 52, 8039–8065. https://doi.org/10.1002/2016WR019412
 Pappenberger, F., Cloke, H. L., Parker, D. J., Wetterhall, F., Richardson, D. S., & Thielen, J. (2015). The monetary benefit of early flood
 warnings in Europe. Environmental Science & Policy, 51, 278–291. https://doi.org/10.1016/j.envsci.2015.04.016
 Pierce, C., Seed, A., Ballard, S., Simonin, D., & Li, Z. (2012). Nowcasting. Doppler radar observations—Weather radar, wind profiler,
 ionospheric radar, and other advanced applications, IntechOpen.
 Pulkkinen, S., Nerini, D., Pérez Hortal, A. A., Velasco-Forero, C., Seed, A., Germann, U., & Foresti, L. (2019). Pysteps: an open-source
 Python library for probabilistic precipitation nowcasting (v1.0). Geoscientific Model Development, 12(10), 4185–4219. https://doi.org/10.
 5194/gmd-12-4185-2019
 Rayitsfeld, A., Samuels, R., Zinevich, A., Hadar, U., & Alpert, P. (2012). Comparison of two methodologies for long term rainfall
 monitoring using a commercial microwave communication system. Atmospheric research, 104, 119–127. https://doi.org/10.1016/j.
 atmosres.2011.08.011
 Rios Gaona, M. F., Overeem, A., Leijnse, H., & Uijlenhoet, R. (2015). Measurement and interpolation uncertainties in rainfall maps from
 cellular communication networks. Hydrology and Earth System Sciences, 19(8), 3571–3584. https://doi.org/10.5194/hess-19-3571-2015
 Rios Gaona, M. F., Overeem, A., Raupach, T. H., Leijnse, H., & Uijlenhoet, R. (2018). Rainfall retrieval with commercial microwave links
 in Sao Paulo, Brazil. Atmospheric Measurement Techniques, 11(7), 4465–4476. https://doi.org/10.5194/amt-11-4465-2018
 Roberts, N. M., & Lean, H. W. (2008). Scale-selective verification of rainfall accumulations from high-resolution forecasts of convective
 events. Monthly Weather Review, 136(1), 78–97. https://doi.org/10.1175/2007MWR2123.1
 Saltikoff, E., Friedrich, K., Soderholm, J., Lengfeld, K., Nelson, B., Becker, A., et al. (2019). An overview of using weather radar for
 climatological studies: Successes, challenges, and potential. Bulletin of the American Meteorological Society, 100(9), 1739–1752. https://
 doi.org/10.1175/BAMS-D-18-0166.1
 Schaefer, J. T. (1990). The Critical Success Index as an indicator of warning skill. Weather and Forecasting, 5(4), 570–575.
 https://doi.org/10.1175/1520-0434(1990)0052.0.CO;2
 Seed, A. W. (2003). A dynamic and spatial scaling approach to advection forecasting. Journal of Applied Meteorology, 42(3), 381–388.
 https://doi.org/10.1175/1520-0450(2003)0422.0.CO;2
 Seed, A. W., Pierce, C. E., & Norman, K. (2013). Formulation and evaluation of a scale decomposition-based stochastic precipitation
 nowcast scheme. Water Resources Research, 49, 6624–6641. https://doi.org/10.1002/wrcr.20536
 TEL4RAIN (2020). About TEL4RAIN. Prague, Czech Republic. http://www.tel4rain.cz/tel4rain-about-eng.php, Retrieved on 2020-09-02.
 Thorndahl, S., Einfalt, T., Willems, P., Ellerbæk Nielsen, J., Ten Veldhuis, M.-C., Arnbjerg-Nielsen, K., et al. (2017). Weather radar rainfall
 data in urban hydrology. Hydrology and Earth System Sciences, 21(3), 1359–1380. https://doi.org/10.5194/hess-21-1359-2017
 Uijlenhoet, R., Overeem, A., & Leijnse, H. (2018). Opportunistic remote sensing of rainfall using microwave links from cellular
 communication networks. WIREs Water, 5(4), e1289. https://doi.org/10.1002/wat2.1289
 Van de Beek, C. Z., Leijnse, H., Torfs, P. J. J. F., & Uijlenhoet, R. (2012). Seasonal semi-variance of Dutch rainfall at hourly to daily scales.
 Advances in Water Resources, 45, 76–85. https://doi.org/10.1016/j.advwatres.2012.03.023
 Wilson, J. W., Feng, Y., Chen, M., & Roberts, R. D. (2010). Nowcasting challenges during the Beijing Olympics: Successes, failures, and
 implications for future nowcasting systems. Weather and Forecasting, 25(6), 1691–1714. https://doi.org/10.1175/2010WAF2222417.1
 World Meteorological Organization (2020). WMO Radar Database. https://wrd.mgm.gov.tr/Home/Wrd
 Zinevich, A., Messer, H., & Alpert, P. (2009). Frontal rainfall observation by a commercial microwave communication network. Journal of
 Applied Meteorology and Climatology, 48(7), 1317–1334. https://doi.org/10.1175/2008JAMC2014.1

IMHOFF ET AL. 10 of 10
You can also read