Ethnicity-dependent allele frequencies are correlated with COVID-19 case fatality rate
←
→
Page content transcription
If your browser does not render page correctly, please read the page content below
Ethnicity-dependent allele frequencies are
correlated with COVID-19 case fatality rate
Sungwon Jeon
 Korean Genomics Center (KOGIC), Ulsan National Institute of Science and Technology (UNIST), Ulsan,
44919, Republic of Korea https://orcid.org/0000-0002-2729-9087
Asta Blazyte
 Korean Genomics Center (KOGIC), Ulsan National Institute of Science and Technology (UNIST), Ulsan,
44919, Republic of Korea https://orcid.org/0000-0001-7309-1482
Changhan Yoon
 Korean Genomics Center (KOGIC), Ulsan National Institute of Science and Technology (UNIST), Ulsan,
44919, Republic of Korea https://orcid.org/0000-0003-0243-9853
Hyojung Ryu
 Korean Genomics Center (KOGIC), Ulsan National Institute of Science and Technology (UNIST), Ulsan,
44919, Republic of Korea https://orcid.org/0000-0002-2276-850X
Yeonsu Jeon
 Korean Genomics Center (KOGIC), Ulsan National Institute of Science and Technology (UNIST), Ulsan,
44919, Republic of Korea https://orcid.org/0000-0003-4560-4142
Youngjune Bhak
 Korean Genomics Center (KOGIC), Ulsan National Institute of Science and Technology (UNIST), Ulsan,
44919, Republic of Korea https://orcid.org/0000-0002-9273-6984
Dan Bolser
 Geromics Ltd., 222 Mill Road, Cambridge, CB1 3NF, United Kingdom https://orcid.org/0000-0002-3991-
0859
Andrea Manica
 Department of Zoology, University of Cambridge, Downing Street, Cambridge, CB2 3EJ, United Kingdom
 https://orcid.org/0000-0003-1895-450X
Eun-Seok Shin
 Division of Cardiology, Department of Internal Medicine, Ulsan Medical Center, Ulsan, 44686, Republic of
Korea https://orcid.org/0000-0002-9169-6968
Yun Sung Cho
 Clinomics Inc., Ulsan, 44919, Republic of Korea https://orcid.org/0000-0003-4490-8769
Byung Chul Kim
 Clinomics Inc., Ulsan, 44919, Republic of Korea https://orcid.org/0000-0002-4891-9679
Namhee Ryoo

                                                Page 1/16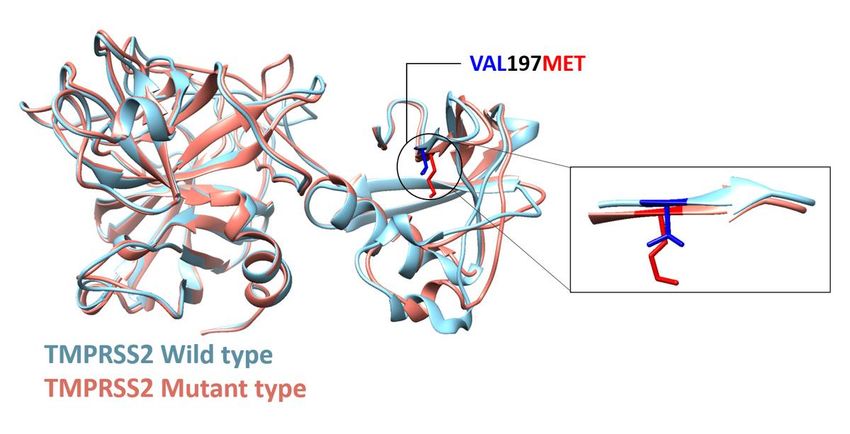
Department of Laboratory Medicine, Keimyung University School of Medicine https://orcid.org/0000-
0001-8383-709X
Jong Bhak ( jongbhak@genomics.org )
Korean Genomics Center (KOGIC), Ulsan National Institute of Science and Technology (UNIST), Ulsan,
44919, Republic of Korea https://orcid.org/0000-0002-4228-1299
Research Article
Keywords: COVID-19, Population Genomics, TMPRSS2, Case Fatality Rate, rs12329760, rs75603675
DOI: https://doi.org/10.21203/rs.3.rs-37798/v1
License: This work is licensed under a Creative Commons Attribution 4.0 International License.
Read Full License
Page 2/16Abstract
Coronavirus disease (COVID-19), caused by SARS-CoV-2, has a higher case fatality rate (CFR) in
European ethnic groups than in others, especially East Asians. One explanation to this phenomenon
might be TMPRSS2, a key processing enzyme essential for viral infection. Here, we analyzed the allele
frequencies of two nonsynonymous variants rs12329760 (V197M) and rs75603675 (G8V) in the
TMPRSS2 gene using over 200,000 present-day and ancient genomic samples. We found a signi cant
association between the CFR of COVID-19 and the allele frequencies of the two variants. Interestingly,
they had opposing effects on the CFR: inverse correlation by V197, proportional correlation by G8V. East
Asians have higher V197M and lower G8V allele frequencies than Europeans, possibly endowing
resistance against SARS-CoV-2. Structural and energy calculation analysis of the V197M amino acid
change showed that it destabilizes the TMPRSS2 protein, possibly affecting its ACE2 and viral spike
protein processing negatively, ultimately resulting in reduced SARS-CoV-2 infection e ciency and CFR in
East Asian ethnic groups.
Introduction
Coronavirus disease (COVID–19) is an infectious disease caused by severe acute respiratory syndrome
coronavirus 2 (SARS-CoV–2). Appearing rst during late 2019 in Wuhan, China, COVID–19 has spread
rapidly worldwide1. As of May 23, 2020, SARS-CoV–2 has infected >5 million people in over 200
countries, killing more than 330,000 people2. Europe has been particularly affected, with Spain and Italy
each reaching over 200,000 cases of infection and more than 27,000 deaths, resulting in a maximum
case fatality rate (CFR) of >10%2. In contrast, East Asia did not experience such dire effects, with South
Korea, for instance, reporting a peak CFR of 2.4%2. Multiple contributing factors could explain this
difference, including timing and severity of lockdown measures3, population age ratio4, healthcare
resource availability5, smoking rate6,7, and early tuberculosis (Bacillus Calmette–Guérin) vaccination8–10.
In principle, genetic factors may also underpin differential susceptibility to SARS-CoV–211–13.
Genes encoding cellular serine proteaseTMPRSS2),, angiotensin-converting enzyme 2 (ACE2),, cysteine
proteases cathepsin B and cathepsin L (CatB, CatL),, phosphatidylinositol 3-phosphate 5-kinase
(PIKfyve),, and two pore channel subtype 2 (TPC2) are notable for their critical roles in SARS-CoV–2
infection14,15. Particularly, the virus utilizes TMPRSS2 and CatB/L proteolytic activity for priming the viral
spike protein, whereas ACE2 is the entry receptor for breaking into host cells14,15. A study has suggested
TMPRSS2 inhibition as a clinical target because the priming step is a key factor determining successful
entry into target cells15. Not only do TMPRSS2 variants appear to have wide population-speci c
variation16, but, TMPRSS2 also has low mutation burden in certain populations, a characteristic that
could partially explain high TMPRSS2 gene expression. Consequently, the latter is associated with a poor
outcome in COVID–1916.
Page 3/16To understand the genetic background of complex phenotypes in human populations, researchers
commonly assess correlations with allele frequency (AF)16,17. This approach has identi ed a correlation
between ancestral genetic composition and the CFR of COVID–1917. However, few have examined
speci c variants, their frequencies and individual contributions to SARS-CoV–2 susceptibility. Some
reports are also based only on low-resolution intercontinental comparisons between Europeans and East
Asians16–18. Moreover, we know little about the evolutionary history of SARS-CoV–2 susceptibility-
associated variants, including when they occurred or how their frequencies might have changed over
time.
In this study, we investigated intercountry AF differences of TMPRSS2 variants, estimated variant effects
on TMPRSS2 protein structure stability, and linked them to the average of time-adjusted COVID–19 CFR
(AT-CFR). We propose that the structural deviation causes TMPRSS2 to be less stable, resulting in a
reduced overall infection rate that led to reduced CFR in East Asians. We collected and analyzed 221,498
genomes from public databases19–21 and 2,262 whole genomes from the Korean Genome Project22. We
also traced TMPRSS2 AF distribution in ancient populations by region and time period. We aimed to
increase the current understanding of the genetic variation underlying SARS-CoV–2 infections and
explain the ethnic differences in CFR.
Results
Correlation of nonsynonymous TMPRSS2 allele frequencies with
COVID–19 AT-CFR
The AFs of two nonsynonymous TMPRSS2 variants (G8V, rs75603675; V197M, rs12329760) were
signi cantly correlated with COVID–19 AT-CFR (Spearman’s correlation ρ = 0.713, P = 0.00183 for G8V
and ρ = –0.464, P = 0.0157 for V197M, Fig. 1a and b). The results are based on AF data from 17 and 27
countries, respectively (see Methods). However, the AFs of the two variants were not signi cantly
correlated with total COVID–19 cases per million individuals (V197M: P = 0.132, G8V: P = 0.165;
Supplementary Fig. 1). These two nonsynonymous variants were present among 20 TMPRSS2 exonic
variants with global AF of >1% from gnomAD 23. Thirteen of these were in 3′ UTR and ve were
synonymous (Supplementary Fig. 2, Supplementary Data 1). G8V is located in a cytoplasmic domain
with an undetermined 3D structure (Supplementary Fig. 3). V197M is located in a stable beta-sheet of the
scavenger receptor cysteine-rich (SRCR) domain (Supplementary Fig. 3).
Correlation between TMPRSS2 V197M allele frequency and COVID–
19 AT-CFR
The AF of V197M was negatively correlated with COVID–19 AT-CFR (Spearman’s correlation coe cient, ρ
= –0.464, P = 0.0157) (Fig. 1a). The AF distribution pattern was consistent with previous reports, with
V197M AF being signi cantly lower in most Europeans than in East Asians16 (Fig. 1a and c
Page 4/16Supplementary Fig. 4a, Supplementary Data 2). In Chinese, Japanese, and Koreans, AF was 34.5%, 38.8%,
and 36.8%, respectively (Supplementary Data 3). Among Europeans, the Finnish were a surprising outlier,
with 37.3% AF (versus 19.9% in Italians, 17.8% in Spanish, and 22.6% in British) that corresponded to a
low AT-CFR (Fig. 1a). Finnish AF differed only from the Chinese population among East Asians (P =
3.61×10⁻³, Supplementary Fig. 4a, Supplementary Data 2). West Asians have AF that are similar to or
lower than Europeans (Turkey 17.1%, Israel 13.2%). Latin Americans in general exhibited the lowest AFs,
ranging from 18.8% in Columbia to 6.5% in Peru (Supplementary Data 3). Peruvian AF differed from all
other countries except Mexico and Algeria (Supplementary Fig. 4a, Supplementary Data 2). We also
found that V197M occurred in an extremely well-conserved position (phastCons17way_primate: 0.958,
Supplementary Data 4) of the SRCR domain, suggesting that it is under purifying selection. Moreover,
functional prediction tools SIFT24 and PolyPhen225 regarded the variant as “deleterious” and “probably
damaging”, respectively (Supplementary Data 4).
TMPRSS2 V197M variant in ancient genomes
The V197M variant is absent in the great apes26,27 and in all sequenced archaic hominin genomes
(Denisovan, Neanderthal). However, Tianyuan man’s genotype showed that the variant was already
present in humans 40,000 years ago in East Asia (Supplementary Data 5, Supplementary Data 6). We
also found V197M in ancient genomes I7021 and I13180 from Mongolia, dated 5,211–5,000 BCE and
3,013–2,876 BCE, respectively (Supplementary Data 7). Starting from the pre-Ice Age (34,000–26,000
years ago), the variant was present in European inhabitants (37,250 BCE sample GoyetQ116–1 from
Belgium28) and remained ever since (Supplementary Data 7, Supplementary Fig. 5). Although small
sample sizes precluded statistical analysis, V197M AF appeared to be higher in ancient East Asian
populations (33.3%) than in ancient Europeans (16.3%) (Supplementary Data 6, Supplementary Data 7,
Supplementary Fig. 5).
Effect of V197M variant on TMPRSS2 protein structure
We used 3D protein models to investigate the effect of V197M on TMPRSS2. V197M increased energy
scores (dDFIRE29, nDOPE30) more than wild type (Table 1), suggesting reduced stability. We used two
homology modeling tools (Robetta31, I-TASSER32) (Fig. 2) and transmembrane serine protease hepsin
(PDB ID 1Z8G chain A)33 as the template (Supplementary Fig. 6). The resultant model contains both
SRCR and nearby peptidase S1 domains of TMPRSS2 (Fig. 2) because the former was too small for
modeling. Despite only minor structural changes to the SRCR domain (Fig. 2), V197M had a consistently
destabilizing effect in TMPRSS2 (Table 1). A further indication of reduced stability in mutants was a
decrease in the favored region of the Ramachandran plot. Seven computational protein-stability
prediction tools con rmed the V197M variant as destabilizing (Supplementary Data 8).
Correlation between TMPRSS2 G8V variant AF and COVID–19 CFR
Page 5/16Unlike V197M, G8V was positively correlated with COVID–19 AT-CFR (Fig. 1b, Spearman’s correlation
coe cient, ρ = 0.713, P = 0.00183), indicating that it is a risk variant, rather than a protective one. Its
frequency distribution formed Asian and non-Asian clusters (Fig. 1d). G8V frequencies were signi cantly
higher in Europeans (Italians 41.6%, Spanish 31.1%, British 28.1%) than in East Asians (Chinese 9.4%,
Singapore 9.1%, South Korea 1.0%, Japan 1.4%) or Latin Americans (Mexico 12.9%, Peru 6.5%) (Fig. 1d,
Supplementary Fig. 4b, Supplementary Data 3, Supplementary Data 9). Koreans had the lowest G8V AF in
the whole dataset, differing signi cantly from all 16 other countries spanning eight different regions (Fig.
1d). Nigerians had a variant frequency (36.0%) more similar to Europeans, while South Asian frequency
(Pakistan 22.8%, Bangladesh 22.7%) fell between European and East Asian values (Supplementary Data
3). G8V occurred in a far less conserved region (phastCons17way_primate: 0.002, Supplementary Data 4)
than V197M, and neither SIFT nor PolyPhen2 recognized it as functionally damaging (Supplementary
Data 4). We also found G8V in both Denisovan and Neanderthal samples, but not in extant great apes
(Supplementary Data 5, Supplementary Data 6). For modern humans, the earliest G8V occurrence was in
a 45,000-year-old genome (Ust’Ishim) from Western Siberia34 (Supplementary Data 10).
Discussion
This study has limitations. First, we only used public genome databases and variant frequency data that
are not directly linked to COVID–19 patients and CFR. Furthermore, we could not completely normalize
AT-CFR with relevant covariates, such as lockdown measures, mask availability, medical care standards,
within-population or within-fatal-case age ratios, and SARS-CoV–2 test availability. However, we tested
the Spearman’s correlation between AT-CFR and thirteen socio-economic variables such as population
density and Gross Domestic Product (GDP) per capita in a pairwise manner and found that only the
proportion of the elderly (65 years and older) and the proportion of female smokers had signi cantly
positive correlations (Supplementary Fig. 7). Another limitation is the lack of variant frequency data on
chromosome X, absent from many public databases such as PGG.SNV, even though the X chromosome
contains a key player, ACE214,15. Notably, our protein structure modeling showed that TMPRSS2 and the
template had a low sequence identity (32.49%). However, we con rmed that the V197M variant region of
SRCR remained extremely consistent (Supplementary Fig. 6). Furthermore, ancient G8V data relied on
sparse whole-genome-sequencing resources originating mainly from Europe and Russia, dated 2,000–1
BCE (Supplementary Data 9); these turned out too small to be conclusive. Finally, base-calling processing
biases (e.g., haplodized ancient genome sequences) are a distinct possibility.
A previous report has noted that Europeans have signi cantly lower V197M AF than East Asians, a
pattern speculated to be associated with COVID–19 CFR16. In contrast, G8V has not been linked to
ethnicity-relevant SARS-CoV–2 susceptibility or COVID–19 outcomes until this study. Although we
observed a signi cant correlation between the AFs of these two TMPRSS2 variants and AT-CFR (Fig. 1),
correlations between AFs and infection cases (per million) were non-signi cant (Spearman’s correlation
V197M: P = 0.132; G8V: P = 0.165) (Supplementary Fig. 1). One likely explanation is that infection cases
are a more complex parameter than CFR. Alternatively, CFR in infectious diseases may re ect the
Page 6/16importance of genetic factors more than infection rate35. To verify this hypothesis, however, we require
further studies investigating genomes, infection, treatment, and CFR data of COVID–19 patients.
Our evaluation of protein structural stability predicted that V197M destabilizes TMPRSS2 (Table 1,
Supplementary Data 8). Unfortunately, we could not perform the same analysis on G8V because we
lacked a homology modeling template. Our evidence (evolutionary conservation, protein domains) is
insu cient to ascertain that G8V signi cantly affects TMPRSS2 protein structure and overall SARS-CoV–
2 infection. However, one report has indicated that G8V affects residue torsion angles36. The resultant
exibility reduction is more likely to affect TMPRSS2 interactions with ACE2 and the SARS-CoV–2 spike
protein36. We suspect V197M and G8V variants to be related to the overall TMPRSS2 gene expression,
however, we could not validate it.
In line with previous reports, we suggest that V197M acts to indirectly compromise the binding a nity of
TMPRSS2 to SARS-CoV–2 spike protein and ACE235–37. This implies a protective role of the V197M
variant against SARS-CoV–2 infections, but neither we nor previous researchers36–38 have uncovered any
clear evidence or explanation for causation. Interestingly, the change from valine to methionine has a
Grantham distance matrix value of only 22, the shortest distance from valine to any amino acid. Thus,
V197M may lie on a thin boundary of extreme conservation versus functional bene t that may have
arisen through viral invasion and polymorphisms in different ethnic groups that caused 3D structural
deviation. We speculate that East Asians have already experienced similar viral infections in the past,
leading to natural selection on V197M and G8V in TMPRSS2. Since V197M could have a synergistic or
antagonistic effect with G8V and variants in other proteins, it perhaps accounts for only a fraction of
resistance against SARS-CoV–2. Nevertheless, our CFR and genetic AF correlation study suggests that
East Asian ethnic groups may have some genetic resistance that is re ected in the 3D structure of
TMPRSS2 that negatively affects infection e ciency and hence the CFR of COVID–19.
Methods
Variant selection and data collection
Autosomal nonsynonymous variants located in TMPRSS2 were extracted from Korea2K variome set (n =
2,262) from the Korean Genome Project22, which turned out to contain 15 SNVs. Alternative AFs of other
populations were obtained from the PGG.SNV database (GRCh38) (n = 220,147)19, Italian Genome
Reference Panel (IGRP1.0) (n = 926)20, and Lithuanian high density SNP data (n = 425)21. IGRP1.0 and
Lithuanian genomes were lifted over to hg38 coordinates in Picard version 2.22.339, using LiftoverVcf
with default options. The combined dataset included 223,760 samples from 4 variome databases with
whole-genome sequencing, exome sequencing, or genotyping chip data (Supplementary Data 11). Allele
counts were merged based on country of sample origin. Populations were excluded if they could not be
assigned to any speci c country, if fewer than 2,500 reported COVID–19 cases were present, or when CFR
information was unavailable. Nonsynonymous variants were included only if they were present in >10
Page 7/16countries and had a global AF of >5%. The nal dataset used to calculate AF and CFR correlations
contained 69,168 samples (from 27 countries) for TMPRSS2 V197M and 16,562 samples (from 17
countries)for TMPRSS2 G8V.
Correlation with average of T-CFR
We downloaded COVID–19 data set on May 21, 2020 from Our World in Data
(https://github.com/owid/covid–19-data/tree/master/public/data). We employed the equation from
Daneshkhah et. al40, to calculated average of T-CFR (Equation 1).
Where N is the number of days which showed < 2,500 con rmed cases on each country, an is a weight of
T-CFR on day n, T-CFRnis T-CFR on day n, ci is the number of con rmed cases at day i.
Spearman’s correlation test was conducted between AF and the average of T-CFR in R version 3.5.1.
Variant annotation
Variants were annotated in VEP version 99.241 with dbNSFP version 3.042 to evaluate deleteriousness
and conservation. Additionally, phastCons scores were obtained for primates, mammals, and vertebrates
to determine interspeci c conservation of signi cant variant sites.
TMPRSS2 protein structure modelling and variant effects on the
protein structure
We built a TMPRSS2 model using hepsin (1Z8G) as the template structure. The model was selected
using PSI-BLAST sequence search43, along with alignment from NCBI. Two sets of TMPRSS2 models
were generated using the Robetta web server31 and I-TASSER32: a wild-type TMPRSS2 model based on
1Z8G and a V197M mutant model based on the wild-type one. Valine of residue 65 of 1Z8G was also
substituted with methionine to generate mutant type. Protein energies of wild-type and variant models
were compared in dDFIRE29 and nDOPE30 to determine structural stability (details in Supplementary
Method). Ramachandran favorable regions were measured through MolProbity44. The following tools
were used to predict variation in TMPRSS2 protein stability for both wild-type and mutant-type models:
PoPMuSiC45, CUPSAT46, I-Mutant347, DUET48, mCSM49, SDM50, MuPro51. Visualizations were created in
UCSF Chimera52.
Page 8/16Ancient genome allele frequency analysis
Ancient genomes were downloaded from the David Reich Lab (https://reich.hms.harvard.edu/datasets;
see Supplementary Data 7, Supplementary Data 10). Additional ancient European data for V197M
(rs12329760) were obtained from the PGG.SNV database. Because the Reich Lab data did not cover G8V
(rs75603675), only sample data from PGG.SNV was used for this variant. Data format conversion was
handled using PLINK version 1.953. Presence of the two variants was veri ed and their frequencies
calculated in different ancient populations (see Supplementary Data 7, Supplementary Data 10,
Supplementary Data 12). Temporal variation in AF was visualized using the ggplot2 package in R.
Declarations
Data Availability
All data generated or analyzed during this study are included in this published article and its
supplementary information les. For the Korea2K variome set, the allele counts of the two TMPRSS2
variants are available in supplementary data les. Detailed information about the Korea2K variome and
request procedure can be found at http://koreangenome.org.
Author Contributions
S.J., C.Y., A.B., H.R. and J.B. designed and conceptualized this study. S.J., C.Y., H.R., A.B., and Y.B.
conducted the data analysis and acquisition. S.J., C.Y., H.R., and A.B. performed the data visualization.
A.B., S.J., C.Y., H.R., D.B., and J.B. wrote the manuscript. J.B., A.B., S.J., C.Y., H.R., D.B., Y.B., Y.J., A.M., E.-
S.S., Y.S.C., N.R., and B.C.K. contributed to the manuscript editing process and critical revisions. All
authors read and approved the nalized manuscript.
Acknowledgements
This study was a part of Korean Genome Project (KGP) and was approved by the Institutional Review
Board (IRB) of the Ulsan National Institute of Science and Technology (UNISTIRB-15-19-A, UNISTIRB-16-
13-C). This work was supported by the Research Project Funded by Ulsan City Research Fund
(1.200047.01) of UNIST. We thank Dr. Seung Gu Park for advising the data visualization and Jasmin
Junseo Lee for editing grammatical errors.
Additional Information
Competing Interests
The authors declare the following competing interests: Y.S.C is an employee and B.C.K. and J.B. are the
CEOs of Clinomics Inc. Y.S.C., B.C.K., and J.B. have an equity interest in the company. D.B. is an employee
and J.B. is the CEO of Geromics Ltd. The rest of the authors declare they have no competing interests.
Page 9/16References
1. Lai, C.C., Shih, T.P., Ko, W.C., Tang, H.J. & Hsueh, P.R. Severe acute respiratory syndrome coronavirus 2
(SARS-CoV-2) and coronavirus disease-2019 (COVID-19): The epidemic and the challenges. Int J
Antimicrob Agents 55, 105924 (2020).
2. European Centre for Disease Prevention and Control, https://www.ecdc.europa.eu/en. (2020).
3. Sonn, J.W., Kang, M. & Choi, Y. Smart city technologies for pandemic control without lockdown.
International Journal of Urban Sciences, 1-3 (2020).
4. Dowd, J.B. et al. Demographic science aids in understanding the spread and fatality rates of COVID-
19. Preprint at https://www.medrxiv.org/content/10.1101/2020.03.15.20036293v2 (2020).
5. Ji, Y., Ma, Z., Peppelenbosch, M.P. & Pan, Q. Potential association between COVID-19 mortality and
health-care resource availability. The Lancet Global Health 8(2020).
6. Cai, H. Sex difference and smoking predisposition in patients with COVID-19. The Lancet Respiratory
Medicine 8(2020).
7. Cai, G. Bulk and single-cell transcriptomics identify tobacco-use disparity in lung gene expression of
ACE2, the receptor of 2019-nCov. Preprint at
https://www.medrxiv.org/content/10.1101/2020.02.05.20020107v3 (2020).
8. Redelman-Sidi, G. Could BCG be used to protect against COVID-19? Nat Rev Urol (2020).
9. Miller, A. et al. Correlation between universal BCG vaccination policy and reduced morbidity and
mortality for COVID-19: an epidemiological study. Preprint at
https://www.medrxiv.org/content/10.1101/2020.03.24.20042937v1 (2020).
10. Hussein, N.R. Possible Factors Associated with Low Case Fatality Rate of COVID-19 in Kurdistan
Region, Iraq. Journal of Kermanshah University of Medical Sciences 24(2020).
11. Williams, F.M.K. et al. Self-reported symptoms of covid-19 including symptoms most predictive of
SARS-CoV-2 infection, are heritable. Preprint at
https://www.medrxiv.org/content/10.1101/2020.04.22.20072124v2 (2020).
12. Yuan, F.F. et al. In uence of HLA gene polymorphisms on susceptibility and outcome post infection
with the SARS-CoV virus. Virol Sin 29, 128-30 (2014).
13. Cao, Y. et al. Comparative genetic analysis of the novel coronavirus (2019-nCoV/SARS-CoV-2)
receptor ACE2 in different populations. Cell Discov 6, 11 (2020).
14. Ou, X. et al. Characterization of spike glycoprotein of SARS-CoV-2 on virus entry and its immune
cross-reactivity with SARS-CoV. Nat Commun 11, 1620 (2020).
15. Hoffmann, M. et al. SARS-CoV-2 Cell Entry Depends on ACE2 and TMPRSS2 and Is Blocked by a
Clinically Proven Protease Inhibitor. Cell 181, 271-280 e8 (2020).
16. Asselta, R., Paraboschi, E.M., Mantovani, A. & Duga, S. ACE2 and TMPRSS2 variants and expression
as candidates to sex and country differences in COVID-19 severity in Italy. Preprint at
https://www.medrxiv.org/content/10.1101/2020.03.30.20047878v2 (2020).
Page 10/1617. Das, R. & Ghate, S.D. Investigating the likely association between genetic ancestry and COVID-19
manifestation. Preprint at https://www.medrxiv.org/content/10.1101/2020.04.05.20054627v2
(2020).
18. Kenyon, C. Why Has COVID-19 Spread More Extensively in Europe than Asia? Preprint at
https://www.preprints.org/manuscript/202005.0200/v1 (2020).
19. Zhang, C. et al. PGG.SNV: understanding the evolutionary and medical implications of human single
nucleotide variations in diverse populations. Genome Biol 20, 215 (2019).
20. Cocca, M. et al. A bird's-eye view of Italian genomic variation through whole-genome sequencing. Eur
J Hum Genet 28, 435-444 (2020).
21. Urnikyte, A. et al. Patterns of genetic structure and adaptive positive selection in the Lithuanian
population from high-density SNP data. Sci Rep 9, 9163 (2019).
22. Jeon, S. et al. Korean Genome Project: 1094 Korean personal genomes with clinical information.
Science Advances 6(2020).
23. Karczewski, K.J. et al. The mutational constraint spectrum quanti ed from variation in 141,456
humans. Nature 581, 434-443 (2020).
24. Ng, P.C. & Henikoff, S. SIFT: Predicting amino acid changes that affect protein function. Nucleic
Acids Res 31, 3812-4 (2003).
25. Adzhubei, I.A. et al. A method and server for predicting damaging missense mutations. Nat Methods
7, 248-9 (2010).
26. Han, S., Andres, A.M., Marques-Bonet, T. & Kuhlwilm, M. Genetic Variation in Pan Species Is Shaped
by Demographic History and Harbors Lineage-Speci c Functions. Genome Biol Evol 11, 1178-1191
(2019).
27. Prado-Martinez, J. et al. Great ape genetic diversity and population history. Nature 499, 471-5 (2013).
28. Fu, Q. et al. The genetic history of Ice Age Europe. Nature 534, 200-5 (2016).
29. Yang, Y. & Zhou, Y. Speci c interactions for ab initio folding of protein terminal regions with
secondary structures. Proteins 72, 793-803 (2008).
30. Shen, M.Y. & Sali, A. Statistical potential for assessment and prediction of protein structures. Protein
Sci 15, 2507-24 (2006).
31. Kim, D.E., Chivian, D. & Baker, D. Protein structure prediction and analysis using the Robetta server.
Nucleic Acids Res 32, W526-31 (2004).
32. Yang, J. et al. The I-TASSER Suite: protein structure and function prediction. Nat Methods 12, 7-8
(2015).
33. Herter, S. et al. Hepatocyte growth factor is a preferred in vitro substrate for human hepsin, a
membrane-anchored serine protease implicated in prostate and ovarian cancers. Biochem J 390,
125-36 (2005).
34. Fu, Q. et al. Genome sequence of a 45,000-year-old modern human from western Siberia. Nature 514,
445-9 (2014).
Page 11/1635. Petersen, L., Andersen, P.K. & Sorensen, T.I. Genetic in uences on incidence and case-fatality of
infectious disease. PLoS One 5, e10603 (2010).
36. Sharma, S. et al. ACE2 Homo-dimerization, Human Genomic variants and Interaction of Host
Proteins Explain High Population Speci c Differences in Outcomes of COVID19. Preprint at
https://www.biorxiv.org/content/10.1101/2020.04.24.050534v3 (2020).
37. Bhattacharyya, C. et al. Global Spread of SARS-CoV-2 Subtype with Spike Protein Mutation D614G is
Shaped by Human Genomic Variations that Regulate Expression of TMPRSS2 and MX1 Genes.
Preprint at https://www.biorxiv.org/content/10.1101/2020.05.04.075911v1.full (2020).
38. Paniri, A., Hosseini, M.M. & Akhavan-Niaki, H. First comprehensive computational analysis of
functional consequences of TMPRSS2 SNPs in susceptibility to SARS-CoV-2 among different
populations. J Biomol Struct Dyn, 1-18 (2020).
39. Picard, http://broadinstitute.github.io/picard. (2020).
40. Ali Daneshkhah, V.A., Adam Eshein, Hariharan Subramanian, Hemant Kumar Roy, Vadim Backman.
The Possible Role of Vitamin D in Suppressing Cytokine Storm and Associated Mortality in COVID-19
Patients. Preprint at https://www.medrxiv.org/content/10.1101/2020.04.08.20058578v4 (2020).
41. McLaren, W. et al. The Ensembl Variant Effect Predictor. Genome Biol 17, 122 (2016).
42. Liu, X., Wu, C., Li, C. & Boerwinkle, E. dbNSFP v3.0: A One-Stop Database of Functional Predictions
and Annotations for Human Nonsynonymous and Splice-Site SNVs. Hum Mutat 37, 235-41 (2016).
43. Altschul, S.F. et al. Gapped BLAST and PSI-BLAST: a new generation of protein database search
programs. Nucleic Acids Res 25, 3389-402 (1997).
44. Williams, C.J. et al. MolProbity: More and better reference data for improved all-atom structure
validation. Protein Sci 27, 293-315 (2018).
45. Dehouck, Y., Kwasigroch, J.M., Gilis, D. & Rooman, M. PoPMuSiC 2.1: a web server for the estimation
of protein stability changes upon mutation and sequence optimality. BMC Bioinformatics 12, 151
(2011).
46. Parthiban, V., Gromiha, M.M. & Schomburg, D. CUPSAT: prediction of protein stability upon point
mutations. Nucleic Acids Res 34, W239-42 (2006).
47. Capriotti, E., Fariselli, P., Rossi, I. & Casadio, R. A three-state prediction of single point mutations on
protein stability changes. BMC Bioinformatics 9 Suppl 2, S6 (2008).
48. Pires, D.E., Ascher, D.B. & Blundell, T.L. DUET: a server for predicting effects of mutations on protein
stability using an integrated computational approach. Nucleic Acids Res 42, W314-9 (2014).
49. Pires, D.E., Ascher, D.B. & Blundell, T.L. mCSM: predicting the effects of mutations in proteins using
graph-based signatures. Bioinformatics 30, 335-42 (2014).
50. Pandurangan, A.P., Ochoa-Montano, B., Ascher, D.B. & Blundell, T.L. SDM: a server for predicting
effects of mutations on protein stability. Nucleic Acids Res 45, W229-W235 (2017).
51. Cheng, J., Randall, A. & Baldi, P. Prediction of protein stability changes for single-site mutations using
support vector machines. Proteins 62, 1125-32 (2006).
Page 12/1652. Pettersen, E.F. et al. UCSF Chimera--a visualization system for exploratory research and analysis. J
Comput Chem 25, 1605-12 (2004).
53. Chang, C.C. et al. Second-generation PLINK: rising to the challenge of larger and richer datasets.
Gigascience 4, 7 (2015).
Table
Table 1. Effect of V197M variant on structural features
Modeled structure Type of dDFIRE nDOPE Ramachandran plot
structures (Favored)(%)
Hepsin (1Z8G) WTd -822.28 -1.586 97.53
MTe -812.80 -1.439 96.76
Robettaa TMPRSS2(SRCR)b WT -183.43 -1.125 94.68
MT -176.48 -0.907 93.62
TMPRSS2 WT -730.79 -1.135 94.77
(SRCR+Peptidase
MT -725.40 -1.062 93.90
S1)c
I- TMPRSS2(SRCR) WT -184.17 -0.909 91.67
TASSERa
MT -151.16 -0.156 86.17
TMPRSS2 WT -700.23 -0.704 92.44
(SRCR+Peptidase
MT -615.98 -0.129 86.05
S1)
a
Homology modeling tools, bSRCR domain separated from modeled TMPRSS2 structure, cModeled
TMPRSS2 structure, dWild type structure, eMutant type structure with V197M variant
Figures
Page 13/16Figure 1
Correlation plots of COVID-19 average of time-adjusted case fatality rate (AT-CFR) with allele frequencies
of TMPRSS2 variants. a) V197M (rs12329760) from 27 countries and b) G8V (rs75603675) from 17
countries. The size of dots indicates the proportion of people who are 70 or older in the countries. The
correlations were estimated by Spearman’s correlation test. Allelic odds ratios (ORs) (i.e.,
alternative/reference allele counts) of the Y-axis country to the X-axis country are presented in c) for
V197M and d) for G8V. AFR: Africa, CA: Central Asia, EU: Europe, SEA: Southeast Asia, AMR: Americas,
EA: East Asia, SA: South Asia, and WA: West Asia. Full country names and allele frequencies per country
are in Supplementary Data 3.
Page 14/16Figure 2
TMPRSS2 protein structure of both wild type and mutant type (V197M), predicted with homology
modeling using hepsin (1Z8G) template from the PDB database.
Supplementary Files
This is a list of supplementary les associated with this preprint. Click to download.
TMPRSS2SupplementaryDataset12SR20200622.xlsx
TMPRSS2SupplementaryDataset11SR20200622.xlsx
TMPRSS2SupplementaryDataset10SR20200622.xlsx
TMPRSS2SupplementaryDataset9SR20200622.xlsx
TMPRSS2SupplementaryDataset8SR20200622.xlsx
TMPRSS2SupplementaryDataset7SR20200622.xlsx
TMPRSS2SupplementaryDataset6SR20200622.xlsx
TMPRSS2SupplementaryDataset5SR20200622.xlsx
TMPRSS2SupplementaryDataset4SR20200622.xlsx
TMPRSS2SupplementaryDataset3SR20200622.xlsx
TMPRSS2SupplementaryDataset2SR20200622.xlsx
TMPRSS2SupplementaryDataset1SR20200622.xlsx
Page 15/16TMPRSS2SupplementaryInformationSR20200622ver1.pdf
Page 16/16You can also read