A dynamically young and perturbed Milky Way disk
←
→
Page content transcription
If your browser does not render page correctly, please read the page content below

A dynamically young and perturbed Milky Way disk
                                               T. Antoja1 , A. Helmi2 , M. Romero-Gómez1 , D. Katz3 , C. Babusiaux4 , R. Drimmel5 , D. W.
                                               Evans6 , F. Figueras1 , E. Poggio5,7 , C. Reylé8 , A.C. Robin8 , G. Seabroke9 , and C.
                                               Soubiran10

                                               ABSTRACT
arXiv:1804.10196v2 [astro-ph.GA] 24 Sep 2018

                                               Most of the stars in our Galaxy including our Sun, move in a disk-like component1 and give the Milky Way
                                               its characteristic appearance on the night sky. As in all fields in science, motions can be used to reveal
                                               the underlying forces, and in the case of disk stars they provide important diagnostics on the structure and
                                               history of the Galaxy2 . But because of the challenges involved in measuring stellar motions, samples have so
                                               far remained limited in their number of stars, precision and spatial extent. This has changed dramatically
                                               with the second Data Release of the Gaia mission3 which has just become available. Here we report that
                                               the phase space distribution of stars in the disk of the Milky Way is full of substructure with a variety of
                                               morphologies never observed before, namely snail shells and ridges when spatial and velocity coordinates
                                               are combined. The nature of these new substructures implies that the disk is phase mixing from an out of
                                               equilibrium state, and that it is strongly affected by the Galactic bar and/or spiral structure. Our analysis
                                               of the features leads us to infer that the disk was perturbed between 300 and 900 Myr ago, matching current
                                               estimations of the previous pericentric passage of the Sagittarius dwarf galaxy. Although phase-wrapping
                                               was predicted to occur in the disk after a passage of a satellite galaxy4–6 , the substructures discovered
                                               here were never examined before. The Gaia data challenge the most basic premise in stellar dynamics of
                                               dynamical equilibrium, and show that modelling the Galactic disk as a time-independent axisymmetric
                                               component is definitively incorrect. These findings mark a new era when, by modelling the richness of
                                               phase space substructures, we can determine the structure of the Galaxy and the characteristics of the
                                               perturbers that have most influenced our home in the Universe.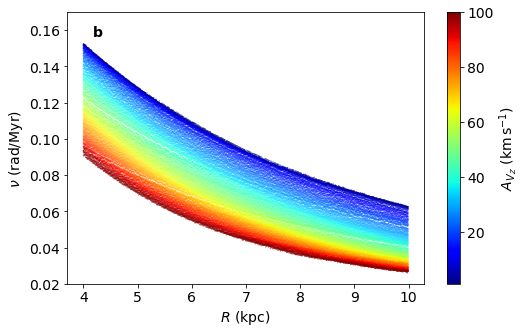
Main
The evolution of the disk of our Galaxy has been sculpted by several phenomena whose exact roles have
yet to be constrained. Models have shown that the bar and the spiral arms can have a major impact on the
disk dynamics, for instance inducing radial migration7 and trapping/scattering close to orbital resonances8 .
External perturbations from satellite galaxies must also play a role, causing for example, heating9 , rings10 ,
correlations between velocities11 , and phase-wrapping signatures in the disk4–6 , such as arched velocity
structures in the motions of stars in the Galactic plane. Some manifestations of these dynamical processes
have been already detected in observations. These include mostly kinematic substructure in samples
of nearby stars12–14 , density asymmetries and velocities across the Galaxy disk that differ from the
axisymmetric and equilibrium expectations15 , especially in the vertical direction13, 16–18 , and signatures of
incomplete phase-mixing in the disk4, 14, 19, 20 .
    Gaia is a cornerstone mission of the European Space Agency (ESA) that has been designed primarily
to investigate the origin, evolution and structure of the Milky Way and has just delivered an exquisite
product: the largest and most precise census of positions, velocities and other stellar properties for more
than a billion stars. By exploring the phase space of more than 6 million stars (positions and velocities) in
the disk of the Galaxy in the first kiloparsecs around the Sun from the Gaia Data Release 2 (DR2, see
Methods), we find that certain phase space projections show plenty of substructures that are new and that
had not been predicted by existing models. These have remained blurred until now due to the limitations
on the number of stars and the precision of the previously available datasets.
    Fig. 1a shows the projection of phase space in the vertical position and velocity Z-VZ . The stars follow
an impressive curled spiral-shaped distribution never seen before whose density increases towards the
leading edge of the spiral. Fig. 1b and Fig. 1c show that the “snail shell” is still present when the stars are
colour-coded according to their VR and Vφ values, implying a strong correlation between the vertical and
in-plane motions of the stars. The pattern is particularly pronounced in the Vφ colour-coded case (Fig. 1c)
even up to VZ ∼ 40 km s−1 . Furthermore, we see a gradient with different azimuthal velocities across the
spiral shape, following the density variations. Details about the relation between the “snail shell” and
other velocity features observed in the Solar neighbourhood are described in Extended Data Fig. 1.
    The spiral shape of Fig. 1a is clearly reminiscent of the effects of phase mixing in two-dimensions
discussed in several areas of Astrophysics21–23 and also in quantum physics24 but never put in the context
of dynamical models of the disk. This process can be better understood with a simple toy model. Consider
a Galaxy model whose vertical potential can be approximated by an anharmonic oscillator of the shape

                  1        1
      Φ(Z) ∝ −α0 + α1 Z 2 − α2 Z 4 ,                                                                       (1)
                  2        4
where the coefficients αi depend on Galactocentric radius R, since the vertical pull depends on the distance
to the Galactic center. In this approximation, the frequencies of oscillation depend on the amplitude of the
oscillation A, to first order, as23

                                  3α2 (R)A2

                        1/2
      ν(A, R) = α1 (R)         1−                                                                          (2)
                                   8α1 (R)

               1/2
 where ν0 ≡ α1 is the vertical frequency in the epicyclic approximation. By approximating that stars
follow a simple harmonic oscillation with these frequencies, their movement with time is described by

      Z = A cos (ν(A)t + φ0 ) ,       VZ = −Aν(A) sin (ν(A)t + φ0 ) ,                                      (3)

                                                                                                         2/18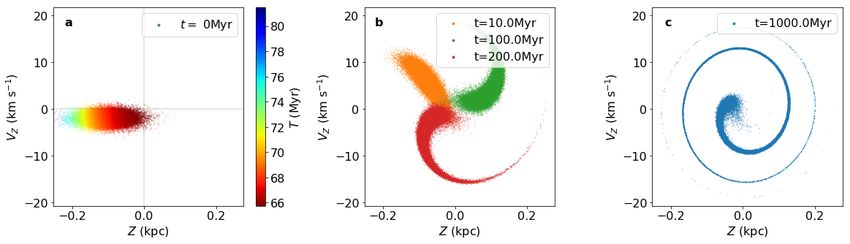
which traces a circle in the clockwise direction in the Z-VZ projection. However, stars revolve at different
angular speeds depending on their frequency. Thus, an ensemble of stars will stretch out in phase space,
with the range of frequencies causing a spiral shape in this projection. The detailed time evolution of
stars in this toy model is described in Methods and shown in Extended Data Fig. 3. As time goes by, the
spiral gets more tightly wound, and eventually, this process of phase mixing leads to a spiral that is so
wound that the coarse-grained distribution appears to be smooth. The clarity of the spiral shape in the
Z-VZ plane revealed by the Gaia DR2 data, implies that this time has not yet arrived and thus provides
unique evidence that phase mixing is currently taking place in the disk of the Galaxy.
     This interpretation also implies that the shape of the spiral can be used to obtain information on: i)
the shape of the potential, which determines the vertical frequencies, ii) the starting time of the phase
mixing, and iii) the type of perturbation that brought the disk to a non-equilibrium state, which sets the
initial conditions for the phase mixing event we are witnessing. For instance, we can estimate the time t of
the event from the separation between two consecutive spiral turns because these have phase separation
of 2π, that is (ν2t + φ02 ) − (ν1t + φ01 ) = 2π, where 1 and 2 indicate two consecutive turns of the spiral.
Therefore, we have that
             2π
      t=           ,                                                                                        (4)
           ν2 − ν1
where we have assumed that the initial phase is the same for 1 and 2. Using several potentials for the
Milky Way, as explained in Methods, we estimated that the vertical phase mixing event started about
500 Myr ago, with a likely range of [300, 900 Myr]. A toy model that illustrates this process is shown in
Fig. 3a, which depicts a spiral shape similar to the data formed after 500 Myr from an ensemble of stars
with a starting distribution that is out of equilibrium (see Methods).
    A possible perturbation that might have sparked the observed on-going vertical phase mixing is the
influence of a satellite galaxy. In particular, the last pericentre of the orbit of the Sagittarius dwarf galaxy
has been shown to have strong effects on the stellar disk5, 6, 10 . In addition, most models locate this
pericentric passage between 200 and 1000 Myr ago6, 25, 26 , which is fully consistent with our findings.
Nevertheless, other processes that may induce snail shells could be the formation of the central bar and of
transient spiral structure, provided that these are able to induce vertical asymmetries, other global changes
in the potential, or the dissolution of a massive stellar system such as a cluster or accreted satellite.
    Another phase space projection that shows a remarkably different and stunning appearance with the
Gaia data is the azimuthal velocity Vφ versus cylindric radius R (Fig. 2). Although this phase space
projection was explored before with other data27 , the spatial coverage, high sampling and unprecedented
precision of the Gaia data unveils a plethora of diagonal thin ridges. The arches in the velocity space
projection VR -Vφ at the Solar neighbourhood recently discovered with Gaia data14 and shown in Extended
Data Fig. 1a are projections of these diagonal ridges but at a fixed Galactic position. Fig. 2 this reveals that
arched structures must be present at many different radii but have remained fully unexplored thus far, and
that their characteristics vary with distance from the Galactic centre, diminishing their velocity towards
the outskirts of the Galaxy in a continuous way.
    These diagonal ridges could be signatures of phase mixing now in the horizontal direction, as has been
already predicted for the arches in velocity space4, 5, 28 . Alternatively, the bar and the spiral arms could
also induce diagonal ridges created by the resonant orbital structure, which exhibit regions in phase space
of stable and unstable orbits29 , and hence with over-densities and gaps. A simple toy model of phase
mixing currently at work (Fig. 3b) but also, a disk simulation with a Galactic potential containing a bar
(Fig. 3c) show plenty of diagonal ridges. The Vφ velocity separation of consecutive ridges in the data is
about 10 km s−1 . This separation compared to that of all our toy models (see Methods) seems to indicate

                                                                                                          3/18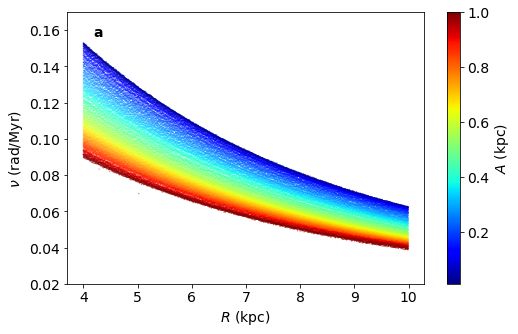
that if these ridges were caused by phase mixing from a single perturbation, this should have taken place
a longer time ago than the one giving rise to the vertical mixing, This conclusion is consistent with the
timing derived using the separation between arches in the local velocity plane4 and some stellar moving
groups that appear not to be fully phase mixed vertically20 , which was found to be 2 Gyr ago. The relation
between the various features is not clear, and it is not unlikely that there are/were several perturbations
creating superposed features.
    We have here provided the clearest evidence hitherto that our own Galaxy disk has suffered from
perturbations bringing it to an out of equilibrium state, which may well be due to the interaction with an
external satellite galaxy. Our findings indicate that the emergent field of galactoseismology18 will become
a consolidated reality in the Gaia era. Our interpretation of the new features found, however, is based
on simple toy models, with their main limitations being the lack of self-consistency, the choice of initial
conditions not necessarily reflecting those stemming from the impact of a satellite galaxy, and the fact
that we study separately the effects of resonances and phase mixing and also the different dimensions
(horizontal and vertical) at play. A challenging task for the future will be to model the new findings taking
into account collective effects, such as in the perturbative regime30 and also with self-consistent N-body
models26 .

References
 1. Oort, J. H. Observational evidence confirming Lindblad’s hypothesis of a rotation of the galactic
    system. Bull. Astron. Inst. Neth. 3, 275–282 (1927).
 2. Binney, J. & Tremaine, S. Galactic Dynamics: Second Edition (Princeton University Press, 2008).
 3. Gaia Collaboration, Brown, A. & et al. Gaia Data Release 2: Summary of the contents and survey
    properties. Astron. Astrophys. (2018).
 4. Minchev, I. et al. Is the Milky Way ringing? The hunt for high-velocity streams. Mon. Not. R. Astron.
    Soc. 396, L56–L60 (2009). DOI 10.1111/j.1745-3933.2009.00661.x. 0902.1531.
 5. Gómez, F. A., Minchev, I., Villalobos, Á., O’Shea, B. W. & Williams, M. E. K. Signatures of
    minor mergers in Milky Way like disc kinematics: ringing revisited. Mon. Not. R. Astron. Soc. 419,
    2163–2172 (2012). DOI 10.1111/j.1365-2966.2011.19867.x. 1105.4231.
 6. de la Vega, A., Quillen, A. C., Carlin, J. L., Chakrabarti, S. & D’Onghia, E. Phase wrapping of
    epicyclic perturbations in the Wobbly Galaxy. Mon. Not. R. Astron. Soc. 454, 933–945 (2015). DOI
    10.1093/mnras/stv2055. 1507.07489.
 7. Sellwood, J. A. & Binney, J. J. Radial mixing in galactic discs. Mon. Not. R. Astron. Soc. 336,
    785–796 (2002). DOI 10.1046/j.1365-8711.2002.05806.x. arXiv:astro-ph/0203510.
 8. Contopoulos, G. & Grosbol, P. Stellar dynamics of spiral galaxies - Nonlinear effects at the 4/1
    resonance. Astron. Astrophys. 155, 11–23 (1986).
 9. Quinn, P. J., Hernquist, L. & Fullagar, D. P. Heating of galactic disks by mergers. Astrophys. J. 403,
    74–93 (1993). DOI 10.1086/172184.
10. Purcell, C. W., Bullock, J. S., Tollerud, E. J., Rocha, M. & Chakrabarti, S. The Sagittarius impact
    as an architect of spirality and outer rings in the Milky Way. Nat. 477, 301–303 (2011). DOI
    10.1038/nature10417. 1109.2918.
11. D’Onghia, E., Madau, P., Vera-Ciro, C., Quillen, A. & Hernquist, L. Excitation of coupled stellar
    motions in the Galactic Disk by orbiting satellites. The Astrophys. Journal, Vol. 823, Issue 1, article id.

                                                                                                         4/18
4, 8 pp. (2016). 823 (2015). URL http://arxiv.org/abs/1511.01503. DOI 10.3847/0004-
637X/823/1/4. 1511.01503.
12. Eggen, O. J. Star Streams and Galactic Structure. Astron. J. 112, 1595 (1996). DOI 10.1086/118126.
13. Dehnen, W. The Distribution of Nearby Stars in Velocity Space Inferred from HIPPARCOS Data.
Astron. J. 115, 2384–2396 (1998). DOI 10.1086/300364. arXiv:astro-ph/9803110.
14. Gaia Collaboration et al. Gaia Data Release 2: Mapping the Milky Way disc kinematics. ArXiv
e-prints (2018). 1804.09380.
15. Siebert, A. et al. Detection of a radial velocity gradient in the extended local disc with RAVE. Mon.
Not. R. Astron. Soc. 412, 2026–2032 (2011). DOI 10.1111/j.1365-2966.2010.18037.x. 1011.4092.
16. Schönrich, R. & Dehnen, W. Warp, Waves, and Wrinkles in the Milky Way. ArXiv e-prints (2017).
1712.06616.
17. Quillen, A. C. et al. The GALAH Survey: Stellar streams and how stellar velocity distributions
vary with Galactic longitude, hemisphere and metallicity. Mon. Not. R. Astron. Soc. (2018). DOI
10.1093/mnras/sty865. 1802.02924.
18. Widrow, L. M., Gardner, S., Yanny, B., Dodelson, S. & Chen, H.-Y. Galactoseismology: Discov-
ery of Vertical Waves in the Galactic Disk. Astrophys. J. 750, L41 (2012). DOI 10.1088/2041-
8205/750/2/L41. 1203.6861.
19. Gómez, F. A. et al. Signatures of minor mergers in the Milky Way disc - I. The SEGUE stellar
sample. Mon. Not. R. Astron. Soc. 423, 3727–3739 (2012). DOI 10.1111/j.1365-2966.2012.21176.x.
1201.5898.
20. Monari, G. et al. Coma Berenices: The First Evidence for Incomplete Vertical Phase-mixing in Local
Velocity Space with RAVE. Confirmed with Gaia DR2. Res. Notes Am. Astron. Soc. 2, 32 (2018).
DOI 10.3847/2515-5172/aac38e. 1804.07767.
21. Tremaine, S. The geometry of phase mixing. Mon. Not. R. Astron. Soc. 307, 877–883 (1999). DOI
10.1046/j.1365-8711.1999.02690.x. astro-ph/9812146.
22. Afshordi, N., Mohayaee, R. & Bertschinger, E. Hierarchical Phase Space Structure of Dark Matter
Haloes: Tidal debris, Caustics, and Dark Matter annihilation. Phys. Rev. D, vol. 79, Issue 8, id. 083526
79 (2008). URL http://arxiv.org/abs/0811.1582http://arxiv.org/abs/0811.
1582. DOI 10.1103/PhysRevD.79.083526. 0811.1582.
23. Candlish, G. N. et al. Phase mixing due to the Galactic potential: steps in the position and velocity dis-
tributions of popped star clusters. Mon. Notices Royal Astron. Soc. Vol. 437, Issue 4, p.3702-3717 437,
3702–3717 (2013). URL http://arxiv.org/abs/1311.1507. DOI 10.1093/mnras/stt2166.
1311.1507.
24. Manfredi, G. & R. Feix, M. Theory and simulation of classical and quantum echoes. Phys. review. E,
Stat. physics, plasmas, fluids, related interdisciplinary topics 53, 6460–6470 (1996).
25. Law, D. R. & Majewski, S. R. The Sagittarius Dwarf Galaxy: A Model for Evolution in a Triaxial
Milky Way Halo. Astrophys. J. 714, 229–254 (2010). DOI 10.1088/0004-637X/714/1/229. 1003.
1132.
26. Laporte, C. F. P., Johnston, K. V., Gómez, F. A., Garavito-Camargo, N. & Besla, G. The Influence
of Sagittarius and the Large Magellanic Cloud on the Milky Way Galaxy. ArXiv e-prints (2017).
1710.02538.
5/1827. Monari, G., Kawata, D., Hunt, J. A. S. & Famaey, B. Tracing the Hercules stream with Gaia and
LAMOST: new evidence for a fast bar in the Milky Way. Mon. Not. R. Astron. Soc. 466, L113–L117
(2017). DOI 10.1093/mnrasl/slw238. 1610.05342.
28. Fux, R. Order and chaos in the local disc stellar kinematics induced by the Galactic bar. Astron. Astro-
phys. 373, 511–535 (2001). DOI 10.1051/0004-6361:20010561. arXiv:astro-ph/0105398.
29. Michtchenko, T. A., Lépine, J. R. D., Barros, D. A. & Vieira, R. S. S. Combined dynamical effects of
the bar and spiral arms in a Galaxy model. Application to the solar neighbourhood. ArXiv e-prints
(2018). 1803.06995.
30. Fouvry, J.-B., Binney, J. & Pichon, C. Self-gravity, Resonances, and Orbital Diffusion in Stellar
Disks. Astrophys. J. 806, 117 (2015). DOI 10.1088/0004-637X/806/1/117. 1504.04834.
Acknowledgements
This work has made use of data from the European Space Agency (ESA) mission Gaia (https://www.
cosmos.esa.int/gaia), processed by the Gaia Data Processing and Analysis Consortium (DPAC,
https://www.cosmos.esa.int/web/gaia/dpac/consortium). Funding for the DPAC has
been provided by national institutions, in particular the institutions participating in the Gaia Multilateral
Agreement. This project has received funding from the European Union’s Horizon 2020 research and
innovation programme under the Marie Skłodowska-Curie grant agreement No. 745617. This work was
supported by the MDM-2014-0369 of ICCUB (Unidad de Excelencia ’Marı́a de Maeztu’) and the European
Community’s Seventh Framework Programme (FP7/2007-2013) under grant agreement GENIUS FP7 -
606740. AH acknowledges financial support from a VICI grant from the Netherlands Organisation for
Scientific Research, NWO. We acknowledge the MINECO (Spanish Ministry of Economy) through grants
ESP2016-80079-C2-1-R (MINECO/FEDER, UE) and ESP2014-55996-C2-1-R (MINECO/FEDER, UE).
Author information
Affiliations
1 Institut de Ciències del Cosmos, Universitat de Barcelona (IEEC-UB), Martı́ i Franquès 1, E-08028
Barcelona, Spain
2 Kapteyn Astronomical Institute, University of Groningen, Landleven 12, 9747 AD Groningen, The
Netherlands
3 GEPI, Observatoire de Paris, Université PSL, CNRS, 5 Place Jules Janssen, 92190 Meudon, France
4 Univ. Grenoble Alpes, CNRS, IPAG, 38000 Grenoble, France
5 INAF - Osservatorio Astrofisico di Torino, via Osservatorio 20, 10025 Pino Torinese (TO), Italy
6 Institute of Astronomy, University of Cambridge, Madingley Road, Cambridge CB3 0HA, UK.
7 Università di Torino, Dipartimento di Fisica, via Pietro Giuria 1, 10125 Torino, Italy
8 Institut UTINAM, CNRS UMR6213, Univ. Bourgogne Franche-Comté, OSU THETA Franche-Comté
Bourgogne, Observatoire de Besançon, BP 1615, 25010 Besançon Cedex, France.
9 Mullard Space Science Laboratory, University College London, Holmbury St Mary, Dorking, Surrey
RH5 6NT, United Kingdom
10 Laboratoire d’astrophysique de Bordeaux, Univ. Bordeaux, CNRS, B18N, allée Geoffroy Saint-Hilaire,
33615 Pessac, France
6/18Contributions statement
T.A. contributed to the sample preparation, analysed and interpreted the data, performed most of the
modelling and wrote the paper together with A.H. A.H. provided interpretation to the findings. M.R.
performed the simulation with the barred potential and contributed to sample preparation. D.K., C.B, R.D.,
D.W.E, F.F., E.P., C.R., A.C.R, G.S, C.S. contributed to sample preparation and validation of the Gaia
data. All authors reviewed the manuscript.
Corresponding author and request for materials
Correspondence to Teresa Antoja.
Competing interests
The authors declare no competing financial interests.
Figure 1. Distribution of stars in the vertical position-velocity plane from Gaia DR2 data. The
panels are for stars in our sample located at 8.24 < R < 8.44 kpc. a) Two-dimensional histogram in bins
of ∆Z = 0.01 kpc and ∆VZ = 0.1 km s−1 , with the darkness being proportional to the number of counts.; b)
Z-VZ plane coloured as a function of median VR in bins of ∆Z = 0.02 kpc and ∆VZ = 1 km s−1 ; c) Same as
b) but for Vφ .
Figure 2. Distribution of azimuthal velocities as a function of Galactocentric radius from Gaia
DR2 data. Two-dimensional histogram for all observed stars in our sample with 6D phase space
coordinates in bins of ∆Vφ = 1. km s−1 , and ∆R = 0.01 kpc. Vφ is positive towards the Galactic rotation
direction.
7/18Figure 3. Models of the phase space distribution of the Galaxy disk. a) Modelled spiral shape
created in the vertical position-velocity plane as a result of the phase mixing in the evolution of an
ensemble of particles for 500 Myr in a Galactic potential, starting from a distribution that is out of
equilibrium presumably after a certain perturbation (see Methods); b) Modelled diagonal ridges created in
the distribution of azimuthal velocities as a function of Galactocentric radius as a result of the phase
mixing in the evolution of an ensemble of particles for 1000 Myr in a Galactic potential, starting from a
distribution that is out of equilibrium (see Methods); c) Same as b) but for the diagonal ridges created as a
result of the effects of the barred potential and its resonant structure (see Methods).
Methods
Data and samples selection
We used Gaia sources for which the 6D phase space coordinates can be computed, that is all sources
with available 5 parameters astrometric solution (sky positions, parallax and proper motions) and radial
velocities. We selected only stars with positive parallaxes ϖ with relative uncertainty smaller than 20%,
i.e. the ones satisfying ϖ/σϖ > 5. This selection is to ensure that 1/ϖ is a reasonably good estimator of
the distance to the stars31 but alternatively, we used also Bayesian distances (see below). This sample has
6,376,803 stars and it has been well studied and characterised elsewhere14 . The data was obtained directly
through the following query in the public Gaia Archive (https://gea.esac.esa.int/archive/):
SELECT G.source_id, G.radial_velocity, G.radial_velocity_error,
G.ra, G.ra_error, G.dec, G.dec_error, G.parallax, G.parallax_error,
G.pmra, G.pmra_error, G.pmdec, G.pmdec_error,
G.ra_dec_corr, G.ra_parallax_corr, G.ra_pmra_corr, G.ra_pmdec_corr,
G.dec_parallax_corr, G.dec_pmra_corr, G.dec_pmdec_corr,
G.parallax_pmra_corr, G.parallax_pmdec_corr, G.pmra_pmdec_corr
FROM gaiadr2.gaia_source G
8/18WHERE G.radial_velocity IS NOT Null AND G.parallax_over_error>5.
From the 5 parameter astrometric solution and line-of-sight velocities (α, δ , ϖ, µα∗ , µδ ,Vlos ) of these
stars, we derived distances (as 1/ϖ), positions and velocities in the cylindrical Galactic reference frame,
that is (R, φ , Z, VR , Vφ , VZ ). For convenience, we took φ positive in the direction of Galactic rotation and
with origin at the line Sun-Galactic Centre. For these transformations, we adopted a vertical distance of
the Sun above the plane of32 27 pc, a distance of the Sun to the Galactic centre33 R of 8.34 kpc and a
circular velocity at the Sun radius of33 Vc (R ) = 240 km s−1 . We assumed a peculiar velocity of the Sun
with respect of the Local Standard of Rest of34 (U ,V ,W ) = (11.1, 12.24, 7.25) km s−1 . Our choice
of values gives (Vc (R ) +V )/R = 30.2 km s−1 kpc−1 , which is compatible with the reflex motion of
Sgr A*35 . To derive the uncertainties in these coordinates, we propagate the full covariance matrix. The
median errors in the VR , Vφ , VZ velocities are 1.4, 1.5, and 1.0 km s−1 , respectively, and 80% of stars have
errors smaller than 3.3, 3.7, 2.2 km s−1 in these velocities. The positions in the Cartesian coordinates X-Y
and X-Z of the sample are shown in Extended Data Fig. 2.
For part of our study, we selected from our sample the 935,590 stars located in the solar Galactic
cylindrical ring, that is with Galactocentric radius 8.24 < R < 8.44 kpc (dotted lines in Extended Data
Fig. 2). For this selection, the median errors in the VR , Vφ , VZ velocities are 0.5, 0.8, and 0.6 km s−1 ,
respectively, and 80% of stars have errors smaller than 1.1, 2.0, 1.3 km s−1 in these velocities.
We note that the velocity uncertainties are significantly smaller than the sizes of the substructures
detected and that, together with the number of stars in our samples, this is what made possible their
detection. Although there are some correlations between the astrometric Gaia observables36 , these are
not responsible for the correlations and substructure seen in our phase space plots. This is because the
stars in our sample are distributed through all sky directions, and the phase space coordinates come from
combinations of astrometric measurements and radial velocities, in different contributions depending on
the direction on the sky. Besides, the astrometric correlations for our sample are small (smaller than 0.2
in their absolute value for more than 50% of stars) and this, combined with the small errors, makes their
contribution nonsignificant.
Alternatively, we used distances determined through a Bayesian inference method using the existing
implementation in TOPCAT37 , taking the mode of the posterior distribution and a prior of an exponentially
decreasing density of stars with scale length of 1.35 kpc38 . We found that the differences between this
distance determination and the inverse of the parallax are between -2% and 0.6% for 90% of the 6,376,803
stars with ϖ/σϖ > 5, which was expected for small relative errors in parallax. Consequently, the phase
space diagrams presented here vary only at pixel level. These panels do not vary even when using the set
of 7,183,262 of stars with available radial velocities that include stars with larger parallax errors and stars
with negative parallaxes, for which the estimator of the inverse of the parallax would yield unphysical
distances. When using another alternative set of Bayesian distances specifically derived for stars from
Gaia DR2 with radial velocities using a different prior39 , we found the differences between these distances
and the inverse of the parallax to be between -9% and 5% for 90% of the stars, thus slightly larger than
before, but again with no noticeable effects on the phase space panels examined here.
Models for the vertical phase mixing
We first reproduced the spiral shape observed in the Z-VZ plane with the Gaia DR2 data by using a simple
toy model. Often the classic harmonic oscillator is employed to describe the vertical movement of stars in
galaxy disks under the epicyclic theory2 . However, in this approximation, which is valid only for very small
amplitude orbits for which the potential changes little vertically, stars have the same vertical oscillatory
frequency ν and there is no phase mixing, unless orbits at different guiding radius, thus with different
9/18frequencies, are considered. Instead, we used an anharmonic oscillator with the potential of Eq. (1). We
took the coefficients α0 , α1 , α2 corresponding to the expansion for small Z, derived elsewhere23 , of a
Miyamoto-Nagai potential40 with values of a = 6.5 kpc, b = 0.26 kpc, M = 1011 M . These coefficients
α depend on Galactocentric radius R. In this anharmonic potential, the frequencies of oscillation are
described by Eq. (2), and thus depend on R and on the amplitude of the oscillation A.
Given an initial distribution of stars Z(t = 0) and VZ (t = 0), the vertical amplitudes of the orbits can
be derived through the conservation of energy and using the fact that at the vertical turn-around point of
the orbit (VZ = 0), the (vertical) kinetic energy is null23 . Assuming that stars follow a simple harmonic
oscillation (but with different frequencies), the movement of the stars with time is described by Eq. (3)
where the initial phase of the stars φ0 ≡ φ (t = 0) is obtained from the initial distribution of Z and VZ and
the corresponding amplitudes.
The phase space evolution described above is shown in the top row of Extended Data Fig. 3. Initially,
the particles followed a Gaussian distribution in Z(t = 0) and in VZ (t = 0) with mean and dispersion of
−0.1 kpc and 0.04 kpc, and −2 km s−1 and 1 km s−1 , respectively. We located all particles at the same
Galactocentric radius R = 8.5 kpc, and thus, they all move under the same functional form of the vertical
potential. The initial conditions are shown in Extended Data Fig. 3a, where we colour-coded the particles
according to their period. Following Eq. (3), each star follows a clockwise rotation in the Z-VZ plane.
However, they do it at a different angular speed: stars with smaller period located at the closer distances
from the mid-plane (Z = 0) revolve faster than those located at the largest distances from the mid-plane.
The whole range of frequencies is what creates, therefore, the spiral shape. Extended Data Fig. 3b shows
the evolution of the system for three initial phases of the time evolution when the spiral shape begins to
form. Extended Data Fig. 3c shows the spiral shape after 1000 Myr of evolution.
In the Gaia data, we do not see a thin spiral but a thick one, with many of the stars in the volume
participating in it. A similar effect was reached with our toy model when we included particles at different
radius for which the vertical potential changes and the range of amplitudes/frequencies also changes. In
Extended Data Fig. 3 (bottom row) we let the same system evolve as in the top row but starting with
initial radius following a skewed normal distribution, which creates a density decreasing with radius as
in galaxy disks, with skewness of 10, location parameter of 8.4 kpc and scale parameter of 0.2 kpc. The
spiral structure is now thickened similarly to the data, with higher density of stars at the leading edge of
the spiral.
To estimate the time of the phase mixing event from the spiral seen in the Gaia data (Fig. 1) using
Eq. (4), we needed to locate two consecutive turns of the spiral and estimate their vertical frequencies from
their amplitudes and mean radius. For this, we used Extended Data Fig. 5 which has been colour coded as
V R
a function of median guiding radius. This was approximated as Rg ∼ Vcφ(R ) , under the hypothesis of a
flat rotation curve, where we used the values of R = 8.34 kpc and Vc (R ) = 240 km s−1 assumed in the
coordinate transformation of the data. In this panel we see that the density gradient across the spiral shape
is created by stars with different guiding radius that arrive at the solar neighbourhood due to their different
amplitudes of (horizontal) radial oscillation. To determine two consecutive turns of the spiral, we focused
on stars at the turn-around points (VZ = 0) near the leading edges of the spiral. By visual inspection, we
determined an approximate range of Z in which the turn around points are located in Extended Data Fig. 5,
concentrating on red colours, for which the spiral is well defined. The ranges of the turn around points are
marked with vertical lines and listed, together with the middle value, in Table 1. For these turn-around
points, the amplitudes are simply A = Z and from the colour bar we note that the average Rg is around
8.2 kpc. Small changes in this value do not change significantly our final determination of the time of the
perturbation.
10/18To estimate the vertical orbital frequencies of these turn-around points, we could not use the toy model presented above since it is valid only for oscillations with small amplitude A, in particular smaller than the vertical scale b of the potential (A
current estimations such as for the Sun Galactocentric radius or the circular velocity curve42 . We used as
initial conditions a set of test particles distributed in Galactocentric radius according to a skewed normal
distribution with skewness of 10, location parameter of 4 kpc and scale parameter of 6 kpc. The azimuthal
angle was fixed at 0. For simplicity, all particles were put at the mid-plane with null vertical velocities. The
radial and azimuthal velocities were initialised, respectively, following Gaussian distributions centred at 0
with dispersion of 40 km s−1 and centred at the circular velocity at the particular radius with a dispersion
of 30 km s−1 . The particle orbits were computed for 1000 Myr.

Model for the horizontal resonances
The model of Fig. 3c is from a test particle simulation of orbits integrated in a Galactic potential model
including a bar44 . The axisymmetric part of the potential was the Allen & Santillan model41 . The
Galactic bar potential was built using Ferrers ellipsoids45 oriented with its semi-major axes at 20◦ from
the Sun-Galactic centre line, and its pattern speed was set to 50 km s−1 kpc−1 , which corresponds to a
period of about 120 Myr. The simulation consisted of 68 million test particles with an initial radial velocity
dispersion of 30 km s−1 at the Solar radius. Their orbits were first integrated in the axisymmetric potential
model for 10 Gyr until they were approximately fully phase mixed. Next, the bar potential was grown
in Tgrow ≡ 4 bar rotations. More details on the bar potential, initial conditions and integration procedure
are specified elsewhere44 . Here we used the final conditions after Tgrow (∼ 500 Myr) and 8 additional
bar rotations (∼ 1000 Myr). From all the particles in the simulation, we used only the ones located in a
range of 10◦ in azimuthal angle centred on the Sun, similar to the our data sample. This selection contains
2,009,791 particles.

Additional references
31. Luri, X. & et al. Distances from parallaxes: on the proper use of astrometric data. Astron. Astrophys.
    (2018).
32. Chen, B. et al. Stellar Population Studies with the SDSS. I. The Vertical Distribution of Stars in the
    Milky Way. Astrophys. J. 553, 184–197 (2001). DOI 10.1086/320647.
33. Reid, M. J. et al. Trigonometric Parallaxes of High Mass Star Forming Regions: The Structure and
    Kinematics of the Milky Way. Astrophys. J. 783, 130 (2014). DOI 10.1088/0004-637X/783/2/130.
    1401.5377.
34. Schönrich, R. Galactic rotation and solar motion from stellar kinematics. Mon. Not. R. Astron. Soc.
    427, 274–287 (2012). DOI 10.1111/j.1365-2966.2012.21631.x. 1207.3079.
35. Reid, M. J. & Brunthaler, A. The Proper Motion of Sagittarius A*. II. The Mass of Sagittarius A*.
    Astrophys. J. 616, 872–884 (2004). DOI 10.1086/424960. arXiv:astro-ph/0408107.
36. Lindegren, L. et al. Gaia Data Release 2: The astrometric solution. ArXiv e-prints (2018). 1804.
    09366.
37. Taylor, M. B. TOPCAT & STIL: Starlink Table/VOTable Processing Software. In Shopbell, P.,
    Britton, M. & Ebert, R. (eds.) Astronomical Data Analysis Software and Systems XIV, vol. 347 of
    Astronomical Society of the Pacific Conference Series, 29 (2005).
38. Astraatmadja, T. L. & Bailer-Jones, C. A. L. Estimating Distances from Parallaxes. II. Performance
    of Bayesian Distance Estimators on a Gaia-like Catalogue. Astrophys. J. 832, 137 (2016). DOI
    10.3847/0004-637X/832/2/137. 1609.03424.

                                                                                                         12/18
39. McMillan, P. J. Simple distance estimates for \textit{Gaia} DR2 stars with radial velocities. ArXiv
e-prints (2018). 1806.00426.
40. Miyamoto, M. & Nagai, R. Three-dimensional models for the distribution of mass in galaxies. PASJ
27, 533–543 (1975).
41. Allen, C. & Santillan, A. An improved model of the galactic mass distribution for orbit computations.
Rev. Mexicana Astron. Astrofis. 22, 255–263 (1991).
42. Irrgang, A., Wilcox, B., Tucker, E. & Schiefelbein, L. Milky Way mass models for orbit calculations.
Astron. Astrophys. 549, A137 (2013). DOI 10.1051/0004-6361/201220540. 1211.4353.
43. McMillan, P. J. The mass distribution and gravitational potential of the Milky Way. Mon. Not. R.
Astron. Soc. 465, 76–94 (2017). DOI 10.1093/mnras/stw2759. 1608.00971.
44. Romero-Gómez, M., Figueras, F., Antoja, T., Abedi, H. & Aguilar, L. The analysis of realistic stellar
Gaia mock catalogues - I. Red clump stars as tracers of the central bar. Mon. Not. R. Astron. Soc. 447,
218–233 (2015). DOI 10.1093/mnras/stu2457. 1411.6389.
45. Ferrers, N. On the potentials of ellipsoids, ellipsoidal shells, elliptic laminae and elliptic rings of
variable densities. QJ Pure Appl. Math 14, 1–22 (1877).
46. Eggen, O. J. Stellar groups. I. The Hyades and Sirius groups. Mon. Not. R. Astron. Soc. 118, 65
(1958). DOI 10.1093/mnras/118.1.65.
47. Blaauw, A. Remarks on Local Structure and Kinematics. In Becker, W. & Kontopoulos, G. I. (eds.)
The Spiral Structure of our Galaxy, vol. 38 of IAU Symposium, 199 (1970).
48. Skuljan, J., Hearnshaw, J. B. & Cottrell, P. L. Velocity distribution of stars in the solar neighbourhood.
Mon. Not. R. Astron. Soc. 308, 731–740 (1999). DOI 10.1046/j.1365-8711.1999.02736.x. arXiv:
astro-ph/9905002.
49. Antoja, T., Figueras, F., Fernández, D. & Torra, J. Origin and evolution of moving groups. I.
Characterization in the observational kinematic-age-metallicity space. Astron. Astrophys. 490, 135–
150 (2008). DOI 10.1051/0004-6361:200809519. 0809.0511.
Data availability statement
The datasets used and analysed for the current study are derived from the data available in the public
Gaia Archive, [https://gea.esac.esa.int/archive/]. The Bayesian distances for the Gaia sources with
radial velocity39 are available at http://www.astro.lu.se/˜paul/GaiaDR2_RV_star_
distance.csv.gz. The rest of datasets and toy models generated and/or analysed are available
from the corresponding author on reasonable request.
Code availability statement
We have made use of standard data analysis tools in Python environment. The codes to generate
the toy models, simulations and compute orbital frequencies are available from the correspond-
ing author on reasonable request. The code used to compute the orbits for the McMillan 2017
potential43 is available at https://github.com/PaulMcMillan-Astro/GalPot. The code to compute
Bayesian distances from parallaxes is available in the TOPCAT platform37 .
13/18Extended Data
Extended Data Tables
Extended Data Table 1. Time estimations from the turn-around points of the spiral.
The first column indicates the vertical position of the turn-around points, which are equal to the amplitude
of the orbits except for the sign, and the estimated uncertainty ranges.The following columns are the
frequencies corresponding to these amplitudes, and the starting times of the phase mixing process
corresponding to each pair of consecutive spiral turns.
Extended Data Table 2. Time estimations from the mid-plane points of the spiral.
The first column indicates the vertical velocity at the mid-plain passages, which are equal to the velocity
amplitudes of the orbits except for the sign, and the estimated uncertainty ranges.The following columns
are the frequencies corresponding to these amplitudes, and the starting time of the phase mixing process
corresponding to the pair of consecutive spiral turns.
14/18Extended Data Figures
Extended Data Figure 1. Distribution of velocities in the solar Galactocentric radius from Gaia
DR2 data. Two-dimensional histograms of combinations of radial, azimuthal and vertical Galactic
cylindrical velocities for the stars in our sample located at 8.24 < R < 8.44 kpc, in bins of 1 km s−1 . VR
and Vφ are positive towards the Galactic anti-centre and the Galactic rotation direction, respectively. The
darkness is proportional to the number of counts. a) Although the bimodality seen in this panel,
separating the Hercules stream from the rest of the distribution was known46, 47 , as well as some other
elongated structures in this velocity projection13, 48, 49 the numerous and thin arches in this panel are
a new phenomenon revealed by Gaia elsewhere14 . The semi-circular dotted line in this panel marks an
arbitrary line of constant kinetic energy in the plane Ek = 21 (VR2 +Vφ2 ), as predicted for the substructure
generated in horizontal phase mixing4, 5 . b) This panel depicts a rather boxy appearance, where the
extent of the arches in VZ , varies with their Vφ (arrows), likely created by the correlation between the
spiral shape and the Vφ velocities of Fig. 1c. c) While some velocity asymmetries where noticed
before in the Vφ −VZ projection13 and attributed to the Galaxy warp, the sharp shell-like features
involving the VZ velocities, especially at VZ ∼ −30 km s−1 and VZ ∼ 25 km s−1 , are unveiled here for
the first time. These shells are different projections of the “snail shell” pattern of Fig. 1a.
15/18Extended Data Figure 2. Distribution of stars in our sample in the disk of the Galaxy. Two
dimensional histograms with bins of 0.05 kpc in the X-Y and X-Z projections. The dotted lines mark the
selection of stars in the solar Galactic ring of between radius of [8.24, 8.44] kpc. The Sun is located at
(X,Y, Z) = (−8.34, 0., 0.027) kpc and the Galactic Centre is marked with a black dot.
16/18Extended Data Figure 3. Spiral shape created in the phase space evolution under an
anharmonic potential. a-b-c) Phase space evolution at different times (t=0,10,100,200,1000 Myr) for
an ensemble of particles at a fixed Galactocentric radius of R = 8.5 kpc with an initial Gaussian
distributions in Z(t = 0) with mean of −0.1 kpc and dispersion of 0.04 kpc and in VZ (t = 0) with mean of
−2 km s−1 and dispersion of 1 km s−1 . d-e-f) Same as a-b-c) but for a skewed normal distribution of initial
radius with skewness of 10, location parameter of 8.4 kpc and scale parameter of 0.2 kpc. In both rows,
the evolution is the one of an anharmonic oscillator derived from the expansion of a Miyamoto-Nagai disk
for small Z. In panels a) and d) the stars are colour coded by vertical period.
Extended Data Figure 4. Vertical frequency for orbits in a Galaxy model potential. Frequencies
as a function of Galactocentric radius R computed in the updated Allen & Santillan model42 a) colour
coded by vertical amplitude of the orbits and b) colour coded by vertical velocity amplitude of the orbits.
17/18Extended Data Figure 5. Position of the shells in the distribution of stars in the vertical
position-velocity plane. Z-VZ plane coloured as a function of median guiding radius Rg for stars at
Galactocentric radius of [8.24,8.44] kpc in bins of ∆Z = 0.02( kpc) and ∆VZ = 1 km s−1 with horizontal
and vertical lines showing the approximate locations of the observed shells (turn-around and mid-plane
points).
18/18You can also read