ANNUAL SUMMARY OF CARBON DIOXIDE MONITORING IN THREE BALCONES CANYONLANDS CONSERVATION PLAN CAVES IN TRAVIS COUNTY, TEXAS - FTP Directory Listing
←
→
Page content transcription
If your browser does not render page correctly, please read the page content below
Integrity | Science | Expertise
                      1707 West FM 1626
                     Manchaca, Texas 78652
                         512-291-4555
                   www.zaraenvironmental.com

    ANNUAL SUMMARY OF CARBON DIOXIDE MONITORING
IN THREE BALCONES CANYONLANDS CONSERVATION PLAN CAVES
                IN TRAVIS COUNTY, TEXAS

              Carbon dioxide data retrieval at Whirlpool Cave.

                       Prepared for
                       Austin Water
              Wildlands Conservation Division
                   3621 Ranch Road 620
                    Bee Cave, TX 78738

                         26 January 2021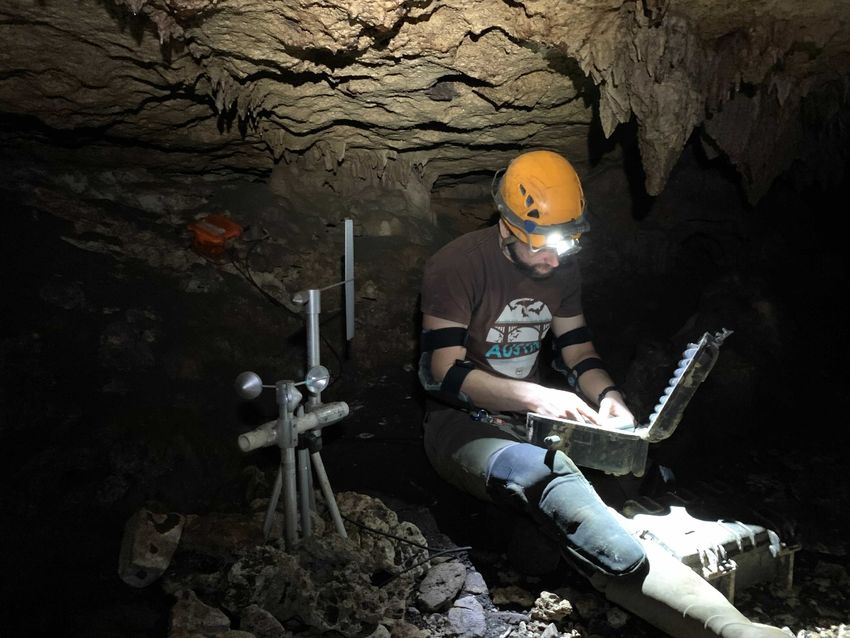
ANNUAL SUMARY OF CARBON DIOXIDE MONITORING
            IN THREE BALCONES CANYONLANDS CONSERVATION PLAN CAVES
                            IN TRAVIS COUNTY, TEXAS

                                         Prepared for
                                         Austin Water
                                Wildlands Conservation Division
                                     3621 Ranch Road 620
                                      Bee Cave, TX 78738

                                        26 January 2021

In accordance with the Texas Board of Professional Geologists rules at 22 Texas Administrative
Code, Part 39, Chapter 851, Subchapter C, §851.156, this report is signed and sealed on the title
page to assure the user that the work has been performed by or directly supervised by the
following professional geologist who takes full responsibility for this work.

The computer generated seal appearing on this document was authorized by Jeffery A. Watson,
P.G. 12995. on 26 January 2021

                                                                               26 January 2021
                                         Jeff Watson, Texas Professional Geoscientist No. 12995
                                Zara Environmental LLC Geoscience Firm Registration No. 50365
Abstract
Cave-air carbon dioxide (CO2) concentration was measured in three Balcones Canyonlands
Preserve caves (Whirlpool Cave, Grassy Cove Cave, and Irelands Cave) using Vaisala logging CO2
meters. Anemometers and wind vanes were also deployed in the caves to measure wind speed
velocity and wind direction. This report covers data collected between October 2019 and
November 2020. Cave CO2 concentrations fluctuated both seasonally and diurnally in all three
caves and within similar timeframes. Maximum and minimum CO2 concentrations and the
magnitude of CO2 fluctuations differed in all three caves. Seasonal CO2 concentrations were
elevated May through October (the warm season) and were lowest December through February
(the cool season). Diurnal CO2 fluctuations during the warm season were generally smaller in
magnitude in Irelands Cave than Whirlpool Cave, while Grassy Cove Cave had large diurnal
fluctuations throughout the study period regardless of season. Surface weather conditions,
especially atmospheric pressure fronts, significantly altered diurnal CO2 fluctuations for periods
lasting from hours to days. Measured CO2 in Irelands Cave and Grassy Cove Cave fluctuated more
than 20,000 ppm in response to some individual pressure fronts. Airflow data, measured by a
newly deployed sonic anemometer in Whirlpool Cave, indicated a diurnal peak in airflow velocity
followed by a drop in velocity. This drop in airflow velocity coincided with an abrupt change in
airflow direction from approximately 45° to approximately 355°, and a significant increase in cave
air CO2. There were no measurable airflow events in Irelands Cave and Grassy Cove Cave, which
do not yet have sonic anemometers deployed at their monitoring stations. The results of this
cave-air CO2 monitoring study are useful in decision making regarding cave visitation, biological
monitoring, and management of the caves for listed species and species of concern.
Summary of Carbon Dioxide Monitoring in Three Balcones Canyonlands i
Conservation Plan Caves in Travis County, TexasTable of Contents
Abstract ............................................................................................................................................ i
Introduction .................................................................................................................................... 1
Project Need ................................................................................................................................ 1
Cave Ventilation .......................................................................................................................... 1
Carbon Dioxide Sources .............................................................................................................. 2
Setting ......................................................................................................................................... 3
Study Caves ................................................................................................................................. 5
Methods .......................................................................................................................................... 5
Results ............................................................................................................................................. 9
Discussion...................................................................................................................................... 17
Seasonal Ventilation.................................................................................................................. 17
Diurnal Ventilation and Cave Air CO2 and Response to Warm/Cold Front Events ................... 18
Literature Cited ............................................................................................................................. 20
List of Figures
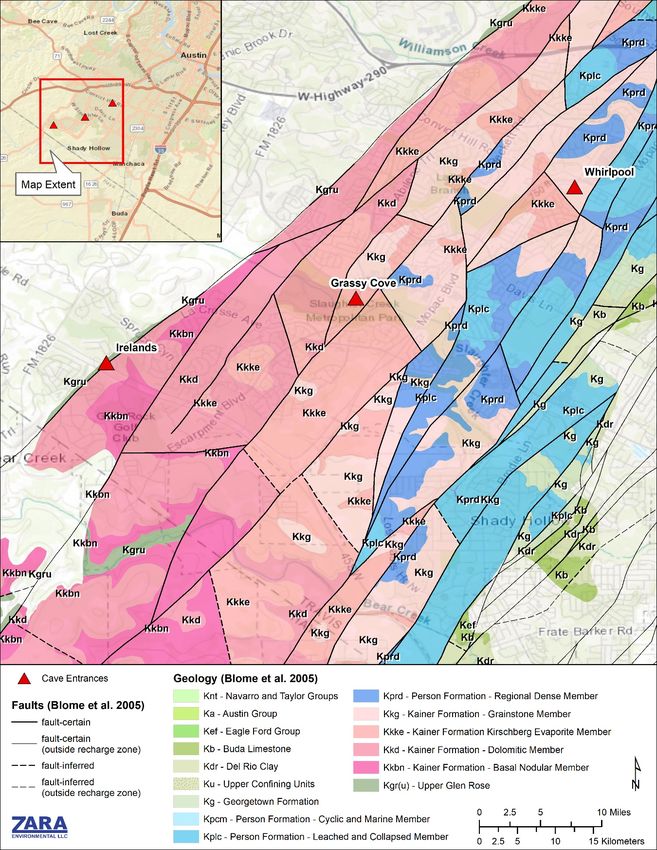
Figure 1. Project area overview showing the location of caves and surface geology. ................... 4
Figure 2. Location of the cave-air monitoring station in Whirlpool Cave....................................... 6
Figure 3. Location of the cave-air monitoring station in Grassy Cove Cave. .................................. 7
Figure 4. Location of the cave-air monitoring station in Ireland’s Cave......................................... 7
Figure 5. 1-year time series data of CO2 concentration in Whirlpool Cave, Grassy Cove Cave, and
Irelands Cave compared to temperature and barometric pressure. Magenta lines
represent NOAA surface data from the Camp Mabry Station (NOAA 2021); orange lines
represent data from a transducer deployed outside of Grassy Cove Cave in April 2020.
Some time intervals are missing from all three caves due to monitoring equipment
failures. ........................................................................................................................... 10
Figure 6. Surface air pressure, temperature, and cave air CO2 measured in Whirlpool Cave and
Irelands Cave, Grassy Cove Cave, and Whirlpool Cave in August 2020. Data show a clear
diurnal signal in CO2 increases for Grassy Cove and Whirlpool caves with significantly
less CO2 variability in Irelands Cave................................................................................ 11
Summary of Carbon Dioxide Monitoring in Three Balcones Canyonlands ii
Conservation Plan Caves in Travis County, TexasFigure 7. Representative cave-air CO2 concentrations at Irelands Cave, Whirlpool Cave, and
Grassy Cove Cave during the warm season. Temperature and atmospheric pressure data
from NOAA (2021). ......................................................................................................... 12
Figure 8. Representative cave-air CO2 concentrations at Irelands Cave, Whirlpool Cave, and
Grassy Cove Cave during the cool season. Temperature and atmospheric pressure data
from pressure transducer deployed at Grassy Cove Cave surface station. ................... 13
Figure 9. Atmospheric pressure, temperature, and cave-air CO2 concentrations at Whirlpool Cave,
Irelands Cave, and Grassy Cove Cave during a high-pressure front. Data gaps in
Whirlpool Cave represent data points where measured CO2 was below 410 ppm; thus,
those points were removed in the data quality control process (see methods section).
However, these gaps can be interpreted as “low CO2” time periods. ........................... 16
Figure 10. Cave air CO2, airflow gust velocity, and airflow direction in Whirlpool Cave during
diurnal ventilation events. Airflow data was measured by a sonic anemometer installed
in late 2020. .................................................................................................................... 17
List of Tables
Table 1. Summary of CO2 concentration measurements at Irelands Cave, and temperature and
pressure measured at Camp Mabry in Austin, Texas (cold season) and by a pressure
transducer deployed at Grassy Cove Cave (warm season). A period representative of
cold1 and warm2 season cave CO2 fluctuations was chosen for statistical analysis. CO2
data was not available for the following date ranges: 11/14/19-11/26/19; 3/12/20-
4/16/20; 8/23/20-10/16/20. ......................................................................................... 14
Table 2. Summary of CO2 concentration measurements at Whirlpool Cave, and temperature and
pressure measured at Camp Mabry in Austin, Texas (cold season) and by a pressure
transducer deployed at Grassy Cove Cave (warm season). A period representative of
cold1 and warm2 season cave CO2 fluctuations was chosen for statistical analysis. CO2
data was not available for the following date ranges: 3/18/20-4/16/20; 4/17/20-
7/28/20. .......................................................................................................................... 14
Table 3. Summary of CO2 concentration measurements at Grassy Cove Cave, and temperature
and pressure measured at Camp Mabry in Austin, Texas (cold season) and by a pressure
transducer deployed at Grassy Cove Cave (warm season). A period representative of
cold1 and warm2 season cave CO2 fluctuations was chosen for statistical analysis. CO2
data was not available for the following date ranges: 11/8/19-11/13/19; 11/19/19-
1/24/20; 8/24/20-9/24/20. ............................................................................................ 14
Summary of Carbon Dioxide Monitoring in Three Balcones Canyonlands iii
Conservation Plan Caves in Travis County, TexasIntroduction
Project Need
Many caves in central Texas are known to have high concentrations of carbon dioxide (CO2),
which can be dangerous to humans in high concentrations, and may impact the cave ecosystem
in both positive and negative ways. Several Balcones Canyonlands Preserve (BCP) caves are open
to the public for educational tours; therefore, it is important to understand better how cave-air
CO2 concentrations fluctuate in these caves so that public tours can be scheduled to maximize
visitor comfort and safety. Most BCP caves also contain federally listed endangered species and
species of concern that are protected under the Balcones Canyonlands Conservation Plan (BCCP),
which requires ongoing research and management of BCCP caves for the protection of the
covered species. To better understand how caves ventilate and how cave-air CO2 fluctuates,
cave-air CO2 concentration and cave wind speed and direction was monitored continuously in
three BCCP permit caves beginning in October 2017. This report summarizes the findings of the
third year of data collection (October 2019-November 2020) from Whirlpool Cave, Grassy Cove
Cave, and Irelands Cave; and offers suggestions for future research that could help improve
management of all BCP caves, both for the protection of BCCP listed species and the comfort and
safety of educational tour groups.
Cave Ventilation
Caves within the central Texas region are known to ventilate (Cowan et al. 2013), both seasonally
and daily, often with significant volumes of cave air expelled and significant volumes of surface
air flowing in. The daily ventilation is caused by diurnal fluctuations of barometric pressure, also
known as the “barometric tide.” Caves in central Texas often ventilate a greater amount of air
when storms or pressure fronts move through the region, causing a significant change in
barometric pressure (Cowan 2010). The concentration of CO2 in cave air is affected heavily by
cave ventilation. Cave ventilation and CO2 fluctuation vary from cave to cave in central Texas,
likely due to factors such as cave volume, site geology, anthropogenic modifications, and the
timing and rate of CO2 input (Breeker et al. 2012, Cowan 2010).
Cave ventilation is an important control on cave-air CO2 concentrations, both seasonally and on
shorter timescales, and is dependent on multiple factors including fluctuation of the outside air
temperature and barometric pressure, cave geometry, and prevailing winds (Villar et al. 1985;
Fernandez et al, 1986; Hoyos et al. 1998; Buecher 1999; Bourges et al. 2001; Spotl et al. 2005;
Baldini et al. 2006; Denis et al. 2005; Bourges et al. 2006; Baldini et al. 2008; Kowalczk and
Froelich 2010). At mid-latitudes like central Texas, density differences between cave air and
atmospheric air caused by seasonal temperature variability exert a first-order control on the
seasonal ventilation of caves (James and Banner 2008). In many caves, seasonal air temperature
varies by only a few degrees (Moore & Sullivan 1997); thus, cave ventilation is primarily
controlled by surface air temperature and barometric pressure fluctuations (Fairchild et al. 2006).
During warmer months, cave air temperatures remain below atmospheric temperature, causing
the cooler, denser cave air to stagnate and allowing CO2 to build up. The cave can be thought of
as a semi-closed system during this time as ventilation is less efficient. As long as CO2 sources are
Summary of Carbon Dioxide Monitoring in Three Balcones Canyonlands 1
Conservation Plan Caves in Travis County, Texaspresent (e.g., degassing of drip water or gas advection through fractures), the concentration of
CO2 in the cave air will continue to rise until CO2 inputs reach equilibrium with CO2 outputs due
to ventilation. When cave air temperatures are warmer than outside temperatures, the cave air
becomes unstable with respect to the outside air, and ventilation becomes more efficient as the
denser outside air flows into the cave, mixing with and displacing the CO2-rich cave air and
causing CO2 levels within the cave to decrease. This process only applies to caves whose primary
volume is lower in elevation than its entrance.
The intensity of cave ventilation is influenced by cave geometry (e.g. vertical vs. horizontal, large
passages vs. numerous constrictions), density differences between the cave air and outside air,
distance from the cave entrance, connectivity with the surface via pores and fracture networks
(primarily governed by the stratigraphic occurrence of the cave), and cave volume (Batiot-Guilhe
et al. 2007). In general, stronger ventilation occurs at sites near the cave entrance and at sites
that are not separated from the entrance by constrictions (Bourges et al. 2006). Where
ventilation is limited by constrictions or distance from the entrance, CO2 levels may remain
relatively constant or continue to increase as a function of the rate of CO2 input.
Diurnal ventilation is caused by barometric tides that have a periodicity of 12 and 24 hours, with
the 24-hour fluctuations being the strongest (Melcior 1993, Wallace and Hobbs 2006). As
barometric pressure increases, the pressure differential between the atmosphere and cave air
forces outside air, with a lower CO2 concentration (~390 ppm), into the cave and dilutes the high-
CO2 cave air causing a decrease in the CO2 concentration. When barometric pressure decreases,
the pressure differential reverses, and air flows out of the cave, drawing higher CO2 air from
deeper within the cave toward the entrance and causing overall CO2 concentration to increase.
Evidence of such cave breathing and diurnal CO2 fluctuations have been observed in Texas
(Cowan 2010), Florida (Kowalczk and Froelich 2010), Spain (Duenas et al. 2005, Fernandez-Cortes
et al. 2009), and France (Bourges et al. 2006, Perrier and Richon 2010).
Carbon Dioxide Sources
Known sources of cave-air CO2 include decomposition of soil organic matter, root respiration, in-
cave decomposition of organic matter, diffusion from deep sources, animal respiration, and
degassing from CO2-rich groundwater (Troester and White 1984, Ek and Gewalt 1985, Hanson et
al. 2000, Baldini et al. 2006, Bourges; et al. 2001, Batiot-Guilhe et al. 2007, Crossey et al. 2006).
The majority of CO2 in the caves within the study area advects or diffuses into the caves from
soils as a gas, rather than being transported in aqueous solution via cave drips (Breeker et al.
2012). According to carbon isotopic values measured by Breeker et al. 2012, the majority of the
CO2 advecting and diffusing into the study area caves is derived from the respiration of deeply
rooted vegetation. The rate of vegetative respiration is affected by changes in soil temperature
and soil moisture, and the highest CO2 production often occurs in warm months and when soils
are moist (Amundson and Smith 1988, Daly et al. 2008, Lloyd and Taylor 1994, Raich and
Schlesinger 1992). Others have also recognized advection and/or diffusion of vadose zone air
through fractures, cracks, and dissolution cavities as a significant means of transporting CO2 to
the cave atmosphere (Baldini et al. 2006, Batiot-Guilhe et al. 2007, Perrier and Richon 2010).
Summary of Carbon Dioxide Monitoring in Three Balcones Canyonlands 2
Conservation Plan Caves in Travis County, TexasOther less significant sources of cave-air CO2 in the study area may include degassing from vadose
water, decaying organic material, degassing of phreatic water, and animal respiration.
The concentration of CO2 in vadose water is heavily influenced by the concentration of CO2 in the
soil air. As water flows through the soil zone, it becomes enriched in CO2 until the partial pressure
of CO2 (pCO2) of the water is equal to the pCO2 of the soil, or the water flows out of the soil zone.
When CO2-charged water comes into contact with a lower pCO2 environment (i.e., a cave), CO2
degassing occurs, and the air within that environment becomes slightly more CO2-rich.
CO2 generated from decaying organic material within caves may be a significant source for caves
that collect detritus or bat guano. The significance of this contribution of CO2 is likely to vary,
depending on the ability of a given cave to capture storm-washed debris or the presence of a
significant bat population. Overland flows of water into caves, sinkholes, or soil piping features
are required for a significant amount of organic debris to enter the monitored caves. Only
Irelands Cave receives significant amounts of organic debris via overland storm flow.
Degassing of CO2 from phreatic water is another potential source within caves, especially where
cave passages intersect the water table. Degassing occurs when high-pCO2 phreatic water comes
in contact with lower-pCO2 air and will continue until the water reaches equilibrium with the air
or until removed from the low-pCO2 environment (i.e., flowing into a sump). Contribution of CO2
from degassing of phreatic water will likely vary seasonally and in response to recharge events.
Degassing of phreatic water may be a more significant source of CO2 in Irelands Cave as the cave
was formed along a fault that forms the border between Trinity Aquifer rock units and Edwards
Aquifer rock units.
Setting
The study area is located near Austin, Texas (Figure 1), and is composed of karstified Lower
Cretaceous marine carbonates overlain by a thin calcareous clay soil that supports oak and
juniper savannah. Soils across the study area are thin and commonly contain limestone fragments
sourced from the underlying bedrock (Cooke et al. 2007). Grassy Cove Cave and Whirlpool Cave
are within Edwards Group rocks, and Irelands Cave is located at the contact between Edwards
Group rocks and the Upper Glen Rose Formation. The Edwards Group consists of highly karstified
limestone, dolostone, and chert units within which caves are commonly formed. Certain
members of the Edwards Formation are known for extensive cave formation (Hauwert 2009),
including the Kirschberg Member, within which much of Whirlpool Cave and Grassy Cove Cave
are formed. The Dolomitic Member, within which Irelands Cave is formed, is known for cave
development along bedding planes and fractures. The Glen Rose Formation is a shallow marine
unit formed in the Cretaceous period, which is exposed over a large area from south-central to
north-central Texas. The Upper Trinity Aquifer is formed in the upper member of the Glen Rose
Formation and yields small quantities of highly mineralized water. Some caves are known to form
in the upper Glen Rose, especially at the contact between the overlying Edwards Group and
upper Glen Rose (Clark 2003). Notably, Natural Bridge Caverns is formed at this contact.
Summary of Carbon Dioxide Monitoring in Three Balcones Canyonlands 3
Conservation Plan Caves in Travis County, TexasFigure 1. Project area overview showing the location of caves and surface geology.
Summary of Carbon Dioxide Monitoring in Three Balcones Canyonlands 4
Conservation Plan Caves in Travis County, TexasStudy Caves Whirlpool Cave is approximately 22,000 cubic feet (ft3) in volume and is formed in the Grainstone and Kirschberg members of the Edwards Limestone. After entering Whirlpool Cave, the passage quickly descends approximately 33 ft though the less-permeable Grainstone member. The cave passage then enters the Kirschberg member and become relatively wide and horizontal. Most of the cave volume is formed within the Kirschberg Member. Grassy Cove Cave is approximately 13,200 ft3 in volume and is formed mostly within the Kirschberg member near the contact with the underlying Dolomitic Member. Some passages extend into the Dolomitic member via pits located in the floor of the cave passage formed along vertical fractures. The passages formed in the Dolomitic Member are somewhat laterally extensive but tend to pinch out and become impassable. Irelands Cave is approximately 41,100 ft3 in volume and is formed along a fault contact of the Upper Glen Rose Formation and the Dolomitic Member of the Edwards Group. Much of the cave is formed in the Dolomitic Member of the Edwards Group. Methods Cave-air CO2 concentrations were measured at one station within Whirlpool Cave, Grassy Cove Cave, and Irelands Cave (Figure 2, Figure 3, and Figure 4, respectively) with Vaisala GM70 hand- held CO2 meters logging at 3-hour intervals. This logging interval was selected to collect the maximum amount of data given limitations of battery life of hand-held meters and approximately 1-month frequency of visits to Whirlpool Cave Irelands Cave. Cave-air CO2 measurements in Grassy Cove Cave were collected using a Vaisala GMP252 CO2 meter connected a surface station via a communication cable run through a borehole. Signal output from the CO2 meter was converted to analog output using a Vasiala Indigo 201 Analog Output transmitter and logged at 5-minute increments using a DL4000 Universal Data Logger. A solar array and two-12V deep cycle marine batteries provided continuous power to the Grassy Cove surface station, allowing a much smaller logging interval than the hand-held meters deployed at Whirlpool Cave and Irelands Cave. Vaisala CO2 meters measure CO2 concentration using infrared absorption technology as air diffuses into the probe chamber. Accuracy is within +/- 20 ppm CO2 or 2% of the reading, whichever is larger, and long-term stability is
Figure 2. Location of the cave-air monitoring station in Whirlpool Cave

                         Summary of Carbon Dioxide Monitoring in Three Balcones Canyonlands     6
                                              Conservation Plan Caves in Travis County, Texas
Figure 3. Location of the cave-air monitoring station in Grassy Cove Cave.
Figure 4. Location of the cave-air monitoring station in Ireland’s Cave.
Summary of Carbon Dioxide Monitoring in Three Balcones Canyonlands 7
Conservation Plan Caves in Travis County, TexasReadings below 405 ppm are likely erroneous as this value represents the average atmospheric
CO2 concentration for the duration of the study as measured by the National Oceanic and
Atmospheric Administration (NOAA) at a network of globally distributed monitoring sites
(www.ncdc.gov). However, photosynthetic and anthropogenic factors may slightly alter the local
atmospheric CO2 concentration. A study of the temporal and spatial variability of CO2
concentrations in Essen, Germany (comparable in size to Austin, Texas) reveals that local
atmospheric variability is small (+/- 50 ppm) and typically within the error of the meters
(Henninger 2008). Therefore, readings as low as 355 ppm were included in the analyses.
Occasionally, CO2 concentration values >100 ppm below atmospheric (approximately 405 ppm)
or well above the typical range for the cave environment (>32,000 ppm) were recorded. These
values typically occurred as single point outliers such that natural processes could not explain the
rate of CO2 increase or decrease; these values are considered erroneous and are not considered
herein. Erroneous readings were likely due to a variety of reasons, including electronics failure,
human or animal tampering, and (most often) condensation on the probe tip due to the high
humidity cave environment. Such condensation interferes with infrared absorption readings that
the meters use to calculate CO2 concentrations. A small number of erroneous data points are
typical of Vaisala meters deployed in caves; however, if a significant number (>10) of erroneous
values were recorded during the deployment of a meter, all data from that deployment are
considered unreliable and are not reported here.
Cave wind speed velocity and wind direction were measured in at all three caves by deploying a
034B-L Anemometer and Vane set, manufactured by Cambell Scientific. These measurement
devices were deployed at the same location in the Caves as the CO2 sensors. Wind speed and
direction data were logged using an CR 300 data logger, manufactured by Cambell Scientific
Incorporated. To-date the only measurable wind speed events have occurred in Whirlpool Cave
during the two-year data collection period, and no measurable airflow has been reported from
Irelands Cave and Grassy Cove Cave.
The CR 300 logger at Whirlpool Cave failed in April 2020, causing a data gap from April-late July
2020. In October 2020 the logger was replaced, and a new ATMOS-22 Sonic Anemometer was
deployed in place of the mechanical wind vane. The sonic anemometer is likely better suited for
cave deployment because it provides more accurate air-flow measurements at low velocity
ranges typical of cave environments, and does not have any moving mechanical parts which may
be affected by the high-humidity cave environment. Data was collected from the sonic
anemometer in Whirlpool Cave from October-November 2020 and is included in this report. The
CR 300 logger in Irelands Cave failed in August 2020 and will be replaced in early 2021. Also, the
wind vanes currently deployed in Grassy Cove Cave and Irelands Cave will be replaced with sonic
anemometers in 2021 to provide better quality airflow data.
Weather data from October 2019-April 2021 was obtained from a National Oceanic and
Atmospheric Administration (NOAA) weather station located at Camp Mabry in Austin, Texas
(COOPID: 410428), located approximately 14 km north of Whirlpool Cave (NOAA 2021). In April
2020 a HOBO U20 pressure transducer was deployed at the Grassy Cove Cave surface station in
Summary of Carbon Dioxide Monitoring in Three Balcones Canyonlands 8
Conservation Plan Caves in Travis County, Texasorder to provide atmospheric pressure and temperature measurements closer to the study area. Both datasets are presented in this report. Excel was used to collate and organize CO2, airflow, and weather data. Grapher 17 by Goldenware was used to generate time series graphs over different time periods. Representative warm and cold season periods were selected for each cave for analysis. Results Diurnal, seasonal, and pressure-front-related CO2 concentration fluctuations were observed in all three caves during the 2020 data collection period (Figure 5). Diurnal fluctuations in cave air CO2 concentrations differed significantly between all three caves, and the duration and magnitude of fluctuations varied depending on time of year. Figure 6 presents data from a representative timeframe in early August 2020 when all three caves were showing diurnal fluctuations corresponding to diurnal fluctuations in atmospheric pressure and temperature. Irelands Cave showed the least amount of diurnal fluctuation (20,000 and
Figure 5. 1-year time series data of CO2 concentration in Whirlpool Cave, Grassy Cove Cave,
and Irelands Cave compared to temperature and barometric pressure. Magenta lines
represent NOAA surface data from the Camp Mabry Station (NOAA 2021); orange lines
represent data from a transducer deployed outside of Grassy Cove Cave in April 2020. Some
time intervals are missing from all three caves due to monitoring equipment failures.

                      Summary of Carbon Dioxide Monitoring in Three Balcones Canyonlands      10
                                           Conservation Plan Caves in Travis County, Texas
Figure 6. Surface air pressure, temperature, and cave air CO2 measured in Whirlpool Cave and Irelands
Cave, Grassy Cove Cave, and Whirlpool Cave in August 2020. Data show a clear diurnal signal in CO2
increases for Grassy Cove and Whirlpool caves with significantly less CO2 variability in Irelands Cave.
Summary of Carbon Dioxide Monitoring in Three Balcones Canyonlands 11
Conservation Plan Caves in Travis County, TexasFigure 7. Representative cave-air CO2 concentrations at Irelands Cave, Whirlpool Cave, and Grassy Cove
Cave during the warm season. Temperature and atmospheric pressure data from NOAA (2021).
Summary of Carbon Dioxide Monitoring in Three Balcones Canyonlands 12
Conservation Plan Caves in Travis County, TexasFigure 8. Representative cave-air CO2 concentrations at Irelands Cave, Whirlpool Cave, and Grassy Cove
Cave during the cool season. Temperature and atmospheric pressure data from pressure transducer
deployed at Grassy Cove Cave surface station.
Summary of Carbon Dioxide Monitoring in Three Balcones Canyonlands 13
Conservation Plan Caves in Travis County, TexasTable 1. Summary of CO2 concentration measurements at Irelands Cave, and temperature and pressure measured
at Camp Mabry in Austin, Texas (cold season) and by a pressure transducer deployed at Grassy Cove Cave (warm
season). A period representative of cold1 and warm2 season cave CO2 fluctuations was chosen for statistical analysis.
CO2 data was not available for the following date ranges: 11/14/19-11/26/19; 3/12/20-4/16/20; 8/23/20-10/16/20.
CO2 (ppm) Temperature (C) Pressure (kPa)
Cold Warm Cold Warm Cold Warm
Irelands Cave
min 740 6530 0.0 14.3 97.80 97.6
max 21530 29870 30.4 37.6 101.62 99.55
mean 4643 20948 13.3 28.0 99.54 98.51
SD 4706 2287 7.2 4.4 0.64 0.33
1
Cold: 11/08/2018–02/28/2019;
2
Warm: 06/11/2019–09/23/2019
Table 2. Summary of CO2 concentration measurements at Whirlpool Cave, and temperature and pressure measured
at Camp Mabry in Austin, Texas (cold season) and by a pressure transducer deployed at Grassy Cove Cave (warm
season). A period representative of cold1 and warm2 season cave CO2 fluctuations was chosen for statistical analysis.
CO2 data was not available for the following date ranges: 3/18/20-4/16/20; 4/17/20-7/28/20.
CO2 (ppm) Temperature (C) Pressure (kPa)
Cold Warm Cold Warm Cold Warm
Whirlpool Cave
min 410 410 0.0 14.3 97.80 97.6
max 9210 25560 30.4 37.6 101.62 99.55
mean 2100 5664 13.3 28.0 99.54 98.51
SD 1795 4043 7.2 4.4 0.64 0.33
1
Cold: 11/08/2018–02/28/2019;
2
Warm: 06/11/2019–09/23/2019
Table 3. Summary of CO2 concentration measurements at Grassy Cove Cave, and temperature and pressure
measured at Camp Mabry in Austin, Texas (cold season) and by a pressure transducer deployed at Grassy Cove
Cave (warm season). A period representative of cold1 and warm2 season cave CO2 fluctuations was chosen for
statistical analysis. CO2 data was not available for the following date ranges: 11/8/19-11/13/19; 11/19/19-1/24/20;
8/24/20-9/24/20.
CO2 (ppm) Temperature (C) Pressure (kPa)
Grassy Cove Cave
Cold Warm Cold Warm Cold Warm
min 412 1757 0.0 14.3 97.80 97.6
max 28430 32991 30.4 37.6 101.62 99.55
mean 13058 25209 13.3 28.0 99.54 98.51
SD 9520 7279 7.2 4.4 0.64 0.33
1
Cold: 11/08/2018–02/28/2019;
2
Warm: 06/11/2019–09/23/2019
Summary of Carbon Dioxide Monitoring in Three Balcones Canyonlands 14
Conservation Plan Caves in Travis County, TexasIn Irelands Cave and Grassy Cove Cave the standard deviation from mean CO2 levels was
significantly larger during the cold season than during the warm season, suggesting that
fluctuations in CO2 levels are higher in the cold season for these caves. Whirlpool Cave CO2 data
showed the opposite of this trend, with higher standard deviation in the warm season. However,
Whirlpool Cave CO2 monitoring equipment was down for much of June and July 2020, which may
reduce the quality of this statistical analysis.
CO2 concentrations in all three caves responded to weather events where barometric pressure
significantly increased or decreased (i.e., a cold front or warm front). Cave CO2 concentration
generally increased in response to decreasing barometric pressure and decreased in response to
increasing barometric pressure (Figure 9). The magnitude of CO2 fluctuations coinciding with
atmospheric pressure fronts was often larger than fluctuations associated with the diurnal
barometric tide.
There was limited cave airflow data available during the 2020 study period due to a data logger
failure in Whirlpool Cave, and the lack of measurable airflow events to-date in Grassy Cove Cave
and Irelands Cave. However, in late 2020 a new data logger was installed in Whirlpool Cave and
the wind vane was replaced with a sonic anemometer, which provides higher resolution airflow
data at low airflow velocities than the wind vane. The first round of data was collected from this
new measurement array in October-November 2020. An 8-day time period of this data is
presented in Figure 10 which showed regular airflow and airflow fluctuations throughout the
period of measurement. Wind gust velocity in the cave increased in response to increases in
atmospheric pressure, and had two distinctive directions: ~45° and ~355° azimuthal.
Summary of Carbon Dioxide Monitoring in Three Balcones Canyonlands 15
Conservation Plan Caves in Travis County, TexasFigure 9. Atmospheric pressure, temperature, and cave-air CO2 concentrations at Whirlpool Cave,
Irelands Cave, and Grassy Cove Cave during a high-pressure front. Data gaps in Whirlpool Cave
represent data points where measured CO2 was below 410 ppm; thus, those points were removed
in the data quality control process (see methods section). However, these gaps can be interpreted
as “low CO2” time periods.
Summary of Carbon Dioxide Monitoring in Three Balcones Canyonlands 16
Conservation Plan Caves in Travis County, TexasFigure 10. Cave air CO2, airflow gust velocity, and airflow direction in Whirlpool Cave during diurnal
ventilation events. Airflow data was measured by a sonic anemometer installed in late 2020.
Discussion
Seasonal Ventilation
CO2 concentrations varied seasonally in all three caves during the 2020 data collection period,
with generally elevated CO2 concentrations in the warmer months and lower CO2 concentrations
in the cooler months. These seasonal CO2 fluctuations are attributed to seasonally variable cave
ventilation that is controlled in part by atmospheric temperature fluctuations. Cave-air CO2
concentrations are lowest in the cooler months due to stronger ventilation. In the cooler months,
when the outside air is denser than the cave air, lower CO2 outside air sinks into the cave and
mixes with the CO2 rich cave air causing a decrease in overall cave-air CO2 concentration. In the
warmer months, when the outside air is less dense, cave ventilation becomes much weaker and
Summary of Carbon Dioxide Monitoring in Three Balcones Canyonlands 17
Conservation Plan Caves in Travis County, Texasaverage CO2 concentration increases (Figure 5). Higher CO2 concentrations in the warmer months
are also likely influenced by increased soil respiration resulting from warmer temperatures.
Seasonal CO2 fluctuations in the three study area caves do not appear to be caused by
anthropogenic influences, including cave visitation. Whirlpool Cave receives significant visitation
as the City of Austin utilizes it for educational tours. If human visitation were causing seasonal
CO2 fluctuations, then we would expect to see seasonal fluctuations at Whirlpool Cave and no
seasonal CO2 fluctuations in Irelands Cave. Irelands Cave receives no visitation outside of this
study monitoring, and very infrequent biological monitoring conducted by BCP staff. However,
significant seasonal CO2 fluctuations were measured in all three caves.
Diurnal Ventilation and Cave Air CO2 and Response to Warm/Cold Front Events
Barometric tides dominate diurnal airflow into and out of caves, and generally flow out of the
caves from early morning (06:00-09:00 CST) to late afternoon (15:00-18:00 CST) and then
reverses direction, flowing into the caves from late afternoon to early morning. Barometric tides
are a well-known global phenomenon (Melcior 1993; Wallace and Hobbs 2006) which have been
shown to affect cave meteorology (Sondag et al. 2003, Bourges et al. 2006). As barometric
pressure increases, the pressure differential between the surface and cave forces outside air with
a lower CO2 concentration (~410 ppm) into the cave, displacing and diluting the higher CO2 cave
air, causing a decrease in cave-air CO2 concentrations. When barometric pressure decreases, the
pressure differential is reversed, and air flows out of the cave, drawing higher CO2 air from deeper
within the subsurface toward the entrance and causing cave-air CO2 concentrations to increase.
Deploying pressure transducers at the cave monitoring locations would possibly allow direct
measurement of differences between barometric pressure in caves and on the surface.
Low pressure and high pressure fronts are weather events typically accompanied by a significant
increase or decrease in temperature, respectively. The 2020 cave-air CO2 concentration
measurements showed distinct responses to these weather events in all three caves. Significant
decreases in CO2 concentration were observed in the caves coinciding with a high pressure front
in March 2020 (Figure 9). The magnitude of the CO2 decrease was significantly larger than those
observed during diurnal cave ventilation caused by the barometric tide. This suggests that
pressure fronts can cause significantly larger cave air CO2 responses than diurnal barometric tide-
driven responses. In response to low pressure fronts, Irelands Cave and Whirlpool Cave reached
significantly higher CO2 concentrations than Whirlpool Cave. The cause of different CO2
responses between Irelands Cave, Grassy Cove Cave, and Whirlpool Cave is a topic that warrants
further investigation.
Airflow data measured by a newly deployed sonic anemometer in Whirlpool Cave in late 2020
provides a previously unavailable dataset of cave air velocity and direction, because it has a
higher accuracy at low airflow velocities than the weather vane which was previously deployed.
In October-November 2020, the anemometer measured nearly continuous airflow over the study
period. Diurnal peaks in cave air velocity observed in Whirlpool Cave coincided with atmospheric
pressure increases associated with diurnal barometric tide (Figure 10). These diurnal peaks were
followed by air velocity drops which coincided with drops in atmospheric pressure, an abrupt
Summary of Carbon Dioxide Monitoring in Three Balcones Canyonlands 18
Conservation Plan Caves in Travis County, Texaschange in airflow direction from ~45° to ~355°, and rapid increases in cave-air CO2 concentration.
The ~355° bearing is aligned with a large cave passage which leads away from the entrance and
to a deeper section of the cave (Figure 2, Projected Profile A-A’), which implies that CO2 is being
drawn into the cave from this deeper passage. Deployment of sonic anemometers in Irelands
Cave and Grassy Cove Cave is planned for the 2021 data collection period, and should provide
additional insights on how cave airflow controls CO2 concentrations; and how cave airflow events
are controlled by both diurnal and weather-related atmospheric pressure fluctuations.
Summary of Carbon Dioxide Monitoring in Three Balcones Canyonlands 19
Conservation Plan Caves in Travis County, TexasLiterature Cited
Amundson, R.G. and Smith, V.S., 1988. Annual cycles of physical and biological properties in an
uncultivated and an irrigated soil in the San Joaquin Valley of California. Agriculture,
Ecosystems and Environment 20, 195-208.
Baldini, J.U., Baldini, L.M., McDermott, F., Clipson, N., 2006. Carbon dioxide sources, sinks, and
spatial variability in shallow temperate zone caves: Evidence from Ballynamintra Cave,
Ireland. Journal of Cave and Karst Studies 68, 4-11.
Baldini, J.U., McDermott, F., Hoffmann, D.L., Richards, D.A. and Clipson, N., 2008. Very high-
frequency and seasonal cave atmosphere PCO2 variability: Implications for stalagmite
growth and oxygen isotope-based paleoclimate records. Earth and Planetary Science
Letters 272, 118-129.
Batiot-Guilhe, C., Seidel, J., Jourde, H., Herbrard, O. and Bailly-Comte, V., 2007. Seasonal
variations of CO2 and 222Rn in a Mediterranean sinkhole-spring (Causse d'Aumelas, SE
France). International Journal of Speleology 36, 51-56.
Bourges, F., Mangin, A. and D’Hulst, D., 2001. Carbon dioxide in karst cavity atmosphere
dynamics: the example of the Aven d’Orgnac. Earth and Planetary Sciences 33, 685–692.
Bourges, F., Genthon, P., Mangin, A. and D’Hulst, D., 2006. Microclimates of L’Aven D’Orgnac and
other French limestone caves (Chauvet, Esparros, Marsoulas). International Journal of
Climatology 26, 1651-1670.
Breecker, D., Payne, A., Quade, J., Banner, J. L. Ball, C. and Cowan, B., 2012, The sources and sinks
of CO2 in caves under mixed woodland and grassland vegetation. Geochimica et
Cosmochimica Acta, Vol 96, 230.
Buecher, R.H., 1999. Microclimate study of Kartchner Caverns, Arizona. Journal of Cave and Karst
Studies 61, 108-120.
Clark, A.K. 2003. Geologic Framework and Hydrogeologic Features of the Glen Rose Limestone,
Camp Bullis Training Site, Bexar County, Texas. U.S. Geologic Survey Water-Resources
Investigations Report 03-4081.
Cooke, M.J., Stern, L.A., Banner, J.L. and Mack, L.E. 2007. Evidence for the silicate source of relict
soils on the Edwards Plateau, central Texas. Quaternary Research 67, 275-285.
Cowan, B.D., 2010. Temporal and spatial variability of cave-air carbon dioxide in central Texas,
USA. Master of Science Thesis, The University of Texas at Austin, Austin, Texas.
Cowan, B.D., Osborne, M.C. and Banner, J.L., 2013. Temporal variability of cave-air CO2 in central
Texas. Journal of Cave and Karst Studies, 75(1): 38.
Summary of Carbon Dioxide Monitoring in Three Balcones Canyonlands 20
Conservation Plan Caves in Travis County, TexasCrossey, L., Springer, A., Kalstrom, K., Newell, D., Atudorei, V., Fischer, T. and Hilton, D., 2006.
CO2 degassing in high volume springs in the Southern Colorado Plateau region-
Understanding deep inputs and geochemical mixing in regional groundwater. Geological
Society of America, Rocky Mountain Section-58th Annual Meeting, Abstracts with
Programs 38, 5.
Daly, E., Oishi, A.C., Porporato, A. and Katul, G.G., 2008. A stochastic model for daily subsurface
CO2 concentration and related soil respiration. Advances in Water Resources 31, 987-994.
Denis, A., Lastennet, R., Huneau, F. and Malaurent, P., 2005. Identification of functional
relationships between atmospheric pressure and CO2 in the cave of Lascaux using the
concept of entropy of curves. Geophysical Research Letters 32, 1.
Dueñas, C., Fernández, M., and Cañete, S., 2005. 222Rn concentrations and the radiation exposure
levels in the Nerja Cave. Radiation Measurements 40, 630-632.
Ek, C. and Gewalt, M., 1985. Carbon dioxide in cave atmospheres: New results in Belgium and
comparison with some other countries. Earth Surface Processes and Landforms 10, 173-
187.
Fairchild, I.J., Smith, C.L., Baker, A., Fuler, L., Spotl, C., Mattey, D., and McDermott, F., 2006.
Modification and preservation of environmental signals in speleothems. Earth-Science
Reviews 75, 105-52.
Fernandez, P.L., Gutierrez, I., Quindos, L.S., Soto, J. and Villar, E., 1986. Natural ventilation of the
Paintings Room in Altamira Cave. Nature 321, 586-588.
Fernandez-Cortes, A., Sanchez-Moral, S., Cuezva, S., Carols, J., Cañaveras, J.C., and Abella, R.,
2009. Annual and transient signatures of gas exchange and transport in the Castañar de
Ibor cave (Spain). International Journal of Speleology, 38, 153-162.
Hanson, P.J., Edwards N.T., Garten, C.T. and Andrews, J.A., 2000. Separating root and soil
microbial contributions to soil respiration: A review of methods and observations.
Biogeochemistry 48, 115-146.
Hauwert, N.M., 2009. Groundwater flow and recharge within the Barton Springs Segment of the
Edwards Aquifer, Southern Travis and Northern Hays Counties, PhD Thesis University of
Texas at Austin.
Henninger, S., 2008. Analysis of near surface CO2 variability within the urban area of Essen,
Germany. Meterologische Zeitschift 17, 19-27.
Hoyos, M., Soler, V., Canaveras, C., Sanchez-Moral, S. and Sanz-Rubio, E., 1998. Microclimate
characterization of a karstic cave: human impact on microenvironmental parameters of a
prehistoric rock art cave (Candamo Cave northern Spain). Environmental Geology 33, 231-
242.
Summary of Carbon Dioxide Monitoring in Three Balcones Canyonlands 21
Conservation Plan Caves in Travis County, TexasJames, E.W. and Banner, J.L., 2008. Preservation bias in speleothem proxy records due to
seasonal ventilation of caves. Geological Society of America, Abstracts with Programs,
583.
Kowalczk, A.J. and Froelich, P.N., 2010. Cave ventilation and CO2 outgassing by radon-222
modeling: how fast do caves breathe? Earth and Planetary Science Letters 289, 209-219.
Lloyd, J. and Taylor, J.A., 1994. On the temperature dependence of soil respiration. Functional
Ecology 8, 315-323.
Melcior, P.J. 1993. The Tides of Planet Earth (2nd ed.) Pergamon Press: New York, NY.
Moore, G.W. and Sullivan, N., 1997. Speleology: Caves and the cave environment (3rd ed.). Cave
Books, St. Louis, MO.
National Centers for Environmental Information (NOAA). 2021. Data download from the
Integrated Surface Database. Accessed online January 2021
Perrier, F. and Richon, P., 2010. Spatiotemporal variation of radon and carbon dioxide
concentrations in an underground quarry: coupled processes of natural ventilation,
barometric pumping and internal mixing. Journal of Environmental Radioactivity in press,
1-18.
Raich, J.W. and Schlesinger, W.H., 1992. The global carbon dioxide flux in soil respiration and its
relationship to vegetation and climate. Tellus 44B, 81-99.
Sondag, F., Ruymbeke, M., Soubies, F., Santos, R., Somerhausen, A., Seidel, A. and P. Boggiani,
2003. Monitoring present day climatic conditions in tropical caves using an Environmental
Data Acquisition System (EDAS). Journal of Hydrology 273, 103-118.
Spotl, C., Fairchild, I.J. and Tooth, A.F., 2005. Cave air control on drip water geochemistry, Obir
Caves (Austria): Implications for speleothem deposition in dynamically ventilated caves.
Geochimica et Cosmochimica Acta 69, 2451-2468.
Troester, J.W. and White, W.B., 1984. Seasonal fluctuations in the carbon dioxide partial pressure
in a cave atmosphere. Water Resources Research 20, 153-156.
Villar, E., Fernandez, P.L., Quindos, L.S. and Soto, J., 1985. Natural temporal evolution of the CO2
content in the air of the “Paintings Chamber” at Altamira Cave. National Speleological
Society Bulletin 13, 12-16.
Wallace, J.M. and P.V. Hobbs, 2006. Atmospheric Science an Introductory Survey (2nd ed.) Elsevier
Academic Press: Burlington, MA.
Summary of Carbon Dioxide Monitoring in Three Balcones Canyonlands 22
Conservation Plan Caves in Travis County, TexasYou can also read