Government data confirm that wolves have a negligible effect on U.S. cattle & sheep industries - The Humane Society of the United States
←
→
Page content transcription
If your browser does not render page correctly, please read the page content below
Government data confirm that wolves have a
                           negligible effect on U.S. cattle & sheep industries
In the United States, data show that wolves ( Canis lupus, Canis lupus baileiy and Canis rufus) kill few cattle
and sheep. Livestock predation data collected by various governmental bodies differ significantly,
however. The most recent data published by the U.S. Department of Agriculture-Animal and Plant Health
Inspection Service (USDA)1 indicate losses many times greater than those collected by states and the
U.S. Fish and Wildlife Service (FWS). In the Northern Rocky Mountains, for instance, the USDA claims
wolves killed 4,360 cattle in 2015, while the FWS verified only 161 such losses. The USDA’s methodology
involves collecting data from a few, mostly unverified sources, which the USDA then extrapolated
statewide without calculating standard errors or using models to test relationships among various
mortality factors.2 This contravenes the scientific method and results in exaggerated livestock losses
attributed to native carnivores and dogs. Unfortunately, this misinformation informs public policies that
harm native carnivores, including helping to fuel countless legislative attacks on wolves, grizzly bears
and the Endangered Species Act by Congress.

The Humane Society of the United States analyzed the USDA’s embellished predation numbers. Their
data show that farmers and ranchers lose nine times more cattle and sheep to health, weather, birthing
and theft problems than to all predators combined. In the USDA reports, “predators” include mammalian
carnivores (e.g., cougars, wolves and bears), avian carnivores (e.g., eagles and hawks) and domestic dogs.
Domestic dogs, according to the USDA’s data, kill 100 percent more cattle than wolves and 1,924 percent
more sheep. According to the USDA, in the states where wolves live, they cause far fewer than one percent
of unwanted cattle-calf (hereinafter “cattle”) and sheep-lamb (hereinafter “sheep”) losses by inventory.

We present our analysis of the USDA’s data sets on cattle and sheep deaths in wolf-occupied states and
wolves’ effects on the national cattle and sheep industries. We compare the USDA’s data to those of other
governmental bodies that also collect this information, which corroborates our findings that while the
USDA’s predation figures are significantly exaggerated, they are nominal when compared to livestock
mortalities from health, weather, theft and birthing problems (we refer to these livestock losses as
“maladies”). We describe humane, efficacious and cost-effective non-lethal methods for cattle and sheep
protection, and show that only a fraction of cattle and sheep growers in wolf-occupied states use non-
lethal methods to protect their herds—even as numerous published scientific studies have found that
non-lethal methods to protect non-native cattle and sheep from native carnivores are more efficacious
and cost effective than the constant slaughter of wildlife that is ubiquitously employed—even on federally
protected species.

I. Gray wolves’ legal status under the Endangered Species Act varies across their range

Wolves in Minnesota are listed as "threatened." Wolves in Idaho, Montana, Wyoming, and the eastern portions of
Washington and Oregon are not federally listed following a 2011 act of Congress directing the reissuance of a delisting
rule previously overturned in federal court. Wolves across the rest of the lower-48 states remain protected as
"endangered." Since 2007, FWS has made multiple unsuccessful attempts to delist wolves in the Western Great Lakes
states, where wolves presently range in Minnesota, Wisconsin, and Michigan. Courts have consistently struck down
these delisting efforts as inconsistent with the ESA, most recently in a 2017 opinion by the D.C. Circuit Court of Appeals
in a case brought by HSUS. Humane Society of the United States v. Zinke, 865 F.3d 585 (D.C. Cir 2017).
Dated: Mar. 6, 2019
2

II. USDA data show most cattle and sheep die from health, weather and other maladies

USDA reports show that the primary causes of cattle and sheep losses in the U.S. come from health problems, weather,
theft, and other maladies, but not from wild native carnivores, including wolves. 3 USDA data show that nine times more
cattle and sheep died from maladies such as illness, birthing problems, weather, poisoning, and theft (3,990,035), than
from all mammalian or avian predators together (474,965). Of the 119 million cattle and sheep inventoried in the U.S.
in 2014 and 2015, fewer than one percent (0.4 percent) died from mammalian and avian predators combined. Figs. 1
and 3. Of the total unwanted cattle deaths in wolf states, between 86 percent and 98 percent came as a result of maladies.
Fig. 5b.

        A. Despite being inflated, USDA data show that few cattle die from wolves, other native carnivores or dogs

In 2015 the USDA inventoried 112.2 million cattle in the U.S.4 Of that number, 4.5 million died from all unwanted causes.
Most of those deaths, 3.6 million (3.2 percent of U.S. cattle inventory) stemmed from health-related maladies, weather,
and theft. Mortalities from all predators amounted to 280,570 cattle deaths, representing a mere 0.3 percent of U.S.
cattle inventory—with wolves taking 0.009 percent of the U.S. cattle inventory. Figs. 1 and 2.
3

PHOTO BY: GLENN NAGEL
4
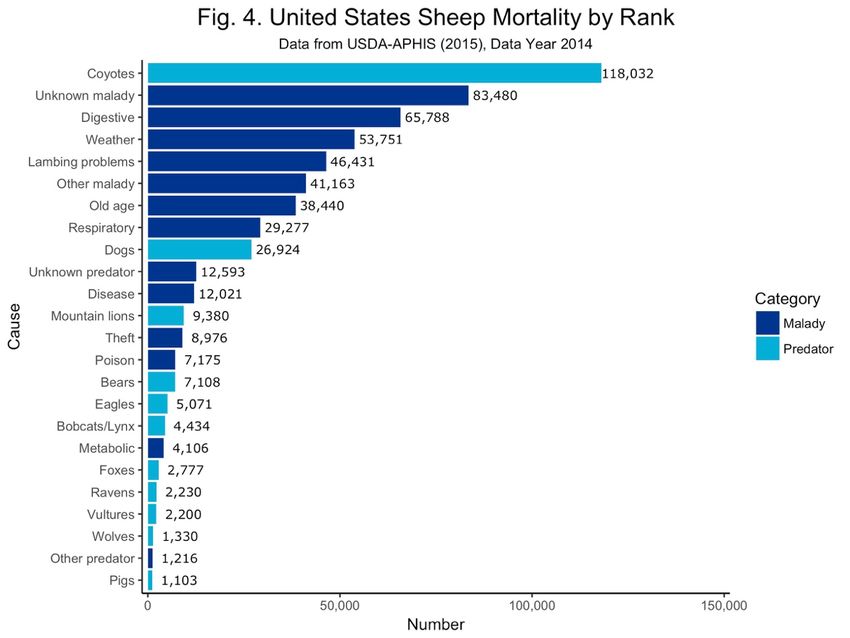
B. Despite being inflated, USDA data show that few sheep die from wolves, other native carnivores or
dogs
In 2015, the U.S. sheep inventory amounted to 6.8 million individuals. Health, weather, poison, theft, and other maladies
were responsible for the majority of ranchers and farmers’ losses: 390,605 sheep deaths (5.7 percent of the U.S. sheep
inventory). In comparison, mammalian carnivores, raptors and domestic dogs killed 194,395 sheep, or 2.9 percent of the
U.S. sheep inventory, with wolves’ contributions amounting to 0.01 percent of the U.S. sheep inventory.5 Fig. 3 and 4.
Predation of sheep is greater than of cattle, likely because sheep have smaller body size and lack predator-avoidance
skills.6 Despite this, the USDA’s data show few sheep growers use non-lethal methods to protect their flocks (see: Figs.
29 and 30 below).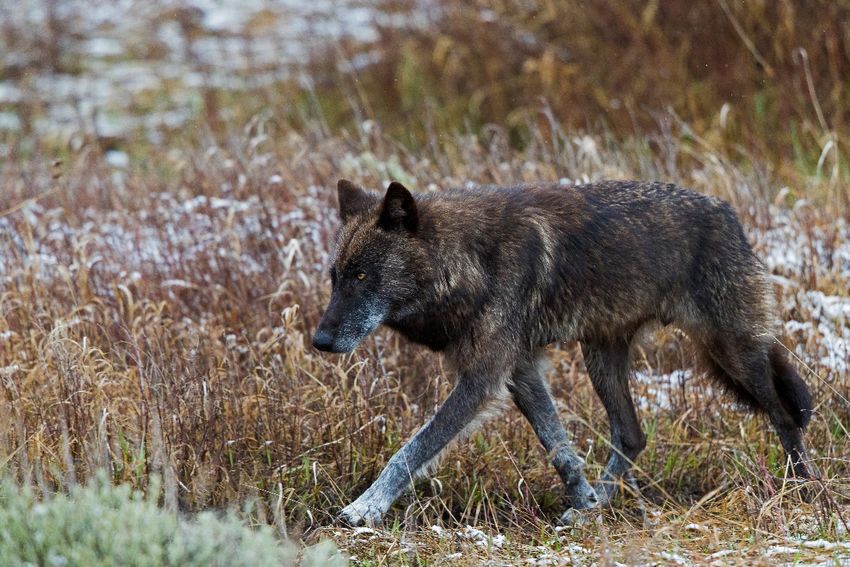
5
III. Even in wolf-occupied states, USDA’s data show nominal losses of cattle and sheep to predators
• Gray wolves (Canis lupus) in the Great Lakes States (Michigan, Minnesota and Wisconsin). The USDA
found that wolves killed 3,879 cattle (2015) and sheep (2014) from an inventory of 8.7 million cattle and sheep.
In other words, wolves killed 0.04 percent of the cattle and sheep inventories in the Great Lakes states and were
allegedly responsible for just 0.89 percent of unwanted losses. Figs. 1-12. Maladies accounted for more than 96
percent of unwanted losses. Fig. 5b. Data from these three states’ wildlife departments, however, show far fewer
losses by wolves than do the USDA’s data. See section V.
• Gray wolves (Canis lupus) in the Northern Rocky Mountains (Idaho, Montana, Oregon, Washington and
Wyoming). The USDA found that wolves killed 4,948 cattle (2015) and sheep (2014) from an inventory of 13.6
million. In other words, wolves killed 0.04 percent of the cattle and sheep inventories in the Northern Rocky
Mountain states and were allegedly responsible for just 1.22 percent of unwanted losses. Figs. 1-6b and 13-22.
Maladies accounted for more than 87 percent of unwanted losses. Fig. 5b. Data from the FWS show far fewer
losses from wolves than do the USDA’s data. See section VI.
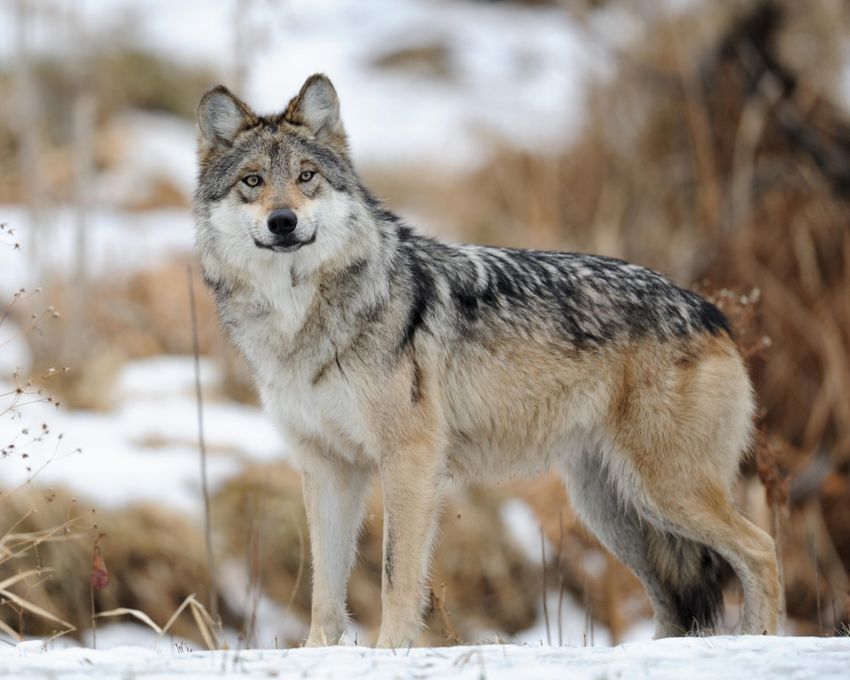
• Mexican gray wolves (Canis lupus baileiy) inhabit the Southwest desert (Arizona and New Mexico). The
USDA data show approximately 100 Mexican wolves allegedly killed 1,132 cattle (2015) and sheep (2014) out of
an inventory of 3.1 million total animals, or 0.04 percent of the cattle and sheep inventory in Arizona and New
Mexico. These figures show that wolves were allegedly responsible for just 0.83 percent of unwanted losses in
Arizona and New Mexico. Figs. 1-6b and 23-26. Maladies accounted for more than 86 percent of unwanted losses.
Fig. 5b. On the other hand, humans killed a record number of endangered Mexican wolves in 2018 in numbers
far out of proportion to the alleged livestock losses.7
• Red wolves (Canis rufus) of North Carolina killed no cattle (2015) or sheep (2014). Figs. 5a – 6b.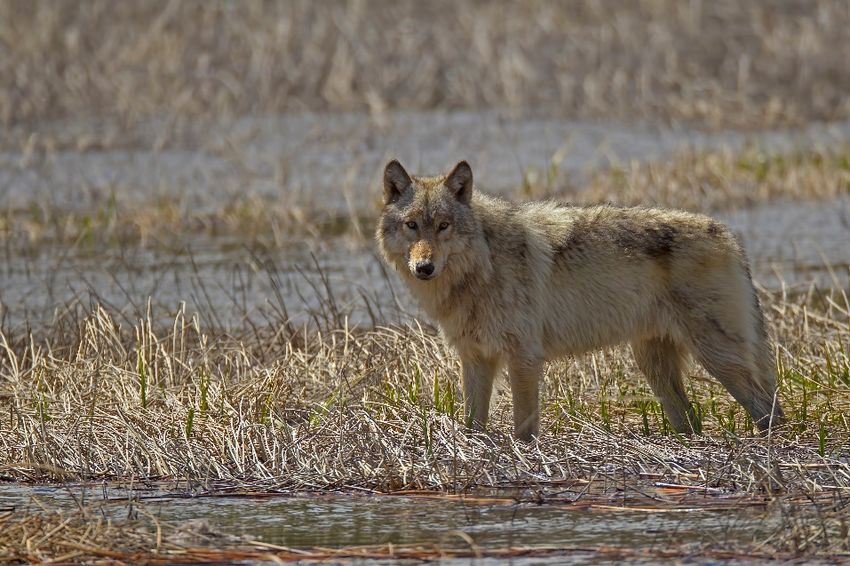
6

                                                      Fig. 5a.
                                U.S. Cattle Inventory Losses by Cause and by State
            (Unverified data, USDA-Animal and Plant Health Inspection Service, 2017 (Data year 2015))
                                 Cattle losses from maladies
                                                                  Cattle losses from all predators      Cattle losses from wolves
                Cattle        (illness, birthing problems, etc.)
 States
              inventory                       Percent of cattle                  Percent of cattle                 Percent of cattle
                               Number                              Number                             Number
                                                  inventory                         inventory                         inventory
                                                         Great Lakes wolf states
MI              1,345,000          66,002                 4.91%         1001                 0.07%         350                 0.03%
MN              2,710,000         125,020                 4.61%         4903                 0.18%       2,104                 0.08%
WI              4,210,000         188,067                 4.47%         4840                 0.11%       1,386                 0.03%
                                                 Northern Rocky Mountains wolf states
ID              3,020,000          88,961                 2.95%         3,953                0.13%       1,347                 0.04%
MT              3,995,000          80,731                 2.02%         7,269                0.18%         906                 0.02%
OR              1,780,000          53,524                 3.00%         7,528                0.42%       1,415                 0.08%
WA              1,423,000          42,752                 3.00%         1,280                0.09%         110                 0.01%
WY              1,880,000          35,671                 1.90%         3,401                0.18%         581                 0.03%
                                                 Desert Southwest Mexican wolf states
AZ              1,095,000          37,858                 3.46%         4,122                0.38%         157                 0.01%
NM              1,755,000          60,523                 3.45%         9,508                0.54%         601                 0.03%
                                                         Eastern Red wolf state
NC               940,000           24,631                 2.62%         2,369                0.25%             0               0.00%

                                                    Fig. 5b.
                                U.S. Cattle Unwanted Losses by Cause and by State
            (Unverified data, USDA-Animal and Plant Health Inspection Service, 2017 (Data year 2015))
                             Cattle losses from maladies
             Total                                              Cattle losses from all predators       Cattle losses from wolves
                          (illness, birthing problems, etc.)
           unwanted
States                                    Percent of total                     Percent of total                    Percent of total
             cattle
             losses       Number          unwanted cattle       Number        unwanted cattle        Number        unwanted cattle
                                               losses                              losses                              losses
                                                         Great Lakes wolf states
MI            67,003         66,002                   98.51%       1001                     1.49%        350                   0.52%
MN           129,923       125,020                    96.23%       4903                     3.77%      2,104                   1.62%
WI           192,907       188,067                    97.49%       4840                     2.51%      1,386                   0.72%
                                                Northern Rocky Mountains wolf states
ID            92,914         88,961                   95.75%      3,953                     4.25%      1,347                   1.45%
MT            88,000         80,729                   91.74%      7,269                     8.26%        906                   1.03%
OR            61,052         53,524                   87.67%      7,528                   12.33%       1,415                   2.32%
WA            44,032         42,752                   97.09%      1,280                     2.91%        110                   0.25%
WY            39,072         35,671                   91.30%      3,401                     8.70%        581                   1.49%
                                                 Desert Southwest Mexican wolf states
AZ            41,980         37,858                   90.18%      4,122                     9.82%       157                    0.37%
NM            70,031         60,523                   86.42%      9,508                   13.58%        601                    0.86%
                                                         Eastern Red wolf state
NC            27,000         24,631                   91.23%      2,369                     8.77%          0                   0.00%

  •      The USDA failed to use verified cattle and sheep loss data—that is, they largely relied on growers to tell them
         how their domestic animals died without confirmation by USDA representatives. Therefore, some cattle or
         sheep losses here attributed to wolves, coyotes, and bears are likely either inflated or misidentified. For example,
         in its cattle loss report, the USDA reported that growers lost cattle to grizzly bears in six states where grizzly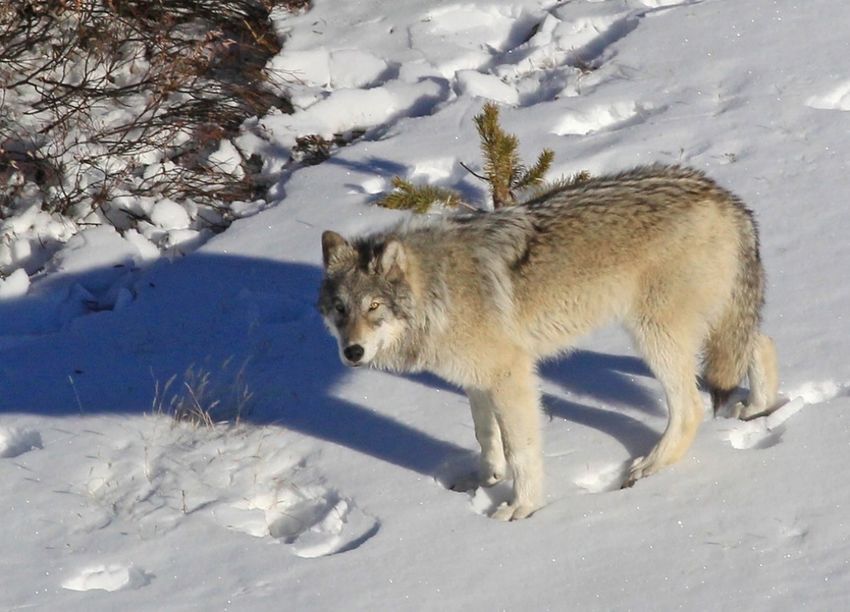
7

         bears are absent or never occurred historically. The USDA reported cattle losses to grizzly bears in Arkansas,
         Colorado, Georgia, Nevada, Oregon, and Wisconsin.8 This indicates the extent to which the USDA’s data are
         unverified and therefore, flawed—perhaps even inflated.

                                                     Fig. 6a.
                                U.S. Sheep Inventory Losses by Cause and by State
            (Unverified data, USDA-Animal and Plant Health Inspection Service, 2017 (Data year 2015))
                           Sheep losses from maladies            Sheep losses from all
                                                                                               Sheep losses from wolves
             Sheep      (illness, birthing problems, etc.)            predators
States
           inventory                   Percent of sheep                   Percent of sheep                Percent of sheep
                        Number                                Number                         Number
                                           inventory                         inventory                       inventory
                                                     Great Lakes wolf states
MI           105,000         9,011                  8.58%           906              0.86%          0                 0.00%
MN           205,000       22,127                  10.79%         1,827              0.89%         39                 0.02%
WI           123,000       10,046                   8.16%           890              0.72%          0                 0.00%
                                             Northern Rocky Mountains wolf states
ID           342,000       11,437                   3.34%         4,486              1.31%        277                 0.08%
MT           361,000        18707                   5.18%       10,171               2.27%        115                 0.03%
OR           246,000         9,329                  3.79%         5,594              2.50%          0                 0.00%
WA            77,000         4,256                  5.53%           647              0.84%        136                 0.18%
WY           461,000       10,147                   2.20%         8,862              1.92%         61                 0.01%
                                              Desert Southwest Mexican wolf states
AZ           136,000         6,352                  4.67%         5,611              4.13%        374                 0.28%
NM           109,000         8,227                  7.55%         4,664              4.28%          0                 0.00%
                                                      Eastern Red wolf state
NC             40,000        2,945                  6.24%         1,182              2.96%            0               0.00%

                                                                                                          PHOTO BY: JOS BAKKER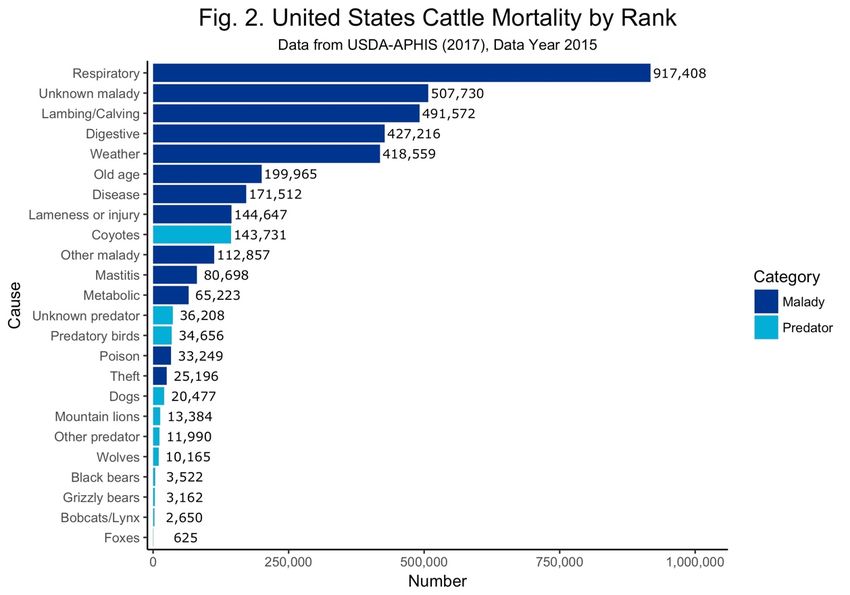
8

                                                    Fig. 6b.
                                U.S. Sheep Unwanted Losses by Cause and by State
            (Unverified data, USDA-Animal and Plant Health Inspection Service, 2017 (Data year 2015))
            Total        Sheep losses from maladies
                                                           Sheep losses from all predators      Sheep losses from wolves
          unwanted    (illness, birthing problems, etc.)
 States
            sheep                  Percent of total                    Percent of total                  Percent of total
            losses   Number                              Number                              Number
                                unwanted sheep losses              unwanted Sheep losses              unwanted sheep losses
                                                    Great Lakes wolf states
 MI          9,917     9,011                   90.86%         906                    9.14%        0                   0.00%
 MN         23,954    22,127                   92.37%       1,827                    7.63%       39                   0.16%
 WI         10,936    10,046                   91.86%         890                    8.14%        0                   0.00%
                                           Northern Rocky Mountains wolf states
 ID         15,923    11,437                   71.83%       4,486                  28.17%       277                   1.74%
 MT         28,878    18,707                   64.78%      10,171                  35.22%       115                   0.40%
 OR         14,923     9,329                   62.51%       5,594                  37.49%         0                   0.00%
 WA          4,903     4,256                   86.80%         647                  13.20%       136                   2.77%
 WY         19,009    10,147                   53.38%       8,862                  46.62%        61                   0.32%
                                           Desert Southwest Mexican wolf states
 AZ         11,963      6,352                  53.10%       5,611                  46.90%       374                   3.13%
 NM         12,891      8,227                  63.82%       4,664                  36.18%         0                   0.00%
                                                    Eastern Red wolf state
 NC          4,127      2,945                  71.36%       1,182                  28.64%         0                   0.00%

IV. USDA unverified losses data for cattle and sheep losses, ranked

Based on data from other governmental agencies, the USDA exaggerates the cattle and sheep losses it attributes to native
carnivores and dogs. Also, the USDA reports attribute wolf and grizzly bear deaths in states where neither species exists.
Given that these data are exaggerated, there is value in showing the USDA’s cattle and sheep loss numbers in rank order
to demystify predator events on cattle and sheep. We show unwanted losses to cattle and sheep in each wolf-occupied
state by region: Great Lakes, Northern Rocky Mountains and Desert Southwest. The data clearly show that health and
weather problems are the biggest concerns livestock growers face.

                                                                                                          ALAMY STOCK PHOTO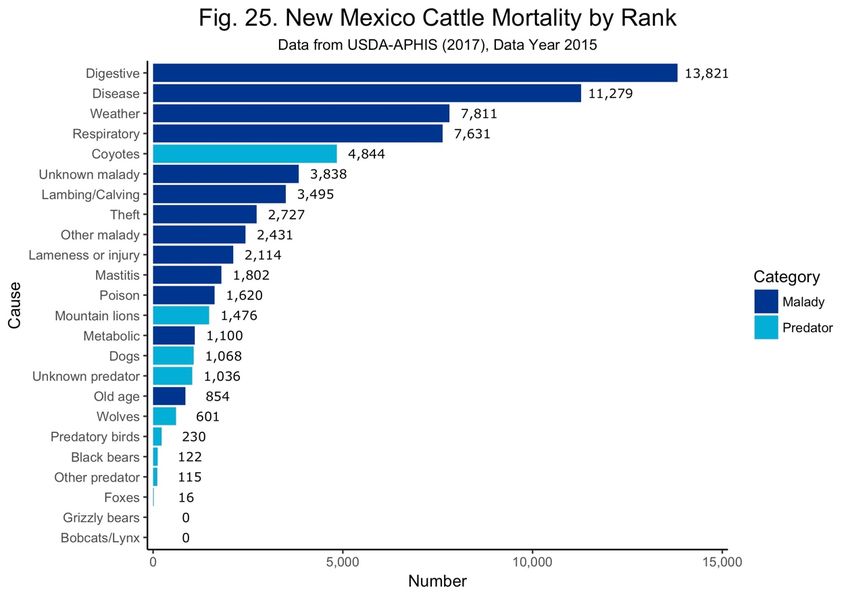
9

A. Great Lakes cattle and sheep losses by rank
10
11
12

B. Northern Rocky Mountains cattle and sheep losses by rank
13
14
15
16
17

C. Desert Southwest losses to cattle and sheep by rank
18
19

V. Great Lakes states’ cattle data show that wolves have a minimal and decreasing effect on livestock

In the Great Lakes states, as the wolf population increases, livestock losses have declined. That is because under federal
Endangered Species Act protections, wolves’ social structures are maintained. That is, with the alpha pair (the parents)
in place, other pack members are behaviorally sterile, leading to fewer breeders.9 In stable (un-persecuted) packs, the
pups and yearling animals are cared for by the entire pack and not fending for themselves.10 When members of wolf
packs are killed, however, packs disband and young wolves, who are less skilled hunters, are left to hunt for food on their
own, increasing livestock losses.11

Michigan: Michigan Department of Natural
Resources (DNR) records for January to
November 2018 show one livestock animal
was confirmed as killed by wolves in the
state’s Upper Peninsula (U.P.), the region
where almost all of the state’s wolves live.
This region has approximately 900 working
farms, with about 50,000 head of
cattle. Thus, wolf-caused livestock mortality
in the U.P.       only amounted to 0.002
percent of U.P. livestock inventory as of
November, 2018.

Minnesota: The Minnesota Department of
Natural Resources does not publish statistics
on its annual livestock losses to wolves, but                                                      PHOTO BY: DON GETTY
in 2015, the same year that the USDA
reported 2,104 cattle losses due to wolves in Minnesota, USDA-Wildlife Services received only 220 complaints of wolf
conflicts with domestic animals, of which 115 were verified.12 More recently, in October 2017, a USDA-Wildlife Services
representative said that although the state’s wolf population continues to recover, there has not been a concurrent
increase in complaints about wolf attacks on livestock. He added that while Minnesota’s 10-year average for wolf
conflicts with livestock is about 175 complaints a year, those complaints numbered only 157 in 2016, and 2017
complaints were predicted to also be below average.13 According to USDA-Wildlife Services data, losses were below
average in 2017, with the agency verifying just 89 of the 152 complaints they received.14 Despite such a low number of
verified complaints, 190 wolves were killed by USDA-Wildlife Services personnel in Minnesota that same year.15

Wisconsin: Wisconsin has 24,300 dairy and beef cattle farms, with 1.5 million head of cattle.16 Wolves exist throughout
the state where cattle are raised. But Wisconsin Department of Natural Resources statistics show that even as the state’s
wolf population recovered from hunting, trapping, and hounding between 2012 and 2014, there was no rise in confirmed
wolf attacks on livestock concurrent with that increase in wolf numbers, as illustrated in Fig. 27.

The FWS, in its 2014 Great Lakes wolves report, wrote:

        Actions to control wolf depredation of domestic animals occurred in Minnesota, Michigan and
        Wisconsin. In Michigan between the effective date of delisting, January 27, 2012, and June 30, 2013, 50
        depredation incidents were recorded and 26 wolves were killed (Michigan DNR, in litt.). During the
        same time period in Wisconsin, 66 livestock and 10 non-livestock depredation incidents were recorded
        and in response, 84 wolves were killed – 64 of those were killed during the April 2012 to April 2013
        timeframe, as reported above for Wisconsin (MacFarland and Wiedenhoeft 2013). During the 2013-2014
        “April to April” reporting period, 66 wolves were killed in Wisconsin for depredation control
        (Wiedenhoeft et al. 2014). In Minnesota, verified complaints of wolf depredation dropped from 122 in
        2012 to 70 in 2013 (Minnesota DNR, unpubl. data 2014). Numbers of wolves killed for depredation
        control also fell – from a record high number of 295 in 2012 to 127 in 2013.17
20
Fig. 27
Wisconsin DNR Data: Confirmed or suspected wolf attacks on livestock
1200
1000 956
866
809
800 746
660
600
400
200
37 24 48 40 32
0
2013 2014 2015 2016 2017
Wolf Population Livestock Incidents
These data show that the number of wolves killed nationwide are not proportional with the nominal losses of livestock
caused by wolves. Livestock losses can be reduced through non-lethal controls, but only a fraction of livestock growers
use them. Based on the USDA’s data, only an average of 18 percent of cattle growers and 20 percent of sheep growers
in wolf-occupied states use non-lethal methods to protect their animals. (See Section IX, Figs. 29 and 30.)
VI. FWS’s verified wolf-livestock data from the Northern Rocky Mountain states show that USDA
numbers are highly inflated
When governmental agencies confirm data on livestock losses, the Fig. 28.
results show many fewer livestock losses than the USDA’s unverified Confirmed cattle and sheep losses in
claims. The verified livestock losses that the FWS provides for Northern the Northern Rocky Mountains
Rocky Mountain states in 2015 are 27 times smaller for cattle than the (Verified data, FWS et al.
USDA’s numbers: 161 (FWS) vs 4,360 (USDA). Fig. 28. And the FWS’s (data year 2015))18
2015 sheep losses are 2.7 times smaller: 218 (FWS) vs. 589 (USDA) sheep State Cattle Sheep
deaths attributed to wolves. Fig. 28. While mortalities of non-native ID 35 125
cattle and sheep were nominal, the mortalities of Rocky Mountain wolves MT 41 21
were spectacular. Total human-caused wolf mortalities for this region in WY 75 62
2015 were 694, with trophy hunters and predator control agents alone OR 3 10
killing 91 percent (632) of them.19 Washington state alone requires that WA 7 0
ranchers use a variety of non-lethal measures such as the employ of range Total 161 218
riders before they can be qualified to use lethal controls.
According to the FWS, in 2015, the total wolf mortality by state was 270 in Montana, 352 in Idaho, 62 in Wyoming, seven
in Oregon, and seven in Washington. Only 16 of these mortalities were from natural (non-human) causes for all five
states.20
VII. American values concerning predator control
Most Americans don’t support killing wolves to protect livestock, according to a new national study.21 And according to
a 2017 public attitudes study, lethal predator controls such as shooting animals from aircraft (aerial gunning), neck
snares, gassing of pups in dens, leg-hold traps and poisons are unpopular with the American public.22 Predator control
is only acceptable to the public if it removes the particular individuals who prey on livestock, damage crops or cause
economic losses.23 Unfortunately, predator control rarely works that way. Predator-control agents typically kill random
animals instead of the individual animals responsible for livestock losses.21
Another recent study indicates that when
states or the federal government engage in
lethal predator-control activities for the
purpose of killing wolves to alleviate
alleged or real livestock losses, then wolf-
poaching activities increase.24 This is
because community members perceive that
wolves have little value. Conversely, if no
state-sponsored predator control is
conducted, fewer people poach wolves, the
opposite of what some surmise to be true.25
VIII. Predator control of wolves
likely exacerbates livestock conflicts
Wolf packs who are hunted experience high
stress levels, studies show.26 Stress
increases wolves’ reproductive hormones, PHOTO BY D. STAHLER/NPS
but, depending on the level of persecution wolves face, they may not have the ability to overcome their losses even with
increased breeding in the face of relentless human persecution.27 When wolves experience social disruption, packs
disband, and the elimination of the breeding pair can lead to the loss of pups and yearling wolves from starvation.28
Killing wolves can lead to greater livestock losses than if packs are left intact.29 Bryan et al. (2014) write: “{The] [h]unting
[of wolves] can decrease pack size, which results in altered predation patterns, increased time spent defending kill sites
from scavengers, and may lead to increased conflict with humans and livestock (Hayes et al. 2000; Wydeven et al. 2004;
Zimmerman 2014).”30 Killing wolves may shift livestock losses from cattle to sheep because of mesopredator release
(coyotes).31 While biologists have argued whether hunting wolves reduces livestock losses (see: e.g., Wielgus and Peebles
(2014) Bradley et al. (2015)), subsequent studies found that killing wolves does not improve livestock safety. Wildlife
biologists reviewed a 17-year data set that involved Michigan wolves and livestock losses. They discovered that the lethal
removal of wolves for livestock protection reasons on one farm, increased future wolf predation on their neighbors’
livestock.32 Killing wolves on one farm increased future predation risks by nine and 14 percent per year at local scales.33
Studies show, government and individuals’ random killing of wolves (predator control) does little to protect livestock.34
A Montana study also indicates that the trophy hunting of wolves does little-to-nothing to protect livestock.35
IX. Non-lethal methods to protect cattle and sheep are more cost-effective, less cruel and more
efficacious
Not only is the public’s view of predator control generally negative, but a bevy of studies also contradict the claimed
efficacy of lethal predator control programs. Numerous wildlife biologists have declared these programs biologically and
fiscally expensive.36 That is, removing native carnivores through predator control harms wildlife and their ecosystems.37
Predator control is also expensive to taxpayers—Wildlife Services receives tax money from municipalities, counties,
states and federal appropriations.38 New studies also show that non-lethal measures are the best means for protecting
cattle, sheep and other domestic animals. Such methods include sanitary carcass removal, fladry and or turbo fladry,
synchronizing birthing seasons with native ungulates, changing livestock types or breeds, spot lights, airhorns, guard
animals, range riders, electric fencing and FoxlightsTM.39
In a seven-year study of open-range sheep in Idaho, in an area where a variety of non-lethal deterrents were used
(including human herders or “range riders”), sheep losses were the lowest in the state. Whereas in the nearby study’s
control area where wolves were routinely killed, sheep losses were 3.5 times higher, demonstrating that non-lethal
deterrents were far more effective than lethal ones, contrary to common misperceptions.40 Despite the benefits of non-
lethal methods, the USDA’s data show that few farmers and ranchers use them to protect their herds. Only an average
of 18 percent of cattle growers and about 20 percent of sheep growers in wolf-occupied states used all the non-lethal22
methods available to them to protect their animals. Figs. 29 and 30. That is tragic, given the new science questioning
lethal predator controls.
According to biologists, Treves et al. (2016), the published studies that laud the effectiveness of lethal predator control
are concentrated in three or four journals, and the scientific methods involved in these studies was insufficient.41 A
subsequent study by Eklund et al. (2017) located 27,781 articles concerning predator control; of that number, only 562
met the authors’ criteria for having some scientific merit.42 And, of those 562 articles, only 21 used scientific
methodologies the authors deemed excellent, a number so insufficient that it prevented authors from conducting a
meta-analysis of the efficacy of predator control.43
Eklund et al. (2017) writes that although the loss of livestock to predators has occurred for thousands of years—likely
since livestock were first domesticated—the scientific study of successful interventions is rare, and unfortunately our
understanding of the efficacy of predator control is “based on narrative review” rather than sound science.44 In fact,
Treves et al. (2016) strongly suggest that all lethal predator controls should be suspended until “gold standard” reviews
of the efficacy of some predator-control methods are completed.45 Eklund et al. (2017) similarly concluded that the
science of predator control is vacuous. In yet a third review article concerning predator control, Lennox et al. (2018),
also recommend against the expensive, broadscale killing of native carnivores, and call upon us all to adapt to and coexist
with carnivores because of their ecological benefits—even in urban areas.46
PHOTO BY D. STAHLER/NPS23
Fig. 29
Percentage of Cattle Operators Using Non-Lethal Methods (USDA 2017, data year 2015)
Percent of operations with any cattle Percent of operations that used some non-lethal method to
State
deaths protect cattle
AZ 13.8% 10.4%
ID 6.1% 10.1%
MI 2.5% 20.7%
MN 4.5% 12.6%
MT 10.6% 14.5%
NM 15.9% 34.4%
NC 5.7% 22.8%
OR 5.9% 23.4%
WA 2.9% 19.9%
WI 3.9% 11%
WY 10.30% 14%
Fig. 30
Percentage of sheep operators using non-lethal methods (USDA 2015, data year 2014)
Altered
Guard Lamb Night Fright Remove Change Frequent
State Llamas Donkeys Fences Herding Cull breeding Other
Dogs shed penning tactics carrion bedding checks
season
AZ 71.9% 4.3% 0.0% 17.6% 27.4% 86.7% 72.2% 0.1% 10.6% 19.4% 22.1% 19.7% 7.6% 2.9%
ID 46.9% 11.3% 22.3% 52.3% 28.4% 4.1% 25.1% 1.4% 8.0% 23.4% 3.7% 19.1% 1.6% 0.9%
MI 38.4% 15.0% 5.1% 66.2% 46.2% 7.2% 34.0% 0.5% 16.9% 13.9% 29.4% 35.7% 7.6% 7.0%
MN 30.9% 7.0% 12.5% 63.4% 56.5% 4.8% 28.4% 3.2% 17.5% 21.9% 8.4% 12.7% 3.1% 2.1%
MT 38.9% 24.0% 9.3% 37.2% 49.0% 7.9% 48.0% 6.5% 24.5% 23.4% 12.2% 34.5% 0.6% 9.3%
NC 42.6% 9.0% 3.4% 33.6% 34.8% 5.1% 43.1% 3.9% 8.8% 22.8% 7.4% 9.0% 1.8% 6.8%
NM 28.9% 10.8% 22.5% 82.0% 41.7% 11.1% 20.7% 2.2% 30.3% 31.0% 29.8% 15.5% 3.0% 5.1%
OR 33.4% 14.2% 2.9% 55.2% 41.4% 10.2% 42.2% 6.0% 12.9% 19.5% 6.1% 14.2% 7.5% 4.7%
WA 41.2% 0.9% 22.3% 41.7% 23.5% 5.7% 21.1% 0.6% 3.3% 6.8% 0.8% 9.5% 0.0% 11.0%
WI 26.7% 16.2% 11.1% 57.4% 45.3% 5.9% 30.5% 0.6% 14.4% 17.7% 5.3% 8.6% 3.6% 3.5%
WY 42.9% 2.0% 20.1% 65.1% 26.5% 4.1% 19.7% 1.7% 6.2% 6.3% 6.6% 9.1% 1.7% 6.8%
Avg. 40.2% 10.4% 12.0% 52.0% 38.2% 13.9% 35.0% 2.4% 13.9% 18.7% 12.0% 17.1% 3.5% 5.5%
X. Conclusion
The Humane Society of the United States analyzed two data sets compiled by the USDA as part of its livestock reports.
We make these data publicly decipherable, and, more importantly, unmask the fraction of losses that livestock operators
experience from wolves, other native carnivores and domestic dogs. We found, using the USDA’s data, that native
carnivores and domestic dogs allegedly killed 0.4 percent of the 119 million cattle and sheep inventoried in the U.S. in
2014 and 2015. Furthermore, we found that other governmental data for the Great Lakes and Northern Rocky Mountain
regions indicate that the USDA’s attributions of cattle and sheep deaths by wolves and other carnivores are highly
exaggerated because of the agency’s suspect methodology.24 As this report shows, farmers, ranchers and wildlife managers should most fear maladies—especially respiratory and birthing problems—that kill nine times more cattle and sheep than all predators (wild mammalian and avian carnivores and domestic dogs) combined. In the face of this evidence, the anxiety of some in society against native carnivores is misplaced. While wildlife managers and cattle and sheep ranchers are quick to kill wolves, coyotes, bears, cougars and bobcats allegedly for livestock protection reasons, the data show that few livestock growers use non-lethal measures to protect their herds from predation. In wolf-occupied states, according to the USDA’s data, on average, less than 20 percent of cattle or sheep growers used some form of non-lethal method. Wildlife biologists have found that predator-control programs to kill wolves and other native carnivores are unscientific, because most studies advocating predator control do not adhere to the scientific method, including the lack of study control areas for purposes of comparison. Three review articles, published in 2017 and 2018, reviewed the corpus of predator-control studies. All concluded that the use of non-lethal methods to protect livestock was more efficacious than killing native carnivores. While some in society complain about wolves and other carnivores, the reality is, we humans, are an unsustainable “super predator.”47 Because wolves live in a fraction of their historical range, it is time that we stop conducting lethal predator control and trophy hunting practices on wolves in the guise of livestock protection. XI. Methodology Methods: All data wrangling and analyses were conducted in R v. 3.5.0 (R Core Team, 2018). We used the R package tabulizer (Leeper, 2018) to extract tables from the 2017 USDA report "Death Loss in U.S. Cattle and Calves Due to Predator and Nonpredator Causes, 2015" (1) and the 2015 USDA report "Sheep and Lamb Predator and Nonpredator Death Loss in the United States, 2015" (2). Once extracted, data were combined, summarized, and plotted using R packages dplyr (Wickham et al. 2018), tidyr (Wickham & Henry, 2018), ggplot2 (Wickham, 2016), and extrafont (Chang, 2014). Data used from each report: (1) From the 2017 USDA cattle report, we used data from the following tables: B.1. Number and percentage of cattle over 500 lbs. on Jan. 1, 2016, and calf crop (2015), by state, A.2.d. Number of cattle over 500 lbs. who died in 2015, by cause and by state, A.2.e. Number of calves who died in 2015, by cause and by State, A.2.h. Percentage of operations with any calf deaths due to nonpredator, predator and all causes, by state, A.2.j. Cattle death loss due to nonpredator, predator and all causes, as a percentage of inventory of cattle 500 lb. or more on Jan. 1, 2016, by state, A.2.k. Calf death loss due to nonpredator, predator and all causes, as a percentage of calf crop (2015), by state, C.1.g. Percentage of cattle deaths due to nonpredator causes, by cause and by state, C.2.f. Percentage of calf death loss due to nonpredator causes, by cause and by state, D.1.a. For all operations, number and percentage of cattle death loss due to predators, by predator, D.1.c. Percentage of cattle death loss due to predators, by state and by predator, D.2.d. Percentage of calf death loss due to predators, by state and by predator. (2) From the 2015 sheep report, we used data from the following tables: B.1. Number of ewes, rams, market sheep and lamb crop, by state, A.2.a. Number of sheep and lambs that died, by State PHOTO BY: DON GETTY and by cause, A.2.d. Percentage of Jan. 1, 2015, adult-sheep inventory lost in 2014, as a percentage of adult-sheep inventory on January 1, 2015, by cause
25

and by state, B.8. Number of sheep and lambs who died due to enterotoxemia, internal parasites or other digestive
problems in 2014, by state, B.9. Number of sheep and lambs who died due to respiratory problems, metabolic problems
or other disease problems in 2014, by state, B.10. Number of sheep and lambs who died due to weather-related problems,
starvation or lambing problems in 2014, by state, B.11. Number of sheep and lambs who died due to old age, being on
back or poisoning in 2014, by state, B.12. Number of sheep and lambs who died due to theft, other nonpredator causes,
were found dead or died from unknown nonpredator causes in 2014, by state, C.8. Number of sheep and lambs who died
by bears, bobcats or lynx, coyotes or dogs, by state, C.9. Number of sheep and lambs who died by mountain lions
(cougars/pumas), wolves or vultures, by state, C.10. Number of sheep and lambs who died by ravens, feral pigs, eagles,
other known predator causes or other unknown predator causes, by state.

Endnotes

1
  USDA-Animal and Plant Health Inspection Service, "Death Loss in U.S. Cattle and Calves Due to Predator and Nonpredator
Causes, 2015," https://www.aphis.usda.gov/animal_health/nahms/general/downloads/cattle_calves_deathloss_2015.pdf (2017);
USDA-Animal and Plant Health Inspection Service, "Sheep and Lamb Predator and Non-Predator Death Loss in the United
States," https://www.aphis.usda.gov/animal_health/nahms/sheep/downloads/sheepdeath/SheepDeathLoss2015.pdf (2015).
2
  In their cattle report, the USDA explains its methodology as follows: “The numbers provided in this report are based on a sample
of operations and are thus estimates of the true numbers. There is variability associated with each estimate, although the
measures of variability (such as the standard error) are not always shown” (emphasis added). USDA-Animal and Plant Health
Inspection Service, "Death Loss in U.S. Cattle and Calves Due to Predator and Nonpredator Causes, 2015," ii.
In their sheep report, the USDA explains its methodology here: “For 2015, death losses by cause were estimated to match NASS’
total death losses published in “Sheep and Goats,” released January 30, 2015. Estimates were generated with SUDAAN® software
(Research Triangle Institute, version 11.0.1). Standard errors, where shown, account for the stratified study design....“The number
of operations with sheep in 2014 (table A.2.a) was estimated using the number of operations in the sample, weighted by the
expansion weight (the number of operations in the population that each sampled operation represents). Similarly, the total
number of deaths are estimated by expanding the number of deaths in the sampled operations. For lamb losses, pre- and
postdocking losses are captured separately for CO, MT, UT, and WY, while all other Western States count only postdocking
losses. The lamb loss estimates in this report are estimated by expanding the postdocking losses for sampled operations in
Western States and all losses for sampled operations in Eastern States.” USDA-Animal and Plant Health Inspection Service,
"Sheep and Lamb Predator and Non-Predator Death Loss in the United States."
3
  U.S. Department of Agriculture-Animal and Plant Health Inspection Service-Veterinary Services, "Death Loss in U.S. Cattle and
Calves Due to Predator and Nonpredator Causes, 2015,"
https://www.aphis.usda.gov/animal_health/nahms/general/downloads/cattle_calves_deathloss_2015.pdf (2017); U.S. Department
of Agriculture-Animal and Plant Health Inspection Service, "Sheep and Lamb Predator and Nonpredator Death Loss in the United
States," http://usda.mannlib.cornell.edu/usda/current/sgdl/sgdl-05-27-2010.pdf (2015).
4
  USDA-Animal and Plant Health Inspection Service, "Death Loss in U.S. Cattle and Calves Due to Predator and Nonpredator
Causes, 2015."
5
  USDA-Animal and Plant Health Inspection Service, "Sheep and Lamb Predator and Non-Predator Death Loss in the United
States."
6
  F. F. Knowlton, E. M. Gese, and M. M. Jaeger, "Coyote Depredation Control: An Interface between Biology and Management,"
Journal of Range Management 52, no. 5 (Sep 1999), ://000082837300001; Philip J. Baker et al., "Terrestrial Carnivores
and Human Food Production: Impact and Management," Mammal Review 38 (2008); S. M. Wilson, E. H. Bradley, and G. A.
Neudecker, "Learning to Live with Wolves: Community-Based Conservation in the Blackfoot Valley of Montana," Human-Wildlife
Interactions 11, no. 3 (Win 2017), ://WOS:000422844800010; Seth M. Wilson et al., "Natural Landscape Features,
Human-Related Attractants, and Conflict Hotspots: A Spatial Analysis of Human–Grizzly Bear Conflicts," Ursus 16, no. 1
(2005/04/01 2005), accessed 2017/04/28, http://dx.doi.org/10.2192/1537-6176(2005)016[0117:NLFHAA]2.0.CO;2; Seth M. Wilson,
Gregory A. Neudecker, and James J. Jonkel, "Human-Grizzly Bear Coexistence in the Blackfoot River Watershed, Montana:
Getting Ahead of the Conflict Curve," in Large Carnivore Conservation: Integrating Science and Policy in the North American
West, ed. S.G. Clark and M.B. Rutherford (2014).
7
  Susan Montoya Brian, "Record Number of Mexican Gray Wolves Found Dead in 2018," Albuquerque Journal2018.
26

8
  USDA-Animal and Plant Health Inspection Service, "Death Loss in U.S. Cattle and Calves Due to Predator and Nonpredator
Causes, 2015."
9
  Heather M. Bryan et al., "Heavily Hunted Wolves Have Higher Stress and Reproductive Steroids Than Wolves with Lower
Hunting Pressure," Functional Ecology (2014), http://dx.doi.org/10.1111/1365-2435.12354; J. H. Schmidt, J. W. Burch, and M. C.
MacCluskie, "Effects of Control on the Dynamics of an Adjacent Protected Wolf Population in Interior Alaska," Wildlife
Monographs 198, no. 1 (Jul 2017), ://WOS:000404130600001.
10
   Bryan et al; Schmidt, Burch, and MacCluskie.
11
   RB Wielgus and KA Peebles, "Effects of Wolf Mortality on Livestock Depredations," PLOS ONE 9, no. 12 (2014); K. A. Peebles
et al., "Effects of Remedial Sport Hunting on Cougar Complaints and Livestock Depredations," PLOS ONE 8 (2013),
http://dx.doi.org/10.1371/journal.pone.0079713; Kristine J. Teichman, Bogdan Cristescu, and Chris T. Darimont, "Hunting as a
Management Tool? Cougar-Human Conflict Is Positively Related to Trophy Hunting," Bmc Ecology 16, no. 1 (2016),
http://dx.doi.org/10.1186/s12898-016-0098-4; Bryan et al; Schmidt, Burch, and MacCluskie; S. Creel et al., "Questionable Policy for
Large Carnivore Hunting," Science 350, no. 6267 (Dec 2015), http://dx.doi.org/10.1126/science.aac4768; Scott Creel and Jay
Rotella, "Meta-Analysis of Relationships between Human Offtake, Total Mortality and Population Dynamics of Gray Wolves
(Canis Lupus)," PLOS ONE 5, no. 9 (2010); A. Treves et al., "Gray Wolf Mortality Patterns in Wisconsin from 1979 to 2012,"
Journal of Mammalogy 98, no. 1 (Feb 2017), http://dx.doi.org/10.1093/jmammal/gyw145.
12
   JP Hart and DP Sahr, “USDA-Wildlife Services Wolf Damage Management in Minnesota 2017,” Unpublished handout, received
at 2018 International Wolf Symposium.
13
   “Feds extend funding to trap Minnesota wolves that prey on livestock.” Steve Karnowski, St. Paul Pioneer Press, October 19,
2017.
14
   JP Hart and DP Sahr, “USDA-Wildlife Services Wolf Damage Management in Minnesota 2017,” Unpublished handout, received
at 2018 International Wolf Symposium.
15
   Ibid.
16
   Wisconsin Milk Marketing Board at http://www.wmmb.com/assets/images/pdf/WisconsinDairyData.pdf and the University of
Wisconsin Cooperative Extension at https://fyi.uwex.edu/wbic/files/2010/01/Wheres-the-beef-2011.pdf
17
   Twin Cities Ecological Services Field Office, Western Great Lakes Distinct Population Segment of the Gray Wolf, by U.S. Fish
and Wildlife Service (https://www.fws.gov/midwest/wolf/monitoring/pdf/Year1PDMReportSept2014.pdf, 2014).
18
   Northern Rocky Mountain Wolf Recovery: Program 2015 Interagency Annual Report, by U.S. Fish and Wildlife Service et. al.
(https://www.fws.gov/mountain-prairie/es/species/mammals/wolf/2016/FINAL_NRM%20summary%20-%202015.pdf, 2016).
19
   Ibid.
20
   Ibid.
21
   Authors asked if wolves who kill livestock should be lethally removed. In all but two states, less than one-half of respondents
statewide agreed they should. National Report from the research project entitled “America’s Wildlife Values”, America’s Wildlife
Values: The Social Context of Wildlife Management in the U.S., by M. J. Manfredo et al. (Fort Collins, Colorado: Colorado State
University, Department of Natural Resources, 2018).See: question 17, p. 39.
22
   K. Slagle et al., "Attitudes toward Predator Control in the United States: 1995 and 2014," Journal of Mammalogy 98, no. 1 (Feb
2017), http://dx.doi.org/10.1093/jmammal/gyw144.
23
   Ibid.
24
   Guillaume Chapron and Adrian Treves, "Blood Does Not Buy Goodwill: Allowing Culling Increases Poaching of a Large
Carnivore," Proceedings of the Royal Society of London B: Biological Sciences 283, no. 1830 (2016-05-11 00:00:00 2016),
http://dx.doi.org/10.1098/rspb.2015.2939.
25
   Ibid.
26
   Bryan et al; Schmidt, Burch, and MacCluskie.
27
     Bryan et al; Schmidt, Burch, and MacCluskie; Creel et al; Creel and Rotella.
28
     Creel and Rotella; Bryan et al.
29
  Gordon C. Haber, "Biological, Conservation, and Ethical Implications of Exploiting and Controlling Wolves," Conservation
Biology 10, no. 4 (1996); Creel and Rotella; Creel et al; Francisco J. Santiago-Avila, Ari M. Cornman, and Adrian Treves, "Killing
Wolves to Prevent Predation on Livestock May Protect One Farm but Harm Neighbors," PLOS ONE 13, no. 1 (2018),
http://dx.doi.org/10.1371/journal.pone.0189729.
30
   See e.g., Wielgus and Peebles.
31
   B. J. Bergstrom, "Carnivore Conservation: Shifting the Paradigm from Control to Coexistence," Journal of Mammalogy 98, no. 1
(Feb 2017), http://dx.doi.org/10.1093/jmammal/gyw185.
32
   Santiago-Avila, Cornman, and Treves.
27 33 Ibid. 34 Adrian Treves, Miha Krofel, and Jeannine McManus, "Predator Control Should Not Be a Shot in the Dark," Frontiers in Ecology and the Environment 14, no. 7 (2016), http://dx.doi.org/10.1002/fee.1312. 35 Nicholas. J. DeCesare et al., "Wolf-Livestock Conflict and the Effects of Wolf Management," 82, no. 4 (2018), http://dx.doi.org/doi:10.1002/jwmg.21419. 36 Bergstrom; Treves, Krofel, and McManus; Santiago-Avila, Cornman, and Treves; A. Eklund et al., "Limited Evidence on the Effectiveness of Interventions to Reduce Livestock Predation by Large Carnivores," Scientific Reports 7 (May 2017), http://dx.doi.org/10.1038/s41598-017-02323-w; Robert J. Lennox et al., "Evaluating the Efficacy of Predator Removal in a Conflict- Prone World," Biological Conservation 224 (2018/08/01/ 2018), http://dx.doi.org/https://doi.org/10.1016/j.biocon.2018.05.003. 37 J. A. Estes et al., "Trophic Downgrading of Planet Earth," Science 333, no. 6040 (Jul 2011), http://dx.doi.org/10.1126/science.1205106; William J. Ripple et al., "Extinction Risk Is Most Acute for the World’s Largest and Smallest Vertebrates," Proceedings of the National Academy of Sciences 114, no. 40 (October 3, 2017 2017), http://dx.doi.org/10.1073/pnas.1702078114; W. J. Ripple et al., "Status and Ecological Effects of the World's Largest Carnivores," Science 343, no. 6167 (Jan 2014), http://dx.doi.org/10.1126/science.1241484; Chris T. Darimont et al., "The Unique Ecology of Human Predators," Science 349, no. 6250 (2015). 38 The Humane Society of the United States, "Wildlife Disservice: The Usda Wildlife Services' Inefficient and Inhumane Wildlife Damage Management Program," http://www.humanesociety.org/assets/pdfs/wildlife/wildlife-services-white-paper-2015.pdf (2015). 39 William F. Andelt, "Carnivores," in Rangeland Wildlife, ed. P. R. Krausman (Denver: Society for Range Management, 1996); A. Treves and K. U. Karanth, "Human-Carnivore Conflict and Perspectives on Carnivore Management Worldwide," Conservation Biology 17, no. 6 (Dec 2003), ://000186869700009 ; Eklund et al; S. A. Stone et al., "Adaptive Use of Nonlethal Strategies for Minimizing Wolf-Sheep Conflict in Idaho," Journal of Mammalogy 98, no. 1 (Feb 2017), http://dx.doi.org/10.1093/jmammal/gyw188; M. Parks and T. Messmer, "Participant Perceptions of Range Rider Programs Operating to Mitigate Wolf-Livestock Conflicts in the Western United States," Wildlife Society Bulletin 40, no. 3 (Sep 2016), http://dx.doi.org/10.1002/wsb.671. 40 Stone et al. 41 Treves, Krofel, and McManus. 42 Eklund et al. 43 Ibid. 44 Ibid., 2. 45 Treves, Krofel, and McManus. 46 Lennox et al. 47 Darimont et al.
References

Andelt, William F. "Carnivores." In Rangeland Wildlife, edited by P. R. Krausman, 133-55. Denver: Society for Range Management,
        1996.

Baker, Philip J., Boitani Luigi, Stephen Harris, Glen Saunders, and Piran C.L. White. "Terrestrial Carnivores and Human Food
        Production: Impact and Management." Mammal Review 38 (2008): 123-66.

Bergstrom, B. J. "Carnivore Conservation: Shifting the Paradigm from Control to Coexistence." Journal of Mammalogy 98, no. 1
        (Feb 2017): 1-6. http://dx.doi.org/10.1093/jmammal/gyw185.

Bryan, Heather M., Judit E.G. Smits, Lee Koren, Paul C. Paquet, Katherine E. Wynne-Edwards, and Marco Musiani. "Heavily
        Hunted Wolves Have Higher Stress and Reproductive Steroids Than Wolves with Lower Hunting Pressure." Functional
        Ecology (2014): 1-10. http://dx.doi.org/10.1111/1365-2435.12354.

Chapron, Guillaume and Adrian Treves. "Blood Does Not Buy Goodwill: Allowing Culling Increases Poaching of a Large
       Carnivore." Proceedings of the Royal Society of London B: Biological Sciences 283, no. 1830 (2016-05-11 00:00:00 2016).
       http://dx.doi.org/10.1098/rspb.2015.2939.

Creel, S., M. Becker, D. Christianson, E. Droge, N. Hammerschlag, M. W. Hayward, U. Karanth, A. Loveridge, D. W. Macdonald, W.
          Matandiko, J. M'Soka, D. Murray, E. Rosenblatt, and P. Schuette. "Questionable Policy for Large Carnivore Hunting."
          Science 350, no. 6267 (Dec 2015): 1473-75. http://dx.doi.org/10.1126/science.aac4768.

Creel, Scott and Jay Rotella. "Meta-Analysis of Relationships between Human Offtake, Total Mortality and Population Dynamics
         of Gray Wolves (Canis Lupus)." PLOS ONE 5, no. 9 (2010).

Darimont, Chris T., Caroline H. Fox, Heather M. Bryan, and Thomas E. Reimchen. "The Unique Ecology of Human Predators."
       Science 349, no. 6250 (2015): 858-60.

DeCesare, Nicholas. J., Seth M. Wilson, Elizabeth H. Bradley, Justin A. Gude, Robert M. Inman, Nathan J. Lance, Kent Laudon,
       Abigail A. Nelson, Michael S. Ross, and Ty D. Smucker. "Wolf-Livestock Conflict and the Effects of Wolf Management."
       82, no. 4 (2018): 711-22. http://dx.doi.org/doi:10.1002/jwmg.21419.

Eklund, A., J. V. Lopez-Bao, M. Tourani, G. Chapron, and J. Frank. "Limited Evidence on the Effectiveness of Interventions to
        Reduce Livestock Predation by Large Carnivores." Scientific Reports 7 (May 2017). http://dx.doi.org/10.1038/s41598-017-
        02323-w.

Estes, J. A., J. Terborgh, J. S. Brashares, M. E. Power, J. Berger, W. J. Bond, S. R. Carpenter, T. E. Essington, R. D. Holt, J. B. C.
          Jackson, R. J. Marquis, L. Oksanen, T. Oksanen, R. T. Paine, E. K. Pikitch, W. J. Ripple, S. A. Sandin, M. Scheffer, T. W.
          Schoener, J. B. Shurin, A. R. E. Sinclair, M. E. Soule, R. Virtanen, and D. A. Wardle. "Trophic Downgrading of Planet
          Earth." Science 333, no. 6040 (Jul 2011): 301-06. http://dx.doi.org/10.1126/science.1205106.

Haber, Gordon C. "Biological, Conservation, and Ethical Implications of Exploiting and Controlling Wolves." Conservation
        Biology 10, no. 4 (1996): 1068-81.

Knowlton, F. F., E. M. Gese, and M. M. Jaeger. "Coyote Depredation Control: An Interface between Biology and Management."
       Journal of Range Management 52, no. 5 (Sep 1999): 398-412. ://000082837300001.

Lennox, Robert J., Austin J. Gallagher, Euan G. Ritchie, and Steven J. Cooke. "Evaluating the Efficacy of Predator Removal in a
        Conflict-Prone World." Biological Conservation 224 (2018/08/01/ 2018): 277-89.
        http://dx.doi.org/https://doi.org/10.1016/j.biocon.2018.05.003.

National Report from the research project entitled “America’s Wildlife Values”. America’s Wildlife Values: The Social Context of
        Wildlife Management in the U.S., by Manfredo, M. J., L. Sullivan, A.W. Don Carlos, A. M. Dietsch, T. L. Teel, A.D. Bright,
        and J. Bruskotter, 2018.

Montoya Brian, Susan. "Record Number of Mexican Gray Wolves Found Dead in 2018." Albuquerque Journal2018.

Parks, M. and T. Messmer. "Participant Perceptions of Range Rider Programs Operating to Mitigate Wolf-Livestock Conflicts in
        the Western United States." Wildlife Society Bulletin 40, no. 3 (Sep 2016): 514-24. http://dx.doi.org/10.1002/wsb.671.
Dated: Mar. 6, 2019
29
Peebles, K. A., R. B. Wielgus, B. T. Maletzke, and M. E. Swanson. "Effects of Remedial Sport Hunting on Cougar Complaints and
Livestock Depredations." PLOS ONE 8 (2013). http://dx.doi.org/10.1371/journal.pone.0079713.
Ripple, W. J., J. A. Estes, R. L. Beschta, C. C. Wilmers, E. G. Ritchie, M. Hebblewhite, J. Berger, B. Elmhagen, M. Letnic, M. P.
Nelson, O. J. Schmitz, D. W. Smith, A. D. Wallach, and A. J. Wirsing. "Status and Ecological Effects of the World's Largest
Carnivores." Science 343, no. 6167 (Jan 2014): 151-+. http://dx.doi.org/10.1126/science.1241484.
Ripple, William J., Christopher Wolf, Thomas M. Newsome, Michael Hoffmann, Aaron J. Wirsing, and Douglas J. McCauley.
"Extinction Risk Is Most Acute for the World’s Largest and Smallest Vertebrates." Proceedings of the National Academy
of Sciences 114, no. 40 (October 3, 2017 2017): 10678-83. http://dx.doi.org/10.1073/pnas.1702078114.
Santiago-Avila, Francisco J., Ari M. Cornman, and Adrian Treves. "Killing Wolves to Prevent Predation on Livestock May Protect
One Farm but Harm Neighbors." PLOS ONE 13, no. 1 (2018): e0189729. http://dx.doi.org/10.1371/journal.pone.0189729.
Schmidt, J. H., J. W. Burch, and M. C. MacCluskie. "Effects of Control on the Dynamics of an Adjacent Protected Wolf Population
in Interior Alaska." Wildlife Monographs 198, no. 1 (Jul 2017): 1-30. ://WOS:000404130600001.
Slagle, K., J. T. Bruskotter, A. S. Singh, and R. H. Schmidt. "Attitudes toward Predator Control in the United States: 1995 and
2014." Journal of Mammalogy 98, no. 1 (Feb 2017): 7-16. http://dx.doi.org/10.1093/jmammal/gyw144.
Stone, S. A., S. W. Breck, J. Timberlake, P. M. Haswell, F. Najera, B. S. Bean, and D. J. Thornhill. "Adaptive Use of Nonlethal
Strategies for Minimizing Wolf-Sheep Conflict in Idaho." Journal of Mammalogy 98, no. 1 (Feb 2017): 33-44.
http://dx.doi.org/10.1093/jmammal/gyw188.
Teichman, Kristine J., Bogdan Cristescu, and Chris T. Darimont. "Hunting as a Management Tool? Cougar-Human Conflict Is
Positively Related to Trophy Hunting." Bmc Ecology 16, no. 1 (2016): 44. http://dx.doi.org/10.1186/s12898-016-0098-4.
The Humane Society of the United States. "Wildlife Disservice: The USDA Wildlife Services' Inefficient and Inhumane Wildlife
Damage Management Program." http://www.humanesociety.org/assets/pdfs/wildlife/wildlife-services-white-paper-
2015.pdf (2015).
Treves, A. and K. U. Karanth. "Human-Carnivore Conflict and Perspectives on Carnivore Management Worldwide." Conservation
Biology 17, no. 6 (Dec 2003): 1491-99. ://000186869700009
Treves, A., J. A. Langenberg, J. V. Lopez-Bao, and M. F. Rabenhorst. "Gray Wolf Mortality Patterns in Wisconsin from 1979 to
2012." Journal of Mammalogy 98, no. 1 (Feb 2017): 17-32. http://dx.doi.org/10.1093/jmammal/gyw145.
Treves, Adrian, Miha Krofel, and Jeannine McManus. "Predator Control Should Not Be a Shot in the Dark." Frontiers in Ecology
and the Environment 14, no. 7 (2016): 380-88. http://dx.doi.org/10.1002/fee.1312.
U.S. Department of Agriculture-Animal and Plant Health Inspection Service. "Death Loss in U.S. Cattle and Calves Due to
Predator and Nonpredator Causes, 2015."
https://www.aphis.usda.gov/animal_health/nahms/general/downloads/cattle_calves_deathloss_2015.pdf (2017).
U.S. Department of Agriculture-Animal and Plant Health Inspection Service. "Sheep and Lamb Predator and Nonpredator Death
Loss in the United States." http://usda.mannlib.cornell.edu/usda/current/sgdl/sgdl-05-27-2010.pdf (2015).
U.S Fish and Wildlife Service. Twin Cities Ecological Services Field Office. Western Great Lakes Distinct Population Segment of
the Gray Wolf, 2014.
U.S. Fish and Wildlife Service et. al., 2016. Northern Rocky Mountain Wolf Recovery: Program 2015 Interagency Annual Report.
Wielgus, RB and KA Peebles. "Effects of Wolf Mortality on Livestock Depredations." PLOS ONE 9, no. 12 (2014): e113505.
doi:10.1371/journal.pone.0113505.
Wilson, S. M., E. H. Bradley, and G. A. Neudecker. "Learning to Live with Wolves: Community-Based Conservation in the
Blackfoot Valley of Montana." Human-Wildlife Interactions 11, no. 3 (Win 2017): 245-57. ://WOS:000422844800010.30
Wilson, Seth M., Michael J. Madel, David J. Mattson, Jonathan M. Graham, James A. Burchfield, and Jill M. Belsky. "Natural
Landscape Features, Human-Related Attractants, and Conflict Hotspots: A Spatial Analysis of Human–Grizzly Bear
Conflicts." Ursus 16, no. 1 (2005/04/01 2005): 117-29. Accessed 2017/04/28. http://dx.doi.org/10.2192/1537-
6176(2005)016[0117:NLFHAA]2.0.CO;2.
Wilson, Seth M., Gregory A. Neudecker, and James J. Jonkel. "Human-Grizzly Bear Coexistence in the Blackfoot River Watershed,
Montana: Getting Ahead of the Conflict Curve." In Large Carnivore Conservation: Integrating Science and Policy in the
North American West, edited by S.G. Clark and M.B. Rutherford, 2014.You can also read